 Open Access Article
 This Open Access Article is licensed under a
 Creative Commons Attribution 3.0 Unported Licence
Polymer patchy colloids with sticky patches†
Yi
Zhao
,
Rüdiger
Berger
,
Katharina
Landfester
and
Daniel
Crespy
*
Max Planck Institute for Polymer Research, Ackermannweg 10, 55128 Mainz, Germany. E-mail: crespy@mpip-mainz.mpg.de
First published on 12th September 2013
Abstract
Patchy particles (PPs) are considered as interesting building blocks for the fabrication of novel structures with enhanced complexity and functionality. However, their development is primarily limited by the fact that there is no reliable method to prepare PPs on a large scale. Herein, a one-pot strategy to prepare PPs relying on polymerization-induced phase separation in monomer-embedded polymer nanoparticles is demonstrated. The surface is found to be composed of sticky patches embedded in a hard matrix by adhesion and force–distance measurements performed by atomic force microscopy. The patch sizes could be easily tuned by controlling the monomer conversion or varying the composition between the polymer and the monomer. This study presents the possibility to develop a simple, low-cost and scalable method for preparing large quantities of PPs from homopolymers. It may also pave the way to new PPs for functional materials and devices.
Introduction
Patchy particles (PPs) are colloidal particles with a chemically or physically patterned surface.1–3 Janus particles can be considered as the simplest PPs with only one patch.4–6 The patchy domains may provide specific and directional interactions with other particles or surfaces and therefore PPs can self- and direct-assemble into novel suprastructures which can find applications in the delivery of drugs or other chemicals,7–9 electronic devices,10,11 photonic crystals,12,13 and sensors.14–16 Currently, the preparation of PPs mainly focuses on templating or chemical patterning,17–22 glancing angle deposition,23–25 particle lithography,26–29 capillary fluid flow,30–32 and self-assembly of pre-synthesized block copolymers.9,33–37 These approaches, however, are difficult to scale up because of demanding synthetic routes or owing to intrinsic limitations related to the preparation process, and therefore hamper the study and development of PPs. Recently, silica particles were decorated with silver or gold patches by heterogeneous nucleation of silver nitrate or a dark-aged solution of potassium carbonate and chloroauric acid.38–40 The method is scalable but limited to inorganic patches. Okubo et al. prepared polymer particles with dents on the surface by seeded emulsion polymerization41–43 and seeded dispersion polymerization.44,45 However, an effort is required to synthesize seed particles first. Seeded dispersion or emulsion polymerization was also applied to synthesize non-spherical particles due to a polymerization-induced phase separation between the original polymer and the newly formed polymer,46–48 but they are usually limited to the preparation of particles with only one patch and having large size, e.g. several micrometers. Miniemulsion polymerization is a powerful method to develop nanoparticles with different compositions and architectures.49 We previously showed that patchy nanoparticles and nanocapsules, based on poly(methyl methacrylate-block-styrene)36 or poly(methyl methacrylate-block-vinylferrocene),9 could be prepared by a combination of miniemulsion and solvent evaporation techniques. The preparation of polymer PPs in large quantities and with multiple patches by a facile and seed-free method without employing block copolymers still remains a great challenge.In this study, a monomer and an initiator were firstly embedded in nanoparticles by using the aforementioned miniemulsion–solvent evaporation technique. It was demonstrated that this technique could be executed without significant occurrence of coalescence50,51 and was found to be suitable for the encapsulation of various liquid chemicals.52–54 PPs were then easily obtained by polymerizing the monomer because polymerization could induce phase separation between the newly formed polymer and the original polymer and induced the formation of sticky patches. We describe here a simple and scalable strategy to prepare PPs with tunable patch sizes without block copolymers. Grams of PPs could be easily prepared based on bench chemistry in one day.
Experimental section
Materials
Poly(vinyl formal) (PVF, Mw ∼ 10![[thin space (1/6-em)]](https://www.rsc.org/images/entities/char_2009.gif) 000 g·mol−1, Aldrich), sodium dodecyl sulfate (SDS, 99%, Aldrich), deuterium oxide (D2O, 99.9%, Aldrich), dimethyl sulfoxide-d6 (DMSO-d6, 99.9%, Aldrich), hexadecane (HD, 99%, Merck), azobisisobutyronitrile (AIBN, 98%, Aldrich), dichloromethane (DCM, 99%, VWR), chloroform (CHCl3, 99%, VWR), 2,2-dimethoxy-2-phenylacetophenone (DMPA, 99%, Aldrich), potassium persulfate (KPS, 99.9%, Aldrich), 1,4-divinylbenzene (DVB, 99%, Aldrich) and argon (Ar, 99.99%, Westfalen AG) were used as received. Dodecyl methacrylate (DMA, 96%, Aldrich) was passed through an aluminum oxide (basic) column before use. The chemical structures of the monomers, initiators and polymers are shown in Fig. S1.†
000 g·mol−1, Aldrich), sodium dodecyl sulfate (SDS, 99%, Aldrich), deuterium oxide (D2O, 99.9%, Aldrich), dimethyl sulfoxide-d6 (DMSO-d6, 99.9%, Aldrich), hexadecane (HD, 99%, Merck), azobisisobutyronitrile (AIBN, 98%, Aldrich), dichloromethane (DCM, 99%, VWR), chloroform (CHCl3, 99%, VWR), 2,2-dimethoxy-2-phenylacetophenone (DMPA, 99%, Aldrich), potassium persulfate (KPS, 99.9%, Aldrich), 1,4-divinylbenzene (DVB, 99%, Aldrich) and argon (Ar, 99.99%, Westfalen AG) were used as received. Dodecyl methacrylate (DMA, 96%, Aldrich) was passed through an aluminum oxide (basic) column before use. The chemical structures of the monomers, initiators and polymers are shown in Fig. S1.†
Preparation of PVF–DMA nanoparticles
Solvent evaporation and miniemulsion techniques were applied to prepare PVF–DMA nanoparticles. Known amounts of PVF, DMA and initiators (see Table 1 for the details) were dissolved in 5 mL CHCl3, and stirred at 600 rpm for 20 min. Then a solution of SDS in D2O solution (10 mL × 1.0 mg mL−1) was added, followed by stirring at 1100 rpm for 1 h. The obtained emulsion was then treated with a sonifier (Branson W450D Digital, 1/2 inch tip, 90% amplitude) for 2 min (30 s pulse and 15 s pause, 4× ) in an ice-bath. The obtained miniemulsion was stirred at 40 °C overnight to evaporate CHCl3. For evaluating the evaporation speed of CHCl3, aliquots of the dispersion were taken each hour during the first experiment (entry 1 of Table 1) for 1H NMR measurements. For PVF–HD nanoparticles (entry 3 in Table 1), the same preparative procedure was adapted.| Entry | PVF [mg] | DMA [mg] | DVB [mg] | D h [nm]a |
|---|---|---|---|---|
| a Measured by DLS. b KPS as an initiator. c DMA was replaced by 100 mg hexadecane. d 2,2-dimethoxy-2-phenylacetophenone (DMPA) as an initiator. | ||||
| 1 | 250 | 250 | 0 | 240 ± 70 |
| 2b | 400 | 100 | 0 | 230 ± 90 |
| 3c | 400 | 0 | 0 | 250 ± 70 |
| 4d | 400 | 100 | 0 | 280 ± 90 |
| 5 | 450 | 50 | 0 | 225 ± 50 |
| 6 | 400 | 100 | 0 | 300 ± 105 |
| 7 | 300 | 200 | 0 | 250 ± 80 |
| 8 | 200 | 300 | 0 | 280 ± 85 |
| 9 | 100 | 400 | 0 | 350 ± 140 |
| 10 | 300 | 170 | 30 | 260 ± 70 |
| 11 | 300 | 180 | 20 | 230 ± 80 |
| 12 | 300 | 190 | 10 | 275 ± 80 |
Generation of patchy nanoparticles
The dispersion was bubbled with Ar for 10 min before heating at 72 °C. To follow the conversion of DMA, an aliquot of the dispersion was taken every 15 min for 1H NMR measurement. For all the samples with AIBN as the initiator, the polymerization was completed in 30 min (see Fig. S2†) with DMA conversions of ∼90 to 97%. The evolution of the colloidal morphologies depending on the DMA conversion measured by 1H NMR (entry 7 of Table 1) was carried out by taking aliquots of the dispersion every 5 min. At the same time, samples were taken for SEM measurements. When KPS was used as the initiator (entry 2 of Table 1), KPS was added before bubbling Ar. In the case of DMPA as the photoinitiator, the dispersion was transferred into a quartz cuvette and heated at 72 °C for 20 min under UV irradiation (Hg lamp, UV-Consulting Peschl TQ 150, cooling with water, 150 W). The distance between the lamp and cuvette was 10 cm. A control test was carried out at room temperature with the same procedure.Characterization of the polymers and particles
The hydrodynamic diameters of the particles in diluted dispersions were measured with a dynamic light scattering machine (NICOMP 380, Santa Barbara) at a fixed angle of 90° and a laser diode running at 635 nm. 1H NMR measurements were carried out on a Bruker AVANCE 300 MHz console at room temperature using DMSO-d6 as the solvent. Samples were prepared by diluting 25 μL of the dispersion in 0.55 mL DMSO-d6. The morphology of particles was observed with a Gemini 1530 (Carl Zeiss AG, Oberkochem, Germany) scanning electron microscope (SEM) running at 0.3 kV. Samples for SEM measurements were prepared by diluting 25 μL of dispersion in 3 mL distilled water, casting one drop of the diluted dispersion on a 0.5 × 0.5 cm2 silica wafer, and left to dry at room temperature. The morphology of particles was further studied by using a transmission electron microscope (TEM) (Zeiss EM912) with an accelerating voltage of 120 kV. Samples were prepared by casting one drop of diluted dispersion on a carbon-layer-coated copper grid (300 square mesh) and dried at room temperature. For ultrathin cross-sectional TEM measurement, the PPs were first stained with osmium tetroxide (OsO4) for 45 min in dispersion. After centrifugation of the dispersions, the PPs were washed with water several times. Water was gradually replaced by a graded series of ethanol (∼1 day), and then ethanol was gradually replaced by a graded series of EPON (∼1 day) at room temperature. Afterwards, the PPs were embedded in EPON and cured at 60 °C for 3 days. Ultrathin cross-sectional samples (∼60 nm) were prepared with a Leica microtome and studied on a Philips Tecnai F20 electron microscope at an operating voltage of 200 kV.Atomic force microscope (AFM) images were recorded with a commercial Bruker Dimension 3100 (NanoScope IIIa controller) setup in tapping mode. The mechanical measurements (topography, adhesion and slope) were performed with a NanoWizard 3 using the quantitative imaging mode. For this mode we used Olympus probes (OMCL AC240TS) that were calibrated first on a hard Silicon wafer. Then the spring constant was determined by thermal tuning. The topography was obtained at a setpoint of 500 pN. All images in QI-mode were recorded with 256 × 256 pixels. Samples were prepared by casting one drop of diluted dispersion on a silica wafer and dried at room temperature.
The glass transition temperatures (Tg) for the PVF and the PVF–DMA mixture were measured on a differential scanning calorimetric (DSC) machine (Mettler Toledo DSC 823) operating at a heating rate of 10 °C min−1 under N2. The PVF–DMA blend was prepared by mixing 400 mg PVF and 100 mg DMA in 5 mL dichloromethane (DCM), and then evaporating DCM at room temperature. A powder of PPs was obtained by freeze-drying, and then annealed at 120 °C for 24 h. A sample without annealing was also prepared as control experiment. The Tg values were evaluated as the midpoint of the change in heat capacity.
Results and discussion
A monomer (dodecyl methacrylate, DMA) and an initiator (AIBN, azobisisobutyronitrile) for radical polymerization were first embedded in polymer (PVF, poly(vinyl formal)) nanoparticles by a miniemulsion–solvent evaporation process. PVF and DMA were chosen as the polymer/monomer pair, because PVF has a glass transition temperature (Tg) of ∼105 °C,55 which is beneficial to lock the formed structures at room temperature while PDMA has a Tg of ∼−48 °C,56 which is helpful to increase the mobility of PDMA chains during the polymerization and therefore accelerate the phase separation. Unless otherwise stated, chloroform (CHCl3) was applied as a good solvent to dissolve PVF and DMA and sodium dodecyl sulfate (SDS) was used to stabilize the particles. 1H NMR spectroscopy was carried out to follow the evaporation of CHCl3 from the droplets/nanoparticles. It was found that 10 h were necessary under the experimental conditions to completely remove CHCl3 from the dispersions (Fig. 1a). In our study, the evaporation time was fixed to 15 h to ensure complete removal of CHCl3 before polymerization. Indeed, CHCl3 is a good solvent for both PVF and PDMA and it is therefore necessary to remove it in order to allow phase separation in the droplets. The polymerization of DMA was followed by 1H NMR. The disappearance of peaks at 5.66 and 6.0 ppm (the protons connect to the carbon carbon double bond, shown by arrows in Fig. 1b) proved that DMA was fully polymerized.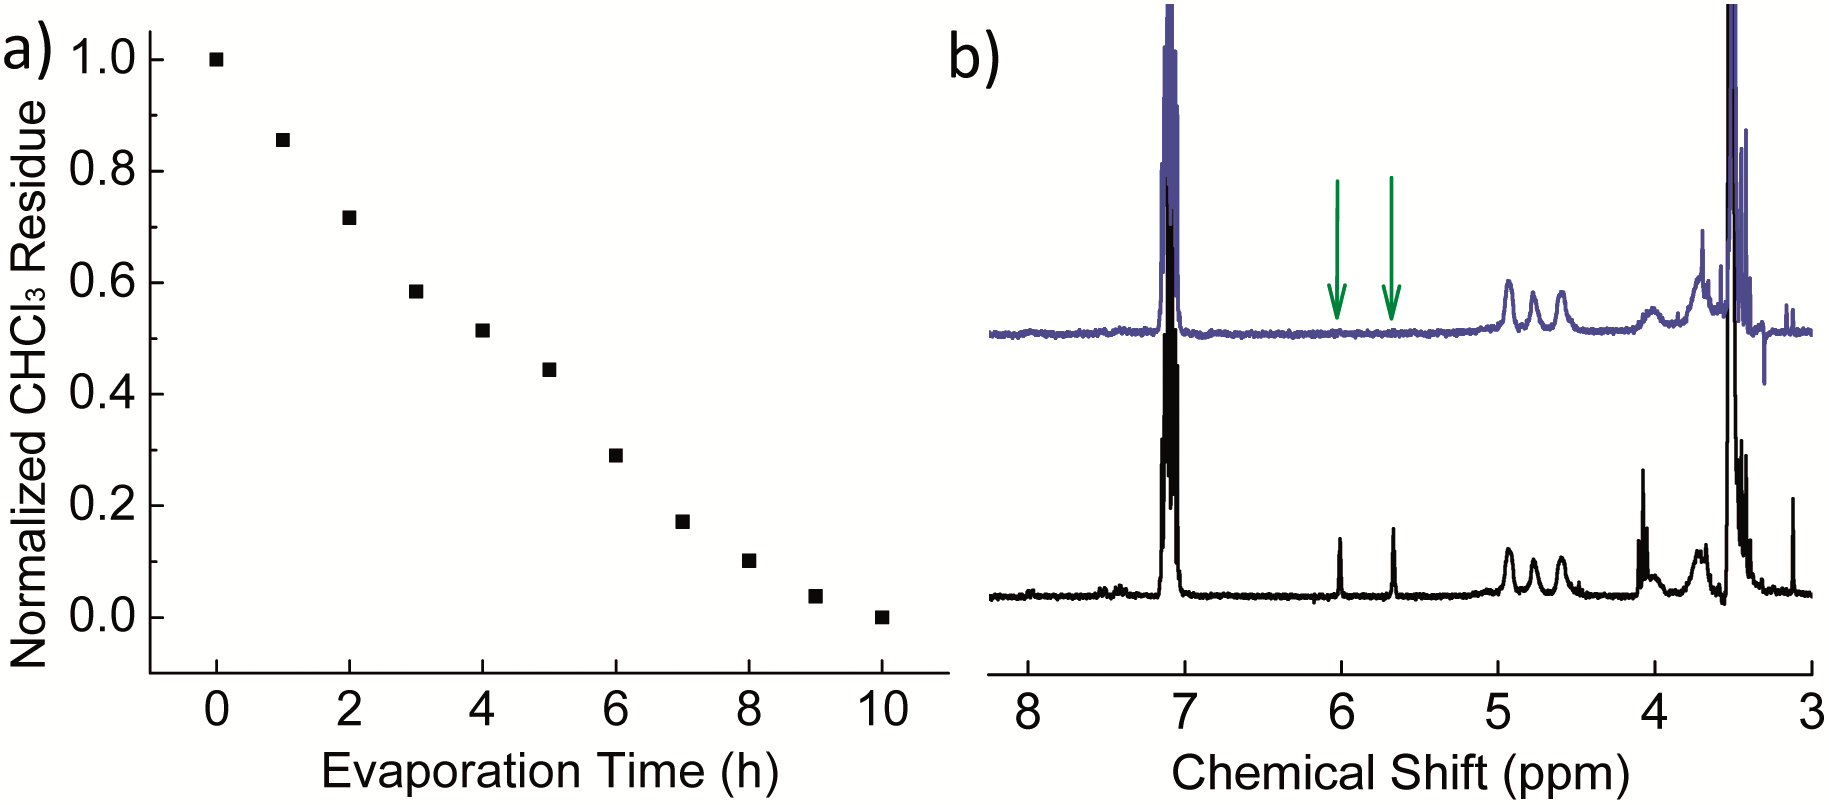 | ||
| Fig. 1 (a) Normalized CHCl3 residue as a function of evaporation time (entry 1 in Table 1); (b) 1H NMR spectra of the dispersion before (black) and after (blue) polymerization at room temperature (entry 4 in Table 1); xylene (7.02–7.16 ppm) was used as an external standard. | ||
A representative dispersion of PPs was prepared by using a weight ratio PVF:DMA of 1:1 (entry 1 in Table 1). After evaporation of CHCl3 but before polymerization of DMA, the surface of the nanoparticles was found to have bucket-like morphologies with smooth surfaces (Fig. 2a). These bucket-like morphologies are due to the evaporation of DMA under high vacuum in the chamber for scanning electronic microscopy. After polymerization of DMA, many patches looking like depressions in SEM appeared on the particle surface as shown in Fig. 2b. These patches are attributed to dimples, which were caused by shrinkage of the PDMA domains. Indeed, the polymerization induces a volume reduction due to an increase in density from 0.868 g cm−3 (DMA)57 to 0.929 g cm−3 (PDMA).58 The dimples on the PP surface were also detected by TEM microscopy (Fig. 2c). To better visualize the phase separation between PVF and PDMA in the whole particles, cross-sectional TEM micrographs were taken for PPs after staining with osmium tetroxide (OsO4). It is known that OsO4 can be used to selectively stain PVF under our experimental conditions.59 The thickness of the sample was ∼ 60 nm, less than the diameter of particles of ∼250 nm. As shown in Fig. 2d and Fig. S3,† core–shell structures could be clearly identified. The brighter core was created because some of the PDMA diffused out of the particles during the sample preparation whereas the dark domains belong to the stained PVF.
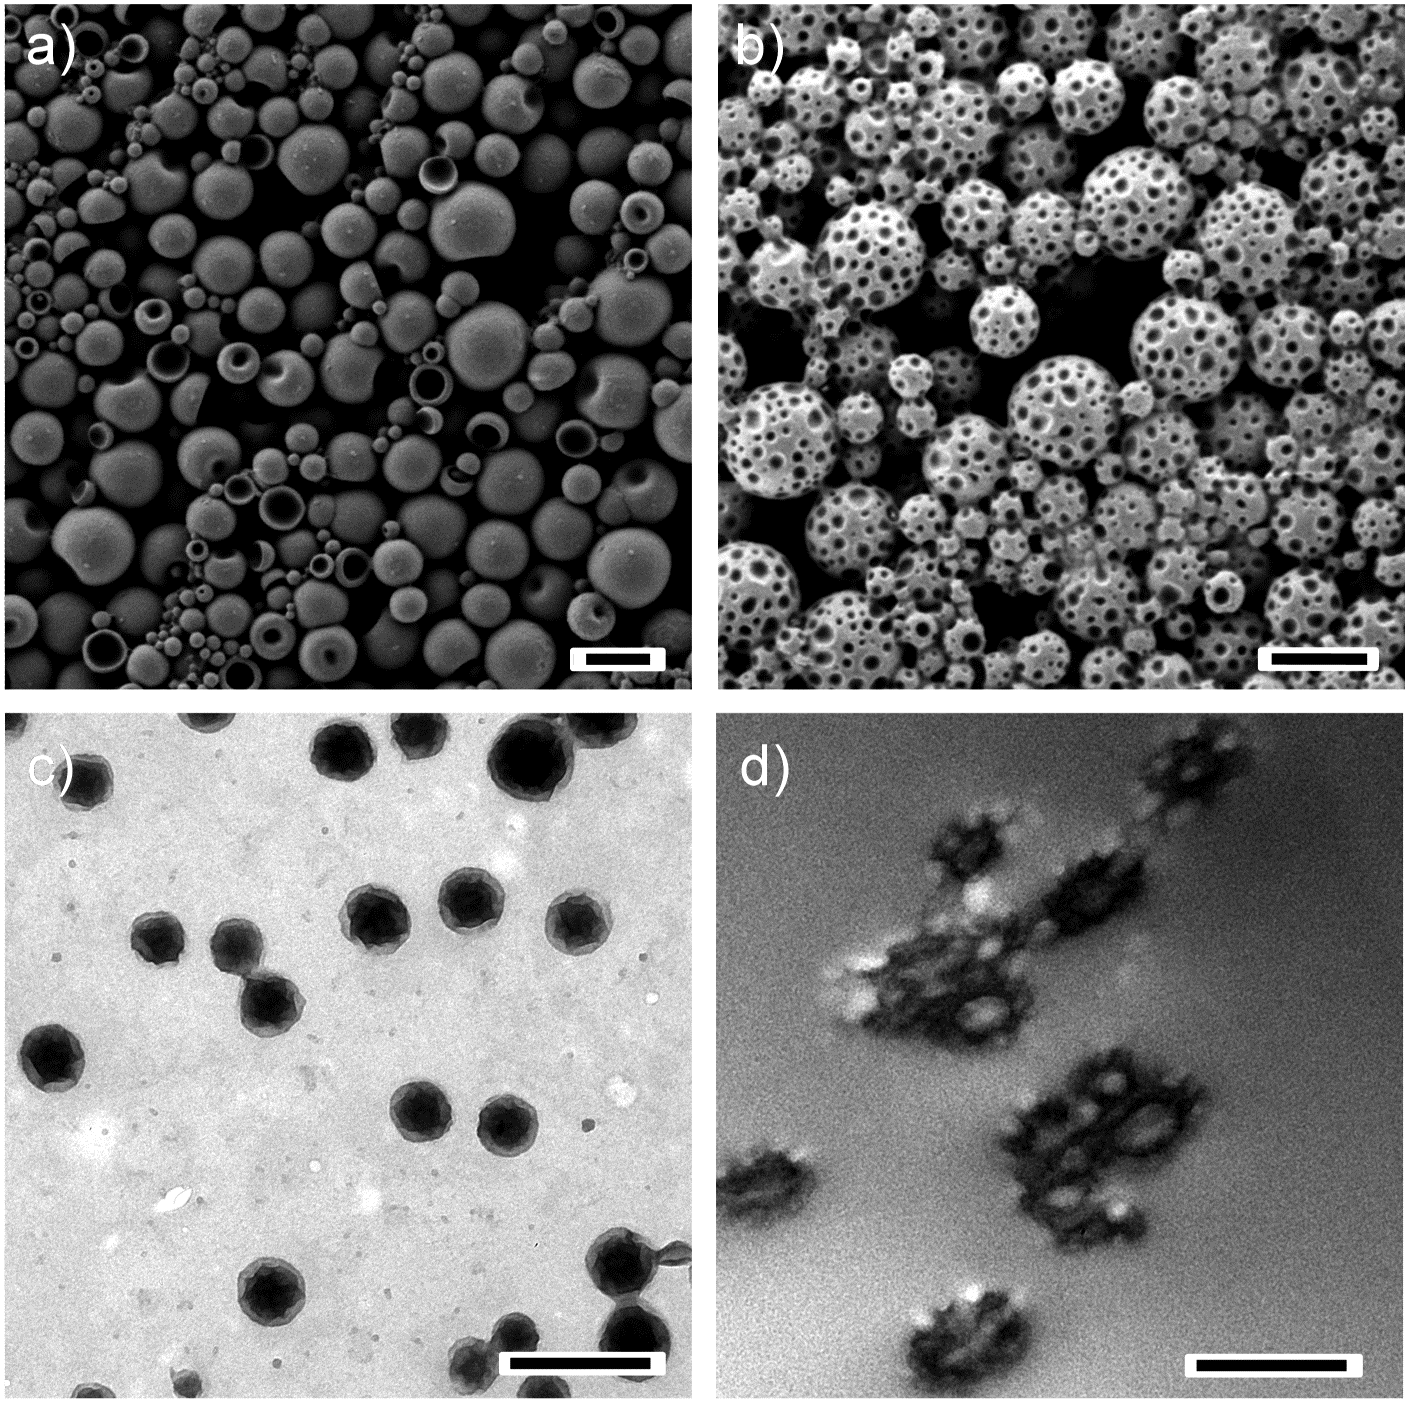 | ||
| Fig. 2 Representative SEM micrographs of the nanoparticles (entry 1 of Table 1) (a) before and (b) after polymerization of DMA. (c) TEM and (d) cross-sectional TEM micrographs of the same PPs. The scale bars represent 500 nm. | ||
Although the cross-sectional TEM micrograph in Fig. 2d shows that there are two different chemical domains on the particle surface, the sizes, shapes and depths of the domains cannot be measured accurately because of the fact that the particles are deformed during the cross-sectioning. Atomic force microscopy (AFM) was carried out on the particles to exclude any effect of the vacuum required for electron microscopy on the morphology of the colloids (Fig. 3). The AFM phase contrast images revealed two distinct phases on the PP surface. The diameter of the patches of the dark phase contrast ranged from 10 to 60 nm (Fig. 3b). These patches were also visible in AFM topography as dimples in the PP (Fig. 3a). Again this can be explained by the smaller height of the patches induced by the contraction of the PDMA during the polymerization. Thus the dark phase contrast areas should correspond to PDMA. A more direct proof that these patches correspond to PDMA is to measure the surface elasticity and the tip sample adhesion forces using force distance curves. Such a study was performed on several areas and the data recorded on a single PP are exemplarily presented in Fig. 3c–e. The topography image (Fig. 3c) revealed no difference compared to standard AFM imaging. The surface elasticity revealed a reduced slope in the PDMA-rich domains compared to the surrounding material (Fig. 3d) while the adhesion in these areas was measured to be increased (Fig. 3e). This way we could clearly show where the low Tg material, i.e. PDMA, is situated in the PPs.
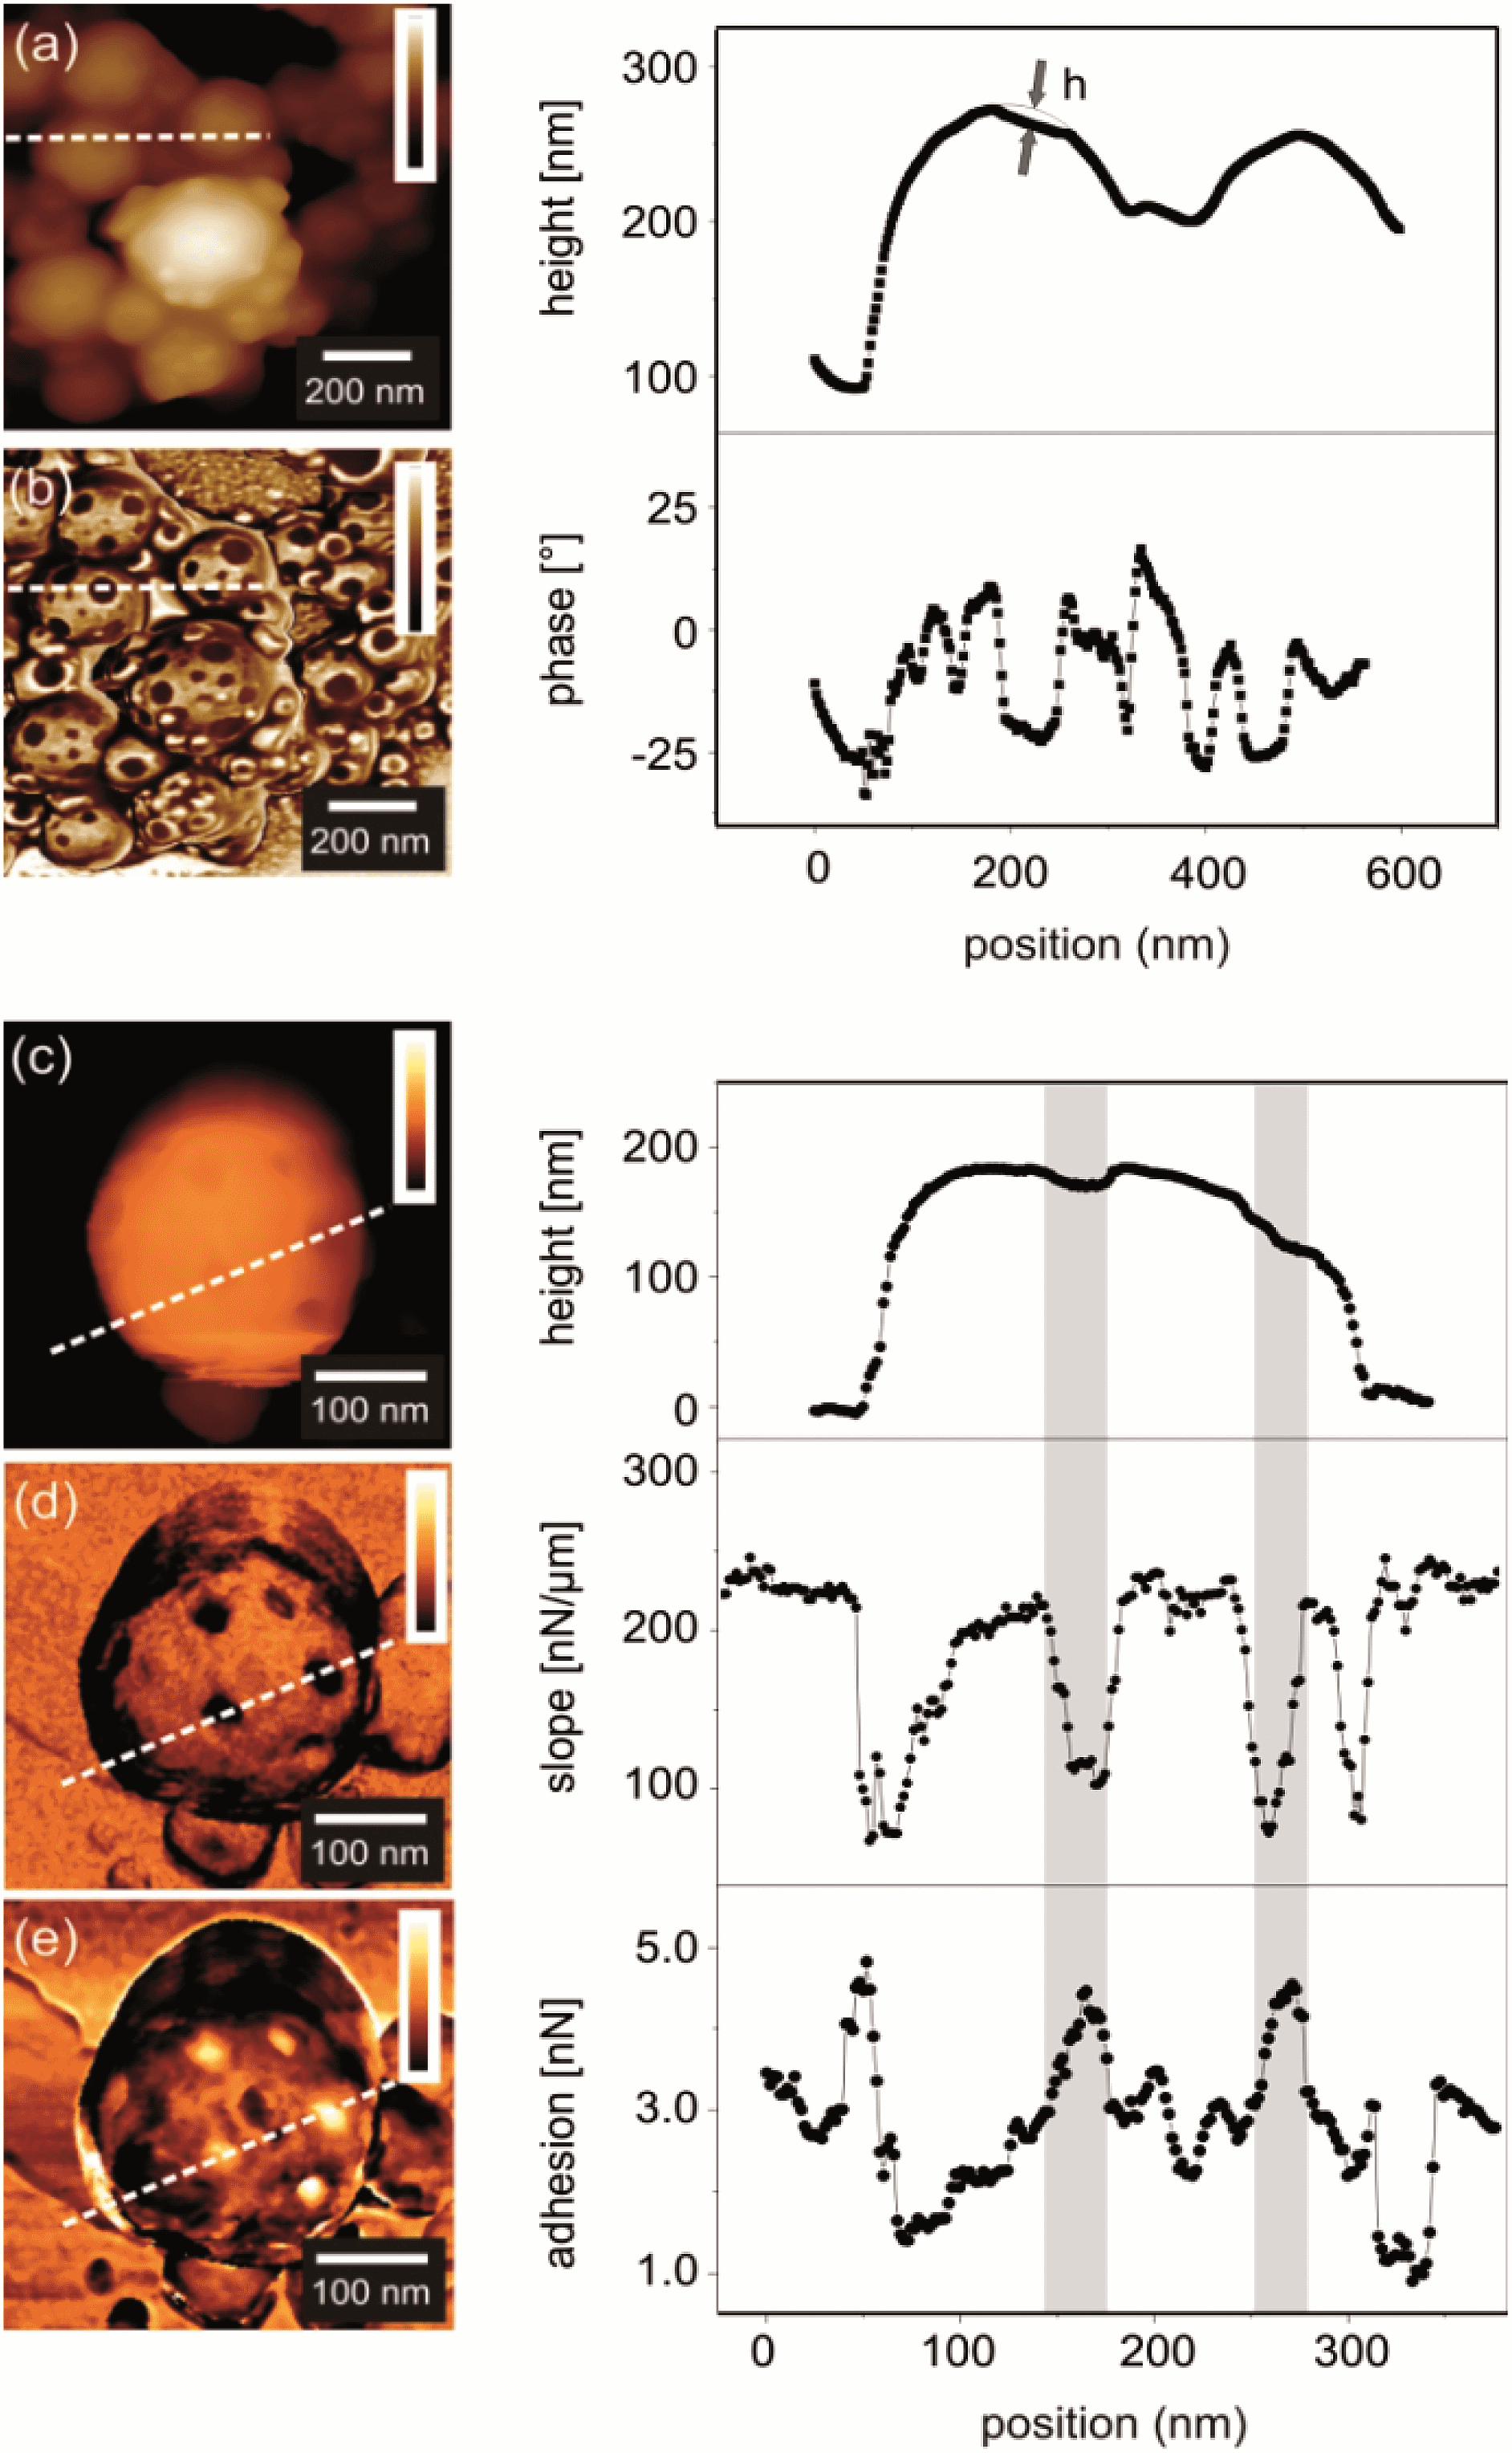 | ||
| Fig. 3 AFM height (a) and phase (b) images of PPs (entry 1 of Table 1), 1 μm × 1 μm; the right curves show a topography profile. The depth of the dimple h was calculated by subtracting the profile from a spherical profile. The average depth of the patch estimated by AFM is between 5 and 20 nm. (c–e) Quantitative AFM images of a single patchy particle. The areas in the graphs marked in grey represent the locations of the patches. In (e), the background variation in the adhesion forces was attributed to the presence of remaining surfactant molecules on the particle surface. | ||
In order to clearly understand if there are other factors influencing the generation of PPs, a series experiments were carried out as follows. The miscibility between PVF and the monomer DMA was studied by differential scanning calorimetric (DSC) measurements. Fig. 4a shows that the pure PVF has a Tg ∼ 105 °C (2nd scan, heating curve), whereas the Tg of the PVF:DMA blend of 4:1 (wt:wt) was decreased to ∼85 °C. This is due to the plasticizing effect that DMA induces for PVF, which means PVF and DMA are partially miscible. Another hint for the presence of DMA in the PVF is given by the fact that the patchy structure can also be obtained using a water soluble initiator instead of AIBN after the evaporation of CHCl3 (Fig. 4b). The polymerization initiated by potassium persulfate (KPS) yielded PDMA, which means that DMA was partly present on the PVF surface. As AIBN was used as the initiator in most cases, the decomposition of AIBN will generate a considerable amount of nitrogen gas (N2). In our study, there is 1.57 cm3 N2 generated at 72 °C when AIBN is fully decomposed according to Charles Law, V1/T1 = V2/T2 (V1 is the volume of N2 at room temperature T1; V2 is the volume of N2 at reaction temperature T2). In order to study the possible effect of N2 on the morphology of PPs, DMA was replaced by the chemically inert hexadecane and then the dispersion was treated under the same conditions as for the preparation of PPs. No indentations were detected on the surface of particles (Fig. 4c). The gas generation was therefore not the reason for the formation of the patches. To demonstrate that the polymerization reaction plays the key role in the formation of the PPs, another experiment was conducted to form PPs with the photoinitiator DMPA, which does not release gas during polymerization. As shown in Fig. 4d, dimples were present on the nanoparticle surface when DMA was polymerized at 72 °C. However, no patches could be obtained (see Fig. S4†) when DMA was polymerized at room temperature although the conversion of monomer to polymer was ∼100%. These results further justify our conclusion that polymerization-induced phase separation is the dominant driving force in forming patches in such PPs. Temperature also plays an important role to allow and accelerate the phase separation during polymerization.
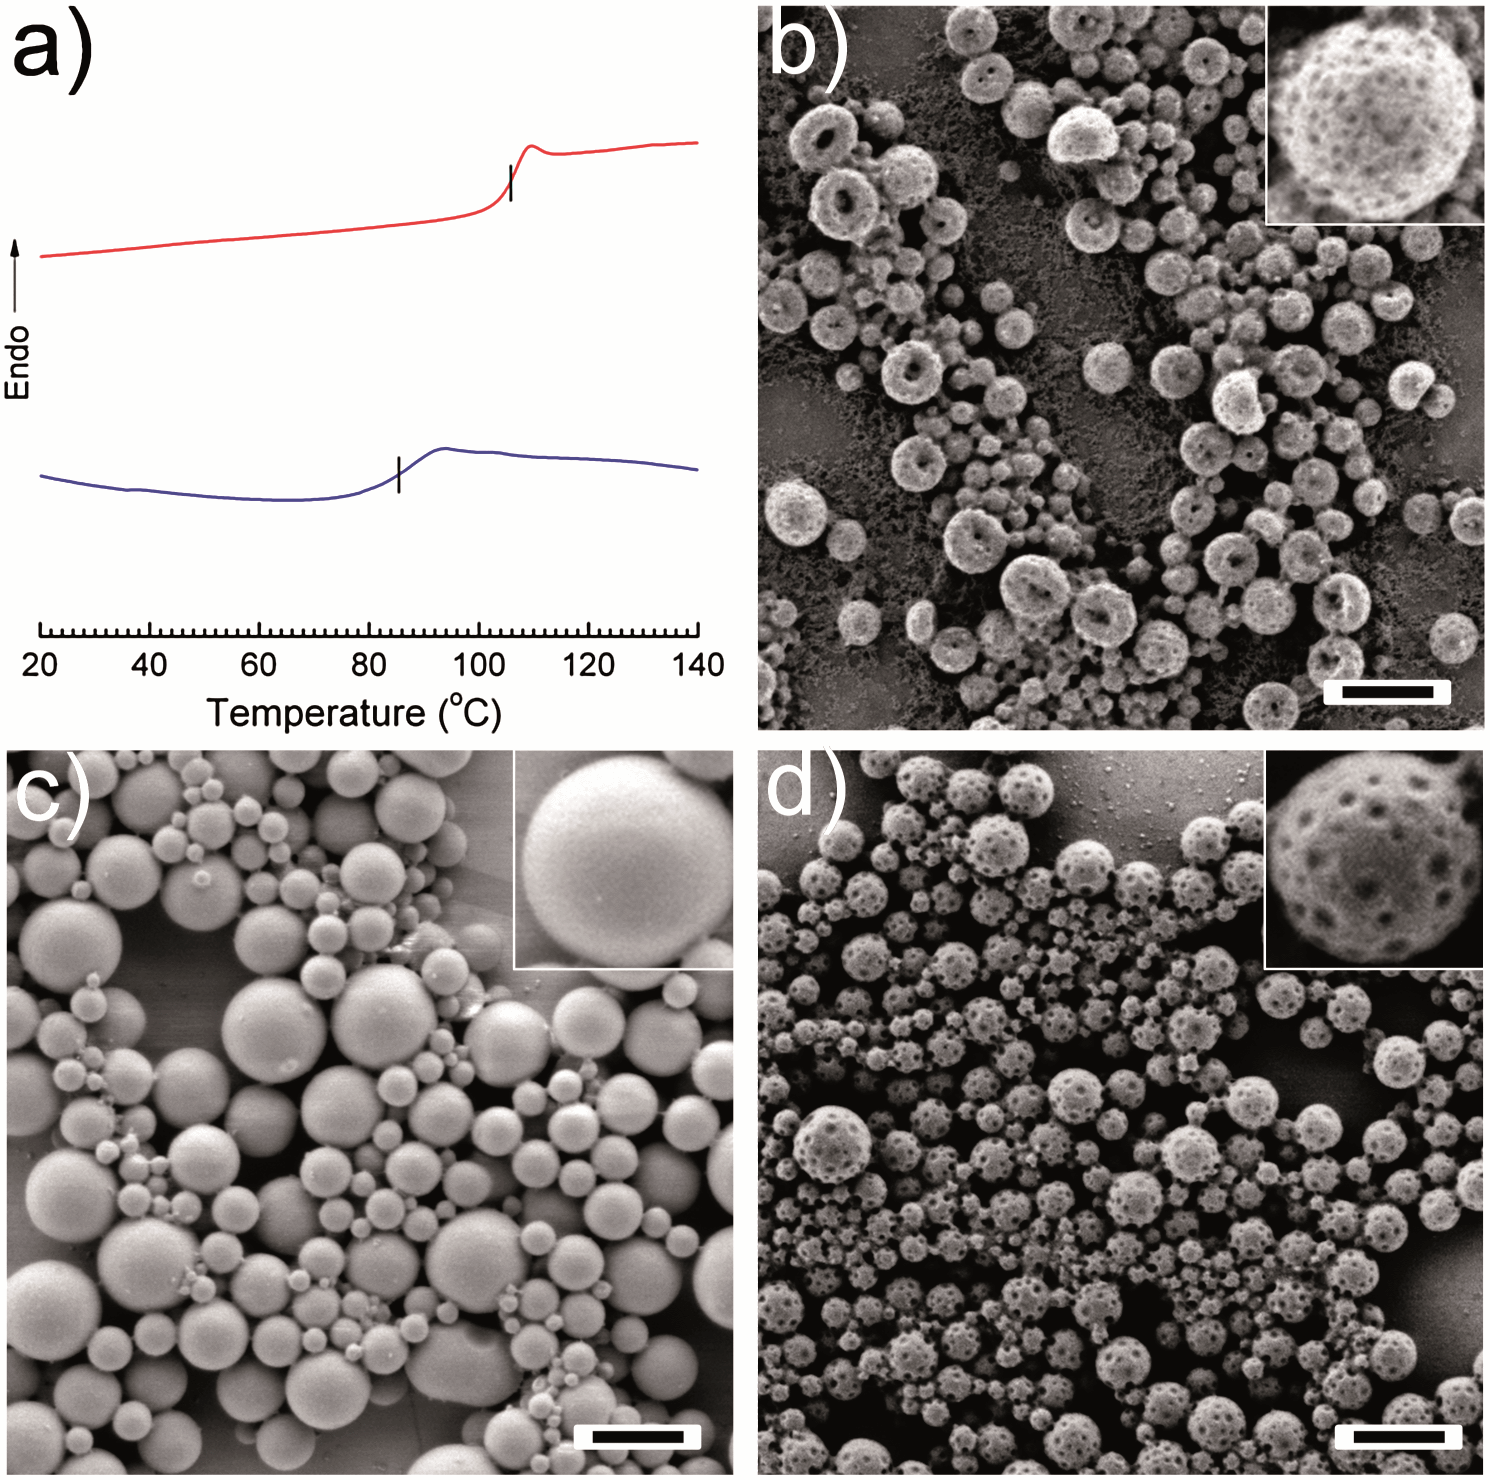 | ||
| Fig. 4 (a) Differential scanning calorimetric heating curves (2nd scan) for PVF (upper) and PVF–DMA blend (4:1 wt:wt) (lower); SEM micrographs of PVF nanoparticles prepared under different conditions: (b) KPS as an initiator (entry 2 in Table 1); (c) HD as hydrophobic oil (entry 3 in Table 1); (d) DMPA as a photoinitiator (entry 4 in Table 1). The scale bars represent 500 nm. | ||
The temporal evolution of the nanoparticle morphology as a function of the conversion (Cm) was followed by SEM (Fig. 5). Aliquots of the dispersion were taken at different times for 1H NMR measurements to determine Cm. Phase separation already occurred at a very early stage of polymerization (Cm = 6%, Fig. 5b) according to a nucleation-growth mechanism. Some tiny dimples appeared on the particle surface. When Cm < 58% (Fig. 5a–d), the sizes of the patches increased with increasing Cm, e.g. ∼30 nm with Cm = 30% and ∼45 nm with Cm = 58%. When Cm > 58% (Fig. 5e–h), the size of the patches was almost constant even when Cm was increased above 90%. This is possibly due to the enhanced viscosity of the system when Cm is high, which slows down the mobility of the polymer chains. Moreover, the aforementioned plasticizing effect of DMA on PVF becomes less pronounced with DMA conversion, leading to a locking of the nanoparticle structure. This means that the size of the patches of the PPs can be tuned by controlling the monomer conversion, especially at the early stage of the polymerization. However, the consequence is that some amount of the monomer can be present in the final PPs.
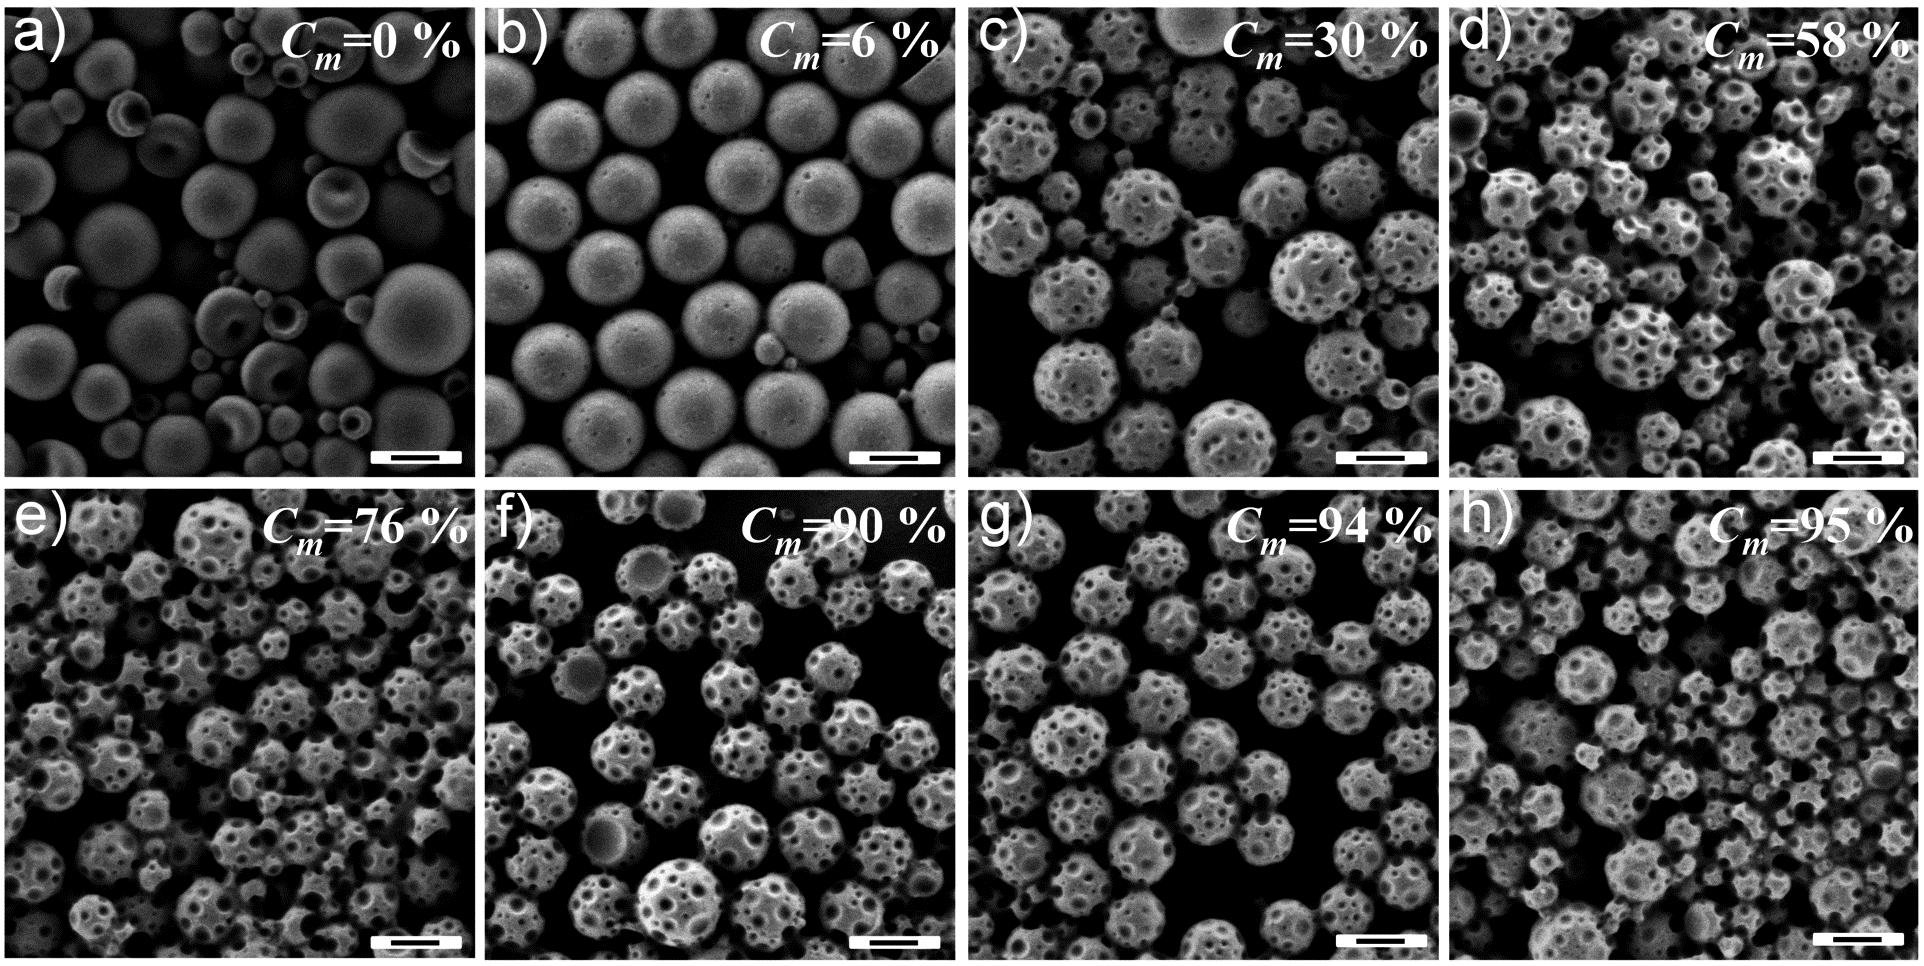 | ||
| Fig. 5 SEM micrographs show the morphological evolution of PVF nanoparticles (entry 7 in Table 1) with increased conversion of DMA to polymer. The scale bars represent 200 nm. | ||
Therefore we searched for another method to control the size of the patches while minimizing the amount of the non-reacted monomer in the PPs. This can be achieved by precisely adjusting the composition of the PPs (entries 5–9 of Table 1). For concentrations of DMA < 50% (Fig. S5a–c† and 2a), the particles possess spherical morphologies, i.e., the DMA is embedded in the PVF nanocapsules.53 Above 50% of DMA, the DMA cannot be fully encapsulated by PVF and bowl-shaped structures were identified (Fig. S5d†). As shown in Fig. 6a, the average patche size (calculated on 100 patches) was ∼17 nm when the concentration of the monomer was 10%. Increasing the amount of DMA in the nanoparticles to 20% and 40% yielded a patch size of ∼25 nm and ∼42 nm, respectively (Fig. 6b–c). A further rise in the concentration of DMA (60%) leads also to a larger patch size (Fig. 6d), but causes the formation of acorn structures instead of the previously observed patchy nanocaspule structures. Patchy structures were also detected after polymerization when DMA was 80% but only in the bowl shaped section formed by the PVF (Fig. S6†). The size of the patches, therefore, can be controlled to be from ∼15 nm to ∼45 nm by adjusting the composition of the nanoparticles.
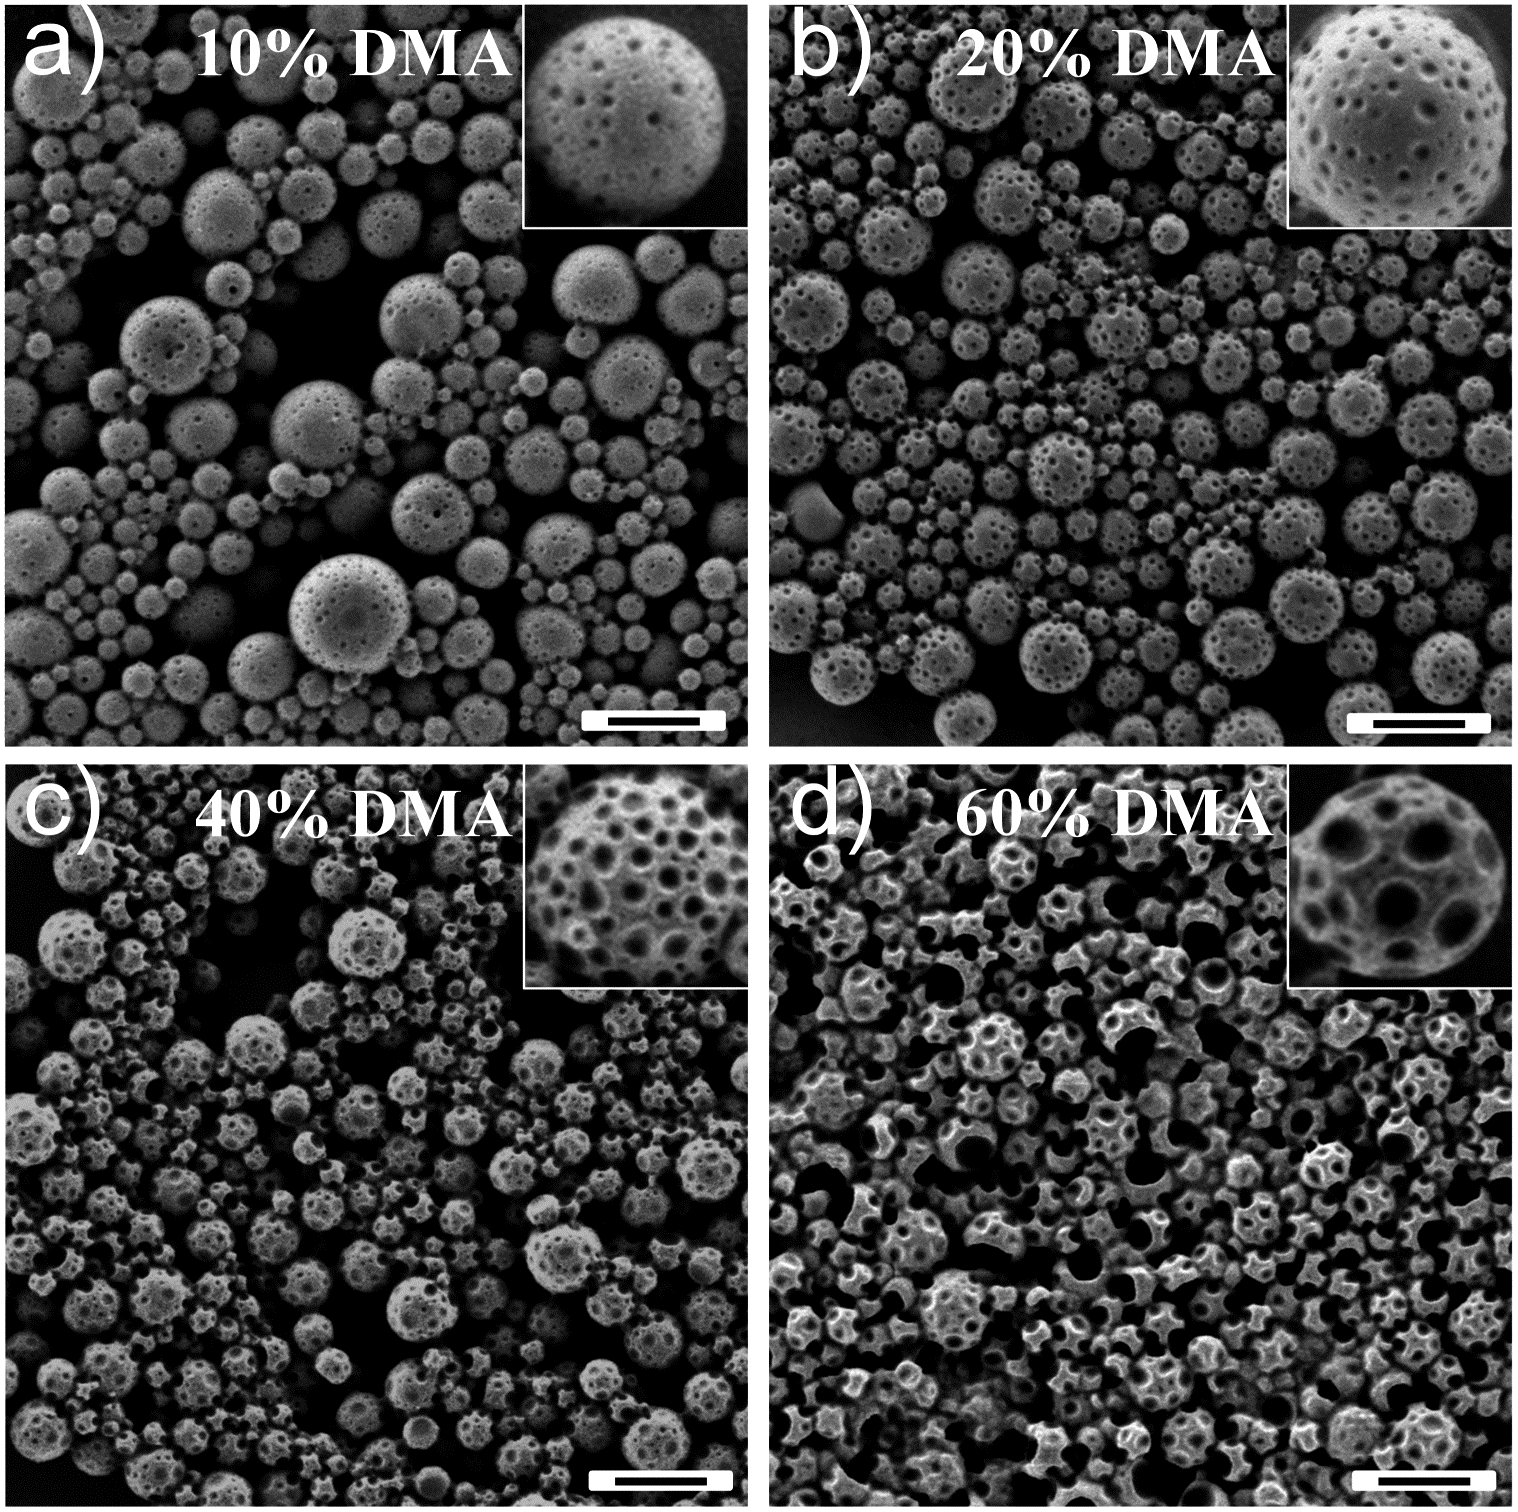 | ||
| Fig. 6 SEM micrographs of PPs reveal that the patch size could be adjusted by varying the compositions of DMA and for Cm > 95%. The scale bars represent 500 nm. The inset particles have a diameter of ∼300 nm. | ||
The PPs morphologies are in a kinetically trapped but thermodynamically unstable state. Indeed, after annealing the nanoparticles at T > Tg, phase separation between the PDMA and the PVF occurred and led to the vanishing of the patchy domains. As shown in Fig. S7,† heating the PPs (entry 6 of Table 1) at 90 °C removed the particle surface structures while aggregation of particles was detected (Fig. S7d†). The thermal properties of the PPs were investigated by DSC to estimate the miscibility of the polymers in the PPs. Two Tg values at −32 °C and 77 °C were detected before annealing, corresponding to the PDMA-rich phase and the PVF-rich phase, respectively (Fig. S8†). Compared with the Tg of the individual components (105 °C for PVF and −48 °C for PDMA56), these results indicate that the confinement and the kinetically trapped colloidal morphology force a partial mixing of PVF and PDMA. Note that SDS also acts as a plasticizer to decrease the Tg of polymers.60,61 After annealing the freeze dried PPs (as powder) at 120 °C for 24 h, the measured Tg values of the PPs were found to be shifted oppositely to −38 °C and 103 °C, revealing a higher extent of phase separation between both polymers. In order to lock the kinetically trapped patchy morphology, we investigate the possibility to crosslink the PDMA domains. The use of a crosslinker for the formation of PPs is however a double-edge strategy. On the one hand, the colloidal morphology shall be locked. On the other hand, it may hamper the formation of the patchy domains due to the rapid increase of viscosity in the particles with increased monomer conversion. Indeed, PPs prepared with 15 wt% DVB (1,4-divinylbenzene) as a crosslinker displayed an irregular surface (Fig. S9a†) but no identifiable patchy domains (Fig. S9b†). Reducing the concentration of the crosslinker to 10 and 5% (entries 10 and 11 in Table 1) however yielded PPs. Whereas the PPs with a 5% crosslinker were aggregated upon annealing at 90 °C for 3 h, the PPs with a 10% crosslinker tolerated the annealing. Although some aggregation was still observed, separated PPs with specific surface domains could be clearly identified (Fig. 7a). Again, the dimples were proved to be of a different composition than the matrix by AFM phase imaging (Fig. 7b). The patchy domains in the PPs could be therefore stabilized by the introduction of an appropriate amount of crosslinker.
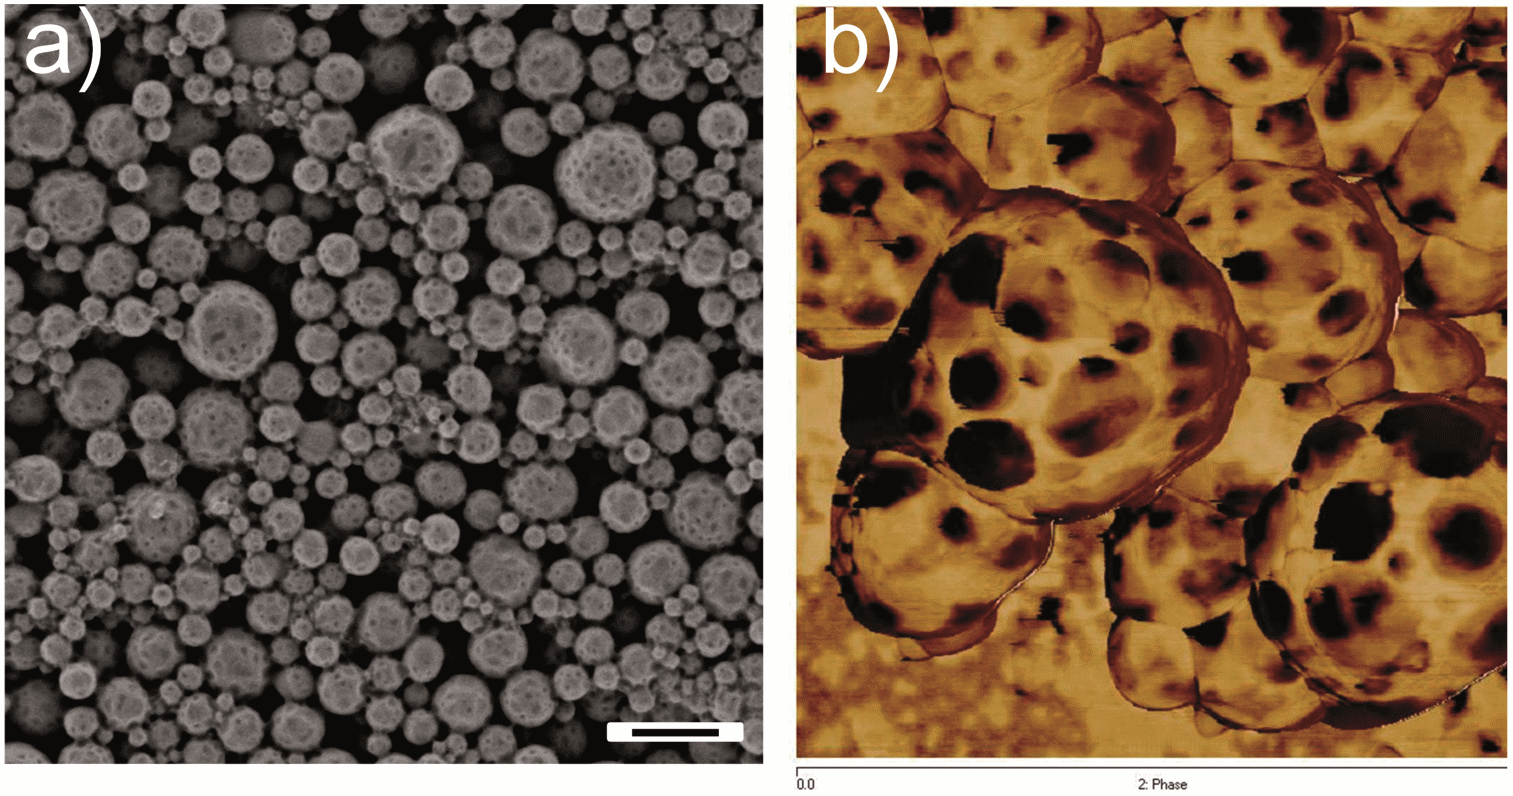 | ||
| Fig. 7 SEM micrograph (a) and AFM phase contrast image 1 μm × 1 μm (b) of cross-linked PPs (entry 11 in Table 1) after treating at 90 °C for 3 h. The scale bar represents 500 nm. | ||
Conclusions
In summary, we demonstrated an easy, low-cost and mild strategy to fabricate patchy particles (PPs) in large quantities without using block copolymers. Polymerization-induced phase separation was found to be the reason for the formation of the PPs. The size of the patches could be easily tuned by controlling the monomer conversion or by changing the composition of the nanoparticles. The atomic force microscopy analysis revealed that the patches were found to be sticky and embedded in a harder polymer matrix. Moreover, the patchy structure could be locked by crosslinking the sticky patches. Our approach could be extended to prepare large libraries of different PPs by choosing other polymer/monomer pairs and/or by post-functionalizing the patchy area.Acknowledgements
The authors acknowledge Haixin Zhou and Petra Räder for DSC measurements, and Uwe Rietzler for AFM imaging. Claudia Messerschmidt, Ingo Lieberwirth and Christoph Sieber are thanked for the cross-sectional TEM measurements and helpful discussions.Notes and references
- Z. Zhang and S. C. Glotzer, Nano Lett., 2004, 4, 1407–1413 CrossRef CAS.
- A. B. Pawar and I. Kretzschmar, Macromol. Rapid Commun., 2010, 31, 150–168 CrossRef CAS PubMed.
- J. Du and R. K. O'Reilly, Chem. Soc. Rev., 2011, 40, 2402–2416 RSC.
- P. G. De Gennes, Rev. Mod. Phys., 1992, 64, 645–648 CrossRef.
- A. Walther and A. H. E. Müller, Chem. Rev., 2013, 113, 5194–5261 CrossRef CAS PubMed.
- S. Y. Zhang, Z. Li, S. Samarajeeva, G. R. Sun, C. Yang and K. Wooley, J. Am. Chem. Soc., 2011, 133, 11046–11049 CrossRef CAS PubMed.
- J. A. Champion, Y. K. Katare and S. Mitragotri, Proc. Natl. Acad. Sci. U. S. A., 2007, 104, 1190111904 CrossRef PubMed.
- R. Langer and D. A. Tirrell, Nature, 2004, 428, 487–492 CrossRef CAS PubMed.
- R. H. Staff, M. Gallei, M. Mazurowski, M. Rehahn, R. Berger, K. Landfester and D. Crespy, ACS Nano, 2012, 6, 9042–9049 CrossRef CAS PubMed.
- M. Grätzel, Nature, 2001, 414, 338–344 CrossRef PubMed.
- T. Nisisako, T. Torii, T. Takahashi and Y. Takizawa, Adv. Mater., 2006, 18, 1152–1156 CrossRef CAS.
- C. M. Liddell, C. J. Summers and A. M. Gokhale, Mater. Charact., 2003, 50, 69–79 CrossRef CAS.
- O. Cayre, V. N. Paunov and O. D. Velev, J. Mater. Chem., 2003, 13, 2445–2450 RSC.
- H. Takei and N. Shimizu, Langmuir, 1997, 13, 1865–1868 CrossRef CAS.
- G. A. Ozin, I. Manners, S. Fournier-Bidoz and A. Arsenault, Adv. Mater., 2005, 17, 3011–3018 CrossRef CAS.
- M. D. McConnell, M. J. Kraeutler, S. Yang and R. J. Composto, Nano Lett., 2010, 10, 603–609 CrossRef CAS PubMed.
- J. Q. Cui and I. Kretzschmar, Langmuir, 2006, 22, 8281–8284 CrossRef CAS PubMed.
- L. Hong, S. Jiang and S. Granick, Langmuir, 2006, 22, 9495–9499 CrossRef CAS PubMed.
- A. D. Dinsmore, M. F. Hsu, M. G. Nikolaides, M. Marquez, A. R. Bausch and D. A. Weitz, Science, 2002, 298, 1006–1009 CrossRef CAS PubMed.
- F. Yan and W. A. Goedel, Chem. Mater., 2004, 16, 1622–1626 CrossRef CAS.
- L. Wang, L. Xia, G. Li, S. Ravaine and X. S. Zhao, Angew. Chem., Int. Ed., 2008, 47, 4725–4728 CrossRef CAS PubMed.
- Z. K. Zhang, P. Pfeiderer, A. B. Schofield, C. Clasen and J. Vermant, J. Am. Chem. Soc., 2011, 133, 392–395 CrossRef CAS PubMed.
- A. B. Pawar and I. Kretzschmar, Langmuir, 2009, 25, 9057–9063 CrossRef CAS PubMed.
- A. B. Pawar and I. Kretzschmar, Langmuir, 2008, 24, 355–358 CrossRef CAS PubMed.
- Z. He and I. Kretzschmar, Langmuir, 2012, 28, 9915–9919 CrossRef CAS PubMed.
- C. E. Snyder, A. M. Yake, J. D. Feick and D. Velegol, Langmuir, 2005, 21, 4813–4815 CrossRef CAS PubMed.
- G. Zhang, D. Wang and H. Möhwald, Angew. Chem., Int. Ed., 2005, 44, 7767–7770 CrossRef CAS PubMed.
- G. Zhang, D. Wang and H. Möhwald, Nano Lett., 2005, 5, 143–146 CrossRef CAS PubMed.
- T. T. Chastek, S. D. Hudson and V. A. Hackley, Langmuir, 2008, 24, 13897–13903 CrossRef CAS PubMed.
- K. H. Roh, D. C. Martin and J. Lahann, J. Am. Chem. Soc., 2006, 128, 6796–6797 CrossRef CAS PubMed.
- K. H. Roh, D. C. Martin and J. Lahann, Nat. Mater., 2005, 4, 759–763 CrossRef CAS PubMed.
- Z. Nie, W. Li, M. Seo, S. Xu and E. Kumacheva, J. Am. Chem. Soc., 2006, 128, 9408–9412 CrossRef CAS PubMed.
- A. H. Gröschel, F. H. Schacher, H. Schmalz, O. V. Borisov, E. B. Zhulina, A. Walther and A. H. E. Müller, Nat. Commun., 2012, 3, 710 CrossRef PubMed.
- Z. Li, E. Kesselman, Y. Talmon, M. A. Hillmyer and T. P. Lodge, Science, 2004, 306, 98–101 CrossRef CAS PubMed.
- R. Zheng, G. Liu and X. Yan, J. Am. Chem. Soc., 2005, 127, 15358–15359 CrossRef CAS PubMed.
- R. H. Staff, P. Rupper, I. Lieberwirth, K. Landfester and D. Crespy, Soft Matter, 2011, 7, 10219–10226 RSC.
- Q. Chen, S. C. Bae and S. Granick, J. Am. Chem. Soc., 2012, 134, 11080–11083 CrossRef CAS PubMed.
- R. N. K. Taylor, H. Bao, C. Tian, S. Vasylyev and W. Peukert, Langmuir, 2010, 26, 13564–13571 CrossRef PubMed.
- H. Bao, W. Peukert and R. N. K. Taylor, Adv. Mater., 2011, 23, 2644–2649 CrossRef CAS PubMed.
- H. Bao, B. Butz, Z. Zhou, E. Spiecker, M. Hartmann and R. N. K. Taylor, Langmuir, 2012, 28, 8971–8978 CrossRef CAS PubMed.
- M. Okubo, Y. Murakami and T. Fujiwara, Colloid Polym. Sci., 1996, 274, 520–524 CAS.
- M. Okubo, T. Fujiwara and A. Yamaguchi, Colloid Polym. Sci., 1998, 276, 186–189 CAS.
- M. Okubo, A. Yamaguchi and T. Fujiwara, Colloid Polym. Sci., 1999, 277, 1005–1008 CAS.
- T. Fujibayashi, Y. Komatsu, N. Konishi, H. Yamori and M. Okubo, Ind. Eng. Chem. Res., 2008, 47, 6445–6449 CrossRef CAS.
- N. Konishi, T. Fujibayashi, T. Tanaka, H. Minami and M. Okubo, Polym. J., 2010, 42, 66–71 CrossRef CAS.
- H. R. Sheu, M. S. El-Aasser and J. W. Vanderhoff, J. Polym. Sci., Part A: Polym. Chem., 1990, 28, 629–651 CrossRef CAS.
- J. W. Kim, R. J. Larsen and D. A. Weitz, J. Am. Chem. Soc., 2006, 128, 14374–14377 CrossRef CAS PubMed.
- J. W. Kim, R. J. Larsen and D. A. Weitz, Adv. Mater., 2007, 19, 2005–2009 CrossRef CAS.
- D. Crespy and K. Landfester, Beilstein J. Org. Chem., 2010, 6, 1132–1148 CrossRef CAS PubMed.
- R. H. Staff, D. Schaeffel, A. Turshatov, D. Donadio, H. J. Butt, K. Landfester, K. Koynov and D. Crespy, Small, 2013 DOI:10.1002/smll.201300372.
- D. Schaeffel, R. H. Staff, H. J. Butt, K. Landfester, D. Crespy and K. Koynov, Nano Lett., 2012, 12, 6012–6017 CrossRef CAS PubMed.
- Y. Zhao, K. Landfester and D. Crespy, Soft Matter, 2012, 8, 11687–11696 RSC.
- Y. Zhao, J. Fickert, K. Landfester and D. Crespy, Small, 2012, 8, 2954–2958 CrossRef CAS PubMed.
- J. Fickert, C. Wohnhaas, A. Turshatov, K. Landfester and D. Crespy, Macromolecules, 2013, 46, 573–579 CrossRef CAS.
- J. Brandrup, E. H. Immergut and E. A. Grulke, Polymer Handbook, John Wiley and Sons, New York, 4th edn, 1999, p. VI/202 Search PubMed.
- G. Floudas, P. Placke, P. Stepanek, W. Brown, G. Fytas and K. L. Ngai, Macromolecules, 1995, 28, 6799–6807 CrossRef CAS.
- J. Brandrup, E. H. Immergut and E. A. Grulke, Polymer Handbook, John Wiley and Sons, New York, 4th edn, 1999, p. III/14 Search PubMed.
- D. W. van Krevelen and K. te Nijenhuis, Properties of Polymers, Elsevier Science: Amsterdam, 4th edn, 2009, p. 79 Search PubMed.
- J. S. Trent, J. I. Scheinbeim and P. R. Couchman, Macromolecules, 1983, 16, 589–598 CrossRef CAS.
- Z. K. Zhong and X. S. Sun, J. Appl. Polym. Sci., 2001, 81, 166–175 CrossRef CAS.
- M. Hermant, L. Klumperman, C. Koning and P. van der Schoot, WO 2009033933A2, 2009.
Footnote |
| † Electronic supplementary information (ESI) available: Detailed characterization by SEM, TEM, AFM, DSC and 1H NMR. See DOI: 10.1039/c3py01096a |
| This journal is © The Royal Society of Chemistry 2014 |