 Open Access Article
Creative Commons Attribution 3.0 Unported Licence
Neutron diffraction as a precise and reliable method for obtaining structural properties of bulk quantities of graphene
Zdeněk
Sofer
*a,
Petr
Šimek
a,
Ondřej
Jankovský
a,
David
Sedmidubský
a,
Přemysl
Beran
b and
Martin
Pumera
c
aInstitute of Chemical Technology, Department of Inorganic Chemistry, 166 28 Prague 6, Czech Republic. E-mail: zdenek.sofer@vscht.cz; Fax: +420 22431-0422
bNuclear Physics Institute of the ASCR, v. v. i., Husinec-Řež 130, 250 68 Řež, Czech Republic. E-mail: pberan@ujf.cas.cz
cDivision of Chemistry & Biological Chemistry, School of Physical and Mathematical Sciences, Nanyang Technological University, Singapore, 637371, Singapore. E-mail: pumera@ntu.edu.sg; Fax: +65 6791-1961
First published on 2nd September 2014
Abstract
Graphene based carbon materials have attracted a great deal of attention in the last decade; nowadays tons of graphene are produced yearly. However, there is lack of precise and reliable techniques for the determination of structural properties of graphene on the bulk scale. The analytical methods being routinely applied for graphene characterization, including TEM and AFM, can be only used for the study of scant amounts of graphene samples and do not give general information on the average number of layers and the structure of the prepared graphenes. On the other hand, diffraction methods can be advantageously used to obtain information on the average thickness of the produced graphene as well as on the average sheets lateral dimensions, without the necessity of sample dispersion in solvents. We present a study of the structural properties of graphene prepared by chemical and thermal reduction of graphite oxide, comparing SEM, STEM, AFM, Raman spectroscopy, BET, X-ray and neutron diffraction methods. Our study brings new deep insights into the basic structural properties of graphene in a bulk form. Given the importance of a suitable characterization technique on the bulk materials, we wish to highlight the importance of these diffraction techniques for accurate determination of the graphene thickness and lateral parameters.
Introduction
Graphene has been one of the most intensively studied materials since its discovery in 2004 owing to its unique physical, chemical, mechanical and electronic properties.1 The ballistic transport of free charge carriers and high electrical conductivity gives huge prospects for future potential applications of graphene such as transparent electrodes, solar cells, display devices, electrochemical and biochemical sensors, energy and halogen storage and graphene-based composites.2–7The synthesis of graphene is based on the top-down or bottom-up procedures. Bottom-up methods are usually based on a CVD deposition of carbon on metallic substrates. CVD techniques yield graphene with sufficient quality for microelectronic devices.8 The main advantage of top-down methods is the possibility of a large scale production of graphene. They can be divided into two branches: (i) the mechanical exfoliation of graphite and (ii) the two-step method consisting of the oxidation of graphite followed by reduction of the formed graphite oxide. For the purpose of graphite oxidation, mixtures of concentrated acids, such as nitric and sulfuric acid, are used in combination with strong oxidizing agents like potassium permanganate and potassium chlorate.9–11
Graphite oxide can be reduced to graphene by thermal or chemical reduction. Graphite oxide undergoes thermal reduction at temperatures over ∼200 °C if a high heating rate is applied. Functional groups (hydroxyl, epoxide and carboxyl groups) on graphite oxide decompose to form gaseous products, such as CO, CO2, H2O and various organic compounds.12 The gases formed in between the layers of graphite oxide cause an extreme increase of the interlayer pressure which eventually leads to exfoliation. Compared to thermal reduction, chemical reduction of graphite oxide is usually performed under mild conditions so that a lower concentration of defects is observed within graphite oxide. Chemical reduction is also much more suitable for fabrication of highly conductive materials like conductive plastics, inks and ceramics. Recently, hydrogen sulphide,13 hydrazine,14 sodium borohydride,15 and lithium aluminium hydride16 have been used for chemical reductions.17 Also reduction by the active hydrogen, which was formed by dissolving metal in an acid environment, has been reported.18–20
The structure of graphene has been successfully characterized using various microscopic methods. These include AFM, TEM, SEM, or Raman microscopy.21–24 It should be highlighted that microscopic techniques provide knowledge about very small amounts of the sample and it is impossible to extrapolate this knowledge to bulk amounts of samples. For example, single layer and few-layer graphene sheets were analysed by HRTEM and electron diffraction.21 A pioneering structural characterization by X-ray diffraction was done by Wang et al.25 and structural defects in graphene were analysed and described by Banhart et al.26
In this contribution, we wish to demonstrate that X-ray diffraction and neutron diffraction can provide precise information on the structural properties of graphene prepared by both chemical and thermal reduction, far superior to microscopic techniques (SEM, TEM, and AFM) or BET and Raman spectroscopy for bulk amounts of the sample.
Experimental section
Graphite oxide was prepared according to the Hofmann method from graphite (99.9%, Fluka, Switzerland). Sulfuric acid (98%), nitric acid (68%), potassium chlorate (>99%), hydrochloric acid (37%), silver nitrate (>99.8%), barium nitrate (>99%), hydrazine hydrate (99%), potassium hydroxide and methanol (>99.9%) were obtained from Penta, Czech Republic. Deionized water (16.8 MΩ) was used for buffer preparation. Hydrogen (99.9999% purity) and nitrogen (99.9999% purity) were obtained from SIAD, Czech Republic.Graphite oxide prepared according to the Hofmann method was termed HO-GO. Concentrated sulphuric acid (87.5 mL) and nitric acid (27 mL) were added to a reaction flask containing a magnetic stir bar. The mixture was then cooled to 0 °C, and graphite (5 g) was added. The mixture was vigorously stirred to avoid agglomeration and to obtain a homogeneous dispersion. While keeping the reaction flask at 0 °C, potassium chlorate (55 g) was slowly added to the mixture. Upon the complete dissolution of the potassium chlorate, the reaction flask was then loosely capped to allow the escape of the evolved gas and the mixture was continuously vigorously stirred for 96 h at room temperature. After completion of the reaction, the mixture was poured into deionized water (3 L) and decanted. The graphite oxide was first redispersed in a HCl (5%) solution to remove sulphate ions and then repeatedly centrifuged and redispersed in deionized water until all chloride and sulphate ions were removed. The graphite oxide slurry was then dried in a vacuum oven at 50 °C for 48 h.
Thermally reduced graphene denoted “TRG” was prepared in a quartz glass reactor. 0.5 g of graphite oxide was placed inside the reactor and flushed three times with nitrogen. The reactor was inserted into the hot zone of the furnace preheated to 900 °C. The exfoliation of HO-GO was performed in a flow of nitrogen (500 mL min−1) for 3 minutes in order to remove the byproducts of the exfoliation. After exfoliation, the reactor was removed from the furnace hot zone and cooled to room temperature under a nitrogen atmosphere. Extremely voluminous TRG was wetted with methanol and dried for 48 hours in a vacuum oven. By this procedure, the volume of TRG was reduced more than ten times. Subsequently, the reduced graphene was heated under a nitrogen/hydrogen atmosphere (500 mL min−1 N2 and 500 mL min−1 H2). For this procedure, graphene was placed in a quartz glass reactor and inserted into the furnace preheated to 900 °C for 30 minutes. Then, graphene was cooled to room temperature under a nitrogen/hydrogen atmosphere.
Chemically reduced graphene denoted “CRG” was prepared by reduction with hydrazine hydrate. 1 g of graphite oxide was dispersed in 1 L of deionized water by ultrasonication (150 W, 60 minutes). The suspension was alkalized to pH 10 by 1 M KOH. 10 mL of hydrazine hydrate was added to the reaction mixture and the solution was kept under reflux for 24 hours. The obtained CRG was separated from the reaction mixture by suction filtration using a nylon membrane with 0.45 μm porosity. To remove the rest of the reaction products, graphene was repeatedly washed with deionized water and methanol. Prior to further use, CRG was dried in a vacuum oven at 60 °C for 48 hours.
Combustible elemental analysis (CHNS-O) was performed with a PE 2400 Series II CHNS/O Analyzer (Perkin Elmer, USA). In the CHN operating mode, the most robust and interference free mode, the instrument employs a classical combustion principle to convert the sample elements to simple gases (CO2, H2O and N2). The PE 2400 analyzer automatically performs combustion, reduction, homogenization, separation and detection of the gases. An MX5 (Mettler Toledo) microbalance was used for precise sample weighing (1.5–2.5 mg per single sample analysis). The accuracy of CHN determination is better than 0.30 abs%. Internal calibration was performed using N-phenyl urea.
High resolution X-ray photoelectron spectroscopy (XPS) was performed on an ESCAProbeP (Omicron Nanotechnology Ltd, Germany) spectrometer equipped with a monochromatic aluminum X-ray radiation source (1486.7 eV). A wide-scan survey with subsequent high-resolution scans of the C 1s core level of all elements was performed. The relative sensitivity factors were used in the evaluation of the carbon-to-oxygen (C/O) ratios from the survey spectra. Samples were attached to a conductive carrier made from a high purity silver bar.
An inVia Raman microscope (Renishaw, England) with a CCD detector was used for Raman spectroscopy in backscattering geometry. A Nd-YAG laser (532 nm, 50 mW) with 50× magnification objective was used for measurements. Instrument calibration was performed with a silicon reference which gives a peak centre at 520 cm−1 and a resolution of less than 1 cm−1. In order to avoid radiation damage, the laser power output used for this measurement was kept in the range of 0.5 mW to 25 mW. Prior to measurements, the samples were suspended in deionized water (concentration 1 mg mL−1) and ultrasonicated for 5 minutes. Then the suspension was deposited on a small piece of silicon wafer and dried.
All samples were analysed by X-ray powder diffraction (XRD). Data collection was done with a PANalytical X'Pert PRO diffractometer in Bragg–Brentano parafocusing geometry. CuKα radiation was used. Diffraction patterns were collected between 5° and 80° of 2θ. The obtained data were refined using the Rietveld method.
For the measurement of atomic force microscopy (AFM) images, the samples were suspended in isopropanol (1 mg mL−1) and ultrasonicated for 15 minutes (75 W). After sedimentation, the suspension of graphene was dropped on a freshly cleaved mica substrate. These measurements were carried out on an Ntegra Spectra from NT-MDT. The surface scans were performed in the tapping (semi-contact) mode. Cantilevers with a strain constant of 1.5 kN m−1 equipped with a standard silicon tip with curvature radius lower than 10 nm was used for all measurements.
Graphene was investigated by scanning electron microscopy (SEM) using a Tescan Lyra dual beam microscope with an FEG electron source with an accelerating voltage of 10 kV. Transmission electron microscopy using a scanning transmission electron (STEM) detector was performed on a Tescan Lyra dual beam microscope. An accelerating voltage of 30 kV was used for observations. A suspension of graphene with isopropanol (1 mg mL−1) was ultrasonicated for 15 minutes (75 W) before use. The bright field modes were used for imaging.
Neutron powder diffraction was performed on the instrument MEREDIT@NPI (Czech Republic) at room temperature. The studied samples were placed in a vanadium container with a diameter of 13 mm. The height of the neutron beam was adjusted for each sample individually. A neutron wavelength of 1.4618 Å was selected from the white beam by a mosaic copper monochromator. Diffraction patterns were collected between 4° and 144° of 2θ with a step of 0.08°. Structural refinements using the full pattern fitting method were performed using FullProf software.27 To determine the microstructural effects of the sample, instrument resolution function (IRF) describing the instrument contribution to the resolution was used. IRF was determined by fitting the diffraction pattern of the standard SiO2 powder with the same instrument setup.
The surface area was measured using a sorption analyser, Coulter SA 3100 (Backman Coulter). The samples were outgassed for 4 hours at 95 °C under high vacuum (VALUE) prior to the sorption experiments. The reason for such low temperature is to avoid degradation and further decomposition of oxygen functionalities, present mainly in CRG, on graphene. A TCD nitrogen cooled (77 K) detector was used for the evaluation of the results using BET and Kelvin equations.
Results and discussion
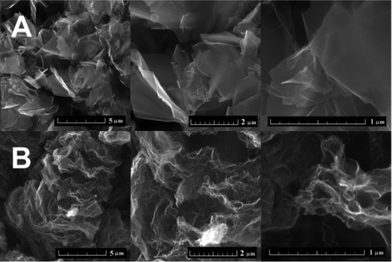
Chemically reduced graphene (CRG) and thermally reduced graphene (TRG) were prepared and analysed by a large number of analytic techniques to determine the average number of graphene layers and crystallite size. These techniques included SEM, TEM, AFM, Raman spectroscopy, BET, XPS, X-ray diffraction and neutron diffraction methods. Analysis of the full diffraction patterns was used to calculate essential parameters, such as interlayer spacing for a few layer graphene and the in-plane average carbon–carbon atomic distances.The morphology was investigated by SEM (Fig. 1). The typical differences between CRG and TRG were observed. CRG has a “platelet” microstructure with just minor wrinkling of graphene sheet edges. TRG has a dissimilar microstructure, composed of “worm-like” expanded structures originating from the graphite oxide expansion caused by thermal shock followed by gas evolution. Highly wrinkled morphology indicates a high concentration of structural defects. These materials exhibit a characteristic morphology observed by SEM; however, this gives only minor information about the number of layers and other structural properties.
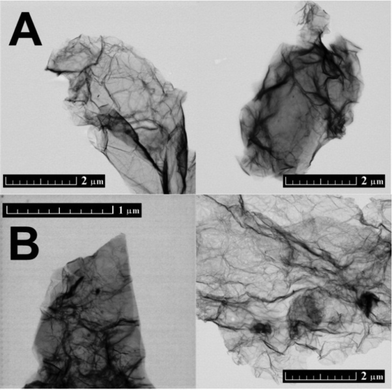
CRG and TRG were also analysed by STEM (Fig. 2). Similarly to SEM, highly wrinkled microstructure was observed on TRG. The main disadvantage of STEM is the fact that only a small area can be analysed. Moreover, samples have to be redispersed by ultrasonication before their positioning on the STEM grid. This procedure can reduce not only the size of graphene sheets but also the number of layers. Generally, microscopic techniques are not able to provide a general view of the microstructure since only a minor part of the sample is investigated.
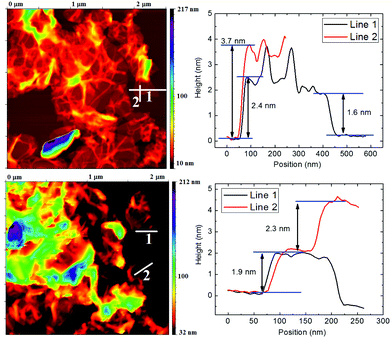
Comparable results to SEM and STEM were obtained by AFM microscopy. The AFM scan of TRG and CRG samples is shown in Fig. 3. The AFM microscopy has similar limitations to those of TEM/STEM where only a limited number of graphene sheets can be investigated and the sample is prepared for measurement by dropping the ultrasonicated solution. The dispergation by ultrasonication led to changes of the sample and further exfoliation and reduction of the particle size. The wrinkled structure of reduced graphene can also bring about a misinterpretation in terms of the number of layers observed on the sample. This is clearly documented by the height profile of the TRG sample for line 1 and line 2 in Fig. 3. Line 1 gives a height of 2.4 nm corresponding to two-layer graphene. On the line 2 we can see a height of 3.7 nm for the same sheet. This discrepancy originates from the wrinkled rim of graphene sheet.
Elemental combustible analysis was used to determine the concentration of C, H and N in both graphene materials. The concentration of oxygen was obtained by subtraction of C, H and N concentration from 100%. CRG showed a lower degree of reduction and the concentrations of C, O, H and N were 84.16 wt%, 14.16 wt%, 1.09 wt% and 0.59 wt%, respectively. TRG had a different composition, 93.16 wt% of C, 5.86% of O, 0.87 wt% of H and 0.11 wt% of N. Nitrogen present in the samples originated from the synthesis of the starting material – graphite oxide, and it is also introduced into CRG by reduction with hydrazine.
Further characterization was performed by X-ray photoelectron spectroscopy to determine the degree of oxygen functionalities removal while survey spectra were used to calculate the C/O ratios. Only oxygen (O 1s at 532.5 eV) and carbon (C 1s at 284.5 eV) without any contamination were detected (Fig. 4). Based on the survey spectra, we calculated the C/O ratio of 6.9 for CRG and 8.7 for TRG. Higher values of the C/O ratio are typical for TRG as the high temperature treatment is accompanied by a decomposition of oxygen functionalities. The high resolution C 1s spectra were used to identify various remaining oxygen functionalities (Fig. 4). Deconvolution of the C 1s peak was carried out for the position of the C![[double bond, length as m-dash]](https://www.rsc.org/images/entities/char_e001.gif) C bonds at 284.5 eV, C–C/C–H bonds at 285.4 eV, C–O bonds at 287.2 eV, C
C bonds at 284.5 eV, C–C/C–H bonds at 285.4 eV, C–O bonds at 287.2 eV, C![[double bond, length as m-dash]](https://www.rsc.org/images/entities/char_e001.gif) O bonds at 288.6 eV, O–C
O bonds at 288.6 eV, O–C![[double bond, length as m-dash]](https://www.rsc.org/images/entities/char_e001.gif) O bonds at 289.8 eV and π–π interactions at 290.5 eV. The obtained results are compiled in Table 1. To summarize the findings of the chemical analysis, we can conclude that CRG and TRG exhibit almost the same composition, with the TRG sample having a slightly higher degree of reduction.
O bonds at 289.8 eV and π–π interactions at 290.5 eV. The obtained results are compiled in Table 1. To summarize the findings of the chemical analysis, we can conclude that CRG and TRG exhibit almost the same composition, with the TRG sample having a slightly higher degree of reduction.
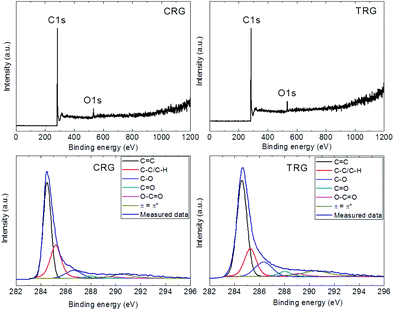 | ||
| Fig. 4 XPS survey spectra (top) and high-resolution XPS spectra of C 1s signal (bottom) of CRG (left) and TRG (right). | ||
C![[double bond, length as m-dash]](https://www.rsc.org/images/entities/char_e001.gif) C C |
C–C/C–H | C–O | C![[double bond, length as m-dash]](https://www.rsc.org/images/entities/char_e001.gif) O O |
O–C![[double bond, length as m-dash]](https://www.rsc.org/images/entities/char_e001.gif) O O |
π–π* | |
|---|---|---|---|---|---|---|
| CRG | 48.8 | 28.7 | 8.6 | 2.4 | 3.3 | 8.3 |
| TRG | 49.8 | 18.7 | 12.8 | 4.3 | 3.1 | 11.3 |
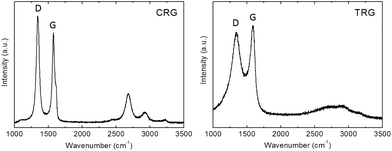
Raman spectroscopy was employed to study the structure quality and crystallite size. The Raman spectra (Fig. 5) showed two major bands located at 1580 cm−1 and 1340 cm−1. The G band at 1580 cm−1 corresponds to the vibration of carbon in trigonal coordination (sp2 hybridization) within the graphene layer while the D band located at 1340 cm−1 is associated with defects in the hexagonal graphene framework and with sp3 hybridized carbon atoms.28 Small differences in the D/G ratios indicate different structural quality. The D/G ratios of peak maxima are 1.17 for CRG and 0.93 for TRG. The average crystallite size (La) of CRG and TRG was calculated according to eqn (1):29
| La = 2.4 × 10⁻¹⁰ × λlaser4 × IG/ID | (1) |
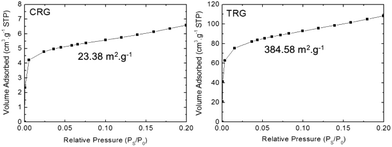
The average number of graphene layers can be also obtained by sorption techniques. The theoretical surface of a single-layer graphene is supposed to be 2630 m2 g−1. The average number of layers was obtained by dividing the theoretical value of surface area by the surface area of the investigated samples. Adsorption isotherms for both TRG and CRG are shown in Fig. 6. The surface areas 23.38 m2 g−1 and 384.58 m2 g−1 were found for CRG and TRG, respectively. That gives the corresponding average number of layers 115.5 for CRG and 9.5 for TRG. On the one hand, this method disregards the edges of graphene flakes but, on the other hand, the size of graphene sheets observed by STEM indicates only a minor ratio of the graphene edges surface to the overall graphene area. The most surprising results were observed for CRG where the surface area corresponds to more than 100 layers, which is far from reality. This can be explained by the stacking of graphene plates which exhibit only minimal wrinkling and strong interlayer interaction. We can conclude that this method is not suitable for graphene structure characterization and evaluation of the average number of graphene layers.
Finally, a detailed diffraction study of graphene using neutron and X-ray radiation was performed with the intention to understand the structural changes accompanying graphene formation. Pure graphite was also analysed for comparison. The advantage of using neutron diffraction in this particular case is that the structure form factor does not decrease with diffraction angle and, consequently, information from the high Q range (diffraction vector: Q = 4π![[thin space (1/6-em)]](https://www.rsc.org/images/entities/char_2009.gif) sin
sin![[thin space (1/6-em)]](https://www.rsc.org/images/entities/char_2009.gif) θ/λ) can be employed. Unfortunately, a larger amount of sample is necessary for neutron diffraction measurements.
θ/λ) can be employed. Unfortunately, a larger amount of sample is necessary for neutron diffraction measurements.
Colour coded normalized neutron diffraction patterns of graphite, CRG and TRG are shown in Fig. 7. It is evident that, in comparison with graphite, both graphenes show broader reflections, especially those related to the c axis. The integrated reflection intensity of graphenes decreases but the intensity at low angle (diffuse scattering) increases. This is due to the reduction of particle size and disruption of long range order. Comparing the neutron diffraction patterns we can conclude that CRG shows broader reflections 00l and those related to the c axis and narrower reflections associated with the ab plane (in the hexagonal layer) when compared to TRG, i.e. CRG is apparently composed of thinner but relatively large sheets whereas TRG has smaller but thicker hexagonal sheets.
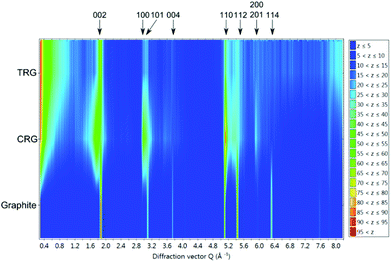 | ||
| Fig. 7 Colour coded normalized neutron diffraction patterns of graphite, CRG and TRG. The z scale indicates the normalized intensity. | ||
To describe the reflection profile and extract the size effect from it, an anisotropic size broadening model was applied. This model makes use of the Scherrer formula rewritten as a linear combination of spherical harmonics contributions.31 For the graphite structure (space group P63/mmc (194)) with Laue class 6/mmm this spherical harmonics expansion involves five refinable parameters. The contribution of size broadening to the profile of a particular hkl reflection is described by eqn (2):32
 | (2) |
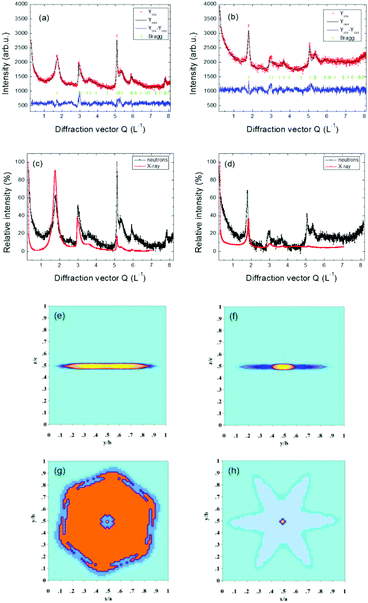
The same model for the size effect to the diffraction profile was also applied for the X-ray experiment. The measured and calculated neutron diffraction patterns using the described model for CRG and TRG and the reconstructed apparent particle shapes from refined C parameters (see eqn (2)) for both samples are shown in Fig. 8. X-ray diffraction patterns are very similar. In Fig. 8 the comparison of normalized neutron and X-ray diffraction patterns of CRG and TRG is also shown manifesting the profound information gain acquired from the high Q values of the neutron diffraction pattern.
The values of apparent sizes calculated from the selected reflections from neutron and X-ray diffraction patterns are given in Table 2 for CRG and TRG. Carbon–carbon interatomic distances in and between hexagonal planes are listed in Table 3. Taking into account the interplanar distances along with the apparent particle size we can estimate the corresponding number of hexagonal graphene layers stacked in the <00l> direction. For CRG we found about 3 to 4 layers while for TRG 9 to 10 layers were typically identified. The results along the c axis are similar for both neutron and X-ray diffraction. However, concerning the particle size along the <h00> direction there are substantial differences between neutron and X-ray results. This can be due to the fact that neutron diffraction data bear more information for high Q reflections predominantly incident on the ab plane, and can thus bring more accurate results (see Fig. 8). Considering the results from neutron diffraction the apparent particle size in the <h00> direction is about 250 Å for CRG and about 100 Å for TRG.
| Reflection | Apparent sizes of CRG (Å) | Apparent sizes of TRG (Å) | ||
|---|---|---|---|---|
| ND | XRD | ND | XRD | |
| 002 | 13.21 | 14.8 | 38.12 | 28.55 |
| 100 | 248.71 | 132.76 | 90.39 | 87.71 |
| 101 | 17.69 | 18.68 | 15.35 | 19.78 |
| 102 | 7.24 | 7.26 | 7.35 | 9.22 |
| 004 | 12.76 | 13.52 | 31.39 | 28.11 |
| 103 | 5.52 | 5.74 | 6.15 | 7.5 |
| 110 | 86.23 | 40.41 | 50.04 | 22.93 |
| 112 | 13.95 | 12.67 | 13.55 | 12.27 |
| 200 | 642.06 | 126.84 | 174.14 | 87.71 |
| Neutron diffraction | |||
|---|---|---|---|
| Carbon–carbon (Å) | Graphite | CRG | TRG |
| Within the hexagon layer | 1.42507(2) | 1.4266(2) | 1.4333(5) |
| Between hexagon layers | 3.3668(2) | 3.638(3) | 3.530(3) |
| XRD | |||
|---|---|---|---|
| Carbon–carbon (Å) | Graphite | CRG | TRG |
| Within the hexagon layer | 1.4204(9) | 1.4231(1) | 1.4294(3) |
| between hexagon layers | 3.3580(3) | 3.6269(9) | 3.4928(9) |
The comparison of carbon–carbon distances in graphite and graphenes revealed a significant increase of the in-plane interatomic distance in TRG. Two effects are responsible for this increase, namely the formation of out of plane C–O bonds and the defects formation in the graphene network. During the thermal and chemical reduction of graphite oxide, a large amount of functional groups is removed and the structure becomes restored. The reduction is brought about a decrease of horizontal in-plane interatomic distances. Due to defects and the remaining oxygen functionalities, the lattice parameters of CRG and TRG are not reaching those of graphite. The defects led to formation of rings containing 5 or 7 carbon atoms and invoked the tilting of planar graphene sheets. This is the origin of the graphene wrinkling observed in AFM and STEM pictures. As clearly seen from Table 4 the presence of defects results in an increase of average in-plane carbon–carbon atomic distances.
| CRG | TRG | |
|---|---|---|
| Lateral size – neutron diffraction (nm) | 25 | 9 |
| Lateral size – XRD (nm) | 13 | 9 |
| Lateral size – Raman spectroscopy (nm) | 16.4 | 20.7 |
| The number of layers – BET | 115 | 9–10 |
| The number of layers – neutron diffraction | 3–4 | 10 |
| The number of layers – XRD | 3–4 | 8 |
Finally, we compared the crystallite sizes and the number of layers obtained by various methods (Table 4). We can conclude that XRD and neutron diffraction provided the most valuable information on the number of layers. Differences in the number of layers obtained by BET originate from the restored interlayer interactions and subsequent reduction of surface area available for nitrogen absorption which is used as a measure of apparent surface area. In the case of TRG such an effect does not exist owing to the higher concentration of defects which invoke substantial wrinkling of graphene sheets and inhibit the recovery of interlayer interactions. The differences in lateral size observed by Raman spectroscopy give different values when compared to diffraction techniques. The crystallite size calculated from the D/G ratio in Raman spectra is strongly influenced by other factors such as the concentration of remaining oxygen functionalities which increase the intensity of the D-band due to sp3 hybridization of the involved carbon atoms.
Conclusions
We investigated the composition, grain size and the number of layers of graphene using microscopic techniques, such as SEM, TEM, AFM or Raman spectroscopy, as well as bulk techniques such as BET, X-ray diffraction and neutron diffraction. We demonstrated major advantages of neutron and X-ray diffraction for structural investigations of bulk amounts of graphene. Compared to various microscopic techniques, including SEM and STEM, diffraction methods can give overall information about the graphene microstructure, namely the average number of layers and the lateral crystallite size. The data obtained from X-ray and neutron diffraction were also confronted with other techniques, BET adsorption analysis and Raman spectroscopy. The Raman signal is usually influenced by the presence of remaining functional groups and defects in the graphene structure. When compared to BET analysis, the number of layers obtained by diffraction methods was in good agreement only for TRG. The significant differences found in the case of CRG are related to strong interactions between the graphene layers which considerably reduce the surface area available for nitrogen adsorption. We believe that X-ray and neutron diffraction are the most suitable methods for the evaluation of the number of graphene layers and crystallite size. Such methods do not require any sample preparation based on dispersing in solvents invoking changes in graphene structure. The use of proposed X-ray and neutron diffraction techniques is crucial for large scale (industrial) characterization of graphene materials as they are the only methods capable of providing accurate information on the thickness and lateral size of graphene sheets on the bulk scale.Acknowledgements
Z.S., P.Š., D.S. and O.J. acknowledge financial support from specific university research (MSMT no. 20/2014). M.P. acknowledges Tier 2 grant (MOE2013-T2-1-056; ARC 35/13) from the Ministry of Education, Singapore. P.B. acknowledges support from the infrastructure CANAM of the NPI ASCR Řež supported through MŠMT project no. LM2011019.Notes and references
- A. K. Geim and K. S. Novoselov, Nat. Mater., 2007, 6, 183–191 CrossRef CAS PubMed.
- J.-H. Chen, C. Jang, S. Xiao, M. Ishigami and M. S. Fuhrer, Nat. Nanotechnol., 2008, 3, 206–209 CrossRef CAS PubMed.
- Y. Fan, L. Wang, J. Li, J. Li, S. Sun, F. Chen, L. Chen and W. Jiang, Carbon, 2010, 48, 1743–1749 CrossRef CAS PubMed.
- K. S. Kim, Y. Zhao, H. Jang, S. Y. Lee, J. M. Kim, K. S. Kim, J. H. Ahn, P. Kim, J. Y. Choi and B. H. Hong, Nature, 2009, 457, 706–710 CrossRef CAS PubMed.
- A. Bonanni, A. H. Loo and M. Pumera, TrAC, Trends Anal. Chem., 2010, 29, 954–965 CrossRef PubMed.
- O. Jankovsky, P. Simek, D. Sedmidubsky, S. Huber, M. Pumera and Z. Sofer, RSC Adv., 2014, 4, 7418–7424 RSC.
- O. Jankovsky, P. Simek, D. Sedmidubsky, S. Matejkova, Z. Janousek, F. Sembera, M. Pumera and Z. Sofer, RSC Adv., 2014, 4, 1378–1387 RSC.
- S. Bae, H. Kim, Y. Lee, X. Xu, J. S. Park, Y. Zheng, J. Balakrishnan, T. Lei, H. Ri Kim, Y. I. Song, Y. J. Kim, K. S. Kim, B. Özyilmaz, J. H. Ahn, B. H. Hong and S. Iijima, Nat. Nanotechnol., 2010, 5, 574–578 CrossRef CAS PubMed.
- L. Staudenmaier, Ber. Dtsch. Chem. Ges., 1898, 31, 1481–1487 CrossRef CAS.
- W. Hummers and R. Offeman, J. Am. Chem. Soc., 1958, 80, 1339–1339 CrossRef CAS.
- B. C. Brodie, Ann. Chim. Phys., 1860, 1860, 466–472 Search PubMed.
- Z. Sofer, P. Simek and M. Pumera, Phys. Chem. Chem. Phys., 2013, 15, 9257–9264 RSC.
- U. Hofmann and A. Frenzel, Kolloidn. Zh., 1934, 68, 149–151 CAS.
- S. Park, J. An, J. R. Potts, A. Velamakanni, S. Murali and R. S. Ruoff, Carbon, 2011, 49, 3019–3023 CrossRef CAS PubMed.
- C. K. Chua and M. Pumera, J. Mater. Chem. A, 2013, 1, 1892–1898 CAS.
- A. Ambrosi, C. K. Chua, A. Bonanni and M. Pumera, Chem. Mater., 2012, 24, 2292–2298 CrossRef CAS.
- C. K. Chua and M. Pumera, Chem. Soc. Rev., 2014, 43, 291–312 RSC.
- X. Mei and J. Ouyang, Carbon, 2011, 49, 5389–5397 CrossRef CAS PubMed.
- Z.-J. Fan, W. Kai, J. Yan, T. Wei, L.-J. Zhi, J. Feng, Y.-m. Ren, L.-P. Song and F. Wei, ACS Nano, 2010, 5, 191–198 CrossRef PubMed.
- Z. Sofer, O. Jankovský, P. Šimek, L. Soferová, D. Sedmidubský and M. Pumera, Nanoscale, 2014, 6, 2153–2160 RSC.
- J. C. Meyer, A. K. Geim, M. I. Katsnelson, K. S. Novoselov, T. J. Booth and S. Roth, Nature, 2007, 446, 60–63 CrossRef CAS PubMed.
- M. J. McAllister, J.-L. Li, D. H. Adamson, H. C. Schniepp, A. A. Abdala, J. Liu, M. Herrera-Alonso, D. L. Milius, R. Car, R. K. Prud'homme and I. A. Aksay, Chem. Mater., 2007, 19, 4396–4404 CrossRef CAS.
- C. Gómez-Navarro, R. T. Weitz, A. M. Bittner, M. Scolari, A. Mews, M. Burghard and K. Kern, Nano Lett., 2007, 7, 3499–3503 CrossRef PubMed.
- H. C. Schniepp, J.-L. Li, M. J. McAllister, H. Sai, M. Herrera-Alonso, D. H. Adamson, R. K. Prud'homme, R. Car, D. A. Saville and I. A. Aksay, J. Phys. Chem. B, 2006, 110, 8535–8539 CrossRef CAS PubMed.
- G. Wang, J. Yang, J. Park, X. Gou, B. Wang, H. Liu and J. Yao, J. Phys. Chem. C, 2008, 112, 8192–8195 CAS.
- F. Banhart, J. Kotakoski and A. V. Krasheninnikov, ACS Nano, 2010, 5, 26–41 CrossRef PubMed.
- J. Rodríguez-Carvajal, Phys. Rev. B: Condens. Matter, 1993, 192, 55–69 CrossRef.
- M. S. Dresselhaus, A. Jorio, M. Hofmann, G. Dresselhaus and R. Saito, Nano Lett., 2010, 10, 751–758 CrossRef CAS PubMed.
- L. G. Cancado, K. Takai, T. Enoki, M. Endo, Y. A. Kim, H. Mizusaki, A. Jorio, L. N. Coelho, R. Magalhaes-Paniago and M. A. Pimenta, Appl. Phys. Lett., 2006, 88, 163106 CrossRef PubMed.
- J. M. Englert, C. Dotzer, G. Yang, M. Schmid, C. Papp, J. M. Gottfried, H.-P. Steinrueck, E. Spiecker, F. Hauke and A. Hirsch, Nat. Chem., 2011, 3, 279–286 CrossRef CAS PubMed.
- P. Scherrer, Gött. Nachr. Ges., 1918, 2, 98–100 Search PubMed.
- M. Jarvinen, J. Appl. Crystallogr., 1993, 26, 525–531 CrossRef CAS.
| This journal is © The Royal Society of Chemistry 2014 |

