
 Open Access Article
 This Open Access Article is licensed under a
 Creative Commons Attribution 3.0 Unported Licence
Toehold-mediated internal control to probe the near-field interaction between the metallic nanoparticle and the fluorophore†
Y. S.
Ang
and
L. Y. L.
Yung
*
Department of Chemical and Biomolecular Engineering, National University of Singapore, 10 Kent Ridge Crescent, Singapore 11920, Singapore. E-mail: cheyly@nus.edu.sg
First published on 2nd September 2014
Abstract
Metallic nanoparticles (MNPs) are known to alter the emission of vicinal fluorophores through the near-field interaction, leading to either fluorescence quenching or enhancement. Much ambiguity remains in the experimental outcome of such a near-field interaction, particularly for bulk colloidal solution. It is hypothesized that the strong far-field interference from the inner filter effect of the MNPs could mask the true near-field MNP–fluorophore interaction significantly. Thus, in this work, a reliable internal control capable of decoupling the near-field interaction from far-field interference is established by the use of the DNA toehold concept to mediate the in situ assembly and disassembly of the MNP–fluorophore conjugate. A model gold nanoparticle (AuNP)–Cy3 system is used to investigate our proposed toehold-mediated internal control system. The maximum fluorescence enhancement is obtained for large-sized AuNP (58 nm) separated from Cy3 at an intermediate distance of 6.8 nm, while fluorescence quenching is observed for smaller-sized AuNP (11 nm and 23 nm), which is in agreement with the theoretical values reported in the literature. This work shows that the toehold-mediated internal control design can serve as a central system for evaluating the near-field interaction of other MNP–fluorophore combinations and facilitate the rational design of specific MNP–fluorophore systems for various applications.
Introduction
The use of metallic nanoparticles (MNP) to modify the emission of vicinal fluorophores has gained much interest in recent years1 since the ability to enhance the inherent fluorescence brightness can have profound impact on diverse fields utilizing fluorescence-based measurements and devices, such as materials science,2 molecular detection3 and medical imaging.4 The physical origin of metal enhanced fluorescence (or MEF) lies in the near-field interaction between the surface plasmon, i.e. collective oscillation of electrons, of the MNP and the dipolar fluorophore.5 There are three main effects from the near-field interaction, namely concentrating the incident light reaching the fluorophore, increasing the optical states available for spontaneous emission of light and providing an additional non-radiative energy transfer pathway.The first two effects facilitate fluorescence enhancement through the mechanism of excitation and emission enhancement respectively, while the third factor leads to fluorescence quenching.6 Such a complex interplay of conflicting processes renders it challenging to predict the exact outcome of the MNP–fluorophore interaction. Much ambiguity remains in this field on whether a particular MNP enhances7–10 or quenches11–13 fluorescence or both.14,15 While the reported observations for substrate-based fluorescence enhancement or quenching are largely consistent with the literature and with theoretical understanding,16,17 it is acknowledged that the enhancement in bulk colloidal solution is difficult to reproduce without ambiguity.5
We identified the following experimental challenges in obtaining consistent observations of fluorescence enhancement or quenching in a colloidal system: (i) difficulty in separating nanoparticle-bound fluorophores from the unbound ones, and this is closely related to (ii) the difficulty in establishing a reliable control set-up to measure the baseline fluorescence intensity, (iii) far-field interference due to the large absorption cross-section of MNP and (iv) difficulty in controlling well-defined nanoparticle assemblies in the solution phase and therefore the formation of non-specific “hot spots”.
Different strategies have been employed by various groups to address the first and second challenges though not without their own limitations. The separation method of choice is centrifugation from which the equivalent amount of fluorophore to use in the control experiment is typically estimated from the amount of unbound fluorophore in the supernatant.7,8 However, this method is prone to large error margin. Others have tried to avoid using a separate control by adding exogenous chemicals, such as cyanide etching for gold, to the reaction mixture to remove the MNP and establish the baseline fluorescence level.18 Such chemical treatments could alter the physiochemical environment of the fluorophore. For both strategies, the MNP–fluorophore and reference fluorophore are in different photophysical environments since the MNP is completely eliminated from the control set-up.
This brings the spotlight to the third challenge – despite the greater scientific significance, the development of a general approach to account for this far-field interference experimentally remains relatively unexplored. Since the extinction coefficient of MNPs is typically 3–5 orders of magnitude larger than that of a fluorophore, MNPs can exert substantial interference, i.e. the attenuation of the incident light and re-absorption of light emitted by the fluorophore, or commonly known as the inner filter effect (Fig. 1a).19 We further noted that reports of colloidal metal-enhanced fluorescence are typically accompanied by a conscious effort to work with extremely low nanoparticle concentration of ca. 107–1010 particles mL−1 to minimize the inner filter effect.8,20,21 To the best of our knowledge, there has only been one report thus far by Baptista and coworkers which rigorously ensures that the reference fluorophore remains in the same optical condition as the MNP–fluorophore to probe their near-field interaction accurately.22 Their approach to correct for the inner filter effect in the control is to incubate a separate set of MNPs with an equivalent amount of fluorophore lacking the functional group for direct chemical attachment. However, this falls short of being a general methodology as it could be difficult to find alternative forms of other fluorophores both with and without binding affinity to the MNP. Moreover, the uncertainty of quantifying an “equivalent” amount of fluorophore to use in the control still remains. There is therefore a need to design an internal control that inherently accounts for the inner filter effect in order to assess the near-field interaction between MNPs and the fluorophore more accurately.
 | ||
| Fig. 1 (a) Typical fluorescence enhancement measurements are compared with control set-ups with an equivalent amount of fluorophore in the absence of metallic nanoparticles (MNPs) which fail to take into account the strong inner filter effect by the MNPs. Our proposed toehold-mediated internal control aims to decouple the true near-field influence of MNPs from the inner filter effect on the fluorophore. This was achieved by the in situ removal of the fluorophore from the MNPs via DNA hybridization within the same reaction volume, thereby establishing an internal control experiencing the same extent of the inner filter effect. (b) Dynamic, in situ assembly and disassembly of the MNP–fluorophore conjugate were achieved via DNA hybridization and toehold-mediated strand removal respectively. In step 1, thiolated DNA (SH) hybridized with Cy3-tagged DNA (C3) via the complementary domain b to form a SH–C3 complex. The MNP and fluorophore was separated at a distance defined by the length of domain a. In step 2, a fully complementary strand (CS) next bound to and removed C3 from the SH–C3 complex via the toehold overhang (domain t). This effectively removed the fluorophore from the near-field influence of the MNPs and the final mixture served as the control set-up for establishing the baseline fluorescence level. | ||
This motivates us to use the concept of DNA toehold to trigger the dynamic assembly and disassembly of a MNP–fluorophore conjugate within the same reaction volume to decouple true near-field interaction from interference by the inner filter effect (Fig. 1b). Toehold refers to a short single-stranded DNA overhang that can bind to a complementary sequence and trigger the strand displacement process to exchange single-stranded DNA amongst double-stranded complexes.23 Our proposed strategy ensures that the MNP–fluorophore conjugate and reference fluorophore (internal control) remain in the same photophysical environment since the disassembly process occurs in situ within the same reaction volume. This also facilitates the ease of separating the bound and unbound fluorophore without the need for an explicit quantification of the bound fluorophore. We can control the attachment of the fluorophore to or its removal from the MNP via simple DNA hybridization or dehybridization without stringent requirement on the chemical structure of the fluorophore, rendering this as a general approach towards the design of an internal control for future MNP–fluorophore studies. The rational design of DNA sequences can also confer high colloidal stability to the MNP and ensure that they exist as single-particle entities in solution thereby addressing the final challenge of controlling the formation of well-defined MNP–fluorophore assembly.
The findings from this work can potentially be applied for biosensing, in particular, the nanoflare system where fluorescent dyes are displaced from the nanoparticle–DNA conjugates in the presence of target DNA or RNA.24 The guidelines here may inspire future nanoflare designs to achieve a more drastic fluorescent “turn-on” signal and hence improve the detection sensitivity.
Results and discussion
DNA toehold design to mediate dynamic MNP–fluorophore assembly/disassembly
DNA is a commonly-used spacer to link metallic nanoparticles (MNPs) and the fluorophore at a well-defined separation distance.25 Recently, Acuna and coworkers have utilized design rules in DNA origami to organize MNPs and fluorophores into discrete assemblies with nanometer precision.26,27 This serves as an elegant tool to study the fluorescence enhancement or quenching phenomenon at the single molecule level and provides valuable insights into the science underlying the MNP–fluorophore interaction. However, single molecule measurements do not necessarily sum up to the bulk observation due to complications such as the inner filter effect. Instead of using DNA just for its structural precision, we leveraged upon the non-equilibrium state of Watson–Crick base pairing to control the dynamic assembly or disassembly of the MNP–fluorophore conjugate, which served as a reliable internal control crucial for the more accurate evaluation of the MNP–fluorophore near-field interaction in colloidal solution (Fig. 1b).Two sets of DNA, i.e. 50 nt thiolated DNA (SH) and Cy3-tagged DNA (C3), with a complementary sequence (domain b) were designed to link the MNP and fluorophore at a fixed separation distance (domain a) via DNA hybridization. The length of domain a was varied to achieve three separation distances of 10 nt (10C3), 20 nt (20C3) and 29 nt (29C3). The length of domain b was adjusted accordingly such that the length of the SH strand was kept constant at 50 nt. A fully complementary strand (CS) was designed to remove C3 from SH via a 6 nt toehold sequence (domain t). Three CS strands corresponding to each C3 strand were designed, i.e. 10CS, 20CS, 29CS. This facilitated the dynamic disassembly of the MNP–fluorophore complex and effectively removed the fluorophore from the near-field influence of the MNP in situ. The actual DNA sequences were designed using the Nupack web server28 to have no predictable secondary structures (Table S1†). This ensured that the DNA strands assumed a fully stretched conformation on the AuNP surface for maximal DNA hybridization and toehold removal efficiency.
The feasibility of the DNA circuit designed was evaluated by polyacrylamide gel electrophoresis (PAGE) (Fig. 2). An equimolar amount of SH (lane 2) and C3 (lane 3) was found to hybridize with ca. 100% efficiency to form the SH–C3 complex (lane 4). CS (lane 5) was then added to the SH–C3 complex at two loading ratios of 1![[thin space (1/6-em)]](https://www.rsc.org/images/entities/char_2009.gif) :1 (lane 7) and 2:1 (lane 8) to form C3–CS (lane 6) and SH. The band corresponding to the SH–C3 complex became faint at 1:1 loading ratio and was completely exhausted at 2:1 loading ratio, demonstrating that the enthalpic gain from an additional 6 bp in the C3–CS complex is a sufficient driving force in ensuring the C3–CS complex being the dominant species over the SH–C3 complex at equilibrium.
:1 (lane 7) and 2:1 (lane 8) to form C3–CS (lane 6) and SH. The band corresponding to the SH–C3 complex became faint at 1:1 loading ratio and was completely exhausted at 2:1 loading ratio, demonstrating that the enthalpic gain from an additional 6 bp in the C3–CS complex is a sufficient driving force in ensuring the C3–CS complex being the dominant species over the SH–C3 complex at equilibrium.
 | ||
| Fig. 2 12% PAGE to evaluate the efficiency of DNA hybridization and toehold-mediated fluorophore removal (order of lane no. from left to right). In the first step of DNA hybridization, 1 μM of thiolated DNA (SH) (lane 2) and 1 μM of Cy3-tagged DNA (C3) (lane 3) was mixed in a 1:1 molar ratio to form the SH–C3 complex (lane 4) with ca. 100% yield. In the second step, complementary strand (CS) was added to trigger the toehold removal of C3 from the SH–C3 complex in 1:1 (lane 7) and 1:2 (lane 8) molar ratios. Lanes 5 and 6 correspond to 1 μM of CS and 1 μM of pre-annealed CS–C3 complex respectively. The set of C3 and CS used in this PAGE analysis represented the separation distance of 10 nt, i.e. 10C3 and 10CS, with the corresponding sequence length of 46 nt each. Note that SH (50 nt) and C3–CS complex (46 bp) migrated at a similar rate by comparing lanes 2 and 6, making the product bands (consisting both SH and C3–CS) of the toehold removal step not differentiable. Lanes 1 and 9 correspond to 10–300 bp DNA ladder. Note that the gel analysis was carried out on pure DNA species without MNPs. | ||
Adapting toehold design on the MNP–fluorophore system
The validated DNA toehold design was adapted to a model MNP–fluorophore system (Fig. 3a). Gold nanoparticles (AuNPs) were used in this study due to their more ambiguous contribution towards fluorescence quenching or enhancement than silver nanoparticles.5 A larger-sized AuNP system was chosen due to its larger scattering cross-section which can facilitate the radiation of emission to the far field and is theoretically more likely to induce metal-enhanced fluorescence.5 A monodispersed quasi-spherical AuNP sample with an average diameter of 57.8 ± 4.2 nm was synthesized (Fig. 3b and S1†) by citrate reduction according to a reported protocol.29 The SH strand was conjugated onto the AuNP via a slow salt-ageing process30 to achieve a high DNA density of ca. 684 strands per particle which is close to the reported value of 640 strands per particle for full surface coverage.31 DNA attached onto the AuNP remained functional as indicated by the ability to hybridize to the partially complementary C3 strand with a reasonable hybridization efficiency of ca. 30%. It should be noted that it is difficult to achieve high hybridization efficiency for a high local concentration of DNA on the AuNP due to steric hindrance and strong electrostatic repulsion.32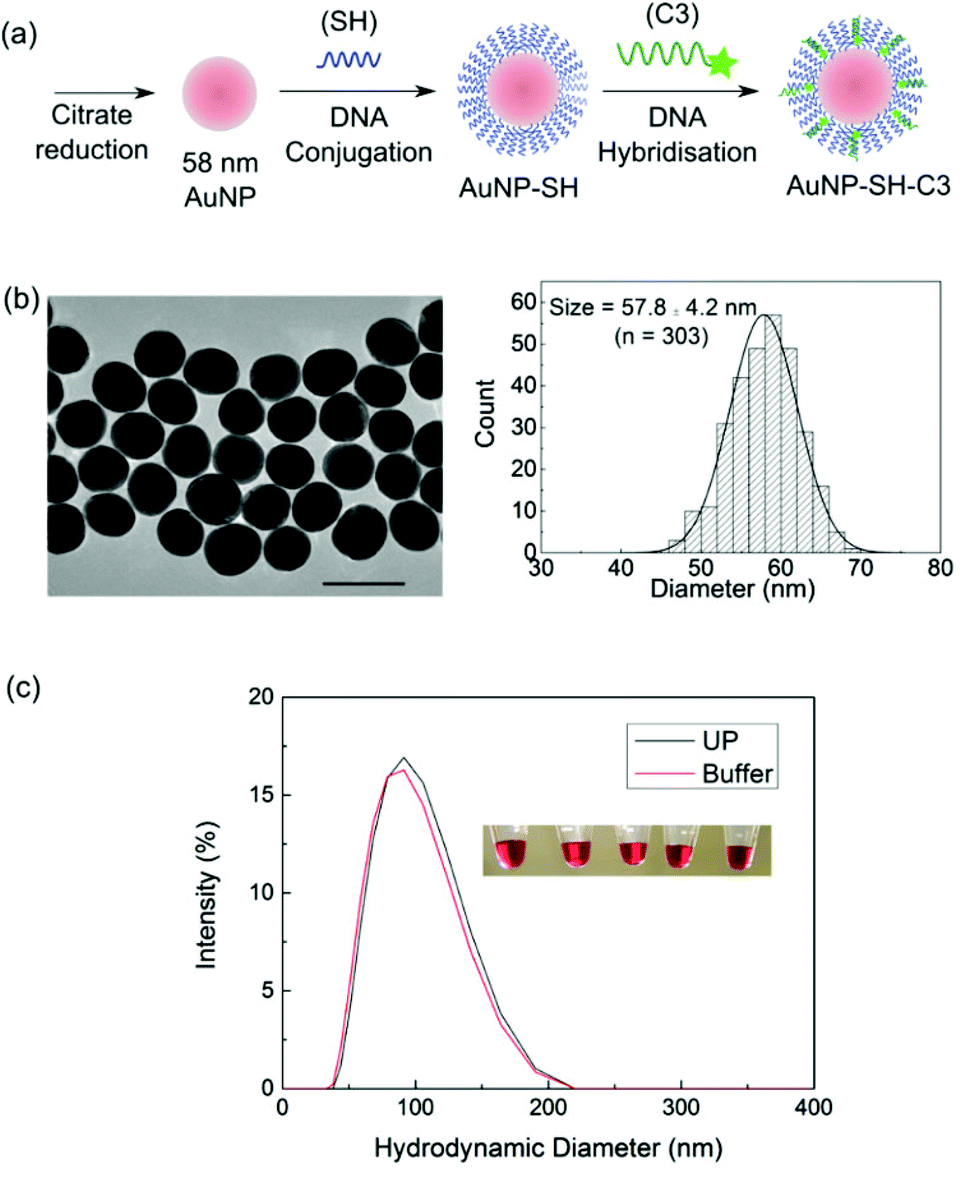 | ||
| Fig. 3 (a) A model AuNP–fluorophore system to evaluate the performance of the toehold-mediated internal control. 58 nm AuNP was synthesized using an established citrate reduction protocol which was then functionalized with a dense shell of thiolated DNA (SH) via the slow salt ageing process. The Cy3-tagged DNA (C3) strand was then hybridized to the AuNP–SH probe to form the MNP–fluorophore system. The steps of synthesis and functionalized were then characterized. (b) Transmission electron microscopy (TEM) image of the as-synthesized AuNP. Scale bar shown is 100 nm. A fairly homogeneous particle population with size distribution of 57.8 ± 4.2 nm was obtained (n = 303) (right). (c) Dynamic light scattering measurement of the hydrodynamic diameter of the AuNP–SH probes in ultrapure water (UP, black) and buffer solution (red). No aggregation was observed even at high salt concentration used during hybridization. (Inset) Digicam images of the purified AuNP–SH probes dispersed in buffer solution exhibited a ruby red colour. | ||
The colloidal stability of the AuNP–SH probe was validated by dynamic light scattering (DLS) in both the high salt hybridization buffer (10 mM phosphate buffer (pH 7.5), 300 mM NaCl, 1.0 mM MgCl2, 10 mM KCl) and ultrapure water (UP) (Fig. 3c). The lack of aggregation peak or appreciable peak shift ensured that the system was free of larger-sized aggregates. This is important since “hot spots” formed by aggregates are known to generate a highly concentrated localized electromagnetic field with larger fluorescence enhancement potential which could complicate the result interpretation.33,34 It is worth mentioning that the AuNP–SH probes could withstand a salt concentration up to 0.6 M NaCl (probes were not challenged at higher salt concentrations) without the use of surfactants, which is rare for such large-sized AuNP. This highlights the importance of careful DNA sequence design in particle stability in general for future related work on nanoparticle–DNA systems.
Decoupling near-field MNP–fluorophore interaction from the inner filter effect
DNA hybridization and the subsequent toehold-mediated fluorophore removal were carried out sequentially on the AuNP–SH system to probe for the true near-field MNP–fluorophore interaction (Fig. 4a). The Cy3 fluorophore was chosen to tag the C3 strand due to the large extent of spectral overlap of Cy3 with the absorption spectrum of the 58 nm AuNP (Fig. 4b). The maximum fluorescence enhancement is known to occur when the localized surface plasmon resonance (LSPR) peak is slightly blue-shifted from the fluorophore emission peak.35 A near-100% overlap between the absorption spectra of both AuNP and C3 suggests the possibility of excitation enhancement on the fluorophore emission. | ||
| Fig. 4 (a) Schematic outline of the hybridization of Cy3-tagged DNA (C3) to gold nanoparticle–DNA (AuNP–SH) probes and the subsequent removal of C3 from the AuNP–SH–C3 complex using a complementary strand (CS) to decouple the near-field influence of AuNP on Cy3 from the inner filter effect. (b) Normalized extinction (solid) and emission (dotted) spectrum of C3 (black) and 58 nm AuNP (red). A large extent of spectral overlap between AuNP and C3 should facilitate the near-field interaction. (c) The temporal profile of the C3 photoluminescence (PL) intensity. There was a slight dip in the PL intensity when the AuNP–SH probe was added in the first step of DNA hybridization (from blue dashed line to red dashed line) which could have led to an apparent observation of quenching. The PL intensity dropped further over time when CS was added (at t = 0) for the toehold removal of C3 from the near field influence of AuNP to obtain a final mixture of C3–CS and AuNP–SH. | ||
The temporal profile of the C3 PL intensity at various steps of addition is shown in Fig. 4c. A 5% dip in the PL intensity was observed initially when the AuNP–SH probe was added to pure C3. After adding CS, C3 was removed from the near-field influence of the AuNP via the toehold sequence while remaining in the same reaction mixture, i.e. experiencing the same inner filter effect condition as the AuNP–SH–C3 complex. The PL intensity of the C3–CS and AuNP–SH mixture dropped further over time to ca. 50% of that measured for the AuNP–SH–C3 complex at equilibrium, suggesting that the fluorescence of C3 was enhanced approximately twofold when in close proximity to the AuNP. All PL intensity measured over time was adjusted to take into account the effect of photobleaching (Fig. S2†). Thus, the difference between the final PL intensity and the initial PL intensity of pure C3 can be unambiguously attributed to the inner filter effect by AuNP as its physical inclusion was the only variable in the system. This suggests that the strong inner filter effect, especially at higher nanoparticle concentrations, can mask a comparatively weaker fluorescence enhancement to give an apparent conclusion of quenching.
Effect of the separation distance on the MNP–fluorophore interaction
Having confirmed the feasibility of using a DNA toehold design to control the assembly and disassembly between AuNP and C3, we studied the effect of the separation distance between the MNP and the fluorophore on the fluorescence enhancement factor (EF) (Fig. 5a). EF is defined as the ratio of the PL intensity before the addition of CS, which accounts for both near-field interaction and inner filter effect, to that after the addition of CS, which only accounts for the inner filter effect (Fig. 1a). Three separation distances of 3.4 nm, 6.8 nm and 9.9 nm were used in this proof-of-concept study. It is worth noting that a 9 nt spacing was used for the longest separation distance (9.9 nm) instead of the 10 nt spacing used in other two cases to avoid guanine quenching.36Fig. 5b shows the kinetics of the toehold-mediated MNP–fluorophore disassembly process which reached equilibrium within 30 min for all separation distances. Comparing the EF at 30 min for the three cases showed that the fluorescence enhancement was dependent on the separation distance between the AuNP and the Cy3 fluorophore with a maximum EF of 2 obtained at an intermediate separation distance of ca. 6.8 nm (Fig. 5c). This general trend was in line with that observed in the literature.37 At a shorter separation distance, non-radiative decay is the dominant energy transfer pathway. As the separation distance increases further, the electromagnetic field intensity becomes weaker and the effect of excitation enhancement is reduced. We further verified that the fluorescence enhancement was not due to the formation of AuNP aggregates in the high-salt hybridization buffer by characterizing the size distribution of the AuNP–SH–C3 complex by nanoparticle tracking analysis (NTA) (Fig. S3†).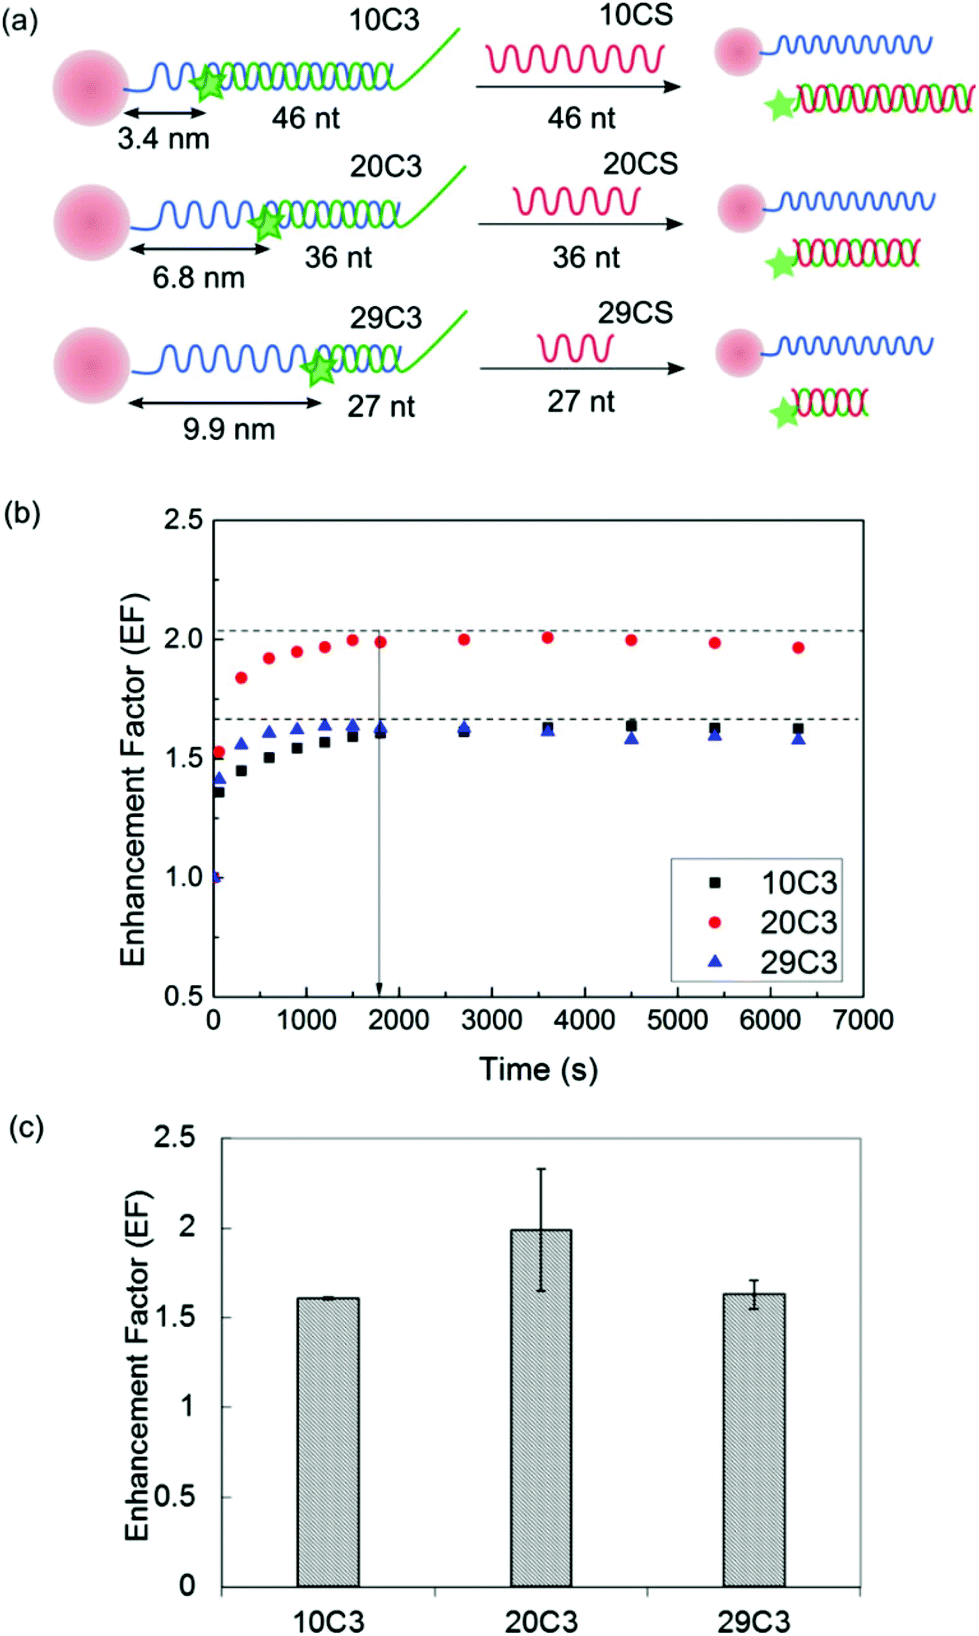 | ||
| Fig. 5 (a) DNA was used as a spacer to separate Cy3 (tagged on C3) from AuNP at three distances, i.e. 3.4 nm (10C3), 6.8 nm (20C3) and 9.9 nm (29C3). A perfectly complementary strand (CS) for each separation distance, i.e. 10CS, 20CS and 29CS, was designed to remove their C3 counterpart from the near-field influence of AuNP. (b) The toehold-mediated strand displacement process reached an equilibrium (black dotted line was added to guide the eye) within 30 min. (c) The enhancement factor (EF) was dependent on the separation distance between the AuNP and Cy3 fluorophore, with a maximum EF of approximately 2 obtained at an intermediate separation distance of 20 nt (ca. 6.4 nm). All data shown are mean ± standard deviation (n = 4). | ||
Effect of the nanoparticle size on the MNP–fluorophore interaction
The optical properties of an AuNP consist of two components, i.e. absorption and scattering.38 The absorption component contributes towards quenching and scales to the power of three of the nanoparticle size. The scattering component contributes towards enhancement and scales to the power of six of the nanoparticle size. Thus, a larger AuNP (>40 nm39) with a larger scattering-to-absorption ratio40 is expected to enhance nearby fluorophore emission, while smaller AuNP should instead quench fluorescence. Having demonstrated fluorescence enhancement with a larger 58 nm AuNP using our toehold-mediated internal control design, we further investigated the effect of smaller AuNP, i.e. 11 nm and 23 nm (Fig. S4†), on the fluorescence emission. In both cases, there was a drastic increase in the PL intensity when CS was added, suggesting the restoration of fluorescence when Cy3-tagged C3 was released from the near-field of the AuNP (Fig. 6a and b). This implied that both the 11 nm and 23 nm AuNPs quenched fluorescence as opposed to the fluorescence enhancement observed for the 58 nm AuNP. Furthermore, the extent of quenching decreased for the larger 23 nm AuNP. This quenching-to-enhancement transition from small- to larger-sized AuNP is in line with the common understanding of MEF (Fig. 6c). | ||
| Fig. 6 Kinetics of toehold-mediated removal step for (a) 11 nm and (b) 23 nm AuNP. The photoluminescence (PL) intensity of Cy3 was restored drastically when the complementary strand (CS) was added at t = 0 min, suggesting that the near-field interaction for the two smaller AuNP sizes led to fluorescence quenching. A red dotted line was drawn to indicate the average PL intensity of the AuNP–SH–C3 complex. (c) Smaller-sized AuNP (11 nm and 23 nm) quenched fluorescence (EF < 1) while larger-sized AuNP (58 nm) exhibited metal-enhanced fluorescence (EF > 1). The effect of nanoparticle size on the MNP–fluorophore interaction was statistically significant at α = 0.05 using ANOVA test. This is in line with the common understanding that the scattering component of the plasmon enhances fluorescence while the absorption component quenches fluorescence. As the size of AuNP increased, the scattering-to-absorption ratio increased and the quenching-to-enhancement observation was expected. All data shown are mean ± standard deviation (n = 4). * denotes p < 0.05 for two-tailed Student's t-test. Graphs under a horizontal bar tagged with * indicates statistical significance (p < 0.05) for all combinations of pair-wise t-test. | ||
Conclusions
We have demonstrated the feasibility of using a DNA toehold-mediated internal control to account for the inner filter effect when probing the near-field interaction between the metallic nanoparticle (MNP) and the fluorophore. This was achieved by the in situ assembly and disassembly of the MNP–fluorophore complex separated by a well-defined DNA spacer. A model gold nanoparticle (AuNP)–Cy3 model system was used to investigate the effect of two factors, namely the MNP–fluorophore separation distance and the MNP size, on the enhancement or quenching of fluorescence emission. The observed trends were in accordance with the theory reported in the literature, thereby confirming the applicability of our proposed toehold-mediated internal control design. We hope that this can serve as a central system for evaluating the effects of other influencing factors, e.g. nanoparticle shape and spectral overlap, on the MNP–fluorophore interaction more accurately to eventually facilitate the rational design of specific MNP–fluorophore systems for various applications.Experimental
Materials
All DNA oligonucleotides used in this study were purchased from Integrated DNA (IDT), and HPLC purified by IDT. The sequences are provided in Table S1.† The lyophilized DNA was reconstituted in 1× Tris-EDTA buffer (1× TE, pH 8.0) to give 100 μM stock and stored at 4 °C. The following chemicals were used as received: gold(III) chloride trihydrate (HAuCl4·3H2O, ≥99.9% trace metal basis), sodium chloride (NaCl, ≥99.5%), magnesium chloride (MgCl2, ≥98%), N,N,N′,N′-tetramethylethylenediamine (TEMED, for electrophoresis, ∼99%), ammonium persulfate ((NH4)2S2O8, for molecular biology, for electrophoresis, ≥98%) were purchased from Sigma Aldrich. 30% acrylamide–bis solution, 29:1 (3.3% C) was purchased from Biorad. Potassium chloride (KCl, ≥99.5%) was purchased from Applichem. SYBR gold nucleic acid stain (10000× in DMSO) and tris(2-carboxyethyl)phosphine hydrochloride (TCEP) were purchased from Invitrogen. 1× TE (pH 8.0) was purchased from 1st BASE. Phosphate buffer (pH 7.5) was prepared using sodium phosphate dibasic (Na2HPO, anhydrous enzyme grade) from Fischer Scientific and sodium dihydrogen phosphate dihydrate (NaH2PO4·2H2O) from Kanto Chemical Co. Inc. Mili-Q water with a resistance >18.2 MΩ cm−1 was used throughout the experiment.
Native PAGE analysis of the toehold-mediated strand displacement reaction
Stock DNA (100 μM in 1× TE, pH 8.0) was diluted to the respective working concentrations in hybridization buffer (10 mM pH 7.4 phosphate buffer, 300 mM NaCl, 10 mM KCl, 1.0 mM MgCl2). Thiolated DNA (SH) and Cy3-tagged DNA (C3) were heated to 70 °C for 5 min and allowed to cool to room temperature for 1 h. Complementary strand (CS) was then added in varying concentrations and the strand displacement reaction was allowed to proceed for 1 h at room temperature.12% DNA polyacrylamide gel was prepared using 0.5× TBE buffer. The gel was pre-run at 5 V cm−1 for 1 h in 0.5× TBE running buffer. The samples were loaded and ran at 100 V for 90 min. Post-staining was carried out using 1× Sybr gold dye for 20 min in the dark.
Synthesis of 50 nm gold nanoparticles (AuNPs)
All glassware and magnetic stir bars were cleaned with aqua regia (3:1 v/v HCl (37%)–HNO3 (65%). Note that aqua regia is highly corrosive) and rinsed with a copious amount of ultrapure water (UP) prior to particle synthesis. A seeded, 2-stage growth process was used to synthesize fairly homogeneous 58 nm AuNP.29 The product was air-cooled, filtered with a 0.22 μm filter and stored at 4 °C until further use.
Functionalization of AuNP with thiolated DNA (AuNP–SH)
The 58 nm AuNP was functionalized with thiolated DNA (SH) using the slow salting method with modifications.30 5 μM (final) of DNA was activated with 1 mM TCEP in 10 mM phosphate buffer (pH 7.5) for 30 min. The unpurified DNA was then added to 5 nM (final) of AuNP (1000:1 loading ratio) in 5 mM phosphate buffer (pH 7.5). After 30 min of incubation, the salt concentration was adjusted to 20 mM using 1 M NaCl. After 3 h of salt screening, 1 M NaCl was further added to increase the salt concentration to 50 mM and the probes were left overnight at room temperature. The salt concentration was gradually increased to 600 mM NaCl over 9 h by adding 5 M NaCl in 3 h intervals and left for overnight incubation. The aged probes were then purified by washing with 400 μL UP and centrifuging at 5000 rpm for 10 min at room temperature. This was repeated 5 times in all. The purified AuNP–SH probes were re-dispersed in 50 μL UP and stored at 4 °C until use.
Characterization of the AuNP and AuNP–SH probe
The size distribution of the as-synthesized 58 nm AuNP was characterized by transmission electron microscopy (TEM) and nanoparticle tracking analysis (NTA). TEM images were recorded on a JEOL JEM-2100F electron microscope with an operating voltage of 200 kV. 10 μL of the sample solution was pipetted onto a copper grid covered with a continuous carbon film (Electron Microscopy Sciences) and left to dry in air. At least 100 nanoparticles were measured from the micrographs using the ImageJ software. NTA analysis was carried out on LM10 (NanoSight) using ca. 1 mL sample volume. The nanoparticles were diluted with UP to a final concentration of ca. 108 particles mL−1. Particle tracking was recorded for 60 s.The extinction coefficient of the 58 nm AuNP was not available in the literature and so, we estimated the value using a combined technique of NTA and UV-visible absorption measurements (Varian Cary 50 Bio spectrometer). A calibration curve was obtained from UV-vis measurements over a range of unknown particle concentrations which gave absorbance values within the range 0.1–1.0. NTA was then used to estimate the particle concentration for a known dilution factor. Particle tracking was sampled over at least 3 regions and the average particle concentration was used. An extinction coefficient of 1.11 × 10¹⁰ M−1 cm−1 (s.d. = 0.14 × 10¹⁰ M−1 cm−1, n = 2) was estimated using the combined information.
The successful fabrication of the AuNP–SH probe was characterized by the change in the zeta potential (ζ-potential) of the nanoparticles. The nanoparticles were adjusted to an appropriate concentration using UP. The Smoluchowski model was used to solve Henry's equation. The DNA loading on AuNP was estimated by an indirect method of measuring the absorbance of the DNA in the supernatant obtained during the washing steps and subtracting this from the amount of DNA inputted. The hybridization efficiency of the AuNP–SH probe was estimated from the fluorescence measurement of the AuNP–SH–C3 complex which had been corrected for the enhancement/quenching effect.
The stability of the AuNP–SH probe was characterized by dynamic light scattering (DLS) and UV-visible spectroscopy. For both measurements, the nanoparticles were diluted to a final concentration of ca. 10 pM in either UP or hybridization buffer. DLS and ζ-potential were measured on a Malvern Zeta-sizer Nano-ZS.
Hybridization of AuNP–SH with Cy3-tagged DNA
25 μM of Cy3-tagged DNA (C3) was added to 5 nM AuNP–SH probe (5000:1 loading ratio) in hybridization buffer. The mixture was heated to 70 °C for 5 min and allowed to cool to room temperature overnight. The hybridized AuNP–SH–C3 probe complex was purified by washing with 400 μL hybridization buffer at 5000 rpm for 10 min at 4 °C. In between washes, the fluorescence measurement of the probe complex was taken to monitor the separation process of unbound C3. By the 3rd round of washing, the fluorescence signal had stabilized.
Fluorescence measurement
All fluorescence measurements were carried out on a microplate reader (Tecan). All analysis volume was kept constant at 200 μL. Emission spectra were obtained by scanning at 560–700 nm using an excitation wavelength of 535 nm. The AuNP–SH–C3 probe complex was diluted to a concentration as low as possible to minimize interference from the inner filter effect while still achieving a reasonable signal-to-noise ratio. Due to the large disparity in the extinction coefficient between the AuNP and Cy3, it was difficult to maintain an absorbance value less than 0.1 (recommended to avoid the inner filter effect) and an absorbance of less than ca. 0.2 was deemed to be acceptable.Kinetics study of toehold-mediated strand displacement
1 μM of complementary DNA was added to the purified AuNP–SH–C3 probe complex of a concentration ca. 10 pM for the kinetics study. The fluorescence measurement (λex = 535 nm, λem = 568 nm) was taken every 5 min for the first half an hour, followed by every 15 min-interval for the next 2 h. A control set-up with only C3 was sampled at the same measurement frequency to take into account the effect of photobleaching over time.Acknowledgements
This work was supported by research funding from the Singapore Millennium Foundation and the National Medical Research Council (NMRC/CIRG/1358/2013). Y. S. A. would like to thank the National University of Singapore and the Ministry of Education for the President Graduate Fellowship.Notes and references
- S. Eustis and M. A. El-Sayed, Chem. Soc. Rev., 2006, 35, 209–217 RSC.
- A. Fujiki, T. Uemura, N. Zettsu, M. Akai-Kasaya, A. Saito and Y. Kuwahara, Appl. Phys. Lett., 2010, 96, 043307 CrossRef PubMed.
- K. Aslan, M. Wu, J. R. Lakowicz and C. D. Geddes, J. Am. Chem. Soc., 2007, 129, 1524–1525 CrossRef CAS PubMed.
- K. Aslan, J. R. Lakowicz and C. D. Geddes, Curr. Opin. Chem. Biol., 2005, 9, 538–544 CrossRef CAS PubMed.
- J. R. Lakowicz, Anal. Biochem., 2005, 337, 171–194 CrossRef CAS PubMed.
- H. Chen, T. Ming, L. Zhao, F. Wang, L.-D. Sun, J. Wang and C.-H. Yan, Nano Today, 2010, 5, 494–505 CrossRef CAS PubMed.
- R. Bardhan, N. K. Grady, J. R. Cole, A. Joshi and N. J. Halas, ACS Nano, 2009, 3, 744–752 CrossRef CAS PubMed.
- R. Bardhan, N. K. Grady and N. J. Halas, Small, 2008, 4, 1716–1722 CrossRef CAS PubMed.
- O. Kulakovich, N. Strekal, A. Yaroshevich, S. Maskevich, S. Gaponenko, I. Nabiev, U. Woggon and M. Artemyev, Nano Lett., 2002, 2, 1449–1452 CrossRef CAS.
- F. Tam, G. P. Goodrich, B. R. Johnson and N. J. Halas, Nano Lett., 2007, 7, 496–501 CrossRef CAS PubMed.
- C. Rahul, S. Jaswinder, W. Haining, Z. Shengli, L. Su, Y. Hao, L. Stuart and L. Yan, Nanotechnology, 2009, 20, 485201 CrossRef PubMed.
- P. Reineck, D. Gómez, S. H. Ng, M. Karg, T. Bell, P. Mulvaney and U. Bach, ACS Nano, 2013, 7, 6636–6648 CrossRef CAS PubMed.
- G. Schneider, G. Decher, N. Nerambourg, R. Praho, M. H. V. Werts and M. Blanchard-Desce, Nano Lett., 2006, 6, 530–536 CrossRef CAS PubMed.
- N. N. Horimoto, K. Imura and H. Okamoto, Chem. Phys. Lett., 2008, 467, 105–109 CrossRef CAS PubMed.
- K. Kang, J. Wang, J. Jasinski and S. Achilefu, J. Nanobiotechnol., 2011, 9, 16 CrossRef CAS PubMed.
- C. D. Geddes, H. Cao, I. Gryczynski, Z. Gryczynski, J. Fang and J. R. Lakowicz, J. Phys. Chem. A, 2003, 107, 3443–3449 CrossRef CAS.
- F. Xie, M. S. Baker and E. M. Goldys, Chem. Mater., 2008, 20, 1788–1797 CrossRef CAS.
- J. Chen, Y. Jin, N. Fahruddin and J. X. Zhao, Langmuir, 2013, 29, 1584–1591 CrossRef CAS PubMed.
- J. R. Lakowicz, Principles of Fluorescence Spectroscopy, Springer, 2007 Search PubMed.
- J. Liang, K. Li, G. G. Gurzadyan, X. Lu and B. Liu, Langmuir, 2012, 28, 11302–11309 CrossRef CAS PubMed.
- O. G. Tovmachenko, C. Graf, D. J. van den Heuvel, A. van Blaaderen and H. C. Gerritsen, Adv. Mater., 2006, 18, 91–95 CrossRef CAS.
- J. P. Rosa, J. C. Lima and P. V. Baptista, Nanotechnology, 2011, 22, 415202 CrossRef CAS PubMed.
- D. Y. Zhang and G. Seelig, Nat. Chem., 2011, 3, 103–113 CrossRef CAS PubMed.
- D. S. Seferos, D. A. Giljohann, H. D. Hill, A. E. Prigodich and C. A. Mirkin, J. Am. Chem. Soc., 2007, 129, 15477 CrossRef CAS PubMed.
- R. Schreiber, J. Do, E.-M. Roller, T. Zhang, V. J. Schuller, P. C. Nickels, J. Feldmann and T. Liedl, Nat. Nanotechnol., 2013, 9, 74–78 CrossRef PubMed.
- G. P. Acuna, M. Bucher, I. H. Stein, C. Steinhauer, A. Kuzyk, P. Holzmeister, R. Schreiber, A. Moroz, F. D. Stefani, T. Liedl, F. C. Simmel and P. Tinnefeld, ACS Nano, 2012, 6, 3189–3195 CrossRef CAS PubMed.
- G. P. Acuna, F. M. Möller, P. Holzmeister, S. Beater, B. Lalkens and P. Tinnefeld, Science, 2012, 338, 506–510 CrossRef CAS PubMed.
- J. N. Zadeh, C. D. Steenberg, J. S. Bois, B. R. Wolfe, M. B. Pierce, A. R. Khan, R. M. Dirks and N. A. Pierce, J. Comput. Chem., 2011, 32, 170–173 CrossRef CAS PubMed.
- K. E. Fong and L.-Y. L. Yung, RSC Adv., 2012, 2, 5154–5163 RSC.
- C. A. Mirkin, R. L. Letsinger, R. C. Mucic and J. J. Storhoff, Nature, 1996, 382, 607–609 CrossRef CAS PubMed.
- H. D. Hill, J. E. Millstone, M. J. Banholzer and C. A. Mirkin, ACS Nano, 2009, 3, 418–424 CrossRef CAS PubMed.
- L. M. Demers, C. A. Mirkin, R. C. Mucic, R. A. Reynolds, R. L. Letsinger, R. Elghanian and G. Viswanadham, Anal. Chem., 2000, 72, 5535–5541 CrossRef CAS.
- A. Bek, R. Jansen, M. Ringler, S. Mayilo, T. A. Klar and J. Feldmann, Nano Lett., 2008, 8, 485–490 CrossRef CAS PubMed.
- G. Chen, Y. Wang, M. Yang, J. Xu, S. J. Goh, M. Pan and H. Chen, J. Am. Chem. Soc., 2010, 132, 3644–3645 CrossRef CAS PubMed.
- Y. Chen, K. Munechika and D. S. Ginger, Nano Lett., 2007, 7, 690–696 CrossRef CAS PubMed.
- I. Nazarenko, R. Pires, B. Lowe, M. Obaidy and A. Rashtchian, Nucleic Acids Res., 2002, 30, 2089–2195 CrossRef CAS PubMed.
- P. Anger, P. Bharadwaj and L. Novotny, Phys. Rev. Lett., 2006, 96, 113002 CrossRef.
- J. Yguerabide and E. E. Yguerabide, Anal. Biochem., 1998, 262, 137–156 CrossRef CAS.
- P. K. Jain, K. S. Lee, I. H. El-Sayed and M. A. El-Sayed, J. Phys. Chem. B, 2006, 110, 7238–7248 CrossRef CAS PubMed.
- B. J. Messinger, K. U. von Raben, R. K. Chang and P. W. Barber, Phys. Rev. B: Condens. Matter, 1981, 24, 649–657 CrossRef CAS.
Footnote |
| † Electronic supplementary information (ESI) available: DNA sequences, size distribution analysis, photobleaching background and optical characterization. See DOI: 10.1039/c4nr03643c |
| This journal is © The Royal Society of Chemistry 2014 |