 Open Access Article
 This Open Access Article is licensed under a
 Creative Commons Attribution 3.0 Unported Licence
Direct visualization of the interfacial position of colloidal particles and their assemblies†
N.
Vogel
ab,
J.
Ally
a,
K.
Bley
a,
M.
Kappl
a,
K.
Landfester
a and
C. K.
Weiss
*ac
aMax Planck Institute for Polymer Research, Ackermannweg 10, 55128 Mainz, Germany. E-mail: c.weiss@fh-bingen.de
bSchool of Engineering and Applied Sciences, Harvard University, 9 Oxford Street, Cambridge, MA 02139, USA
cUniversity of Applied Sciences Bingen, Berlinstrasse 109, 55411 Bingen, Germany
First published on 7th April 2014
Abstract
A method for direct visualization of the position of nanoscale colloidal particles at air–water interfaces is presented. After assembling hard (polystyrene, poly(methyl methacrylate), silica) or soft core–shell gold–hydrogel composite (Au@PNiPAAm) colloids at the air–water interface, butylcyanoacrylate is introduced to the interface via the gas phase. Upon contact with water, an anionic polymerization reaction of the monomer is initiated and a film of poly(butylcyanoacrylate) (PBCA) is generated, entrapping the colloids at their equilibrium position at the interface. We apply this method to investigate the formation of complex, binary assembly structures directly at the interface, to visualize soft, nanoscale hydrogel colloids in the swollen state, and to visualize and quantify the equilibrium position of individual micro- and nanoscale colloids at the air–water interface depending of the amount of charge present on the particle surface. We find that the degree of deprotonation of the carboxyl group shifts the air–water contact angle, which is further confirmed by colloidal probe atomic force microscopy. Remarkably, the contact angles determined for individual colloidal particles feature a significant distribution that greatly exceeds errors attributable to the size distribution of the colloids. This finding underlines the importance of accessing soft matter on an individual particle level.
Introduction
The investigation and understanding of the behaviour of colloidal particles at air–water interfaces are of paramount importance in the description of a variety of everyday problems, ranging from oil flotation to self-cleaning surfaces, food industries and cosmetics.1 Particle behaviour at interfaces can be identified as a key factor in a variety of fields of science and technology, e.g. in drug delivery,2 emulsion formation and stability,3 particle assisted wetting,4,5 and colloidal self-assembly at air–water interfaces.6,7 The trapping of colloidal particles at the air–water interface8 and their subsequent organization into highly ordered two-dimensional crystals has been recognized as an important and convenient technology to fabricate functional surface patterns at the nanoscale by an experimentally simple and fast self-assembly process,7,9,10 with applications in diverse research fields and technologies, including photonics and structural color,11–13 data storage,14–16 control of liquid wetting and repellency,17–19 antireflective coatings,18,20 plasmonic sensing,21–23 near-field enhancements,24–26 extraordinary transmission of light27 and light management in solar cells.28,29 At a more fundamental level, current research efforts take advantage of ordered binary arrangements of nanocrystals to induce cooperative properties not found in single-particle layers;30,31 to study the effects of nanoscale confinement on physical processes such as diffusion;32,33 to use structured colloidal particles to explore complex assembly structures;34 to apply anisotropic particles to control drying patterns (i.e. to circumvent coffee-staining effects);35 and to continue to seek fundamental understanding of the behaviour of individual particles at interfaces.36The direct visualization of colloids at interfaces by optical microscopy methods is a powerful tool to gain insight into processes taking place at a single particle level36,37 but is inherently limited to particles in the micrometer range and thus not suitable for processes exploiting nanoscale colloidal particles. Electron microscopic investigations were performed on interfacially adsorbed particles after solidifying the media, either after gelling the subphase upon addition of a polysaccharide (gel trapping technique)38 or after jet-freezing an oil/water/particle system and a subsequent freeze-fracture and metal shadowing process.39–41 To complement these efforts, an experimentally simple, easy to implement, and robust method for the visualization of colloids at the air–water interface independent of the size or the material of the colloids is of great interest.
Concept
Inspired by fingerprinting with cyanoacrylate fuming42 and the gel trapping technique, established by Paunov,38,43–45 we have developed a new technique for trapping colloids at the air–water interface, without the necessity of adding any components to the subphase. The monomer n-butyl cyanoacrylate (BCA), also known as Super Glue®, is introduced via the gas phase to an air–water interface with the colloids of interest (Fig. 1). Upon contact with water, anionic polymerization of BCA is initiated by a nucleophilic attack of water molecules (Fig. 1e).46 Further monomer is supplied via the gas phase, thus maintaining the polymerization (Fig. 1). New polymer chains can only be generated upon initiation by water, thus the monomer has to diffuse through the growing polymer membrane. Hence, the polymer grows into the water subphase, eventually resulting in an effective replacement of water by solid polymeric material. Nucleophilic groups, for example amino or hydroxyl groups, present on the particle surface can also initiate polymerization, leading to the formation of a thin membrane of the polymer around the particles. The solid film can subsequently be transferred to a substrate and be visualized by electron microscopy. By supplying the monomer via the gas phase it can be ensured that the interface is not mechanically perturbed and the subphase remains unchanged since no water soluble species are generated.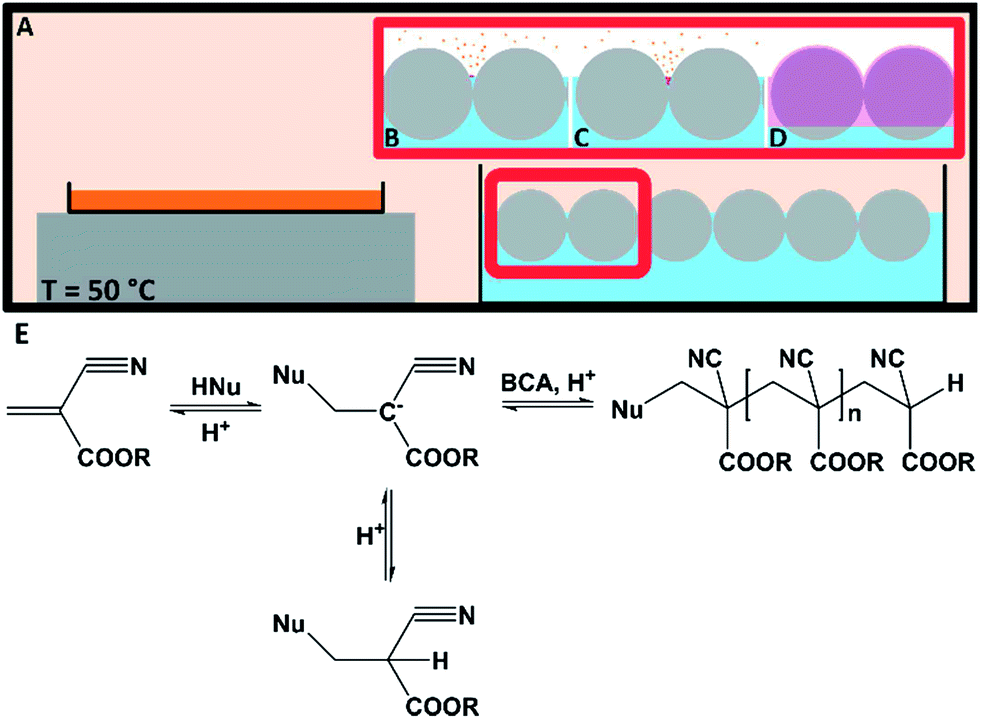 | ||
| Fig. 1 Schematic representation of the interfacial trapping process. (A) The monomer BCA (orange) is placed in an aluminum dish on a hotplate. The colloids of interest are brought to the air–water interface in a crystallization dish as described in the Experimental section. Both vessels are placed in a closed container. The monomer (orange) can evaporate and polymerize at the air–water interface. (B–D) (B) The polymerization of BCA is initiated at the interface upon contact with water, and the polymer (purple) is generated. (C) More monomer is supplied via the gas phase, the polymerization proceeds to eventually cover the interface and may form a thin membrane on the particles' surfaces if nucleophilic groups are present (D). (E) The polymerization reaction of n-butylcyanoacrylate initiated by nucleophiles (e.g. water molecules). | ||
Visualization
The thickness of the PBCA film is determined by several parameters. The anionic polymerization of BCA is initiated by nucleophiles47,48 and inhibited by the presence of acid (protons and Lewis acids).47,49–51 This means that polymerization in an acidic subphase proceeds slower than in a basic environment or on a subphase containing nucleophiles. Non-nucleophilic electrolytes or surfactants are not expected to participate or interfere with polymerization. However, the main parameter influencing the film thickness is the amount of monomer supplied via the gas phase. Using a constant temperature for BCA evaporation, longer exposure times lead to thicker PBCA layers (Fig. 2). The membrane, which is formed features a smooth interface on the side facing the air phase while being coarser at the growth front directed into the water phase, reflecting individual nucleation and growth sites occurring during the polymerization. The temporal evolution of the polymer film confirmed the proposed mechanism and indicated no or minor disturbance of the colloidal arrangement at the interface (Fig. SI1†). More precisely, the images show that the contact angle of the colloids does not change during the polymerization process, the lateral arrangement of the colloids is not disturbed by the growing polymer film, and the film indeed grows exclusively towards the water subphase (Fig. 2). After the colloids are tightly embedded in the polymer, the particle-containing film can be investigated by scanning electron microscopy. Consequently, the spatial resolution of the process is only determined by the equipment used for analysis and nanoscale colloidal particles can be visualized with ease.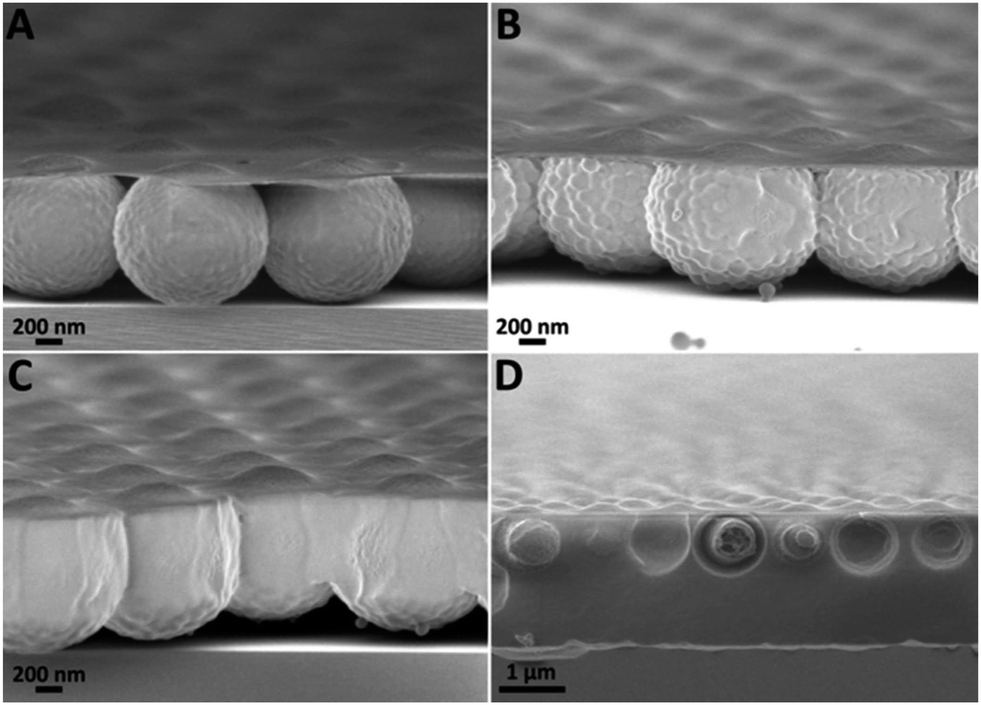 | ||
| Fig. 2 1 μm PS colloids on a water subphase with pH = 9 trapped on a poly(butylcyanoacrylate) (PBCA) film and subsequently imaged by scanning electron microscopy. Different evaporation times of BCA were used. (A) Exposure for 1 h, (B) 2 h, (C) 3 h, and (D) 48 h. Initially a thin film is generated at the interface (A), fixing the colloids in their position; subsequently coarse structures form around the colloids (B), which grow together (C) to from a continuous film (D). Long exposure times (48 h, (D)) show that the film growth is exclusively into the subphase and the colloids' positions at the interface as well as the shape and morphology of the polymer surface remain unaltered by the continuing polymerization reaction. | ||
Fig. 3 shows micrographs of a variety of colloids (for characterization see ESI, Table S1†) of different sizes and different materials embedded in PBCA films after the colloids were brought to the interface by gently letting the respective dispersions flow to the air–water interface via a glass slide.52 PS colloids (1063 nm) assembled into a monolayer on an aqueous subphase of pH = 6 were completely embedded in a thick PBCA layer (Fig. 3A). Fig. 3B shows PMMA colloids with a size of 350 nm fixed with a very thin film of PBCA (∼20 nm). From the different contrast of the PBCA film and the PMMA colloids it becomes obvious that the polymer generated at the air–water interface is also covering the colloids and not only the water surface. Since the thickness of the polymer membrane can be chosen to be extremely thin without interfering with the imaging process, we expect this overcoat to have only minor implications on the visualized interfacial position of the colloids. The silica colloids (590 nm) visualized in Fig. 3C are not arranged in a well-ordered close packed hexagonal monolayer, but show voids and packing defects in the layer. This indicates that the introduction of the monomer to the interface and the subsequent polymerization do not force the colloids at the interface into a close packed arrangement and induce colloid crystallization, but rather allow visualization of the situation at the interface with no or minor disturbance. The high hydrophilicity of the silica particles is reflected by a very low water contact angle. In addition to the solid, shape-persistent colloids (PS, PMMA, and silica), soft, deformable core–shell particles consisting of a gold core and a poly(N-isopropylacrylamide) hydrogel shell (Au@PNiPAAm) were subjected to the same process. Fig. 3D shows caps of spheres, which are embedded in a continuous PBCA film. These are the tops of the hybrid hydrogels arranged in a close packed monolayer at the water surface. This situation is in agreement with the arrangement of hydrogels at an oil–water interface, as found by Geisel et al.40 The possibility of visualizing such soft hydrogel particles is remarkable as the particles are highly swollen with water and are extremely challenging to investigate with other techniques, e.g. electron or atomic force microscopy, as they change their shape when transferred to solid substrates. Due to their softness, such materials exhibit much more complex interfacial behaviour than shape-persistent hard spheres. Direct visualization at the interface allows electron microscopy to be employed to investigate the “true” behaviour at the interface without having to cope with artifacts arising from transfer to solid substrates and drying. In brief, the novel technique seems to support recent findings that the hybrid Au@PNiPAAm particles indeed behave as attractive colloidal particles that form close-packed monolayers at the air–water interface.53
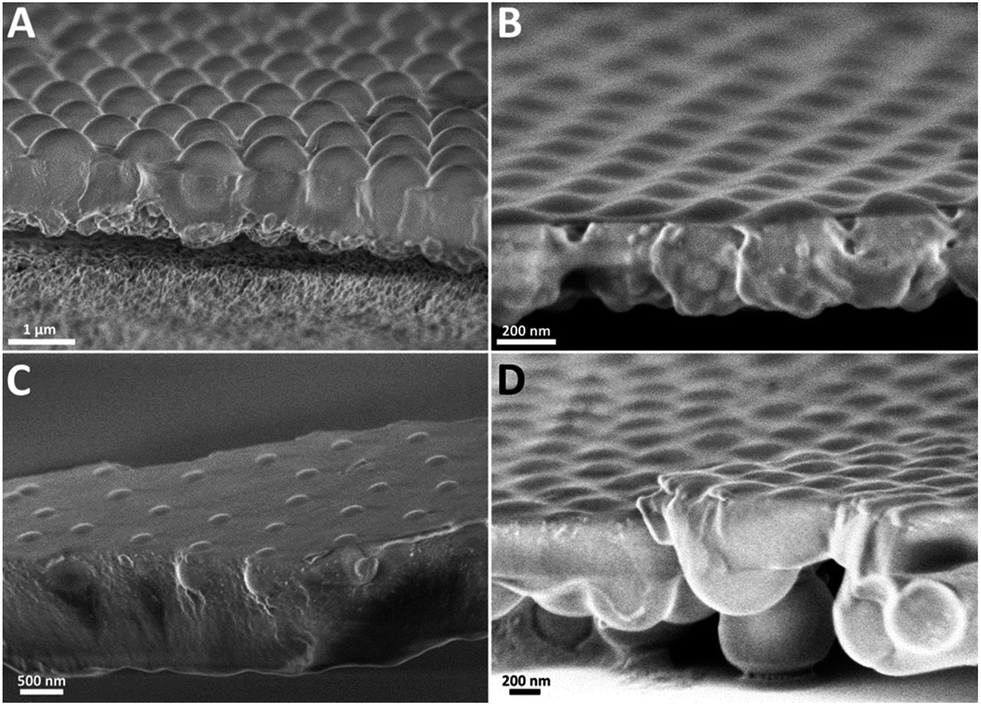 | ||
| Fig. 3 Colloidal particles of different sizes and materials at the interface. (A) Polystyrene (PS, 1063 nm) (B) poly(methyl methacrylate) (PMMA, 350 nm), (C) silica (590 nm), and (D) Au@PNiPAAm particles (300 nm). | ||
Fig. 4 shows a mixture of small (225 nm) and large (1063 nm) carboxy-functionalized polystyrene (PS) colloidal particles, which are self-assembled into a binary monolayer at the air–water interface. The ratio of small to large colloids was chosen in such a way that an LS6 structure is generated.54 Comparing the structure at the interface (Fig. 4A and B) to such an arrangement deposited on a solid substrate (Fig. 4C and D), it is clearly visible that the targeted arrangement is already generated at the interface and not a result of the deposition process. Furthermore, comparison of the binary arrangements shows that the trapping technique is not interfering with complex self-assembly processes. Hence, the described visualization method can be used to investigate the formation of complex, hierarchical structures at an interface. It is able to provide a more accurate picture of such formation processes as systematic errors arising from transfer and drying can be excluded.
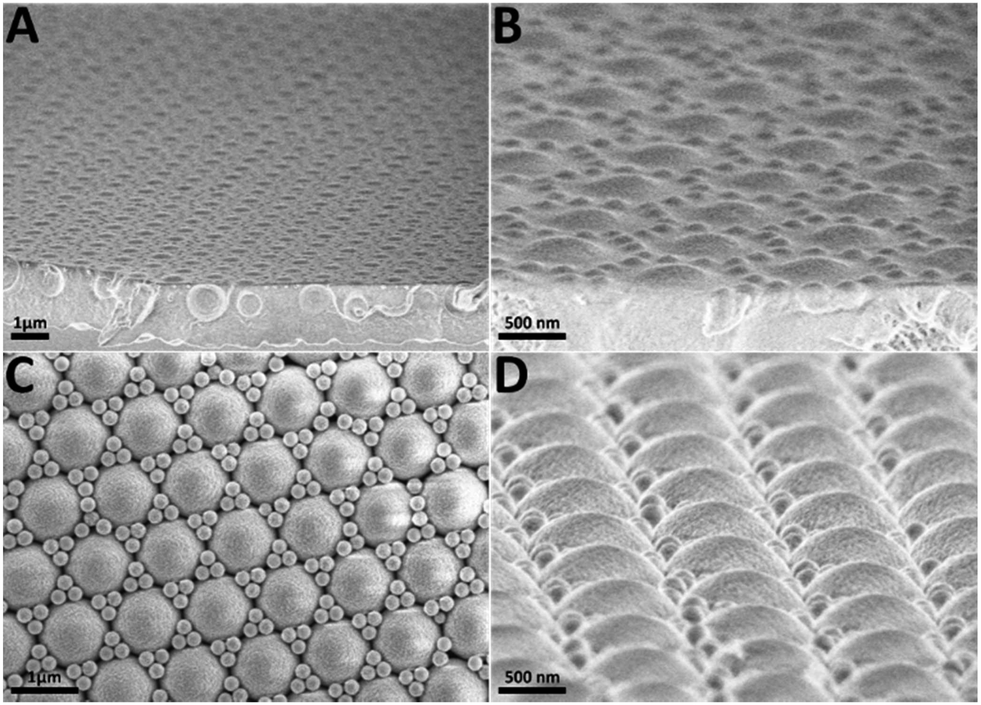 | ||
| Fig. 4 Binary monolayer of PS colloids with a diameter of 1 μm and 225 nm embedded in a film of PBCA (A and B). Micrographs (A) and (B) reflect the situation at the air–water interface. Micrographs (C) and (D) show monolayers of the same colloid mixture after deposition on solid substrates. | ||
Quantitative investigation – contact angles
In addition to qualitative investigations, the method is a powerful tool to extract quantitative physicochemical properties of colloidal particles, most prominently the contact angles of single particles by simple image analysis tools.Macroscopic contact angles are typically determined by optical evaluation of the contact angle of a sessile drop on a flat surface. Particle contact angle measurement techniques include the method of Washburn and Rideal,55,56 in which the penetration of a liquid into a powder bed made of the particles of interest is assessed, and Langmuir trough-based techniques.57,58 However, only a few techniques exist for the characterization of the air/solid/water contact angle of individual colloids. Large colloids (>1 μm) can be investigated by optical microscopy using methods such as the film trapping technique,59 the pendant drop method,60 or confocal microscopy.61 For colloids in the nanometer range, however, the diffraction limit of light prevents the use of microscopy-based methods, further limiting the applicable methods. Paunov's gel trapping technique was used successfully for determining the three phase contact angle of single colloids.38 However, the polysaccharide used for subphase gelation has to be dissolved at 95 °C and changes the chemical (composition) and physical (viscosity) properties of the sub-phase. Lu et al.62 presented a method in which the upper part of polymer colloids floating on a water surface is swollen with a solvent and subsequently visualized by SEM. The process is convenient, but limited to swellable polymeric colloids and relatively high contact angles. Recently, Isa et al.39–41 showed how freeze-fracture cryo-SEM can be used for determining the contact angle of nanoscale colloidal particles at water–solvent interfaces. After jet freezing a liquid–liquid system with colloids the frozen solvent is removed, leaving the colloids protruding from the frozen aqueous subphase. Subsequent metal evaporation from a specific angle allows calculating the contact angle from the dimensions of the metal shadow. This process will have significant impact on technologies based on colloids trapped at the interface between two immiscible liquids. However, assemblies at the air–water interface cannot be accessed by this technique. Additionally, the complexity of the process may hamper widespread use because cryo-SEM, especially in combination with further sample modification, is experimentally challenging and difficult to be employed for routine characterization. In contrast, the methodology presented here is experimentally simple and cheap, does not require sophisticated sample preparation and visualization techniques, and allows visualization of the air–water interface. Hence, it is a valuable extension of the existing methods for studying of physicochemical properties of colloids at interfaces on a single-particle level.
To assess the capabilities of the proposed method and to extract quantitative information, the contact angle of carboxylic acid functionalized PS particles was determined and compared to results obtained by colloidal probe atomic force microscopy (AFM) as an independent, alternative method. In this technique, colloidal probes consisting of a single colloidal particle glued to the end of a tipless AFM cantilever are used to study the particle interaction with a surface or interface.63,64 The particle contact angle can be determined from force measurements as the particle is brought into contact with a fluid–liquid interface.65 This method is typically restricted to colloids of a size larger than 3 μm, as the particles must be manipulated under an optical microscope to assemble the colloidal probes. Therefore, commercial, carboxylated PS colloids with a nominal diameter of 5 μm were chosen for comparative evaluation (Fig. 5) and the air–water contact angle of the colloids was determined by both the established colloidal probe AFM technique and our interface visualization method. As we showed earlier in the article, the interface visualization technique is not limited to micron sized particles but could equally be used to investigate and quantify contact angles of smaller, nanoscaled colloids. Here, however, no appropriate comparative technique is at hand.
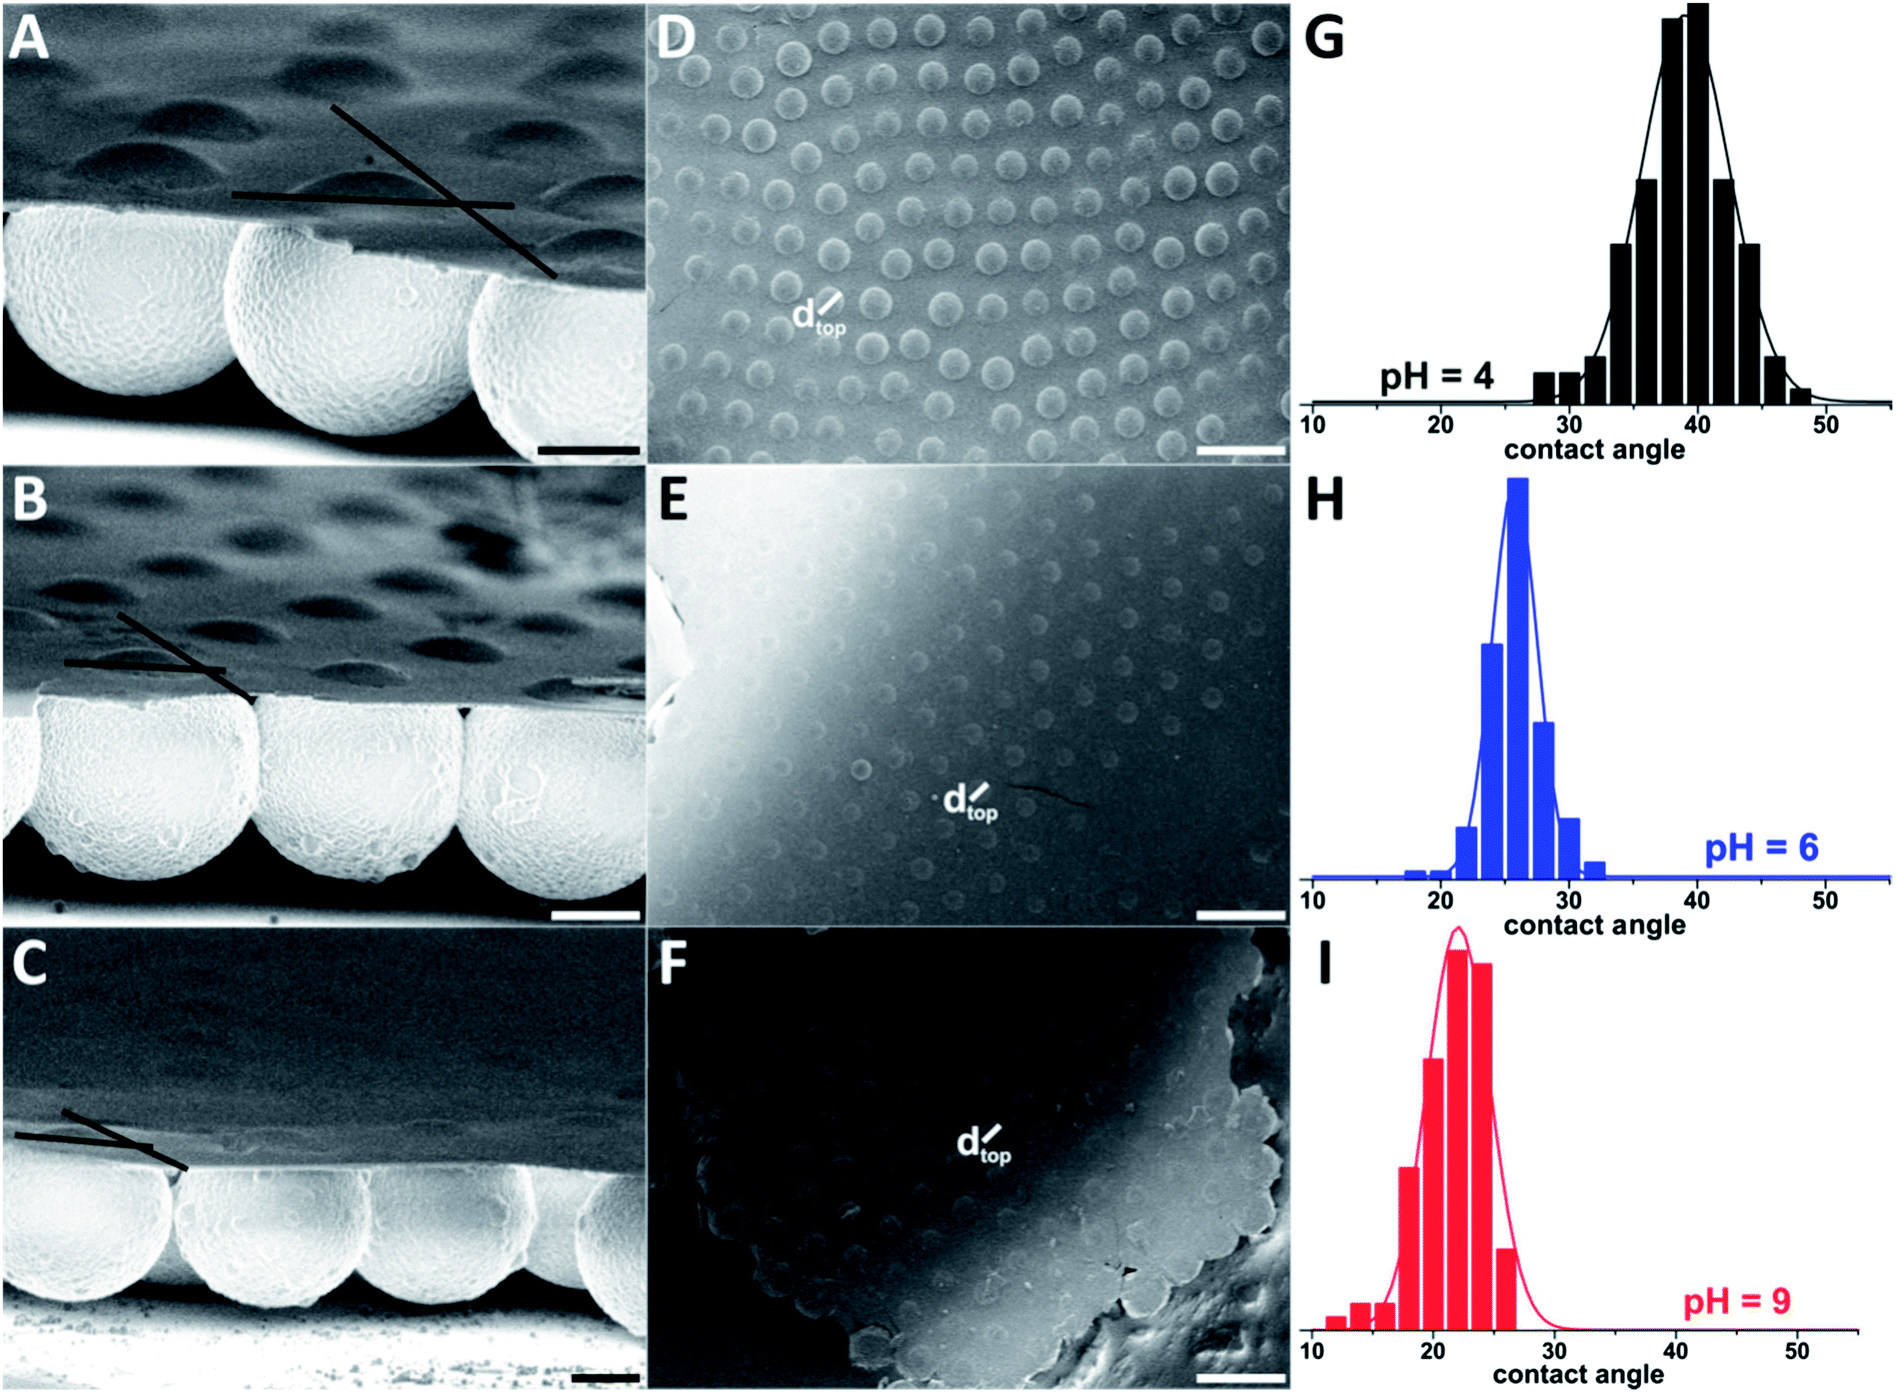 | ||
| Fig. 5 Visual evaluation of contact angles of carboxy functionalized PS colloids in side view. Colloid diameter: 5 μm, scale bars (A–C) 2 μm, (D–F) 10 μm. (A and D) pH = 4, (B and E) pH = 6, (C and F) pH = 9. (G–I) Histograms of the values of the contact angles obtained from the evaluation of the top view diameters of 5 μm colloids embedded in a PBCA film. The lines in figures (A–C) served for the estimation of the “visual side” contact angles (Table 1). | ||
The 5 μm PS colloids used for the comparison feature a carboxy-functionalized surface, the surface charge and thus the hydrophilicity of the colloids is determined and adjusted by the pH of the subphase. At high pH values the carboxylic acid functionalities are deprotonated and the surface charge is high, leading to increased hydrophilicity of the particles. In contrast, less surface charge is present on protonated particles at low pH,54 which makes the particles comparably hydrophobic. The hydrophobicity determines the behaviour of the colloids at the interface. As the water contact angle decreases with increasing charge, the submersion depth is directly related to the charge on the surface and can be adjusted by changing the pH value of the subphase. As poly(acrylic acid), serving as a model of the carboxylated surface, has a pKa = 4–4.5,66 the transition should appear at between pH 4 and 5. Thus, the colloids were investigated in subphases of pH 4, 6, and 9. Below the transition, at pH = 4, the carboxylic acid groups are protonated, the surface charge is low, and thus the colloids should exhibit the highest contact angle of the pH series. In a subphase of pH > 6, the contact angle should be significantly lower, as the majority of the acid groups are deprotonated. To quantify the amount of charge removed by protonation, polyelectrolyte titration was used to determine the surface charge density on the particles (Table 1). The charge density at pH 4 was 1.4 charges per nm, 2.1 charges per nm at pH 6, and 2.9 charges per nm at pH 9. This means that the particles have less than half the charges at pH 4 compared to pH 9.
| pH | Charge density [nm−2] | Contact angle θ [°] | |||
|---|---|---|---|---|---|
| AFM: advancing | AFM: receding | Visual: side | Visual: top | ||
| 4 | 1.4 | 23.1, 45.9, 44.6 | 19.6 | 35 | 40 ± 7 |
| 6 | 2.1 | 17.7, 40.4, 40.6 | 14.2 | 30 | 26 ± 4 |
| 9 | 2.9 | 13.5, 38.9, 40.5 | 10.9 | 20 | 23 ± 5 |
The contact angles of the colloids were determined from the micrographs via two methods. First, in side view images, the appropriate tangents were fitted and the angle was extracted from the image (Fig. 5A–C). Here, the evaluation of statistically relevant particle numbers is cumbersome as only a few colloids are located on the edge of the film. To ensure proper statistical evaluation, top-view micrographs were used to measure the diameter of the cap protruding from the polymeric film (Fig. 5D–F) using image analysis tools of the software ImageJ. From this diameter, the contact angle can be calculated using simple geometric arguments (eqn (1), Fig. SI2†).
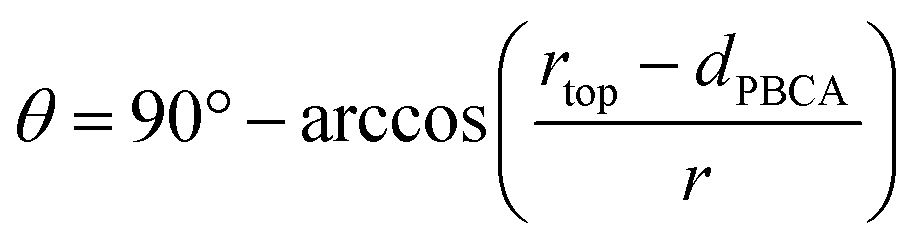 | (1) |
It is necessary to keep in mind that the colloids are covered by a thin layer of the newly formed PBCA polymer as well. From the side view images, shown in Fig. 5 and SI3,† the thickness of this layer was estimated to be approximately 200 nm. The diameter obtained from the top view images was corrected by this value (see ESI, Fig. SI2†).
The results of the different measurement methods are summarized in Table 1; detailed results of the evaluation of the top-view images are presented in Fig. 5.
The results of both methods show the expected trend in contact angle values. At low pH the values are highest and decrease to the values obtained at pH 9. There are large variations in the contact angles obtained by the individual colloidal force measurements. One set of measurements gave quite low values (13.5° to 23.1°) with a difference of ca. 10° between pH 4 and pH 9, whereas the other measurements gave contact angles of approximately 40° with only small differences among pH values. Determining contact angles via embedding the particles in a solid polymer film and subsequent SEM image analysis yields more statistically relevant data since a large number of colloids can be assessed with ease. We found a significant distribution of the values of the contact angles (Fig. 5G–I), corroborating the large scatter in colloidal force data. The values of the contact angles range from 28 to 48° at pH 4, from 18 to 32° at pH 6 and from 13 to 26° at pH 9. Considering the standard deviation of the top view diameters (pH 4: 3050 ± 263 nm, pH 6: 2090 ± 179 nm, pH 9: 1740 ± 226 nm) in comparison to the standard deviation of the colloid diameter (4890 ± 97 nm), the distribution cannot only be explained by the variation of the colloid diameters. The results support the recent findings of Isa et al., who reported a distinct distribution of contact angles of colloids trapped at an oil–water interface.39
The surprising finding of a broad distribution of contact angles demonstrates the benefits of the presented method. It allows investigating an ensemble of particles by evaluating the properties of individual particles and averaging over the results. In contrast to “bulk” methods for the investigation of particle surface properties, e.g. polyelectrolyte titration or ζ-potential measurements, in which only averages are generated, a real distribution of individual particle properties can be obtained. This single-particle based approach showed that colloids do not only feature a distribution of their diameters but also differ significantly in their surface properties. The origin of the inhomogeneities in surface properties is not yet completely understood39,67,68 and merits further investigation, both from experimental and theoretical sides. It has been proposed that the small size of colloidal particles renders them more susceptible to inhomogeneities with respect to surface chemistry or topography, possibly arising from the synthetic process or particle treatments (washing, centrifugation, and addition of spreading solvent).39,67,68 Further, Brownian motion may lead to fluctuations of the contact position of a colloid in the energy well, which is potentially resolved when visualizing individual particles.39 However, such fluctuations are unlikely to account for the contact angle distributions of relatively large, micron-scale particles.
Conclusion
To summarize, we have presented a technique to trap colloids of a wide size range and arbitrary composition at an air–water interface by embedding them in a PBCA film. The interface and the position of the colloids remain largely unaffected as the monomer is introduced via the gas phase and polymerizes upon contact with the aqueous subphase. Thus, the method enables visualizing colloids of a variety of materials and sizes, including polymer and inorganic materials as well as very soft materials such as hydrogels, in their undisturbed equilibrium position at the interface. The ability to visualize complex surface configurations was demonstrated by imaging binary colloidal monolayers in their undisturbed equilibrium position at an air–water interface. Quantitatively, the method can be used to determine contact angles of individual particles at liquid interfaces. The contact angles of 5 μm colloids were evaluated by visual inspection of embedded colloids using SEM images and by colloidal probe force measurements as an established independent method. The values from the visual inspection revealed a distribution of the contact angles, and thus a significant variation in the surface properties of the colloids, extending the recent finding of Isa et al. who reported contact angle distributions of particles at the oil–water interface.39The described method is experimentally simple, fast, and versatile. It is suitable for a wide range of materials and particle sizes. We believe this method holds great potential for the assessment of physicochemical parameters of individual colloidal particles, structures and processes at liquid interfaces.
Acknowledgements
NV acknowledges funding from the Leopoldina Fellowship Programme. We thank Elke Muth for measuring the particle charge density, Jorge Pérez-Juste and Luis Liz-Marzán (University of Vigo, Spain) for providing us with the hydrogels, Gabriele Schäfer for the 1 μm PS colloids and Lena Mammen for the silica particles. The donation of BCA from Henkel AG & Co KGaA is gratefully acknowledged.Notes and references
- J. Lyklema, Fundamentals of Interface and Colloid Science, Academic Press, 2000, vol. III Search PubMed.
- A. D. Dinsmore, M. F. Hsu, M. G. Nikolaides, M. Marquez, A. R. Bausch and D. A. Weitz, Science, 2002, 298, 1006–1009 CrossRef CAS PubMed.
- B. P. Binks, Curr. Opin. Colloid Interface Sci., 2002, 7, 21–41 CrossRef CAS.
- A. L. Ding, B. P. Binks and W. A. Goedel, Langmuir, 2005, 21, 1371–1376 CrossRef CAS PubMed.
- A. L. Ding and W. A. Goedel, J. Am. Chem. Soc., 2006, 128, 4930–4931 CrossRef CAS PubMed.
- R. McGorty, J. Fung, D. Kaz and V. N. Manoharan, Mater. Today, 2010, 13, 34–42 CrossRef CAS.
- N. Vogel, C. K. Weiss and K. Landfester, Soft Matter, 2012, 8, 4044–4061 RSC.
- P. Pieranski, Phys. Rev. Lett., 1980, 45, 569–572 CrossRef CAS.
- J. H. Zhang, Y. F. Li, X. M. Zhang and B. Yang, Adv. Mater., 2010, 22, 4249–4269 CrossRef CAS PubMed.
- T. Kraus, D. Brodoceanu, N. Pazos-Perez and A. Fery, Adv. Funct. Mater., 2013, 23, 4529–4541 CrossRef CAS.
- M. Kolle, P. M. Salgard-Cunha, M. R. J. Scherer, F. Huang, P. Vukusic, S. Mahajan, J. J. Baumberg and U. Steiner, Nat. Nanotechnol., 2010, 5, 511–515 CrossRef CAS PubMed.
- S. G. Romanov, N. Vogel, K. Bley, K. Landfester, C. K. Weiss, S. Orlov, A. V. Korovin, A. Regensburger, A. S. Romanova, A. Kriesch and U. Peschel, Phys. Rev. B: Condens. Matter Mater. Phys., 2012, 86, 195145 CrossRef.
- K. Bley, N. Sinatra, N. Vogel, K. Landfester and C. K. Weiss, Nanoscale, 2014, 6, 492–502 RSC.
- A. Manzke, A. Plettl, U. Wiedwald, L. Han, P. Ziemann, E. Schreiber, U. Ziener, N. Vogel, C. K. Weiss, K. Landfester, K. Fauth, J. Biskupek and U. Kaiser, Chem. Mater., 2012, 24, 1048–1054 CrossRef CAS.
- A. Manzke, N. Vogel, C. K. Weiss, U. Ziener, A. Plettl, K. Landfester and P. Ziemann, Nanoscale, 2011, 3, 2523–2528 RSC.
- W. G. Wang, A. Pearse, M. Li, S. Hageman, A. X. Chen, F. Q. Zhu and C. L. Chien, Sci. Rep., 2013, 3, 1948 CAS.
- J.-Y. Shiu, C.-W. Kuo, P. Chen and C.-Y. Mou, Chem. Mater., 2004, 16, 561–564 CrossRef CAS.
- Y. Li, J. Zhang, S. Zhu, H. Dong, F. Jia, Z. Wang, Z. Sun, L. Zhang, Y. Li, H. Li, W. Xu and B. Yang, Adv. Mater., 2009, 21, 4731–4734 CAS.
- N. Vogel, R. A. Belisle, B. Hatton, T.-S. Wong and J. Aizenberg, Nat. Commun., 2013, 4, 2176 Search PubMed.
- L. Xu and J. He, Langmuir, 2012, 28, 7512–7518 CrossRef CAS PubMed.
- C. L. Haynes and R. P. Van Duyne, J. Phys. Chem. B, 2001, 105, 5599–5611 CrossRef CAS.
- J. N. Anker, W. P. Hall, O. Lyandres, N. C. Shah, J. Zhao and R. P. Van Duyne, Nat. Mater., 2008, 7, 442–453 CrossRef CAS PubMed.
- N. Vogel, M. Jung, N. L. Bocchio, M. Retsch, M. Kreiter and I. Koper, Small, 2010, 6, 104–109 CrossRef CAS PubMed.
- Y. Lu, G. L. Liu, J. Kim, Y. X. Mejia and L. P. Lee, Nano Lett., 2004, 5, 119–124 CrossRef PubMed.
- N. Vogel, J. Fischer, R. Mohammadi, M. Retsch, H.-J. Butt, K. Landfester, C. K. Weiss and M. Kreiter, Nano Lett., 2011, 11, 446–454 CrossRef CAS PubMed.
- J. Fischer, N. Vogel, R. Mohammadi, H.-J. Butt, K. Landfester, C. K. Weiss and M. Kreiter, Nanoscale, 2011, 3, 4788–4797 RSC.
- S. H. Lee, K. C. Bantz, N. C. Lindquist, S.-H. Oh and C. L. Haynes, Langmuir, 2009, 25, 13685–13693 CrossRef CAS PubMed.
- C. Battaglia, C.-M. Hsu, K. Söderström, J. Escarré, F.-J. Haug, M. Charrière, M. Boccard, M. Despeisse, D. T. L. Alexander, M. Cantoni, Y. Cui and C. Ballif, ACS Nano, 2012, 6, 2790–2797 CrossRef CAS PubMed.
- J. Zhu, C. M. Hsu, Z. F. Yu, S. H. Fan and Y. Cui, Nano Lett., 2010, 10, 1979–1984 CrossRef CAS PubMed.
- A. Dong, J. Chen, P. M. Vora, J. M. Kikkawa and C. B. Murray, Nature, 2010, 466, 474–477 CrossRef CAS PubMed.
- A. Dong, X. Ye, J. Chen and C. B. Murray, Nano Lett., 2011, 11, 1804–1809 CrossRef CAS PubMed.
- R. Raccis, A. Nikoubashman, M. Retsch, U. Jonas, K. Koynov, H. J. Butt, C. N. Likos and G. Fytas, ACS Nano, 2011, 5, 4607–4616 CrossRef CAS PubMed.
- M. Jung, N. Vogel and I. Koeper, Langmuir, 2011, 27, 7008 CrossRef CAS PubMed.
- Q. Chen, S. C. Bae and S. Granick, Nature, 2011, 469, 381–384 CrossRef CAS PubMed.
- P. J. Yunker, T. Still, M. A. Lohr and A. G. Yodh, Nature, 2011, 476, 308–311 CrossRef CAS PubMed.
- D. M. Kaz, R. McGorty, M. Mani, M. P. Brenner and V. N. Manoharan, Nat. Mater., 2012, 11, 138–142 CrossRef CAS PubMed.
- V. N. Manoharan, M. T. Elsesser and D. J. Pine, Science, 2003, 301, 483–487 CrossRef CAS PubMed.
- V. N. Paunov, Langmuir, 2003, 19, 7970–7976 CrossRef CAS.
- L. Isa, F. Lucas, R. Wepf and E. Reimhult, Nat. Commun., 2011, 2, 438 CrossRef PubMed.
- K. Geisel, L. Isa and W. Richtering, Langmuir, 2012, 15770–15776 CrossRef CAS PubMed.
- B. P. Binks, L. Isa and A. T. Tyowua, Langmuir, 2013, 29, 4923–4927 CrossRef CAS PubMed.
- P. J. Mankidy, R. Rajagopalan and H. C. Foley, Chem. Commun., 2006, 1139–1141 RSC.
- O. J. Cayre and V. N. Paunov, Langmuir, 2004, 20, 9594–9599 CrossRef CAS PubMed.
- V. N. Paunov and O. J. Cayre, Adv. Mater., 2004, 16, 788–791 CrossRef CAS.
- L. N. Arnaudov, O. J. Cayre, M. A. C. Stuart, S. D. Stoyanov and V. N. Paunov, Phys. Chem. Chem. Phys., 2010, 12, 328–331 RSC.
- B. Ryan and G. McCann, Macromol. Rapid Commun., 1996, 17, 217–227 CrossRef CAS.
- C. K. Weiss, U. Ziener and K. Landfester, Macromolecules, 2007, 40, 928–938 CrossRef CAS.
- R. K. Kulkarni, D. E. Bartak and F. Leonard, J. Polym. Sci., Part A-1: Polym. Chem., 1971, 9, 2977–2981 CrossRef CAS PubMed.
- D. C. Pepper and B. Ryan, Makromol. Chem., 1983, 184, 383–394 CrossRef CAS.
- C. K. Weiss, M.-V. Kohnle, K. Landfester, T. Hauk, D. Fischer, J. Schmitz-Wienke and V. Mailänder, ChemMedChem, 2008, 3, 1395–1403 CrossRef CAS PubMed.
- C. K. Weiss, M. R. Lorenz, V. Mailänder and K. Landfester, Macromol. Biosci., 2007, 7, 883–896 CrossRef CAS PubMed.
- N. Vogel, S. Goerres, K. Landfester and C. K. Weiss, Macromol. Chem. Phys., 2011, 212, 1719–1734 CrossRef CAS.
- N. Vogel, C. Fernández-López, J. Pérez-Juste, L. Liz-Marzán, K. Landfester and C. K. Weiss, Langmuir, 2012, 28, 8985–8993 CrossRef CAS PubMed.
- N. Vogel, L. de Viguerie, U. Jonas, C. K. Weiss and K. Landfester, Adv. Funct. Mater., 2011, 21, 3064–3073 CrossRef CAS.
- E. W. Washburn, Phys. Rev., 1921, 17, 273–283 CrossRef.
- E. K. Rideal, Philos. Mag., 1922, 44, 1152–1159 CrossRef CAS.
- J. H. Clint and N. Quirke, Colloids Surf., A, 1993, 78, 277–278 CrossRef CAS.
- J. H. Clint and S. E. Taylor, Colloids Surf., 1992, 65, 61–67 CrossRef CAS.
- A. Hadjiiski, R. Dimova, N. D. Denkov, I. B. Ivanov and R. Borwankar, Langmuir, 1996, 12, 6665–6675 CrossRef CAS.
- J. Mingins and A. Scheludko, J. Chem. Soc., Faraday Trans. 1, 1979, 75, 1–6 RSC.
- R. Mohammadi and A. Amirfazli, J. Dispersion Sci. Technol., 2005, 25, 567–574 CrossRef PubMed.
- Z. Lu and M. Zhou, J. Colloid Interface Sci., 2011, 361, 429–435 CrossRef CAS PubMed.
- W. A. Ducker, T. J. Senden and R. M. Pashley, Nature, 1991, 353, 239–241 CrossRef CAS.
- H.-J. Butt, Biophys. J., 1991, 60, 1438–1444 CrossRef CAS.
- M. Preuss and H.-J. Butt, J. Colloid Interface Sci., 1998, 208, 468–477 CrossRef CAS PubMed.
- Pradip, C. Maltesh, P. Somasundaran, R. A. Kulkarni and S. Gundiah, Langmuir, 1991, 7, 2108–2111 CrossRef CAS.
- B. J. Park, J. Pantina and E. M. Furst, Langmuir, 2008, 24, 1686–1694 CrossRef CAS PubMed.
- B. J. Park, J. Vermant and E. M. Furst, Soft Matter, 2010, 6, 5327–5333 RSC.
Footnote |
| † Electronic supplementary information (ESI) available: Detailed description of the experiments, additional micrographs and a sketch illustrating the calculation of the contact angles. See DOI: 10.1039/c4nr00401a |
| This journal is © The Royal Society of Chemistry 2014 |