 Open Access Article
 This Open Access Article is licensed under a Creative Commons Attribution-Non Commercial 3.0 Unported Licence
Crystal engineering of zeolites with graphene†
Paul
Gebhardt‡
a,
Sebastian W.
Pattinson‡
b,
Zhibin
Ren
b,
David J.
Cooke
c,
James A.
Elliott
b and
Dominik
Eder
*a
aInstitut für Physikalische Chemie, Westfälische Wilhelms-Universität Münster, Correnstrasse 28/30, Münster, 48149, Germany. E-mail: dominik.eder@uni-muenster.de
bDepartment of Materials Science and Metallurgy, University of Cambridge, 27 Charles Babbage Road, Cambridge, CB3 0FS, UK
cDepartment of Chemical & Biological Sciences, University of Huddersfield, Queensgate, Huddersfield, HD1 3DH, UK
First published on 14th April 2014
Abstract
Achieving control over the morphology of zeolite crystals at the nanoscale is crucial for enhancing their performance in diverse applications including catalysis, sensors and separation. The complexity and sensitivity of zeolite synthesis processes, however, often make such control both highly empirical and difficult to implement. We demonstrate that graphene can significantly alter the morphology of titanium silicalite (TS-1) particles, in particular being able to reduce their dimensions from several hundreds to less than 10 nm. Through electron microscopy and molecular mechanics simulations we propose a mechanism for this change based on the preferential interaction of specific TS-1 surfaces with benzyl-alcohol-mediated graphene. These findings suggest a facile new means of controlling the zeolite morphology and thereby also further demonstrate the potential of graphene in hybrid materials. Moreover, the generality of the mechanism points the way to a new avenue of research in using two-dimensional materials to engineer functional inorganic crystals.
Introduction
The morphology of zeolite crystals is a key determinant of their effectiveness in diverse catalytic,1–4 optical,5 and separation6 applications. Achieving control over their size and morphology is thus crucial for improving their performance,7,8 but effective strategies for this are often hampered by the complicated chemical interactions that affect crystal synthesis.9–11 Zeolites are microporous materials widely used in industrial catalytic processes, whose synthesis has been the subject of considerable research efforts aiming to improve their activity.12 These have included the introduction of mesopores into the zeolite to enable access to their internal surface area13,14 and creating zeolite nanoparticles to increase external surface area.15 Improvements such as these make the zeolites significantly more active, particularly for molecules too large to interact with their internal surfaces. However, effecting these morphological changes requires complex and carefully calibrated processes specifically tailored to each zeolite, making them difficult to develop and transfer to industry.Graphene is a two-dimensional sp2-hybridised carbon allotrope that has received significant attention for its exceptional electronic and mechanical properties,16,17 which have stimulated intense research towards applications in diverse areas including transistors18 and chemical sensors.19 Recently, we have demonstrated that the addition of graphene to zeolite synthesis can significantly enhance the photocatalytic activity of the resulting hybrid structures beyond that of either material on its own.20 Specifically, the hybridization of titanium-silicalite (TS-1) with 5–10 wt% of graphene (produced via arc-discharge (HG21)) increased the photocatalytic activity of TS-1 for the oxidation of 4-nitrophenol by approximately 25 times, which constitutes a significant milestone in photocatalysis. Interfacial charge transfer processes are predominantly responsible for this considerable enhancement by hindering charge recombination and thereby extending the lifetime of charge carriers.20,22–24 We also observed that the presence of graphene during zeolite synthesis significantly affected the zeolite particle size, which may additionally contribute to the increased catalytic activity.
In this work, we investigate the effect of various graphene materials with different chemical functionalities on the size and morphology of TS-1 crystals with the help of both experimental and computational techniques, and use the resulting insights to propose a crystal engineering mechanism based on preferential adsorption of the nanocarbon on the TS-1 surface. These results uncover a simple new method for controlling the synthesis of zeolitic materials and, through their generality, suggest a new strategy in using two-dimensional materials to engineer inorganic crystals.
Results and discussion
TS-1 was synthesised in situ, i.e. in the presence of graphene, via a hydrothermally assisted sol–gel process (15 hours @ 180 °C) using tetraethyl orthosilicate (TEOS) and tetrabutyl orthotitanate (TBOT) as precursors and tetrapropylammonium hydroxide (TPAOH) as the template for the micropores. The weight ratio of graphene was varied between 1 wt% and 20 wt% with respect to the total mass of the hybrid. The samples were subsequently calcined in air at 550 °C to ensure that the micropore template was completely removed, which was subsequently confirmed by TGA (Fig. S1†). For more details, see the Experimental section and ESI.†In particular, we investigated various graphene-based materials including oxidatively exfoliated graphene oxide (GO) and the corresponding reduced graphene oxide (RGO) as well as few-layer graphene that was produced by arc-discharge in hydrogen (HG).21 It is important to note that small amounts of benzyl alcohol (BA, see the Experimental section) were added to the graphene suspension to aid its dispersion in the aqueous solution. As demonstrated previously,25 BA adsorbs uniformly on the graphene surface and provides a large number of hydroxyl groups. These hydroxyl groups render graphene hydrophilic and also react with the metal–organic precursors during the synthesis, thus likely providing nucleation sites for the formation of the TS-1 network.
Fig. 1 shows electron micrographs (SEM and TEM) of TS-1 produced with various concentrations of RGO (left column) and HG-graphene (right column), while the corresponding samples with GO are shown in the ESI (Fig. S14†). It is important to note that all samples contained the same amount of BA (0.3 mol eq.). Furthermore, control experiments with various BA concentrations (Fig. S15†) revealed that the presence of BA itself had only a negligible effect on the shape of the TS-1 particles.
 | ||
| Fig. 1 SEM micrographs of (A) TS-1 and RGO hybrids with (B) 1 wt%, (D) 5 wt%, and (F) 10 wt% RGO; TEM micrographs of TS-1 HG hybrids with (C) 1 wt%, (E) 5 wt%, and (G) 10 wt% HG. | ||
The reference experiment without graphene (Fig. 1A) produced TS-1 particles that were 400–500 nm in size. The morphology of the particles ranged from “egg-shape” to “hexagonal prisms” with some of the crystals being closely associated, which is in line with those found in the literature.26,27 The addition of graphene to the synthesis process considerably altered the size and shape of the TS-1 particles. The change in morphology followed one of two distinct pathways depending on the type of graphene material added. In the case of both GO and RGO, the TS-1 particles were predominantly morphologically “coffin-shaped”. Increasing the graphene concentration from 2 to 5 and then 10 wt% caused the length of the particles to increase to 2, 4 and 8 μm respectively while the thickness remained unchanged at about 300 nm (Fig. 1B, D and F).
By contrast, the addition of HG-graphene caused the morphology to change firstly to circular plates (1 wt% HG) and then to rectangular plates (5 wt%) with remarkably uniform dimensions of about 400 nm in length and diameter and 130–150 nm in thickness (Fig. 1E and S6†). With increasing carbon concentration, the rectangular plates grew thinner (i.e. less than 40 nm) while retaining the same length. Surprisingly, the addition of even higher graphene concentrations (greater than 10 wt%) resulted in the formation of very small nanoparticles of about 10–12 nm in diameter (Fig. 1G).
The presence of TS-1 was confirmed by X-ray powder diffraction (Fig. 2A). In particular, the reference and the samples with less than 5 wt% HG-graphene show sharp diffraction peaks typical of orthorhombic TS-1 (ICSD: 92536). Interestingly, the dominant 011 peak at 2θ = 7.8° is significantly reduced in the 5 wt% sample with respect to the 200 peak, which is indicative of the elongation of the TS-1 particles into thin rectangular plates as observed in SEM (Fig. 1E). By contrast, the diffraction pattern of the sample produced with 10 wt% HG-graphene only contains broad peaks between 2θ = 20° and 25°, which may be caused by amorphous or disordered particles. On the other hand, considering that a diameter of about 10 nm for microporous TS-1 (pore volume ∼ 70%) corresponds to only 4–5 unit cells (Table 1), the TS-1 particles may simply be too small to be detected by XRD.28 The weak diffraction peaks around 25.5–26.5° can be attributed to HG-graphene with 2–3 layers.20 Most importantly, XRD confirmed the absence of any extra-framework materials such as TiO2 or SiO2.20
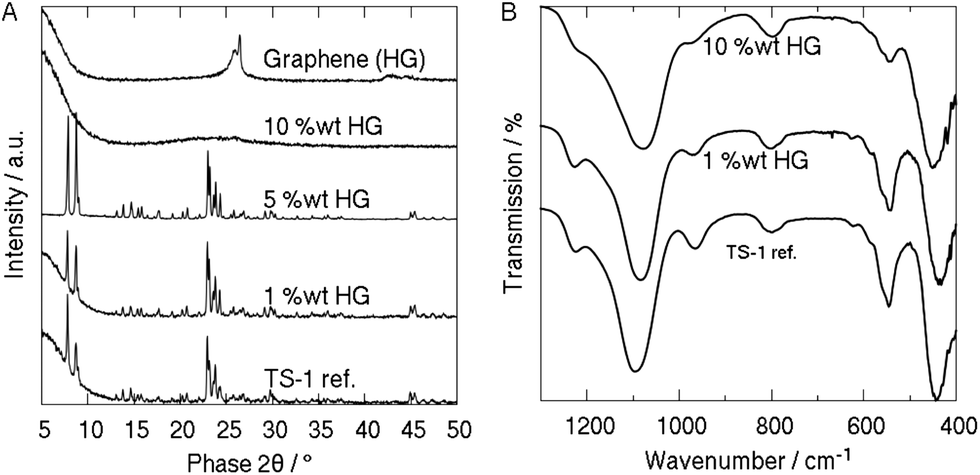 | ||
| Fig. 2 Characterization of TS-1 and graphene TS-1 hybrids. (A) X-ray diffraction of 0–10 wt% graphene TS-1 hybrids and pure graphene. (B) FTIR of 0–10 wt% graphene TS-1 hybrids. | ||
| a/Å | b/Å | c/Å | |
|---|---|---|---|
| Experiment | 20.14 | 19.94 | 13.42 |
| CLAYFF | 20.10 | 20.00 | 13.43 |
| % difference | 0.17 | −0.33 | −0.06 |
The samples were further analysed by FTIR and UV-Vis spectroscopy, shown in Fig. 2B and S4,† respectively. All samples display the major characteristics of TS-1: a strong peak at 960 cm−1, which corresponds to Si–O–Ti vibrations in ordered zeolitic MFI frameworks and is absent in titanium-free silicalite-1 or in extra-framework materials such as SiO2 or TiO2;29–31 and a band at 550 cm−1, which is associated with the double five membered ring in crystalline TS-1 zeolites.31 The absence of peaks at 850 and 1000 cm−1 confirms that no extra-framework anatase-TiO2 was formed,32 which is also in line with the XRD data. Interestingly, the band around 1100 cm−1 in the hybrids is significantly red-shifted with respect to the reference sample as well as to mechanical mixtures of TS-1 and graphene (i.e. composite20). In the case of RGO (Fig. 2B), we observed a red-shift of between 12 cm−1 (1 wt%) and 20 cm−1 (10 wt%), while HG-graphene caused a considerably stronger shift of about 60 cm−1 (Fig. S3†). Such a change has been associated with differences in crystal size (i.e. nanoparticles), surface strain, and the presence of adsorbates.20,29,33 Since the TS-1 particles in the reference sample and the 1 wt% HG-samples are comparable in size, the red-shift is most likely associated with the presence of graphene and indicates an intimate interaction at the graphene–TS-1 interface.
The UV-Vis spectrum (Fig. S4†) of the hybrid with 10 wt% HG shows strong absorption between 210 and 230 nm, which is characteristic of pπ–dπ charge transfer between O and isolated tetrahedral Ti in the Ti–O–Si MFI framework.31,33,34 Neither crystalline nor amorphous silicalite-1 show this behaviour.20,29 The weak shoulder at 285 nm is attributed to the presence of graphene, which has an absorbance maximum around 270 nm.35 Again, the small red-shift compared to the reference sample may be indicative of an intimate interface between TS-1 and graphene. Furthermore, the absence of an absorption band at 330 nm verifies that the sample is free of the extra-framework anatase-TiO2 phase,33 confirming both the XRD and FTIR results.
The crystal structure was further confirmed by electron microscopy, where all particle diffraction patterns were readily identifiable as TS-1, with the (010) face in particular forming the largest surface regardless of the particle morphology (Fig. 3).
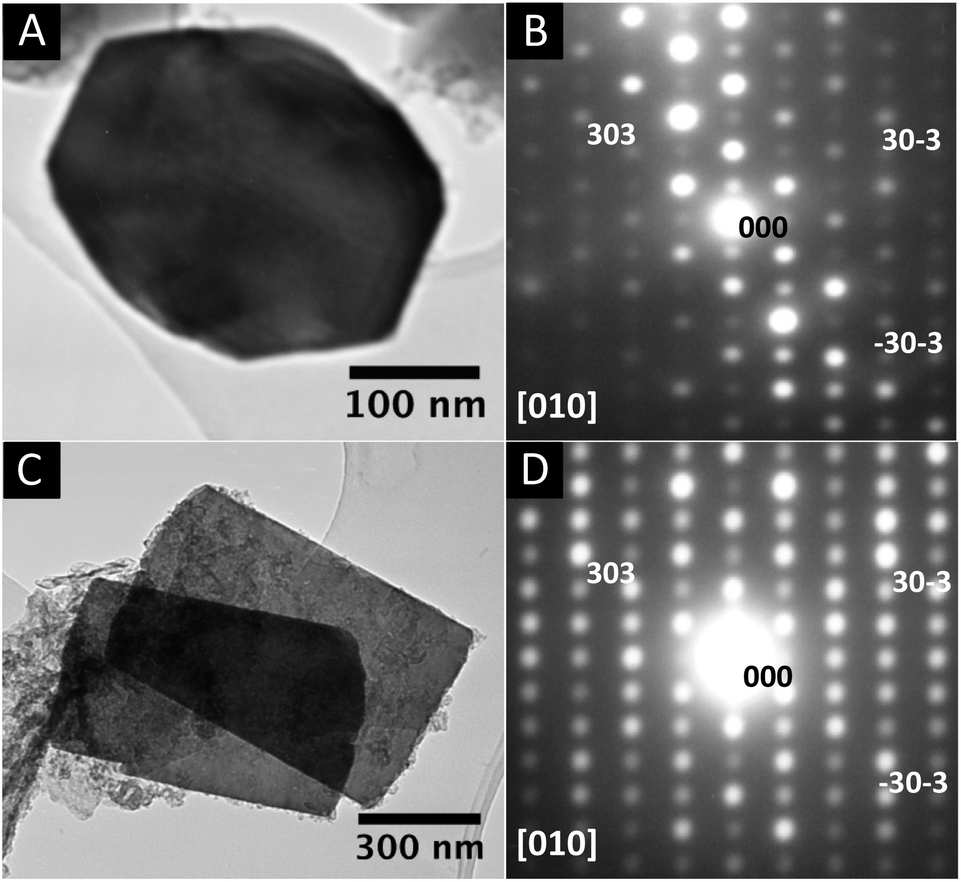 | ||
| Fig. 3 TEM micrographs and electron diffraction patterns of (A and B) hexagonal zeolite particles typical of pure TS-1 and (C and D) rectangular zeolite particles as found in the 5 wt% HG hybrid. The electron diffraction patterns are in both cases compatible with the TS-1 [010] zone axis and indexed accordingly. | ||
These results indicate that the observed changes in morphology strongly depend on the type of graphene added during synthesis. In the case of RGO, the TS-1 particles retain their “coffin-shape” morphology, but become longer with increasing RGO concentration. A similar elongation is observed with “coffin-shape” particles synthesized in the absence of graphene and with reduced precursor concentration in the reaction solution (Fig. S5†). This suggests that these morphological changes may simply be a result of reactant dilution. Thus, metal–organic molecules adsorb on structural defects in RGO, which have been created upon chemical reduction of GO,36 and are thereby removed from the reactant solution. Consequently, the large TS-1 particles observed in our experiments are grown in solution with minimum interaction with RGO, which is in line with FTIR and UV results.
By contrast, the morphological changes resulting from HG-graphene in synthesis are more complex and significant. In addition to the formation of ∼10 nm diameter particles, for example, it appears that at graphene concentrations just below nanoparticle formation the rectangular plates are occasionally fractured (Fig. 1G). These changes therefore suggest a different mechanism. To further understand the role of HG-graphene, we used atomistic simulations based on a classical molecular mechanics (MM) representation to investigate the adsorption of graphene and benzyl alcohol linking agent to various TS-1 surfaces.
First, we consider the intimate association of graphene and TS-1, to evaluate quantitatively the effects of surface strain due to mismatch in periodicities in the two materials. Second, we study the structure of BA–TS-1 interface, in order to confirm that the same surface facets of TS-1 that are acted on by graphene also show preferential interaction with TS-1. Our simulations do not explicitly include water as a solvent, since we consider that the primary action of BA is to compatibilize the hydrophobic graphene surface with the hydrophilic surfaces of TS-1. Although this interaction will be modified quantitatively by the presence of a hydrophilic solvent, it will not change the relative ordering of surface energies (we do not take into account any secondary effects resulting from changes in solvent structure). Consistent with our previous studies of the interaction of benzyl alcohol with TiO2 and graphene surfaces25 we used the Dreiding force field37 to describe benzyl alcohol and graphene, whilst the zeolite was described using CLAYFF.38 The van der Waals interactions between the two force fields were derived using the standard Lorentz–Berthelot mixing rules.39 All simulations were performed using the molecular dynamics package DL_POLY classic.40
The initial configuration used for the simulations was the experimental structure for TS-1 reported by Henry et al.41 A 1 × 1 × 2 super-cell was relaxed using the conditions described above and the average structure from the last quintile of the simulation was compared to the experimental structure. As can be seen in Table 1, there is excellent agreement between the two sets of lattice parameters, with the difference between experiment and simulation being considerably less than 1%, giving confidence in the ability of the chosen force field parameters to adequately reproduce the structure of TS-1.
The relaxed structure was then orientated so each of the seven low index surfaces were perpendicular to the x-axis and a series of potential surface terminations were developed subject to the restriction that there was no dipole perpendicular to the surface. Static energy minimisation was used to determine the most stable surface structures, relative to vacuum, on which molecular dynamics simulations were then performed. The surface energy is defined as the excess in energy of the surface simulation over a bulk simulation containing the same number and type of atoms. These results are shown in Table 2 (2nd column) and can be used to predict the likely structure of the equilibrium morphology via a Wulff construction, which is shown in Fig. 4 (with percentage of each surface present given in the 4th column of Table 2). A further set of simulations were run with the corresponding surfaces in contact with graphene (in basal plane orientation), with their relative position in the y–z plane (relative to graphene basal plane) adjusted to minimise any lattice mismatch. It was not possible to obtain a stable (111) TS-1 surface in contact with graphene due to large lattice mismatch. The resulting surface energies are also shown in Table 2 (5th column).
| INDEX | γ (vacuum) [J m−2] | RANK (vacuum) | % Area covered | γ (graphene) [J m−2] | RANK (graphene) |
|---|---|---|---|---|---|
| (001) | 1.12 | 5 | 0.00 | 1.08 | 6 |
| (010) | 0.90 | 1 | 24.67 | 0.85 | 2 |
| (011) | 0.99 | 3 | 16.08 | 0.97 | 4 |
| (100) | 1.10 | 4 | 4.10 | 0.89 | 3 |
| (101) | 0.92 | 2 | 43.22 | 0.72 | 1 |
| (110) | 1.14 | 6 | 10.00 | 1.07 | 5 |
| (111) | 1.18 | 7 | 1.92 | — | — |
 | ||
| Fig. 4 Equilibrium morphology of TS-1 calculated in vacuum using Wulff construction with surface energies listed in Table 2 (2nd column). | ||
These results suggest that the morphology of pure TS-1, produced without graphene, is dominated by the (010), (101), (011) and (100) surfaces. In particular, the (010) surface has the lowest surface energy at equilibrium (0.90 J m−2), which fits well with experimental results since electron microscopy also found this face to be the most prominent (Fig. 3).
Upon the addition of graphene to the zeolite, however, both the simulated surface energies and the experimentally observed zeolite morphology change significantly. We propose that these changes are related in that the presence of graphene during crystal growth changes the relative surface energies as a result of its different adsorption preferences. The change in relative surface energies then alters the crystal morphology when TS-1 crystal seeds adsorb on graphene prior to the hydrothermal crystallization step. TEM diffraction patterns (Fig. 3) suggest that the largest surface of the 5 wt% hybrid is (010), accounting for ∼80% of the total surface area. This is somewhat surprising since the preferential adsorption of graphene renders (101) as the most energetically favoured surface, while (010) has only the second lowest energy (Table 2). This may, though, indicate that graphene only begins to adsorb once the crystal has reached a size at which point the (010) face is already predominant.
Nevertheless, this apparent discrepancy may also be the driving force for the subsequent changes in morphology that occur with further increases in graphene concentration. Presumably at low (less than 5 wt%) concentrations graphene adsorbs on the preferred (101) and related surfaces perpendicular to the (010). This is in line with our TEM observations (Fig. 3), with the adsorption potentially being responsible for chamfering of the edges in the hexagonal prismatic particles eventually leading to circular plate formation. With increasing concentration, the graphene begins to saturate the second most favoured surface, i.e. (010), increasing further its contribution to the total surface area and thereby changing the morphology to the rectangular plates observed. The extension of the (010) surface as well as the thickness of the plates are limited by the residual lattice mismatch between graphene and the (010) surface. This mismatch induces strain in the bulk TS-1 crystals, which first leads to particle flaking and eventually to the particles breaking into the nanoparticles seen in Fig. 1G. This is also supported by nitrogen physisorption studies (Fig. S2†), which revealed the presence of large mesopores (i.e. 8–9 nm) and indicate an ordering of the nanoparticles on the graphene surface, and from molecular simulations that show specific interactions between certain crystalline facets of TS-1 and graphene (Fig. S7–S13†).
In order to quantify this effect and predict the maximum dimensions of these rectangular plates before they break into nanoparticles, we compared the relative energies of (010)gra and (010)vac for a putative cubic crystal with the energies of the perpendicular (100)vac or (001)vac surfaces created if such a crystal was to fracture (and thereby relieve any lattice strain). Such a calculation (see ESI†) leads to an estimate for the maximum size of the graphene–TS-1 crystal of approximately 10 nm, in good agreement with the crystal sizes observed experimentally in Fig. 1. Furthermore, molecular dynamics simulations of the BA–TS-1 interface (see ESI†) show that there are more significant energy minima for the adsorption of benzyl alcohol on the (010) and (101) surfaces of TS-1, which dominate the equilibrium morphology, as opposed to (001), which is absent from the morphology. These results support the hypothesis that size control of TS-1 crystals is achieved by BA-mediated surface adsorption of graphene onto specific crystalline facets of TS-1, thus inhibiting the formation of the bulk TS-1 morphology.
Experimental section
Few-layer graphene (HG) was produced through direct current arc discharge of graphite, carried out in a water-cooled stainless steel chamber containing an atmosphere of hydrogen (70 Torr) and helium (500 Torr). Typically, the cathode was a graphite rod (Alfa Aesar 99.999% purity) with dimensions of 6 mm diameter and 50 mm length, whilst the anode was a similar graphite rod but 13 mm in diameter and 60 mm in length. The discharge current used was 100 A and the maximum open circuit voltage was 60 V. To maintain the arc, the anode was continuously translated to maintain a distance of 2 mm from the cathode. Synthesis was usually carried out for 10 minutes. Afterwards, the soot material that appeared to be web-like was found on the inner walls of the reaction chamber, and around the cathode after evaporation.Graphene oxide (GO) was typically prepared by dispersing natural graphite flake powder (3 g) and sodium nitrate (3 g) in concentrated H2SO4 (150 ml). Afterwards, KMnO4 (9 g) was gradually added and the mixture was stirred at 40 °C for 2 h. Subsequently, 150 ml de-ionized water was also added gradually causing an increase in temperature to 98 °C. After 20 min, H2O2 (30 ml 80% solution) was added to the mixture. After stirring for 10 min DI water (80 ml) was added and the GO material was sedimented for 2 days. After decantation, the material was washed with diluted HCl and DI water until reaching the pH = 7. The obtained GO was dried at room temperature and under light vacuum and afterwards ground using an agate mortar.
To reduce GO to reduced graphene oxide (RGO), typically 300 mg of GO powder was dispersed in DI water (300 ml) in a sonicated bath. Sodium borohydrate (NaBH4) (3 g) was added to the dispersion and the mixture was kept at 95 °C for 4 h under constant stirring, resulting in a colour change from brown to black. After the solution was cooled down, the mixture was filtered and washed several times with DI water and dried at 60 °C.
TS-1 zeolite was produced using a sol–gel process with tetrabutyl orthotitanate (TBOT) and tetraethyl orthosilicate (TEOS) precursors, water as the gelator, and tetrapropylammonium bromide hydroxide (TPAOH) as the micropore template. The eventual molar ratio of Si![[thin space (1/6-em)]](https://www.rsc.org/images/entities/char_2009.gif) :Ti:TPAOH:H2O:BA was 0.98:0.02:0.2:100:0.3. Typically, the TEOS and TBOT were mixed and slowly dropped to a mixture of TPAOH, BA and H2O under vigorous stirring. This resulted in a cloudy mixture, which became clear within less than 1 h. After another 20 h of stirring, 7 ml of the as obtained clear TS-1 sol was loaded into a Teflon lined autoclave and heated to 180 °C for 15 h. The products were then washed using distilled water, before being dried at 90 °C overnight and then calcined at 400 °C for 5 h.
:Ti:TPAOH:H2O:BA was 0.98:0.02:0.2:100:0.3. Typically, the TEOS and TBOT were mixed and slowly dropped to a mixture of TPAOH, BA and H2O under vigorous stirring. This resulted in a cloudy mixture, which became clear within less than 1 h. After another 20 h of stirring, 7 ml of the as obtained clear TS-1 sol was loaded into a Teflon lined autoclave and heated to 180 °C for 15 h. The products were then washed using distilled water, before being dried at 90 °C overnight and then calcined at 400 °C for 5 h.
TS-1 graphene hybrids were produced using the process for pure TS-1 described above, but in the presence of graphene. The graphene was initially suspended in 5 ml ethanol with the help of benzyl alcohol (BA), before being mixed with the clear TS-1 sol. All samples contained 0.3 mol eq. of BA with respect to the combined Si and Ti precursors. The graphene concentration ranged between 1 wt% and 20 wt% with respect to the expected total mass of the hybrid.
Materials characterisation
Raman spectroscopy was carried out using a Jobin Yvon LabRam HR spectrometer with a 632 nm Ar laser, and taken on different locations on the sample. A JEOL 200CX at 200 kV and JEOL 4000EX at 400 kV, fitted with a Gatan CCD camera was used to take the TEM images. STA measurements were carried out on a NETZSCH-STA 409C with a heating rate of 10 K min−1 up to T = 1000 °C. A Micromeritics ASAP2020 was used for the physisorption measurements. X-ray diffraction (XRD) was carried out using a Bruker D8 Advance, with Cu-Kα radiation, operated at 40 kV and 40 mA, λ = 1.5406 Å. All runs were done with 2θ from 5 to 60°, an increment of 0.04 and a scan speed of 0.8 s per step.Molecular simulations were performed at an absolute temperature of 300 K, using an NVT ensemble, with the exception of the optimization of the initial bulk structure where an NpT ensemble was used to allow the size of the simulation cell to change. Both ensembles made use of a Nose–Hoover thermostat with a period of 0.1 ps and, in the case of the NpT simulation, a barostat with a period of 0.5 ps. All production runs represent 1 ns of simulation time using a time step of 1 fs, with temperature scaling applied for the first 10 ps of the simulation.
Conclusions
Our work demonstrates that graphene addition to synthesis is a facile means of significantly changing the TS-1 morphology, in particular enabling the production of zeolite nanoparticles with enhanced external surface area. Through further structural and computational analysis, we propose a mechanism based on the preferential interaction of specific TS-1 surfaces with benzyl-alcohol-mediated graphene, which transforms the hexagonal prismatic TS-1 particles into thin rectangular plates that subsequently break up into nanoparticles due to graphene induced strain. Therefore, graphene is not only able to significantly enhance photocatalytic activity in hybrid materials through charge and heat transfer processes, but also to effect morphological changes that can be further used to control material properties. Moreover, the generality of the surface energy-based effects that appear to govern the morphology change suggests that graphene, or even other two-dimensional materials, could be used to control the morphology of many other crystalline materials. In this way, crystal engineering with graphene opens a new avenue of research into controlling the morphology and properties of functional inorganic materials.Acknowledgements
We thank Prof C. N. R. Rao (Bangalore) for providing HG-graphene and H. Hu (Münster) for providing GO/RGO.References
- J. Pérez-Ramírez, C. H. Christensen, K. Egeblad, C. H. Christensen and J. C. Groen, Chem. Soc. Rev., 2008, 37, 2530–2542 RSC.
- S. Pattinson, V. Ranganathan, H. Murakami, K. Koziol and A. Windle, ACS Nano, 2012, 6(9), 7723 CrossRef CAS PubMed.
- H. Zhang, W. Li, M. Jin, J. Zeng, T. Yu, D. Yang and Y. Xia, Nano Lett., 2011, 11, 898–903 CrossRef CAS PubMed.
- N. Bouazza, M. Ouzzine, M. A. Lillo-Ródenas, D. Eder and A. Linares-Solano, Appl. Catal., B, 2009, 92, 377–383 CrossRef CAS PubMed.
- G. Calzaferri, S. Huber, H. Maas and C. Minkowski, Angew. Chem., Int. Ed., 2003, 42, 3732–3758 CrossRef CAS PubMed.
- Z. Lai, G. Bonilla, I. Diaz, J. G. Nery, K. Sujaoti, M. a. Amat, E. Kokkoli, O. Terasaki, R. W. Thompson, M. Tsapatsis and D. G. Vlachos, Science, 2003, 300, 456–460 CAS.
- X. Li, G. Meng, Q. Xu, M. Kong, X. Zhu, Z. Chu and A.-P. Li, Nano Lett., 2011, 11, 1704–1709 CrossRef CAS PubMed.
- S. W. Pattinson, a. H. Windle and K. K. K. Koziol, Mater. Lett., 2013, 93, 404–407 CrossRef CAS PubMed.
- G. R. Desiraju, Angew. Chem., Int. Ed., 2007, 46, 8342–8356 CrossRef CAS PubMed.
- D. Braga and F. Grepioni, Chem. Commun., 2005, 3635–3645 RSC.
- M. D. Ward, Chem. Rev., 2001, 101, 1697–1725 CrossRef CAS PubMed.
- M. E. Davis, Nature, 2002, 417, 813–821 CrossRef CAS PubMed.
- A. Taguchi and F. Schüth, Microporous Mesoporous Mater., 2005, 77, 1–45 CrossRef CAS PubMed.
- M. Choi, H. S. Cho, R. Srivastava, C. Venkatesan, D.-H. Choi and R. Ryoo, Nat. Mater., 2006, 5, 718–723 CrossRef CAS PubMed.
- M. Choi, K. Na, J. Kim, Y. Sakamoto, O. Terasaki and R. Ryoo, Nature, 2009, 461, 246–249 CrossRef CAS PubMed.
- C. Lee, X. Wei, J. W. Kysar and J. Hone, Science, 2008, 321, 385–388 CrossRef CAS PubMed.
- C. Berger, Z. Song, X. Li, X. Wu, N. Brown, C. Naud, D. Mayou, T. Li, J. Hass, A. N. Marchenkov, E. H. Conrad, P. N. First and W. A. de Heer, Science, 2006, 312, 1191–1196 CrossRef CAS PubMed.
- L. Liao, Y.-C. Lin, M. Bao, R. Cheng, J. Bai, Y. Liu, Y. Qu, K. L. Wang, Y. Huang and X. Duan, Nature, 2010, 467, 305–308 CrossRef CAS PubMed.
- F. Schedin, A. K. Geim, S. V. Morozov, E. W. Hill, P. Blake, M. I. Katsnelson and K. S. Novoselov, Nat. Mater., 2007, 6, 652–655 CrossRef CAS PubMed.
- Z. Ren, E. Kim, S. W. Pattinson, K. S. Subrahmanyam, C. N. R. Rao, A. K. Cheetham and D. Eder, Chem. Sci., 2012, 3, 209–216 RSC.
- K. S. Subrahmanyam, L. S. Panchakarla, A. Govindaraj and C. N. R. Rao, J. Phys. Chem. C, 2009, 113, 4257–4259 CAS.
- D. Eder, Chem. Rev., 2010, 110, 1348–1385 CrossRef CAS PubMed.
- J. J. Vilatela and D. Eder, ChemSusChem, 2012, 5, 456–478 CrossRef CAS PubMed.
- A. S. Cherevan, P. Gebhardt, C. J. Shearer, M. Matsukawa, K. Domen and D. Eder, Energy Environ. Sci., 2014, 7, 791–796 CAS.
- D. J. Cooke, D. Eder and J. A. Elliott, J. Phys. Chem. C, 2010, 114, 2462–2470 CAS.
- N. Phonthammachai, M. Krissanasaeranee, E. Gulari, A. M. Jamieson and S. Wongkasemjit, Mater. Chem. Phys., 2006, 97, 458–467 CrossRef CAS PubMed.
- C. S. Cundy, J. O. Forrest and R. J. Plaisted, Microporous Mesoporous Mater., 2003, 66, 143–156 CrossRef CAS PubMed.
- J. L. Schlenker and B. K. Peterson, J. Appl. Crystallogr., 1996, 29, 178–185 CrossRef CAS.
- B. Notari, Catal. Today, 1993, 18, 163–172 CrossRef CAS.
- B. Kraushaar and J. H. C. Van Hooff, Catal. Lett., 1988, 1, 81–84 CrossRef CAS.
- H. Xin, J. Zhao, S. Xu, J. Li, W. Zhang, X. Guo, E. J. M. Hensen, Q. Yang and C. Li, J. Phys. Chem. C, 2010, 114, 6553–6559 CAS.
- G. Chen, W. Weng, D. Wu, C. Wu, J. Lu, P. Wang and X. Chen, Carbon, 2004, 42, 753–759 CrossRef CAS PubMed.
- A. Tuel and Y. B. Taarit, Microporous Mater., 1993, 1, 179–189 CrossRef CAS.
- B. Notari, in Studies in Surface Science and Catalysis, ed. R. K. Grasselli and A. W. Sleight, Elsevier, 1991, vol. 67, pp. 243–256 Search PubMed.
- E.-Y. Choi, T. H. Han, J. Hong, J. E. Kim, S. H. Lee, H. W. Kim and S. O. Kim, J. Mater. Chem., 2010, 20, 1907–1912 RSC.
- C. Gómez-Navarro, J. C. Meyer, R. S. Sundaram, A. Chuvilin, S. Kurasch, M. Burghard, K. Kern and U. Kaiser, Nano Lett., 2010, 10, 1144–1148 CrossRef PubMed.
- S. L. Mayo, B. D. Olafson and W. A. Goddard, J. Phys. Chem., 1990, 94, 8897–8909 CrossRef CAS.
- R. T. Cygan, J.-J. Liang and A. G. Kalinichev, J. Phys. Chem. B, 2004, 108, 1255–1266 CrossRef CAS.
- J. H. Harding and D. M. Duffy, J. Mater. Chem., 2006, 16, 1105–1112 RSC.
- W. Smith and T. R. Forester, J. Mol. Graphics, 1996, 14, 136–141 CrossRef CAS.
- P. F. Henry, M. T. Weller and C. C. Wilson, J. Phys. Chem. B, 2001, 105, 7452–7458 CrossRef CAS.
Footnotes |
| † Electronic supplementary information (ESI) available. See DOI: 10.1039/c4nr00320a |
| ‡ These authors contributed equally to this work. |
| This journal is © The Royal Society of Chemistry 2014 |