 Open Access Article
Creative Commons Attribution 3.0 Unported Licence
Vacancy diffusion and coalescence in graphene directed by defect strain fields†
Thomas
Trevethan
*a,
Christopher D.
Latham
a,
Malcolm I.
Heggie
a,
Patrick R.
Briddon
b and
Mark J.
Rayson
a
aDepartment of Chemistry, University of Surrey, Guildford, GU2 7XH, UK. E-mail: t.trevethan@surrey.ac.uk
bPhysics Centre, School of Natural Science, University of Newcastle upon Tyne, Newcastle, NE1 7RU, UK
First published on 21st January 2014
Abstract
The formation of extended defects in graphene from the coalescence of individual mobile vacancies can significantly alter its mechanical, electrical and chemical properties. We present the results of ab initio simulations which demonstrate that the strain created by multi-vacancy complexes in graphene determine their overall growth morphology when formed from the coalescence of individual mobile lattice vacancies. Using density functional theory, we map out the potential energy surface for the motion of mono-vacancies in the vicinity of multi-vacancy defects. The inhomogeneous bond strain created by the multi-vacancy complexes strongly biases the activation energy barriers for single vacancy motion over a wide area. Kinetic Monte Carlo simulations based on rates from ab initio derived activation energies are performed to investigate the dynamical evolution of single vacancies in these strain fields. The resultant coalescence processes reveal that the dominant morphology of multi-vacancy complexes will consist of vacancy lines running in the two primary crystallographic directions, and that more thermodynamically stable structures, such as holes, are kinetically inaccessible from mono-vacancy aggregation alone.
Introduction
Atomic scale defects in graphene and other graphitic structures can have a profound influence on the overall behaviour of these materials, either as the root cause of degradation that needs to be predicted and controlled, or as the source of new properties to be exploited. The ‘defect engineering’ of graphite, graphene and other carbon nanostructures both during fabrication and post-growth with energetic particle irradiation is now considered a key tool to modify and control important macroscopic material properties.1,2 The effect that irradiation induced point defects will have on the electrical, chemical and mechanical properties of a graphene layer will depend upon the structures and properties of aggregates and complexes that are formed if individual point defects are free to diffuse and react via thermal activation.3,4Arguably the most important point defect in graphene is the single vacancy. This defect is formed when a single carbon atom is removed from its lattice position, often as a result of a collision with an energetic particle when under irradiation, leaving three dangling bonds on the adjacent atoms. This structure undergoes a spontaneous Jahn–Teller distortion where two of the neighbouring atoms bond weakly to form a 5 fold ring, leaving one dangling bond remaining (labelled as the 5–9 structure).5,6 This asymmetric structure can switch between the three equivalent orientations via a small (ca. 0.1 eV) barrier. Extensive quantum chemical calculations employing various methods have determined that the activation energy for vacancy diffusion between neighbouring lattice sites is in the range 1.1–1.3 eV,7–13 which means that the defect will begin to become mobile at slightly above room temperature – this has been observed and confirmed directly in real time on the graphite (HOPG) (0001) surface with atomic resolution scanning probe microscope imaging.14 When vacancies in graphene become mobile, they will react with each other and coalesce to form vacancy pairs and higher order complexes, which can take the form of a variety of different morphologies. The nature of these defect structures will substantially affect the properties of the sheet,3,4,15 and predicting these morphologies is crucial for optimizing the performance of graphene based materials. Different overall defect morphologies will lead to very different material property changes. Aggregation into a line of missing atoms creates a slot which can ‘heal’ leaving dislocations or stacking faults and causing a contraction in the plane. Aggregates with aspect ratios closer to one may lead either to ‘holes’ which will reduce elastic moduli and allow molecules to pass through the plane, or other more complex topological defects involving rotated bonds and grain boundaries.
When two individual diffusing mono-vacancies meet they will coalesce into a nearest-neighbour di-vacancy defect (equivalent to removing a carbon dimer from the lattice). This process releases approximately 8 eV (ref. 7, 10 and 11) and results in the formation of the stable pentagon–octagon–pentagon (5–8–5) structure, which has been widely observed in high-resolution transmission electron microscopy (HRTEM) images.16–19 The process of di-vacancy coalescence has been studied by several authors,7,10,11 and found to occur readily at moderate temperatures with the highest activation barrier to be crossed in the range 1.2–2.1 eV. This di-vacancy structure is immobile, with a high barrier to thermal diffusion, but it can transform to the even more energetically stable (by approximately 1 eV) 555–777 haeckelite structure via a bond rotation, a morphology which is also observed in electron beam damaged graphene.12,16,19 The energy barrier to this transformation is greater than 5 eV,7,10,11 and therefore this state is considered to be inaccessible from thermal activation alone, but can evidently be accessed by sub-threshold excitations from an electron beam.20 An additional bond rotation can transform this structure into the 5555–6–7777 structure16 which is a grain boundary loop (‘flower’) defect.21
Once formed, the immobile 5–8–5 di-vacancy will act as a nucleation site for further coalescence of additional mobile mono-vacancies to form higher order multi-vacancy structures. The structures arising from this coalescence will be more complex, and it is not immediately clear which morphologies will result. HRTEM images of graphene reveal a number of different structures formed from electron beam damage: these often consist of lines of vacancies running in the two low index directions, as well as extended haeckelite type structures forming grain boundaries.16,17 Vacancy lines may heal (i.e. form sp2 bonds across the vacancy line to pair dangling bonds, pulling in material from either side) to create dislocation dipoles or stacking faults, resulting in substantial strain to the surrounding lattice.17,18,22–24 Furthermore, a vacancy line in the armchair direction has also been observed in Scanning Tunnelling Microscopy experiments on HOPG irradiated with carbon ions.25
In general even numbered vacancy complexes will be more stable than odd numbered ones,26 since in the former there will be an even number of dangling bonds that can mutually bind. But with just four vacancies coalescing there are several different possible stable morphologies that do not involve any bond rotations, that would require the crossing of large (>5 eV) barriers to form. There have been several studies employing atomistic simulations on the relative energetics of different structure multi-vacancy defects in graphene.26–29 They have all found that for a four vacancy aggregate (V4) the lowest energy structure is the ‘loop’ or ‘hole’ type morphology – corresponding to a single C atom and its three nearest neighbours being removed from the lattice. This trend continues as the size of the multi-vacancy increases, with the hole-type structure lowest in energy. The two types of line isomers, running in the two main crystallographic directions (a straight line of atoms removed in the [10![[1 with combining macron]](https://www.rsc.org/images/entities/char_0031_0304.gif) 0] direction and a zig-zag line of atoms in the [11
0] direction and a zig-zag line of atoms in the [11![[2 with combining macron]](https://www.rsc.org/images/entities/char_0032_0304.gif) 0] direction), are found to be higher in energy – even though these are the morphologies typically observed in atomic resolution images of electron beam damaged graphene.12
0] direction), are found to be higher in energy – even though these are the morphologies typically observed in atomic resolution images of electron beam damaged graphene.12
Although the ‘hole’ type morphology, or structures incorporating bond rotations, may be lower in energy, the structures that actually result from the coalescence of vacancies at finite temperatures will be determined by the mechanism of their formation, and the kinetic pathways and barriers to the formation of each morphology or isomer. Although higher energy structures are technically metastable, the barriers that separate them from the global minimum will be substantially larger than the barrier for monovacancy diffusion.
Recent studies have revealed that multi-vacancy defects in graphene can create substantial and inhomogeneous displacement strain that extends far into the surrounding lattice.23,30–33 This is caused by the reconstruction induced by the pair-wise removal of dangling bonds. Another recent study has also determined that the activation energy for the diffusion of a single vacancy in graphene is extremely sensitive to in-plane uni-axial strain, both parallel and perpendicular to the direction of the hopping motion of a single vacancy, with the barrier doubled or halved with respectively tensile or compressive strain of just 2–3%.34,35 In this report we show that these two phenomena cooperate to pull and channel mobile vacancies into particular directions surrounding a multi-vacancy complex, through the operation of the inhomogeneous strain field induced by the complex strongly biasing the motion of diffusing mono-vacancies. This in turn leads to the growing multi-vacancy adopting particular morphologies that do not necessarily correspond to the global or thermodynamic minimum energy structure.
To achieve this, we have mapped out the potential energy surface for the reaction of a mono-vacancy with both the V2 and V3 multi-vacancy defects, employing chemically accurate density functional theory (DFT) calculations. This, along with the potential energy surface for vacancy dimerisation, provides the complete accessible energy surface for the diffusion limited coalescence of mono-vacancies up to V4. We use this energy surface to simulate the coalescence process with the kinetic Monte Carlo algorithm which gives both quantitative rates for the coalescence and also definitive probabilities of different morphologies forming at finite temperatures.
Results and discussion
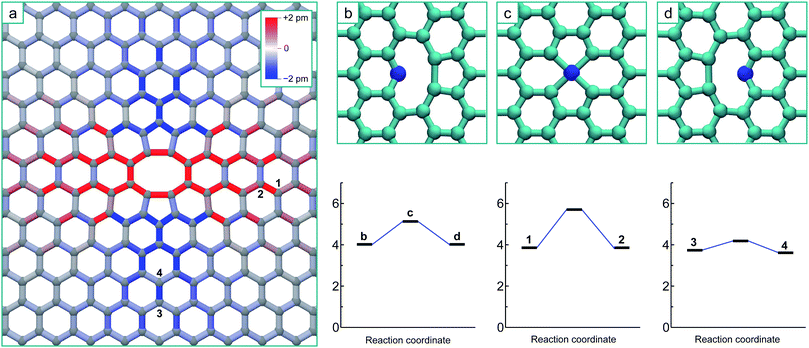
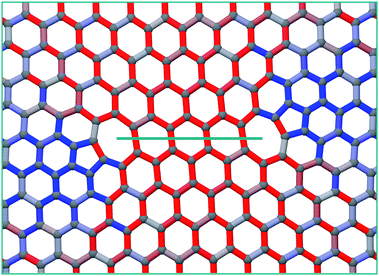
To simulate the graphene system with both chemical accuracy and computational efficiency, we employ the density functional theory (DFT) method with both the Local Density Approximation (LDA)36 and Generalized Gradient Approximation (GGA).37 These calculations were performed using the AIMPRO simulation code,38 employing atomic basis functions39 and HGH psudopotentials.40 The graphene defects were represented in orthorhombic supercells, containing 8 × 4 orthorhombic unit cells (128 atoms), 12 × 6 unit cells (288 atoms) and 14 × 7 unit cells (392 atoms) to ensure the convergence of the results with system size. A Monkhorst 5 Pack k-point mesh of 4 × 4 × 1 points was determined to give total energy convergence for each system size. A vacuum gap of 1.3 nm between periodic images in the direction perpendicular to the plane is used throughout, ensuring there is no interaction. Potential energy minima are determined by optimizing the position of all atoms with respect to the total energy until the maximum force on any atom falls below 0.1 eV nm−1. The minimum energy path between adjacent minima is calculated using the climbing image nudged elastic band method (NEB)41,42 and chains consisting of 9 images are employed. Activation energies for diffusion are determined by the height of the saddle-point relative to the energy minimum.Fig. 1a shows the optimized structure of the 5–8–5 di-vacancy structure in the 12 × 6 supercell, where the total energy of this defect relative to two separated mono-vacancies (the coalescence energy) is 8.4 eV with the LDA and 8.2 eV with the GGA. The sp2 bonds in this figure are coloured according to the bond length change in order to visualize the strain imposed upon the surrounding lattice by the reconstruction. The surrounding lattice is under tension across the defect (perpendicular to the line formed by the two missing atoms) and under compression above and below it (parallel to the line): this is a direct result of the formation of the two bonds creating the two 5-fold rings.
The V3, or tri-vacancy, complex will be formed as another mono-vacancy diffuses to and reacts with the di-vacancy. Far from the di-vacancy, in the undisturbed graphene lattice, this diffusion will occur via a jump between equivalent neighbouring lattice positions over the saddle point depicted in Fig. 1c. This diffusion barrier is calculated to be 1.2 eV with both the LDA and GGA, in good agreement with previous studies.7–13 In the vicinity of the di-vacancy, the distortion caused by the strain may change the height of this barrier between states and/or change the absolute energies of the minima defined by the relative position of the mono-vacancy.
To illustrate the effect that the strain created by the di-vacancy has on the potential energy surface for the mono-vacancy, we calculated the minimum energy paths using the NEB method for a mono-vacancy to move between lattice positions 1 and 2, and between positions 3 and 4 in Fig. 1a. It should be noted that the asymmetric strain from the interaction with the di-vacancy forces the mono-vacancy to adopt a single reconstruction (as opposed to the three different orientations it can assume in perfect graphene29). The barrier for moving the vacancy from position 1 to 2 is significantly higher than for the perfect lattice, at 1.8 eV (with both LDA and GGA), even though the energy difference between the two configurations is less than 0.1 eV. For the transition of the vacancy from lattice position 3 to 4 the barrier is reduced by more than half to 0.4 eV (with both LDA and GGA), even though again, the two neighbouring sites are very close in energy, with only a 0.1 eV difference between them. These dramatic changes are a result of the sensitivity of the saddle point energy to the bond strains experienced at these different locations: the bond linking positions 1 and 2 is stretched by 1.6% and linking positions 3 and 4 compressed by 1.2% by the di-vacancy reconstruction. The barrier is increased in the direction of tension and decreased in the direction of compression.
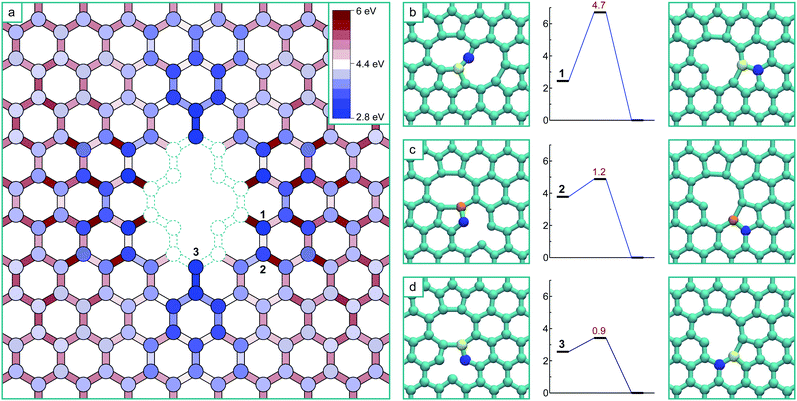
Based on the strain depicted in Fig. 1 and these two selected transitions, intuition may suggest that vacancies would diffuse towards the areas above and below the di-vacancy that are under overall compressive strain parallel to y-axis. However to definitively analyse the coalescence process it is necessary to systematically map out the entire potential energy surface for the mobile mono-vacancy by determining each possible different non-equivalent potential energy minimum for the vacancy in relation to the di-vacancy and all of the transition paths that separate them, including the final transitions to the ground state (using the NEB method). The results of this endeavour are shown in the schematic in Fig. 2a, where the potential energy surface for the mono-vacancy is represented on the graphene lattice. The circles on lattice sites represent potential energy minima for the vacancy located at that site (i.e. the atom at that position missing) and the rectangles between them (the ‘bonds’) represent the saddle points on the minimum energy paths connecting the minima. Minima and saddle points are coloured according to the total energy of the system relative to the final V3 ground state. The dashed area represents both the nearest neighbour positions and un-stable (inaccessible) 2nd nearest neighbour positions. The potential energy surface for the mono-vacancy is determined up until the 9th nearest neighbour positions (from the di-vacancy), where the barriers to move away from the di-vacancy differ by less than 0.05 eV from that of the unstrained graphene. It can be seen from the schematic that barriers are increased in the areas either side of the di-vacancy and decreased above and below it, corresponding to the areas of tension and compression in Fig. 1a. However, there is no direct relationship between individual bond strain and change in barrier due to the inhomogeneous nature of the strain and the three different hopping directions. The barrier for a particular mono-vacancy transition is not solely dependent on the corresponding bond length in that direction, but also on the surrounding strain: i.e. the corresponding bond lengths to the other nearest-neighbour positions.
All of the transitions that constitute the movement of the mono-vacancy consist of single atom hops of one of the three neighbouring atoms into the vacancy position (as in Fig. 1b–d), up until the mono-vacancy gets to a third nearest neighbour position from the di-vacancy. At these points, the final transitions into the ground state occur via a more complex movement involving a cooperative motion of the 1st and 2nd nearest neighbour atoms, as depicted by the three non-equivalent transitions (from positions 1, 2 and 3) depicted in Fig. 2b–d.
As can be seen from Fig. 2, there is a single stable morphology resulting from the coalescence of a mono-vacancy with the di-vacancy, even though there are different pathways to its formation. This consists of two reconstructed 5-membered rings and a 10-membered ring with a single dangling bond, and is shown in Fig. 3, coloured with the corresponding bond strains. Here it can be seen that, as in the case of the di-vacancy, the reconstruction causes a tensile strain across the defect as it is pulled in from the bond reconstructions forming the two pentagons, and compressive strain emanating from the vertices of the two pentagons. This structure has been observed directly in HRTEM images of irradiated graphene.43
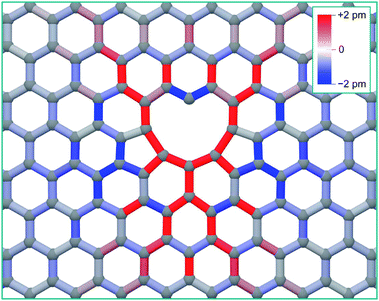 | ||
| Fig. 3 Structure of the tri-vacancy ground state, with interatomic bonds coloured according to strain from the equilibrium graphene bond length of 0.142 nm. | ||
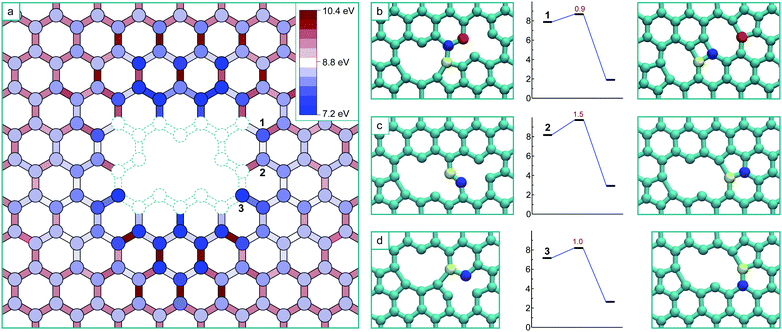
The formation of a V4 defect will result from the reaction of another mobile vacancy with the V3 structure. As in the case for the di-vacancy, we systematically mapped out the potential energy surface for a mono-vacancy reacting with the V3 defect, including exploring all possibilities for structures formed as a result of the coalescence. The results of this are summarized in Fig. 4a, where the schematic has the same meaning as before, and the colouring scheme for the potential energy minima and barrier heights is relative to the global minimum of the V4 (the ‘hole’ structure). This system has only one mirror plane, reducing the symmetry, however the effect of the strain field converges more quickly in this case, only requiring he determination of the potential energy surface up to the 8th nearest neighbour positions.
As in the case of the formation of V3, all transitions are single atom hops except for the final transitions to coalesced stable structures which consist of more complex cooperative motions. Three of the final transitions result in two of the stable structures and are depicted in Fig. 4b–d along with their activation energies. The final transitions to the other two structures – the global minimum ‘hole’ morphology and a higher energy ‘U’ shaped morphology – are not shown as barriers of more than 3 eV must be crossed to access them and are therefore considered thermally inaccessible at low temperatures (below about 1000 K). Unlike in the case of the formation of the V3, there are several (four) distinct stable structures that are the result of the coalescence occurring via different pathways on this potential energy surface. Each of these structures are stable in that all barriers to further structural change are high, and that for the technically meta-stable states, the barriers for transitions to move into the global minimum are thermally inaccessible.
The ‘hole’ configuration that would result from removing the under-coordinated atom from the V3 (Fig. 3) is the global minimum for the V4. This coalescence process releases 8.4 eV in total (8.3 eV with GGA). The next lowest energy configuration is the arm-chair direction line (shown in Fig. 4b), which appears as two adjacent 5–8–5 di-vacancy structures (with the two coincident pentagons forming a rectangle – i.e. 5–8–4–8–5), and is 1.7 eV higher in energy than the hole (1.5 eV with GGA). The formation of this configuration occurs via a more complex transition that involves the concerted motion of three atoms, nevertheless it has a relatively low barrier.
The zig-zag line morphology can result from two non-equivalent transitions, depicted in Fig. 4c and d. The transition in Fig. 4c consists of the same type of movement as in Fig. 2c (and the trans-3rd nearest neighbour collapse of the di-vacancy7), whereas the transition in Fig. 4d consists of the same type of movement as in Fig. 2d (and the cis-3rd nearest neighbour collapse of the di-vacancy7).
Kinetic Monte Carlo simulations
The transitions to the final states for the formation of both V3 and V4 depicted in Fig. 2 and 4 respectively can give an indication as to which pathways and therefore structures are inaccessible due to prohibitively high barriers. However the full sequence of transitions for the diffusion of a mono-vacancy from a large separation needs to be considered to properly understand the complete coalescence process. Due to the countless different possible trajectories for the mobile vacancy to follow on these potential energy landscapes, the real-time dynamical evolution of the system must be simulated and sampled with the Kinetic Monte Carlo (KMC) method. In this approach, since the activation barriers separating each accessible state are known, we can approximate the transition rate between neighbouring states using the Arrhenius expression, choosing a pre-exponential attempt frequency equal to the Debye frequency of graphene (∼1014 Hz). The KMC method44–46 employs a sequence of random numbers to choose a transition away from a particular state based on a list of the rates of all the possible transitions, and also to determine the residence time in that state. By repeating this as the system moves from state to state, the method can simulate the dynamical evolution of the system at a given temperature – provided that all possible transition mechanisms are known in advance. Assuming the rates are accurate and the system follows the Markov property (un-correlated jumps) the method is exact. The method is computationally inexpensive and therefore enables us to evaluate statistically converged behaviours over many individual trajectories. This is in contrast to a direct dynamical simulation method such as molecular dynamics, which although does not require an exhaustive search for accessible states in advance, is very limited in its sampling of the system.The initial configuration is with the mobile mono-vacancy far from the multi-vacancy complex so that they do not interact. The KMC simulation is then run and the system follows a particular trajectory for the diffusing mono-vacancy until it falls into a kinetically stable state (i.e. one of the final configurations in Fig. 2 and 4). In the following simulations, the initial configurations are created by placing the mono-vacancy at a sequence of positions surrounding the complex, at the 20th nearest neighbour away from either the V2 or V3. The system is periodic in two dimensions (for the mobile vacancies) with the complex at the centre of a 7.3 nm × 4.2 nm cell.
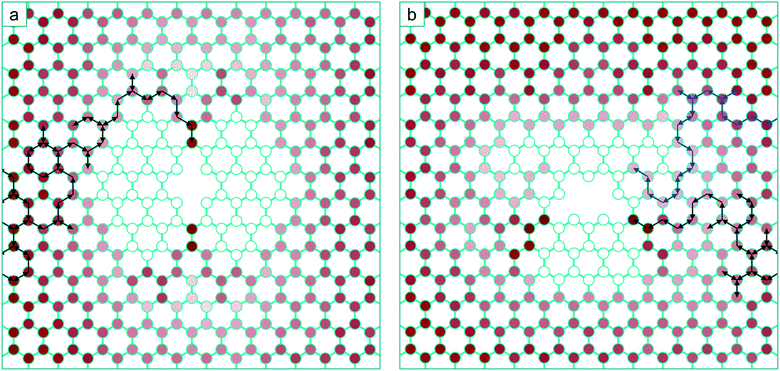
The animation included as ESI S1† shows the mono-vacancy coalescing with the 5–8–5 di-vacancy at a temperature of 600 K. Each frame of this animation represents one KMC step, the duration of which in real time varies according to the calculated residence time in that state. Where the mono-vacancy is initially far enough away from the di-vacancy to be not interacting with it, it undergoes a standard random walk. When the vacancy diffuses to within 9 nearest neighbour positions of the di-vacancy, the diffusion ceases to be random and is biased (i.e. drift). In the case of the trajectory depicted in the animation (and in Fig. 5 a) the vacancy is repelled from the side of the di-vacancy until it diffuses to the region above or below where it is rapidly channelled (or ‘pulled’) into the position 3 (Fig. 2) – and then the structure collapses to the V3 ground state. This animation, and the trajectory depicted in Fig. 6a, are from particular starting positions: to analyse the average behaviour we repeat this simulation 800 times with different initial configurations each followed by a different sequence of random numbers to build up a statistical ensemble.
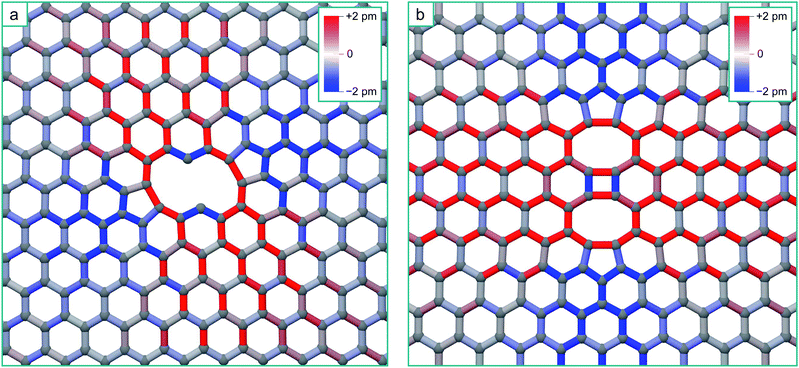 | ||
| Fig. 6 (a) Structure of the zig-zag line V4 complex, with the bonds coloured according to strain. (b) Structure of the arm-chair line V4 complex, with the bonds coloured according to strain. | ||
The schematic in Fig. 5a depicts how this ensemble of trajectories accesses different states on the potential energy surface, representing the probability of a particular state being visited at any point during the diffusion of the mono-vacancy. Here, the intensity of the shade of red at a particular lattice position is proportional to the number of trajectories from the ensemble where the vacancy has visited that position at least once. The white lattice positions indicate that these states are never occupied and are therefore completely inaccessible. It is clear from this schematic that 100% of the trajectories access the ground state V3via position 3 (Fig. 2) – which is a direct result of the biasing of the energy surface from the di-vacancy induced strain. Here it can be seen that the areas under tension across the di-vacancy in Fig. 1a, leading to increased barriers in Fig. 2a, are inaccessible to the diffusing mono-vacancy. At this temperature (600 K), the average time taken for the mono-vacancy to coalesce with the di-vacancy from the 20th nearest neighbour separation is 0.5 s.
In the case of the formation of the V4 from the V3 and mono-vacancy, the process is more intricate, and as implied by the potential energy surface (Fig. 4), there are several different possible outcomes. The animation included in ESI S2,† and the sequence depicted with the black arrows in Fig. 5b, show examples of KMC trajectories at 600 K where the mobile vacancy (positioned initially 20 nearest neighbour positions from the V3 as before) diffuses to position 3 (Fig. 4), and then collapses into the zig-zag line V4 morphology. The schematic in Fig. 5b depicts the kinetic accessibility of the potential energy surface in the same way as before, based on 800 separate KMC trajectories. As before, large regions of the lattice, which are under tensile strain, are completely inaccessible to the mobile vacancy. It is also clear that a substantial majority of the trajectories end up coalescing via the transition in Fig. 4d. A small proportion, however, end up diffusing to position 1 (Fig. 4), and then collapsing into the arm-chair line structure: an example of one of these trajectories is overlaid on Fig. 5b with blue arrows, and also shown in the animation included as ESI S3.†
At 600 K, approximately 10% of trajectories in the ensemble result in the arm-chair morphology and the remaining 90% result in the zig-zag morphology, all via the transition in Fig. 4d. As the temperature is increased, the proportion of trajectories resulting in the armchair morphology increases, reaching approximately 2 out of 10 at 900 K.
The structures of the zig-zag and arm-chair V4 morphologies, and the corresponding bond strain resulting from their reconstruction, are shown in Fig. 6. There are very strong similarities in the form of the zig-zag V4 strain field with the V3 strain field due to the similar reconstruction.
Again for the arm-chair V4, the form of the strain field is the same as for the V2, but in this case with a longer range tensile strain across the defect due to the formation of the four-fold ring in the centre of the defect24 (this will only enhance the inaccessibility of the regions either side of the defect). We should therefore expect that additional mobile vacancies diffusing to these defects will be channelled by the strain-distorted potential energy surfaces in the same way. Following the same accessibility of the potential energy surface for the V2 + V and V3 + V, additional mobile vacancies will coalesce with the ends of the lines, extending them in the seeded direction. This analysis strictly applies to diffusion limited coalescence, however in the case of a higher concentration of vacancies, two or more mono-vacancies may simultaneously come into the field of influence of a multi-vacancy defect. We expect that mono-vacancies will be channelled to the compressive regions in the same way. Due to the fact that the residence times of individual vacancies in these regions will be lowered, this in turn will reduce the chance of them coalescing with each other as opposed to coalescing with the multi-vacancy defect creating the strain field. This will have the effect of promoting the growth of the initial multi-vacancy defect at the expense of the nucleation of additional di-vacancies.
Even though our calculations suggest that the zig-zag line will be the dominant morphology, it is higher in energy than the arm-chair line due to the increased separation of the under-coordinated atoms in its structure. However it may be energetically favourable for the two unsaturated atoms to bond, creating a 5–7–7–5 defect. This would substantially increase the strain in the surrounding lattice and require very large simulation cells to accommodate it, however it has been observed in tight binding calculations.47 As the length of the line increases, it will certainly become energetically favourable to heal, creating a pair of 5–7 dislocations23 (see for example Fig. 7 which shows the structure of a ‘healed’ V10 zig-zag line). It is clear that the increased strain due to the zig-zag line healing will dramatically enhance the channelling of mobile mono-vacancies to the ends of the line, effectively moving the 5–7 dislocation pair apart by climb as vacancies are added to the ends of the line. In principle the lowest energy state for a dipole of 60° edge dislocations is where they are separated with the line connecting them making an angle of 45° with their glide plane. It has already been shown that the 60° dislocation in graphene is immobile when it is in the 5–7 structure arising from an even number of vacancies, but much more mobile (barrier of ∼2 eV) in the 6–8 structure for an odd number of vacancies.48 Since the coalescence process considered here are single vacancy additions, this makes it likely that above 300 C, the constituent dipoles can move apart and migrate to the minimum energy state via thermal activation.
Conclusions
By combining a systematic exploration of potential energy surfaces using accurate DFT calculations with explicit and real-time KMC simulations, we have demonstrated how vacancies coalesce in graphene layers from thermal activation. That multi-vacancy complexes can induce substantial bond strain that extends into the surrounding lattice is well known. We have shown how this strain dramatically alters the potential energy surface for the diffusion of mono-vacancies, and that this results in growing vacancy complexes adopting particular morphologies – line defects. That this effect is so dramatic in this particular system is due to two factors: firstly, the extent of the strain fields, which may be explained by a combination of the force of the reconstructions (due to the energy of C–C bonds) and the 2-dimensional nature of the material. The second is the sensitivity of the activation energy for vacancy hopping to the strain – the reason for this is not entirely clear and warrants further investigation, but may be related to the remarkable in-plane stiffness of graphene, again combined with the lack of moderating interactions above and below the plane (which would be present in a 3-dimensional crystal).The results of this investigation suggest that the thermally activated coalescence of mono-vacancies will not result in ‘holes’ in the graphene structure, only lines which will create 5–7 dislocation pairs and/or stacking faults and will cause in-plane contraction of the material. Of course ‘hole’ type defects, and other types of topological defects (such as grain boundary loops) are regularly observed in atomic resolution images of electron beam damaged graphene, but we suggest here that these cannot arise from thermally activated mono-vacancy coalescence alone. In a high energy electron beam, more complex electronic effects, which we will not describe in detail here, can excite different types of transitions (e.g. bond rotations), and can enhance the ejection of low coordinated carbon atoms (which is a potential mechanism for growing ‘hole’ type defects).32 In spite of this, our results do shed light on what may be an important mechanism of dislocation formation and climb in graphene. The effect that strain has on the migration of defects may also play a critical role in the evolution and growth of grain boundaries and other types of extended defect. It may be the case that similar effects to those demonstrated here can have a substantial effect on the migration of other defects such as carbon adatoms or other adsorbates and also direct the morphology of growing aggregates in a similar way. This will however depend on the sensitivity of migration barriers to the bond strain and requires further investigation.
In the case of the irradiation of graphite with neutrons, the mechanism described here may explain the formation of non-basal dislocations, which will result in a-axis contraction, from the coalescence of mono-vacancies produced in collision cascades. This is of critical importance when it comes to understanding the property changes to graphite that occur as a result of neutron irradiation when the material forms the moderator and other structural components in a nuclear reactor core.49
Acknowledgements
The authors wish to thank the UK EPSRC (grant EP/1003312/1), The Swedish Research Council (Reg. no. 2012-3174) and EDF Energy Nuclear Generation for providing financial support. The views expressed in this work are not necessarily those of the sponsors.Notes and references
- F. Banhart, Rep. Prog. Phys., 1999, 62, 1181–1221 CrossRef CAS.
- A. V. Krasheninnikov and K. Nordlund, J. Appl. Phys., 2010, 107, 071301 CrossRef PubMed.
- O. V. Yazyev and S. G. Louie, Phys. Rev. B: Condens. Matter Mater. Phys., 2010, 81, 195420 CrossRef.
- T. Liu, C. Pao and C. Chang, Carbon, 2012, 50, 3465–3472 CrossRef CAS PubMed.
- A. A. El-Barbary, R. H. Telling, C. P. Ewels, M. I. Heggie and P. R. Briddon, Phys. Rev. B: Condens. Matter Mater. Phys., 2003, 68, 144107 CrossRef.
- A. W. Robertson, B. Montanari, K. He, C. S. Allen, Y. A. Wu, N. Harrison, A. I. Kirkland and J. H. Warner, ACS Nano, 2013, 7, 4495–4502 CrossRef CAS PubMed.
- C. D. Latham, M. I. Heggie, M. Alatalo, S. Öberg and P. R. Briddon, J. Phys.: Condens. Matter, 2013, 25, 135403 CrossRef CAS PubMed.
- A. V. Krasheninnikov, P. O. Lehtinen, A. S. Foster and R. M. Nieminen, Chem. Phys. Lett., 2006, 418, 132–136 CrossRef CAS PubMed.
- H. Zhang, M. Zhao, X. Yang, H. Xia, X. Liu and Y. Xia, Diamond Relat. Mater., 2010, 19, 1240–1244 CrossRef CAS PubMed.
- L. Wu, T. Hou, Y. Li, K. S. Chan and S. T. Lee, J. Phys. Chem. C, 2013, 117, 17066–17072 CAS.
- G. D. Lee, C. Z. Wang, E. Yoon, N. M. Hwang, D. Y. Kim and K. M. Ho, Phys. Rev. Lett., 2005, 95, 205501 CrossRef.
- F. Banhart, J. Kotakoski and A. V. Krasheninnikov, ACS Nano, 2011, 5, 26–41 CrossRef CAS PubMed.
- A. Santana, A. M. Popov and E. Bichoutskaia, Chem. Phys. Lett., 2013, 557, 80–87 CrossRef CAS PubMed.
- J. I. Paredes, P. Solís-Fernández, A. Martínez-Alonso and J. M. Tascón, J. Phys. Chem. C, 2009, 113, 10249–10255 CAS.
- A. Tapia, R. Peón-Escalante, C. Villanueva and F. Avilés, Comput. Mater. Sci., 2012, 55, 255–262 CrossRef CAS PubMed.
- J. Kotakoski, A. V. Krasheninnikov, U. Kaiser and J. C. Meyer, Phys. Rev. Lett., 2011, 106, 105505 CrossRef CAS.
- J. H. Warner, E. R. Margine, M. Mukai, A. W. Robertson, F. Giustino and A. I. Kirkland, Science, 2012, 337, 209 CrossRef CAS PubMed.
- O. Lehtinen, S. Kurasch, A. V. Krasheninnikov and U. Kaiser, Nat. Commun., 2013, 4, 3098 Search PubMed.
- A. W. Robertson and J. H. Warner, Nanoscale, 2013, 5, 4079–4093 RSC.
- Z. Wang, Y. G. Zhou, J. Bang, M. P. Prange, S. B. Zhang and F. Gao, J. Phys. Chem. C, 2012, 116, 16070–16079 CAS.
- E. Cockayne, G. M. Rutter, N. P. Guisinger, J. N. Crain, P. N. First and J. A. Stroscio, Phys. Rev. B: Condens. Matter Mater. Phys., 2011, 83, 195425 CrossRef.
- J. H. Warner, Y. Fan, A. W. Robertson, K. He, E. Yoon and G. D. Lee, Nano Lett., 2013, 13, 4937–4944 CrossRef CAS PubMed.
- B. Wook Jeong, J. Ihm and G. D. Lee, Phys. Rev. B: Condens. Matter Mater. Phys., 2008, 78, 165403 CrossRef.
- J. H. Warner, G. D. Lee, K. He, A. W. Robertson, E. Yoon and A. I. Kirkland, ACS Nano, 2013, 7, 9860–9866 CrossRef CAS PubMed , ASAP.
- B. K. Annis, D. F. Pedraza and S. P. Withrow, J. Mater. Res., 1993, 8, 2587 CrossRef CAS.
- L. Wang, F. Yan, H. L. W. Chan and F. Ding, Nanoscale, 2012, 4, 7489 RSC.
- M. Oubal, S. Picaud, M. Rayez and J. Rayez, Comput. Theor. Chem., 2012, 990, 159–166 CrossRef CAS PubMed.
- M. Saito, K. Y. Amashita and T. Oda, Jpn. J. Appl. Phys., 2007, 46, L1185–L1187 CrossRef CAS.
- A. A. El-Barbary, First principles characterisation of defects in irradiated graphitic materials, PhD Thesis, University of Sussex, 2005.
- B. Wang, Y. Puzyrev and S. T. Pantelides, Carbon, 2011, 49, 3983–3988 CrossRef CAS PubMed.
- R. Dettori, E. Cadelano and L. Colombo, J. Phys.: Condens. Matter, 2012, 24, 104020 CrossRef PubMed.
- J. Kotakoski, D. Santos-Cottin and A. V. Krasheninnikov, ACS Nano, 2012, 6, 671–676 CrossRef CAS PubMed.
- J. Lu, Y. Bao, C. Liang Su and K. Ping Loh, ACS Nano, 2013, 7, 8350–8357 CrossRef CAS PubMed.
- A. S. Fedorov, Z. I. Popov, D. A. Fedorov, N. S. Eliseeva, M. V. Serjantova and A. A. Kuzubov, Phys. Status Solidi B, 2012, 249, 2549–2552 CrossRef CAS.
- A. S. Fedorov, D. A. Fedorov, Z. I. Popov, Y. E. Ananeva, N. S. Eliseeva and A. A. Kuzubov, J. Exp. Theor. Phys., 2011, 112, 820–824 CrossRef CAS.
- J. P. Perdew and Y. Wang, Phys. Rev. B: Condens. Matter Mater. Phys., 1992, 45, 13244 CrossRef.
- J. P. Perdew, K. Burke and M. Ernzerhof, Phys. Rev. Lett., 1996, 77, 3865 CrossRef CAS.
- P. R. Briddon and R. Jones, Phys. Status Solidi B, 2000, 217, 131–71 CrossRef CAS.
- J. P. Goss, M. J. Shaw, and P. R. Briddon, Theory of Defects in Semiconductors (Topics in Applied Physics vol. 104), ed D. A. Drabold and S. K. Estreicher, Springer, Berlin, 2007 Search PubMed.
- C. Hartwigsen, S. Goedecker and S. Hutter, J. Phys. Rev. B: Condens. Matter Mater. Phys., 1998, 58, 3641 CrossRef CAS.
- G. Henkelman, B. P. Uberuaga and H. Jonsson, J. Chem. Phys., 2000, 113, 9901–9904 CrossRef CAS PubMed.
- G. Henkelman and H. Jonsson, J. Chem. Phys., 2000, 113, 9978–9985 CrossRef CAS PubMed.
- H. Wang, Q. Wang, Y. Cheng, K. Li, Y. Yao, Q. Zhang, C. Dong, P. Wang, U. Schwingenschlögl, W. Yang and X. Zhang, Nano Lett., 2012, 12, 141–144 CrossRef CAS PubMed.
- M. W. Young and E. W. Elcock, Proc. Phys. Soc., 1966, 89, 735 CrossRef.
- A. B. Bortz, M. H. Kalos and J. L. Lebowitz, J. Comput. Phys., 1975, 17, 10–18 CrossRef.
- K. A. Fichthorn and W. H. Weinberg, J. Chem. Phys., 1991, 95, 1090 CrossRef CAS PubMed.
- G. D. Lee, E. Yoon, N. M. Hwang, C. Z. Wang and K. M. Ho, Appl. Phys. Lett., 2013, 102, 021603 CrossRef PubMed.
- C. P. Ewels, M. I. Heggie and P. R. Briddon, Chem. Phys. Lett., 2002, 351, 178–182 CrossRef CAS.
- B. T. Kelly, Dimensional Changes in Graphite and the Thermal Expansion Coefficient (TECDOC vol 1154), IAEA, Vienna, 2000, ch. 3, pp 49–84 Search PubMed.
Footnote |
| † Electronic supplementary information (ESI) available: Animations of simulations the coalescence process for the formation of V3 and the two morphologies of V4. See DOI: 10.1039/c3nr06222h |
| This journal is © The Royal Society of Chemistry 2014 |

