 Open Access Article
Enhanced MRI relaxivity of aquated Gd3+ ions by carboxyphenylated water-dispersed graphene nanoribbons†
Ayrat
Gizzatov
a,
Vazrik
Keshishian
a,
Adem
Guven
a,
Ayrat M.
Dimiev
a,
Feifei
Qu
b,
Raja
Muthupillai
b,
Paolo
Decuzzi
c,
Robert G.
Bryant
d,
James M.
Tour
*a and
Lon J.
Wilson
*a
aDepartment of Chemistry, Richard E. Smalley Institute for Nanoscale Science and Technology, Rice University, 6100 Main Street, Hoston, TX-77005, USA. E-mail: tour@rice.edu; durango@rice.edu
bDepartment of Radiology, St. Luke's Episcopal Hospital, 6720 Bertner Avenue, MC 2-270, Houston, TX-77030-2697, USA
cDepartment of Translational Imaging, The Methodist Hospital Research Institute, 6560 Fannin St., Houston, TX-77030, USA
dDepartment of Chemistry, University of Virginia, Charlottesville, VA-22904-4319, USA
First published on 24th January 2014
Abstract
The present study demonstrates that highly water-dispersed graphene nanoribbons dispersed by carboxyphenylated substituents and conjugated to aquated Gd3+ ions can serve as a high-performance contrast agent (CA) for applications in T1- and T2-weighted magnetic resonance imaging (MRI) with relaxivity (r1,2) values outperforming currently-available clinical CAs by up to 16 times for r1 and 21 times for r2.
Since the discovery of graphene by Geim and Novoselov in 2004, extensive research has been performed in diverse fields of science, engineering, and medicine to take advantage of its unique properties.1–4 Properties such as excellent electrical conductivity, thermal stability, mechanical strength, and other unusual chemical and optical properties have made graphene an extensively studied material for composites, transistors, biosensors, nanomedicines, and many other types of materials requiring the exceptional properties of graphene and graphene-based materials.
Magnetic resonance imaging (MRI) is one of the most powerful imaging tools in the clinic for non-invasive diagnostics.5 Many of its capabilities depend on the use of chemical contrast agents (CAs), which are employed to enhance local signal intensity to improve diagnostic confidence.6
Image contrast in MRI arises largely from differences in water-proton spin-lattice relaxation time (T1) and spin–spin relaxation times (T2). Thus, chemical CAs are categorized as either T1 or T2 agents based on the efficiency of changing T1 or T2 in the observable water pool. T1 CAs are mainly Gd3+-based and provide brighter images, whereas T2 CAs produce darker images and are usually superparamagnetic iron oxide (SPIO) nanoparticles.7 Relaxivity (r1,2) is the parameter of CAs which defines their efficacy and is the relaxation rate enhancement in 1 mM−1 s−1 of the CA.8
There has been extensive effort to develop new CAs with increased relaxivities using small Gd3+-ion chelates, dendrimers, polymers, micelles, and various nanostructures.9–16 In recent years, a great diversity of nanostructure-based CAs have been developed which exhibit high relaxivity. In particular, honeycomb carbon nanostructures such as gadofullerenes,17–19 gadonanotubes,14 and gadographene20 have shown the highest relaxivity values for the Gd3+ ion. In this work we report a new type of carbon nanoconstructured-based CA, with Gd3+ ions conjugated to covalently functionalized highly water-dispersed graphene nanoribbons (Gd/GNRs) to produce greatly enhanced r1 and r2 values (70 ± 6 mM−1 s−1 and 108 ± 9 mM−1 s−1, respectively) at 1.41 T and 37 °C. These values are up to 16 times and 21 times higher for r1 and r2 respectively, when compared to clinically available Magnevist® CA with r1 ≈ 4 mM−1 s−1 and r2 ≈ 5 mM−1 s−1 at 1.5 T.11 Unlike the recently reported and related gadographene CA,20 the present Gd/GNR CAs do not require a surfactant to suspend them in water and biological media.
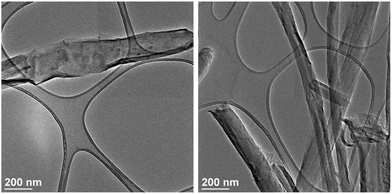
To prepare the Gd/GNRs, synthesis of the GNRs with a width of 125–280 nm, thickness of 7–15 nm, and length of up to 20 μm was achieved by chemically splitting multi-walled carbon nanotubes (MWCNTs) using K/Na alloy,21 unlike the preparation of GNRs that uses KMnO4.22,23 The GNRs were then repetitively derivatized with p-carboxyphenyldiazonium salt to make them highly water dispersed (4.7 mg mL−1) and to provide carboxylic acid groups for Gd3+ coordination.24 Next, an aqueous solution of GdCl3 (30 mg in 3 mL) was added to an aqueous dispersion (10 mL) of GNRs (10 mg) and the mixture was sonicated in a bath for 15 min. The mixture was then vacuum filtered using an Anapore™ inorganic membrane disc with a pore size of 0.02 μm (Anodisc™) and thoroughly washed with DI water multiple times until no Gd3+ ions were present in the filtrate (confirmed by ICP-OES). The black solid collected on the filter (Gd/GNRs) was then characterized using transmission electron microscopy (TEM) (Fig. 1) equipped with electron dispersion spectroscopy (EDS), X-ray photoelectron spectroscopy (XPS), inductively-coupled plasma optical emission spectrometry (ICP-OES), a benchtop relaxometer (Brȕker Minispec) operating at 1.41 T and 37 °C with a 5 mm probe, a clinical 1.5 T MRI scanner (Philips Achieva), and a fast field cycling nuclear magnetic resonance (NMR) spectrometer FFC-200 (Stellar s. r. l., Mede, Italy).
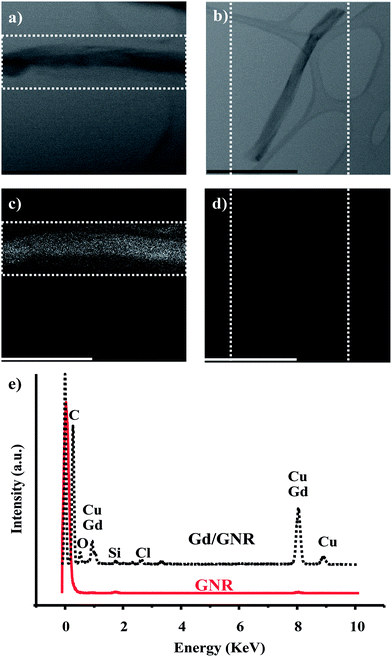
To better understand the nature and presence of the Gd3+ ions on the surface of the GNRs, TEM equipped with an EDS was used. The top row of Fig. 2 shows TEM images of the Gd/GNRs (Fig. 2a) and GNRs (Fig. 2b) with corresponding EDS mappings (mapping areas designated by dotted white lines) on the bottom row for Gd3+ and Cu2+ of the Gd/GNR sample (Fig. 2c) and the GNR sample (Fig. 2d). Cu2+ and Gd3+-ion mapping are shown together due to the overlap of the spectral peaks of these two elements; the trace of the Cu2+-ion signal is due to the copper grid TEM sample holder. From the EDS images it is clear that the Gd/GNR sample surface is covered with Gd3+ ions (white spots) (Fig. 2c), whereas the GNR sample is not (Fig. 2d). Coverage of the GNR surface with Gd3+ ions was produced by coordination of the ions to the carboxylate groups of the GNRs. The EDS spectrum (Fig. 2e) of the Gd/GNRs also shows the presence of Gd3+ ions (≈1 keV and ≈ 8 keV) with traces of Cl− ion (≈3 keV) coming from the GdCl3 used to prepare the Gd/GNRs.
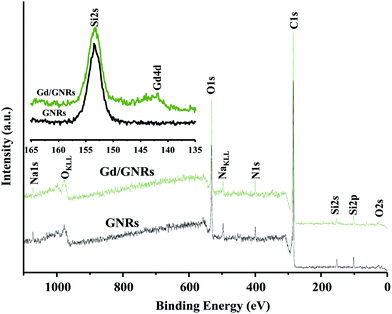
XPS data (Fig. 3) also provides evidence for the presence of Gd3+ on the surface of Gd/GNR sample. The photoelectron peak corresponding to the Gd3+ ion 4d level was observed at ∼141 eV for a Gd/GNR sample, whereas for a GNR sample no peak was observed in the region. Peaks for Si at 153 eV (Si2s) and 102 eV (Si2p) are due to contamination from the Pyrex ampule during synthesis of the GNRs from MWCNTs. Na+ ion (∼1071 and 496 eV) was introduced to the sample during the functionalization step.24
The amount of Gd3+ in a solid Gd/GNR sample was determined to be 1.5 ± 0.4% w/w by ICP-OES. For the determination, a known amount of Gd/GNRs (0.2–0.5 mg) was carefully heated in 36% w/w HClO3 (1–2 mL) to completely remove any remaining carbonaceous material and then reconstituted in 5 mL 2% HNO3 for ICP-OES analysis.
Relaxation times T1 and T2 were measured using a Brűker Minispec operating at 1.41 T and 37 °C. Gadolinium concentrations were determined using ICP-OES and a linear relation between relaxation rate and concentration was found (Fig. S1†) with slopes of 70 ± 6 mM−1 s−1 for r1 and 108 ± 9 mM−1 s−1 for r2 (n = 4). T1 was also measured as a function of magnetic field strength using a Stelar Spin Master field cycling spectrometer (Mede, Italy). Samples were contained in 10 mm tubes at 25 °C.
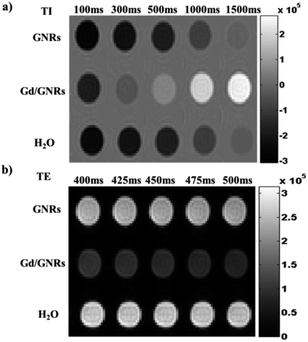
The effectiveness of the Gd/GNRs as a T1 and T2 CA was assessed via a 1.5 T MRI clinical scanner. From the T1-weighted phantom images (Fig. 4a) obtained at different inversion times (TI) for the same amount (0.225 mg mL−1) of aqueous dispersion of GNRs, Gd/GNRs (∼1.7% Gd w/w) and H2O samples it is clear that there is great contrast enhancement for the Gd/GNR sample, when compared to GNRs and H2O. Similarly, from the T2-weighted phantom images (Fig. 4b) acquired at different echo times (TE) for the same samples, there is clearly observable contrast enhancement for the Gd/GNR sample when compared to GNRs and H2O. No contrast enhancement for the GNRs alone when compared to H2O is presented in order to show that there is no relaxivity contribution due to possible trace metal impurities. The images presented in Fig. 4 show the efficacy of the Gd/GNRs as a CA for T1- and T2-weighted imaging.
To better understand the binding nature of Gd3+ to the GNRs, strong acid (1 M HCl), strong base (1 M NaOH), and DI water washings were performed on the Gd/GNR sample. To determine the results for a known amount of Gd/GNRs, samples were dispersed in 1 M HCl, 1 M NaOH, and deionized water and the dispersions were then sonicated for 10 min before filtration through 0.22 μm glass syringe filters. Filtrates were analyzed via ICP-OES for the presence of Gd3+. It was found that 1 M HCl removes the Gd3+ ions from the surface of the GNRs. Repeating this procedure with 1 M NaOH or DI water did not remove any detectable Gd3+. These results support the assumption that the Gd3+ ions are coordinated to carboxylate groups present on the surface of the functionalized GNRs, since only protonation of these groups by acid removes the Gd3+ ions.
To check for the physiological stability of the Gd3+ ions in the Gd/GNRs, 1× phosphate buffered saline (PBS) and fetal bovine serum (FBS) in vitro challenges were performed. In two separate experiments, a Gd/GNR sample was challenged for 24 h at 37 °C in 1× PBS and FBS. The resulting dispersions were filtered through a 0.22 μm glass syringe filter and the filtrates were analysed for Gd3+ content with ICP-OES. 1× PBS challenge did not produce any Gd3+ ion loss, while the FBS challenge resulted in a loss of ca. 50 ± 10% (n = 3) of the Gd3+ ions from multiple samples functionalized at different times. After the first FBS challenge, the same sample did not lose additional Gd3+ ions with subsequent challenges. In the case of PBS, no Gd3+ loss was observed, since no strongly chelating agents or ions capable of replacing Gd3+ are present in PBS. For FBS, the proteins present are good chelating agents and are apparently capable of removing loosely bound Gd3+ ions from the surface of the Gd/GNRs. Neither of the challenges resulted in measurable changes in r1 or r2 for the coordinated to GNRs Gd3+ ion. Thus, due to the material nature of the Gd/GNRs, there appear to be different kinds of coordination sites present, and after the first FBS challenge the same sample becomes stable to subsequent FBS challenges at physiological pH and temperature.
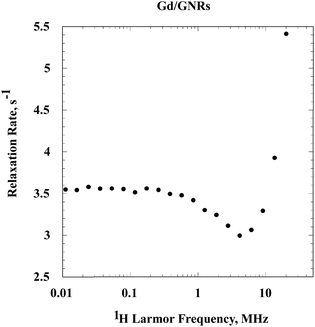
The relaxation rate constants for the Gd/GNRs ([Gd] = 0.0345 mM) sample (Fig. 5) are large and demonstrate that the Gd3+ ion first coordination sphere waters exchange rapidly with bulk water. The low field relaxation rate is essentially constant, but with increasing field there is a decrease followed by an increase and a maximum, which is not observed in the present experiments. This relaxation dispersion profile is characteristic of a slowly rotating Gd3+-ion complex.25,26 The increase in relaxation rates at high field derives from the magnetic field dependence of the electron-spin relaxation rate constant which makes the effective correlation time for the electron-nuclear coupling a function of magnetic field. Thus, the nuclear spin-relaxation properties are decoupled from the rotational and exchange dynamics of the Gd3+ complex throughout the magnetic field range studied here. The dominance of electron spin relaxation is the rule in slowly rotating Gd3+ complexes.
Contributions from non-metal radicals, which are common adjuncts of polynuclear aromatic preparations would generally induce nuclear spin relaxation by outer sphere or translational diffusive motions of the water in the vicinity of the radical. The shape of the relaxation dispersion profile from this class of dynamics is characteristically a constant relaxation rate at low field and a decrease in relaxation rate constant at high field without the dramatic increase observed in Fig. 5. It is also possible that magnetic domains may form in particulate systems that, in some instances, may present a relaxation dispersion profile similar to that shown in Fig. 5.27 However, we have no evidence that such organization occurs in the present preparations.
The above results demonstrate that Gd3+ ions in Gd/GNRs are coordinated to the carboxylate groups of the GNRs. The number of the Gd3+-ion coordination sites occupied by the carboxylate groups is unclear, even though the total coordination number for individual Gd3+ ions is normally 8 or 9.28,29 It is known that the r1 relaxivity of a Gd3+-ion CA depends on many parameters, but the most dominant factors are the tumbling time, the water-exchange rate, and the number of available sites for water coordination.30,31 In our case, the large r1 and r2 relaxivity values are most likely due to a larger number of water coordination sites on the Gd3+ ion.
In conclusion, we have shown that surfactant-free carboxyphenylated water-dispersed graphene nanoribbons are capable of increasing r1 to 70 ± 6 mM−1 s−1 and r2 to 108 ± 9 mM−1 s−1 for Gd3+ ions coordinated to the carboxylate groups. These values are 16 and 21 times greater when compared to current clinically-available Gd3+-based T1 CAs, and about the same as found for gadographene suspended with surfactant. Because the Gd/GNRs are lipophilic and stable to Gd3+-ion loss under physiological conditions (after one FBS challenge), they possibly can be safely used to internally label cells for MRI tracking in vivo, similar to other Gd3+-ion containing carbon nanostructures such as the gadofullerenes32 or the gadonanotubes.33,34 Of the four gadocarbon nanostructure labeling agents (gadofullerenes, gadonanotubes, gadographene, and Gd/GNRs), the much greater availability of the last three suggests that they might become the preferred cell labeling agents. Of these three, the covalently-functionalized Gd/GNRs could have advantages over the surfactant-wrapped nanostructures, especially if the surfactant wrapping is unstable to cell membrane transport during the cell labeling process. We are presently exploring this possibility.35
A. Gizzatov, V. K., A. Guven, and L. J. W. acknowledge The Welch Foundation (C-0627) for partial support of this work, while A. M. D. and J. M. T. acknowledge the ONR (#00006766, N00014-09-1-1066), the AFOSR MURI (FA9550-12-1-0035), and the AFOSR (FA9550-09-1-0581).
Notes and references
- K. S. Novoselov, A. K. Geim, S. V. Morozov, D. Jiang, Y. Zhang, S. V. Dubonos, I. V. Grigorieva and A. A. Firsov, Science, 2004, 306, 666 CrossRef CAS PubMed.
- X. Huang, Z. Yin, S. Wu, X. Qi, Q. He, Q. Zhang, Q. Yan, F. Boey and H. Zhang, Small, 2011, 7, 1876 CrossRef CAS PubMed.
- L. Feng and Z. Liu, Nanomedicine, 2011, 6, 317 CrossRef CAS PubMed.
- F. Schwierz, Nat. Nanotechnol., 2010, 5, 487 CrossRef CAS PubMed.
- P. Caravan, J. J. Ellison, T. J. McMurry and R. B. Lauffer, Chem. Rev., 1999, 99, 2293 CrossRef CAS PubMed.
- A. E. Merbach and E. Toth, The Chemistry of Contrast Agents in Medical Magnetic Resonance Imaging, John Wiley and Sons, Ltd, Chichester 2001 Search PubMed.
- R. Weissleder and M. Papisov, Rev. Magn. Reson. Med., 1992, 4, 1 Search PubMed.
- S. Aime, M. Fasano and E. Terreno, Chem. Soc. Rev., 1998, 27, 19 RSC.
- J. Tang, Y. Sheng, H. Hu and Y. Shen, Prog. Polym. Sci., 2013, 38, 462 CrossRef CAS PubMed.
- J. Kim, Y. Piao and T. Hyeon, Chem. Soc. Rev., 2009, 38, 372 RSC.
- S. Langereis, Q. G. de Lussanet, M. H. P. van Genderen, W. H. Backes and E. W. Meijer, Macromolecules, 2004, 37, 3084 CrossRef CAS.
- K. N. Raymond and V. C. Pierre, Bioconjugate Chem., 2005, 16, 3 CrossRef CAS PubMed.
- L. M. Manus, D. J. Mastarone, E. A. Waters, X. Q. Zhang, E. A. Schultz-Sikma, K. W. MacRenaris, D. Ho and T. J. Meade, Nano Lett., 2010, 10, 484 CrossRef CAS PubMed.
- B. Sitharaman, K. R. Kissell, K. B. Hartman, L. A. Tran, B. Baikalov, I. Rusakova, Y. Sun, H. A. Khant, S. J. Ludtke, W. Chiu, S. Laus, É. Tóth, L. Helm, A. E. Merbach and L. J. Wilson, Chem. Commun., 2005, 3915 RSC.
- M. Mikawa, H. Kato, M. Okumura, M. Narazaki, Y. Kanazawa, N. Miwa and H. Shinohara, Bioconjugate Chem., 2001, 12, 510 CrossRef CAS PubMed.
- C. Richard, B. T. Doan, J. C. Beloile, M. Bessodes, E. Toth and D. Sherman, Nano Lett., 2008, 8, 232 CrossRef CAS PubMed.
- H. Kato, Y. Kanazawa, M. Okumura, A. Taninaka, T. Yokawa and H. Shinohara, J. Am. Chem. Soc., 2003, 125, 4391 CrossRef CAS PubMed.
- C. Y. Shu, F. D. Corwin, J. F. Zhang, Z. J. Chen, J. E. Reid, M. H. Sun, W. Xu, J. H. Sim, C. R. Wang, P. P. Fatouros, A. R. Esker, H. W. Gibson and H. C. Dorn, Bioconjugate Chem., 2009, 20, 1186 CrossRef CAS PubMed.
- S. Laus, B. Sitharaman, E. Toth, R. D. Bolskar, L. Helm, L. J. Wilson and A. E. Merbach, J. Phys. Chem. C, 2007, 111, 5633 CAS.
- A. H. Hung, M. C. Duch, G. Parigi, M. W. Rotz, L. M. Manus, D. J. Mastarone, K. T. Dam, C. C. Gits, K. W. MacRenaris, C. Luchinat, M. C. Hersam and T. J. Meade, J. Phys. Chem. C, 2013, 117, 16263 CAS.
- B. Genorio, W. Lu, A. M. Dimiev, Y. Zhu, A. Raji, B. Novosel, L. Alemany and J. M. Tour, ACS Nano, 2012, 6, 4231 CrossRef CAS PubMed.
- D. V. Kosynkin, A. L. Higginbotham, A. Sinitskii, J. R. Lomeda, A. Dimiev, B. K. Price and J. M. Tour, Nature, 2009, 458, 872 CrossRef CAS PubMed.
- B. S. Paratala, B. D. Jacobson, S. Kanakia, L. D. Francis and B. Sitharaman, PLoS One, 2012, 7, e38185 CAS.
- A. Gizzatov, A. Dimiev, Y. Mackeyev, J. M. Tour and L. J. Wilson, Chem. Commun., 2012, 48, 5602 RSC.
- I. Solomon, Phys. Rev., 1961, 99, 842 Search PubMed.
- N. Bloembergen and L. O. Morgan, J. Chem. Phys., 1961, 34, 842 CrossRef CAS PubMed.
- A. Roch and R. N. Muller, J. Chem. Phys., 1999, 110, 5403 CrossRef CAS PubMed.
- T. Kurisaki, T. Yamaguchi and T. Wakita, J. Alloys Compd., 1993, 192, 293 CrossRef CAS.
- H. Kanno and H. Yokoyama, Polyhedron, 1996, 15, 1437 CrossRef CAS.
- V. C. Pierre, M. Botta and K. N. A. Raymond, J. Am. Chem. Soc., 2005, 127, 504 CrossRef CAS PubMed.
- W. B. Tan and Y. Zhang, Adv. Mater., 2005, 17, 2375 CrossRef CAS.
- B. Sitharaman, L. A. Tran, Q. P. Pham, R. D. Bolskar, R. Muthupillai, S. D. Flamm, A. G. Mikos and L. J. Wilson, Contrast Media Mol. Imaging, 2007, 2, 139 CrossRef CAS PubMed.
- L. A. Tran, R. Krishnamurthy, R. Muthupillai, M. G. Cabreira-Hansen, J. T. Willerson, E. C. Perin and L. J. Wilson, Biomaterials, 2010, 31, 9482 CrossRef CAS PubMed.
- R. Sethi, Y. Mackeyev and L. J. Wilson, Inorg. Chim. Acta, 2012, 393, 165 CrossRef CAS PubMed.
- S. J. Corr, A. Gizzatov, B. T. Cisneros, L. J. Wilson and S. Curley, presented at 223rd ECS Meeting, Cytotoxicity and Biocompatibility of Highly Water-Soluble Graphene Nanoribbons Derivitized with p-Carboxyphenyldiazonium Salt, Toronto, Canada, May 12–17, 2013 Search PubMed.
Footnote |
| † Electronic supplementary information (ESI) available. See DOI: 10.1039/c3nr06026h |
| This journal is © The Royal Society of Chemistry 2014 |

