 Open Access Article
Synthesis of Cu, Zn and Cu/Zn brass alloy nanoparticles from metal amidinate precursors in ionic liquids or propylene carbonate with relevance to methanol synthesis†
Kai
Schütte
a,
Hajo
Meyer
a,
Christian
Gemel
b,
Juri
Barthel
c,
Roland A.
Fischer
b and
Christoph
Janiak
*a
aInstitut für Anorganische Chemie und Strukturchemie, Heinrich-Heine-Universität Düsseldorf, 40204 Düsseldorf, Germany. E-mail: janiak@uni-duesseldorf.de; Fax: +49-211-81-12287; Tel: +49-211-81-12286
bLehrstuhl Anorganische Chemie, II – Organometallics & Metallics, Ruhr-Universität Bochum, NC 2, Universitätsstr. 150, 44801 Bochum, Germany. E-mail: roland.fischer@rub.de; Fax: +49-234-321-4174; Tel: +49-234-32-24174
cGemeinschaftslabor für Elektronenmikroskopie RWTH-Aachen, Ernst Ruska-Centrum für Mikroskopie und Spektroskopie mit Elektronen, D-52425 Jülich, Germany
First published on 8th January 2014
Abstract
Microwave-induced decomposition of the transition metal amidinates {[Me(C(NiPr)2)]Cu}2 (1) and [Me(C(NiPr)2)]2Zn (2) in the ionic liquid 1-butyl-3-methylimidazolium tetrafluoroborate ([BMIm][BF4]) or in propylene carbonate (PC) gives copper and zinc nanoparticles which are stable in the absence of capping ligands (surfactants) for more than six weeks. Co-decomposition of 1 and 2 yields the intermetallic nano-brass phases β-CuZn and γ-Cu3Zn depending on the chosen molar ratios of the precursors. Nanoparticles were characterized by high-angle annular dark field-scanning transmission electron microscopy (HAADF-STEM), dynamic light scattering and powder X-ray diffractometry. Microstructure characterizations were complemented by STEM with spatially resolved energy-dispersive X-ray spectrometry and X-ray photoelectron spectroscopy. Synthesis in ILs yields significantly smaller nanoparticles than in PC. β-CuZn alloy nanoparticles are precursors to catalysts for methanol synthesis from the synthesis gas H2/CO/CO2 with a productivity of 10.7 mol(MeOH) (kg(Cu) h)−1.
Introduction
Cu/ZnO nanocomposite systems have been studied in great detail over many years in order to elucidate the elementary processes of relevance for heterogenous catalytic methanol formation from CO/CO2/H2 mixtures.1 Nevertheless, the role of Cu, ZnO and the Cu/ZnO interface is still a matter of ongoing research and important factors include the decoration of Cu nanoparticles with Zn and ZnO species.2 Bottom-up synthesis and microstructural characterization of free-standing Cu/ZnO composite nanoparticles dispersed in non-aqueous media and their investigation as quasi-homogeneous model catalysts have contributed to this discussion. For example, co-pyrolysis of [Cu(OCH(Me)CH2NMe2)2] and Et2Zn in the hot coordinating solvent hexadecylamine3 or thermal pretreatment of fatty acid salts of Cu and Zn in squalane under CO/H2 leads to such kind of catalytically active Cu/ZnO nanocomposite particles.4 One alternative access to such species is based on the colloidal chemistry of nano-brass (Cu/Zn) and the subsequent partial oxidation of the Zn component to yield the desired Cu/ZnO interface.5,6 Soft chemical synthesis of Cu/Zn nanoalloys from the organometallic precursors [CpCu(PMe3)] and [ZnCp2*] by thermal co-hydrogenolysis in conventional hydrocarbon solvents has been reported.7 Unfortunately, the obtained nano-brass colloids turned out to be catalytically inactive.Still, soft chemical synthesis in organic solvents from organometallic complexes is an important access to chemical nanometallurgy and allows preparation of metals and alloys in the nanometer scale regime.8,9 Herein we wish to report related, new results employing a different metal–organic precursor concept and using the advantages of the synthesis of nanomaterials in ionic liquids or propylene carbonate (PC) to selectively yield the intermetallic nano-brass phases β-CuZn and γ-Cu3Zn as stable colloids. We selected the copper(I)-amidinate {[Me(C(NiPr)2)]Cu}2 (1) and the related zinc(II)-amidinate [Me(C(NiPr)2)]2Zn (2) (Scheme 1) as precursors for the Cu and Zn components. Metal amidinates were investigated and widely used as precursors for thin metal films in low pressure chemical vapor deposition (CVD) or atomic layer deposition (ALD).10,11 In contrast, the previous precursor concepts (vide supra) were based on quite different chemistries of the employed Cu and Zn compounds. This caused more complex mechanistic situations and different kinetics of precursor decomposition, which reduces process control and the selectivity of Cu/Zn nanophase formation.
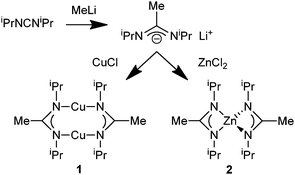 | ||
| Scheme 1 Synthesis and structural formula of metal amidinates {[Me(C(NiPr)2)]Cu}2 (1) and [Me(C(NiPr)2)]2Zn (2). | ||
Non-conventional solvents in nanomaterial synthesis
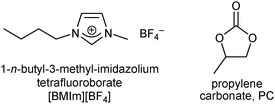
For nanoparticle synthesis we selected and compared the two reaction media, propylene carbonate (PC) and the ionic liquid [BMIm][BF4] because of the following reasons. Propylene carbonate (Scheme 2) is an aprotic, highly dipolar solvent, which has a low viscosity12,13 and is considered a green solvent because of its low flammability, volatility and toxicity.14 There are few reports on the synthesis of metal nanoparticles (M-NP) in organic carbonates.15,16 Ionic liquids (ILs) have become interesting alternatives to traditional aqueous or organic solvents.17,18 Over the last few years they have been introduced into solution chemistry and intensively investigated as a new liquid medium.19,20 The preparation of advanced functional materials, including metal nanoparticles, in ILs, through ionothermal synthesis, appears to be highly promising.21–28 The use of ILs with the concomitant ionothermal method is increasing because of the excellent solvent properties of ILs, such as negligible vapor pressure, high thermal stability, high ionic conductivity, a broad liquid-state temperature range, and the ability to dissolve a variety of materials.29,30 Ionic liquids, such as 1-butyl-3-methyl-imidazolium tetrafluoroborate [BMIm][BF4] (Scheme 2), have been used for the preparation and inherent stabilization of metal nanoparticles which were prepared from metal salts with31–33 or without reducing H2 gas,34 organometallic metal complexes35 and metal carbonyls36 through thermal or photochemical37 decomposition or electroreduction/electrodeposition.21,38,39 The electrostatic and steric properties of ionic liquids allow for the stabilization of M-NPs without the need for additional stabilizers, surfactants or capping ligands.21,39,40 Still, ionic liquids are expensive, while organic carbonates, such as PC (Scheme 2), are polar solvents which are available in large amounts and at low prices. They also have a large liquid temperature range (for PC: mp −49 °C, bp 243 °C), have only low (eco)toxicity, and are completely biodegradable.41Results and discussion
Cu-NP and Zn-NP synthesis and characterization
The amidinates {[Me(C(NiPr)2)]Cu}2 (1) or [Me(C(NiPr)2)]2Zn (2) were dissolved/suspended under a nitrogen atmosphere in dried and deoxygenated 1-butyl-3-methylimidazolium tetrafluoroborate ([BMIm][BF4]) or propylene carbonate (PC). Complete decomposition by microwave irradiation of the amidinates in these solvents was achieved after only 10 minutes using a low power of 50 W to give an approximate temperature of 220 °C in the reaction mixture (Scheme 3). | ||
| Scheme 3 Microwave-assisted thermal decomposition of metal amidinates 1 and 2 to monometallic M-NPs in IL or PC. | ||
The resulting dispersions of Cu-NPs (red) and Zn-NPs (light-yellow) were reproducibly obtained through the microwave decomposition route. Complete decomposition of the amidinates from short, 10 min microwave irradiation was verified by 1H NMR spectroscopy by the disappearance of the well separated signal for the N–C(CH3)–N methyl group. NMR decomposition measurements showed that 1 fully decomposes after short microwave irradiation of about 4 min (Fig. 1). The decomposition rate by microwave irradiation of 1 in IL is about 105 times faster than heating of solid 1 in an oven at 200 °C (see Fig. S4†).42
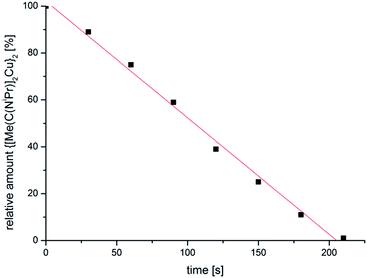 | ||
| Fig. 1 Decomposition rate of Cu amidinate 1 at 220 °C in [BMIm][BF4] determined from 1H NMR spectra (see Fig. S3 in the ESI†). | ||
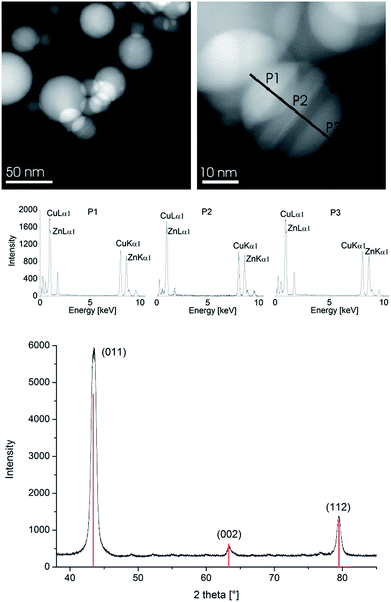
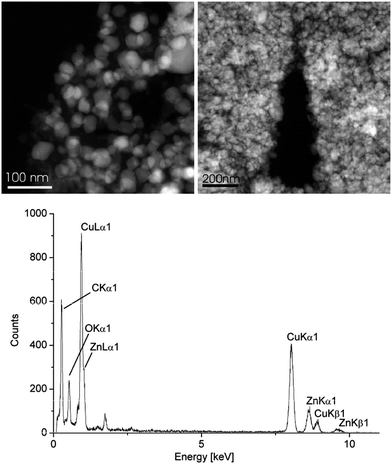
The resulting Cu- and Zn-NPs were analyzed by high-angle annular dark field-scanning transmission electron microscopy (HAADF-STEM) with energy-dispersive X-ray spectrometry (EDX) (Fig. 2 and 3), dynamic light scattering (DLS) and powder X-ray diffractometry (PXRD) for their size and size distribution (Table 1).
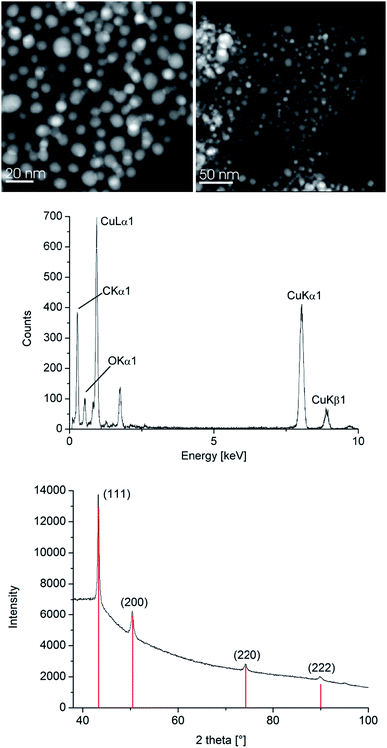 | ||
| Fig. 2 HAADF-STEM (top left), EDX (middle) and PXRD (bottom, Cu reference peaks in red from COD 9013014) of 1.0 wt% Cu-NPs in [BMIm][BF4] from 1. See Fig. S5 for Cu-NP/PC in the ESI.† | ||
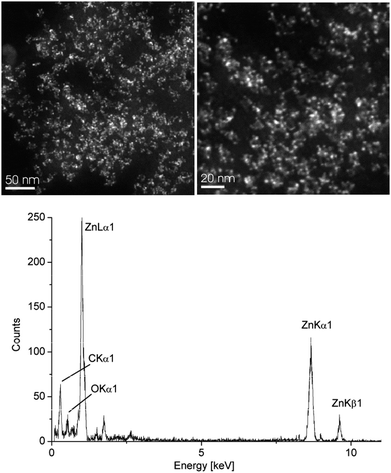 | ||
| Fig. 3 HAADF-STEM (top) and EDX (bottom) of 1.0 wt% Zn-NPs in [BMIm][BF4] from 2. See Fig. S6 in the ESI† for additional TEM. | ||
| Precursor | M-NP | TEM Ø (σ) [nm]b | DLS Ø (σ) [nm]b | PXRD Ø (σ) [nm]b,c |
|---|---|---|---|---|
| a 1.0 wt% M-NP/PC or M-NP/[BMIm][BF4] dispersions obtained by MWI with 50 W for 10 min at 220 °C. See Tables S1 and S2 in the ESI† for data on 0.5 wt% dispersions. b Median diameter (Ø) and standard deviation (σ). See Experimental section for TEM and DLS measurement conditions. c From the Scherrer equation.43 | ||||
| In [BMIm][BF 4 ] | ||||
| 1 | Cu | 11 (±6) | 15 (±8) | 10 (±5) |
| 2 | Zn | 3 (±1) | 8 (±5) | — |
| In propylene carbonate (PC) | ||||
| 1 | Cu | 85 (±15) | 93 (±11) | 80 (±7) |
| 2 | Zn | 6 (±4) | 11 (±6) | — |
The synthesis in [BMIm][BF4] gave smaller NPs than in propylene carbonate: the median diameter for the microwave-synthesized Cu- and Zn-NPs at 1.0 wt% M-NPs in [BMIm][BF4] was 11 and 3 nm, respectively, from HAADF-STEM with a typical size distribution (standard deviation, Table 1) seen for M-NPs in this IL.34–36,39 Propylene carbonate gave a median diameter of 85 and 6 nm, respectively, from HAADF-STEM. The hydrodynamic radius from DLS is usually slightly larger than the size of the pure metal cluster from TEM. In both solvents the Zn-NPs were much smaller than the Cu-NPs. Yet, no extra stabilizers or capping molecules are needed to achieve and stabilize these particle sizes. In both media M-NP dispersions are stable with the non-agglomerated NPs present six weeks after synthesis according to HAADF-STEM measurements carried out at this time.
Interestingly, the zinc(II)-amidinate precursor 2 together with the synthesis using IL and PC allows the stabilization of very small and nicely uniform Zn-NPs (Fig. 3). This observation is in distinct contrast to the previous precursor concepts for the Zn-component employed in conventional solvents. Only very large, anisotropic Zn-nanostructures were obtained in these cases (in particular, see ref. 5, p. 42).3
Synthesis of Cu/Zn alloy nanoparticles
So far, ionic liquids have played a small role in the synthesis of nanoalloys.44 The amidinates {[Me(C(NiPr)2)]Cu}2 (1) and [Me(C(NiPr)2)]2Zn (2) were dissolved/suspended together under a nitrogen atmosphere in dried and deoxygenated [BMIm][BF4] or PC in selected different ratios (cf.Table 5). Complete decomposition by microwave irradiation of the amidinates in these solvents was achieved after only 10 minutes using a low power of 50 W to give an approximate temperature of 220 °C in the reaction mixture (Scheme 4). | ||
| Scheme 4 Microwave-assisted thermal co-decomposition of metal amidinates 1 and 2 to Cu/Zn-alloy NPs in IL or PC. | ||
The resulting red-brown to dark-brown copper–zinc-alloy nanoparticle dispersions (1.0 wt% in total metal) were reproducibly obtained through the microwave decomposition route. Preset selected different ratios (see Table 5) of the amidinates 1 and 2 led to different phases of the nano-brass particles.
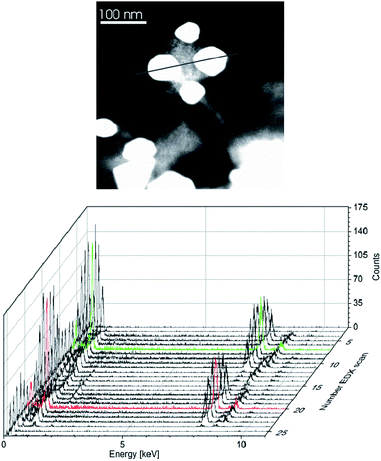
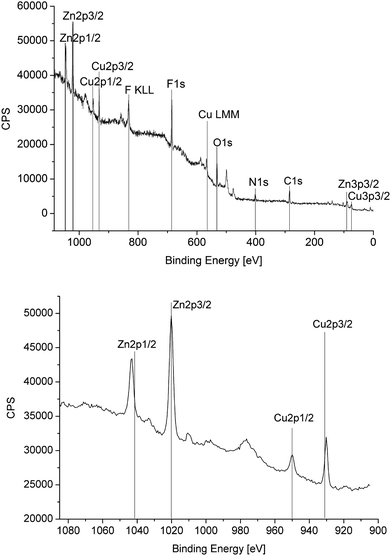
Size and size distribution, phase and phase purity of the copper–zinc alloy nanoparticles were analyzed by HAADF-STEM with local resolution EDX (Fig. 4–6), DLS, X-ray photoelectron spectroscopy (XPS, Fig. 7) and PXRD (Fig. 4) (Tables 2 and 3) (see also Fig. S7–S10 in the ESI†).
| Entry | Molar ratio of Cu![[thin space (1/6-em)]](https://www.rsc.org/images/entities/char_2009.gif) : :![[thin space (1/6-em)]](https://www.rsc.org/images/entities/char_2009.gif) Zn Zn |
TEM Ø (σ) [nm]b | DLS Ø (σ) [nm]b | PXRD Ø (σ) [nm]b,c |
|---|---|---|---|---|
| a 1.0 wt% M-NP/PC or M-NP/[BMIm][BF4] dispersions obtained by MWI with 50 W for 10 min at 220 °C. b Median diameter (Ø) and standard deviation (σ). See Experimental section for TEM and DLS measurement conditions. c From the Scherrer equation.43 d No precipitation possible. | ||||
| In [BMIm][BF 4 ] | ||||
| 1 | 1![[thin space (1/6-em)]](https://www.rsc.org/images/entities/char_2009.gif) : :![[thin space (1/6-em)]](https://www.rsc.org/images/entities/char_2009.gif) 1 1 |
51 (±29) | — | 48 (±8) |
| 2 | 3![[thin space (1/6-em)]](https://www.rsc.org/images/entities/char_2009.gif) : :![[thin space (1/6-em)]](https://www.rsc.org/images/entities/char_2009.gif) 1 1 |
48 (±12) | — | —d |
| In propylene carbonate (PC) | ||||
| 3 | 1![[thin space (1/6-em)]](https://www.rsc.org/images/entities/char_2009.gif) : :![[thin space (1/6-em)]](https://www.rsc.org/images/entities/char_2009.gif) 1 1 |
102 (±55) | 134 (±73) | —d |
| 4 | 3![[thin space (1/6-em)]](https://www.rsc.org/images/entities/char_2009.gif) : :![[thin space (1/6-em)]](https://www.rsc.org/images/entities/char_2009.gif) 1 1 |
— | 92 (±25) | —d |
| Entry | Molar ratio of Cu![[thin space (1/6-em)]](https://www.rsc.org/images/entities/char_2009.gif) : :![[thin space (1/6-em)]](https://www.rsc.org/images/entities/char_2009.gif) Zn precursor Zn precursor |
Phase, PXRDb | Molar ratio of Cu![[thin space (1/6-em)]](https://www.rsc.org/images/entities/char_2009.gif) : :![[thin space (1/6-em)]](https://www.rsc.org/images/entities/char_2009.gif) Zn, EDXc Zn, EDXc |
Molar ratio of Cu![[thin space (1/6-em)]](https://www.rsc.org/images/entities/char_2009.gif) : :![[thin space (1/6-em)]](https://www.rsc.org/images/entities/char_2009.gif) Zn, XPSd Zn, XPSd |
|---|---|---|---|---|
| a 1.0 wt% M-NP/PC or M-NP/[BMIm][BF4] or PC dispersions obtained by MWI with 50 W for 10 min at 220 °C; see matching entries for size determinations in Table 2. b Precipitated and washed with acetonitrile, reference: Crystallography Open Database, COD. c k-factor Cu: 1.667, k-factor Zn: 1.759; estimated minimum errors ±1–2%. d Precipitated and washed with acetonitrile. e No precipitation possible. | ||||
| In [BMIm][BF 4 ] | ||||
| 1 | 1![[thin space (1/6-em)]](https://www.rsc.org/images/entities/char_2009.gif) : :![[thin space (1/6-em)]](https://www.rsc.org/images/entities/char_2009.gif) 1 1 |
β-CuZn | 49![[thin space (1/6-em)]](https://www.rsc.org/images/entities/char_2009.gif) : :![[thin space (1/6-em)]](https://www.rsc.org/images/entities/char_2009.gif) 51 51 |
49.9![[thin space (1/6-em)]](https://www.rsc.org/images/entities/char_2009.gif) : :![[thin space (1/6-em)]](https://www.rsc.org/images/entities/char_2009.gif) 50.1 50.1 |
| 2 | 3![[thin space (1/6-em)]](https://www.rsc.org/images/entities/char_2009.gif) : :![[thin space (1/6-em)]](https://www.rsc.org/images/entities/char_2009.gif) 1 1 |
—e | 76![[thin space (1/6-em)]](https://www.rsc.org/images/entities/char_2009.gif) : :![[thin space (1/6-em)]](https://www.rsc.org/images/entities/char_2009.gif) 24 24 |
74.1![[thin space (1/6-em)]](https://www.rsc.org/images/entities/char_2009.gif) : :![[thin space (1/6-em)]](https://www.rsc.org/images/entities/char_2009.gif) 25.9 25.9 |
| In propylene carbonate (PC) | ||||
| 3 | 1![[thin space (1/6-em)]](https://www.rsc.org/images/entities/char_2009.gif) : :![[thin space (1/6-em)]](https://www.rsc.org/images/entities/char_2009.gif) 1 1 |
β-CuZn | 52![[thin space (1/6-em)]](https://www.rsc.org/images/entities/char_2009.gif) : :![[thin space (1/6-em)]](https://www.rsc.org/images/entities/char_2009.gif) 48 48 |
50.1![[thin space (1/6-em)]](https://www.rsc.org/images/entities/char_2009.gif) : :![[thin space (1/6-em)]](https://www.rsc.org/images/entities/char_2009.gif) 49.9 49.9 |
| 4 | 3![[thin space (1/6-em)]](https://www.rsc.org/images/entities/char_2009.gif) : :![[thin space (1/6-em)]](https://www.rsc.org/images/entities/char_2009.gif) 1 1 |
—e | 75![[thin space (1/6-em)]](https://www.rsc.org/images/entities/char_2009.gif) : :![[thin space (1/6-em)]](https://www.rsc.org/images/entities/char_2009.gif) 25 25 |
— |
For equimolar ratios of 1 and 2 the nanoparticles analyzed as β-CuZn alloy nanoparticles according to local resolution EDX and PXRD (Fig. 4 and S7 in the ESI†) with the bulk Cu![[thin space (1/6-em)]](https://www.rsc.org/images/entities/char_2009.gif) :
:![[thin space (1/6-em)]](https://www.rsc.org/images/entities/char_2009.gif) Zn molar ratio of 1
Zn molar ratio of 1![[thin space (1/6-em)]](https://www.rsc.org/images/entities/char_2009.gif) :
:![[thin space (1/6-em)]](https://www.rsc.org/images/entities/char_2009.gif) 1 confirmed by XPS (Fig. 7).
1 confirmed by XPS (Fig. 7).
For a 3![[thin space (1/6-em)]](https://www.rsc.org/images/entities/char_2009.gif) :
:![[thin space (1/6-em)]](https://www.rsc.org/images/entities/char_2009.gif) 1 ratio of the amidinates 1 and 2 the nanoparticles analyzed as γ-Cu3Zn alloy nanoparticles according to local resolution EDX (Fig. 5, 6, S9 and S10 in the ESI†).
1 ratio of the amidinates 1 and 2 the nanoparticles analyzed as γ-Cu3Zn alloy nanoparticles according to local resolution EDX (Fig. 5, 6, S9 and S10 in the ESI†).
The phase and phase purity of the β-CuZn and γ-Cu3Zn nanoparticles, respectively, were independent of the solvent matrix ([BMIm][BF4] or PC) used for the synthesis. However, as expected [BMIm][BF4] gave again smaller particles than propylene carbonate. The median diameter for different CuxZny nanoparticles at 1.0 wt% in [BMIm][BF4] was between 45 and 51 nm, with a typical size distribution (Table 2). Propylene carbonate gave a median diameter between 60 and 102 nm. In comparison with the pure copper or zinc particles, the nano-brass alloys gave larger nanoparticles (compare Tables 1 and 2, Fig. S7–S10 in the ESI†). Again, all nano-brass dispersions are stable for up to six weeks after synthesis with non-agglomerated NPs according to HAADF-STEM measurements carried out at this time.
It should be noted that the previous precursor concept based on co-hydrogenolysis of [CpCu(PMe3)] and [Cp2*Zn] also allowed the synthesis of Cu/Zn nanoparticles with some control over the composition.5,7 However, it was impossible to obtain nicely free-standing, stoichiometric β-CuZn nanoparticles by using different surfactants. For example, with the additive poly(oxy-2,6-dimethyl-1,4-phenylene) (also called polyphenylene oxide, PPO) more or less agglomerated nanoparticles with a typical size of 30–40 nm were obtained. However, in the case of copper-rich alloys, e.g. Cu1−xZnx (x = 0.09; 0.17; 0.33), PPO stabilized colloids of the respective free-standing particles were obtained and revealed to have smaller particle sizes around 25 (±5) nm.7
EDX and XPS provided information about the composition of the copper–zinc-alloy nanoparticle dispersions by quantifying the copper–zinc ratios. XPS verified the averaged element composition from the preset Cu![[thin space (1/6-em)]](https://www.rsc.org/images/entities/char_2009.gif) :
:![[thin space (1/6-em)]](https://www.rsc.org/images/entities/char_2009.gif) Zn precursor ratio (Fig. 7). The local resolution EDX showed a homogeneous element distribution throughout single nanoparticles and thereby a homogeneous phase of the CuZn and Cu3Zn nanoparticles (Fig. 4 and 6). PXRD identified the 1
Zn precursor ratio (Fig. 7). The local resolution EDX showed a homogeneous element distribution throughout single nanoparticles and thereby a homogeneous phase of the CuZn and Cu3Zn nanoparticles (Fig. 4 and 6). PXRD identified the 1![[thin space (1/6-em)]](https://www.rsc.org/images/entities/char_2009.gif) :
:![[thin space (1/6-em)]](https://www.rsc.org/images/entities/char_2009.gif) 1 (Cu
1 (Cu![[thin space (1/6-em)]](https://www.rsc.org/images/entities/char_2009.gif) :
:![[thin space (1/6-em)]](https://www.rsc.org/images/entities/char_2009.gif) Zn) phase as β-CuZn nano-brass (Fig. 4 and Table 3).
Zn) phase as β-CuZn nano-brass (Fig. 4 and Table 3).
Catalytic methanol formation
The state-of-the-art bimetallic-NP catalysts for a “green and sustainable future” have recently been critically reviewed.45 With a few exceptions, most of the bimetallic catalysts used in this realm are standard catalysts off-the-shelf or catalysts prepared by conventional routes, that is, ILs play almost no role,45 different from monometallic-NP catalysts.46Methanol is one of the most important chemical commodities in the world, with a capacity of about 30 million tons per year worldwide. The actual industrial process for methanol synthesis from syngas and CO2 uses a ternary Cu/ZnO/Al2O3 solid-state catalyst. This catalyst is prepared by aqueous precipitation, aging and subsequent calcination process. Schüth et al. have reported quasi homogeneous methanol synthesis from CO and H2 through the use of highly active Cu nanoparticles with a typical diameter of 3–5 nm, prepared by reducing Cu(acac)2 with AlR3 (R = n-octyl, n-butyl) in THF.47 In this case, the Cu-nanoparticles are surface decorated with alkylaluminum species, possibly RAl(acac)2 and related species, acting as surfactants. Similarly, free-standing, ZnO surface decorated Cu nanoparticles of 1–3 nm size were obtained by sequential co-pyrolysis of [Cu(OCHMeCH2NMe2)2] and ZnEt2 in squalane in the absence of additional surfactants and proved to be highly active quasi-homogeneous catalysts for methanol synthesis from CO and H2.48 Also, a related ternary Cu/ZnO/Al2O3 nanocomposite model catalyst of moderate activity was obtained by application of sequential precursor pyrolysis employing the addition of H3AlNMe3 as an Al source.6 In contrast, as mentioned in the Introduction, the β-CuZn nano-brass particles stabilized by PPO and obtained from co-hydrogenolysis of [CpCu(PMe3)] and [Cp2*Zn] were inactive. The relevance of this kind of quasi-homogeneous model catalyst for the methanol synthesis process prompted us to investigate the catalytic activity of the new binary β-CuZn nano-brass colloids obtained from amidinate precursor decomposition in the ionic liquid [BMIm][BF4] under organic-solvent-free conditions.
Freshly synthesized β-CuZn/[BMIm][BF4] nanoparticle dispersions (1.0 wt% in metal) were tested for methanol synthesis in a Büchi, high-pressure, stainless-steel autoclave within a quasi-homogeneous phase. The ratio of gases in the reaction gas mixture was adjusted with a bpc pressflow controller to correspond to the typical industrial gas-phase composition (H2/CO/CO2 = 74![[thin space (1/6-em)]](https://www.rsc.org/images/entities/char_2009.gif) :
:![[thin space (1/6-em)]](https://www.rsc.org/images/entities/char_2009.gif) 20
20![[thin space (1/6-em)]](https://www.rsc.org/images/entities/char_2009.gif) :
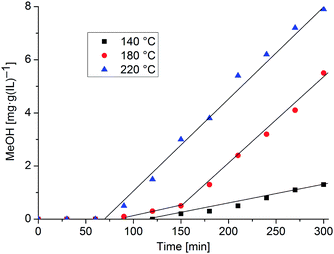
:![[thin space (1/6-em)]](https://www.rsc.org/images/entities/char_2009.gif) 6 v/v/v). In a typical catalytic procedure, the high-pressure autoclave was charged with the β-CuZn colloid dispersion (5.0 g). The reaction mixture was heated to 140 °C, 180 °C or 220 °C. After reaching the reaction temperature the autoclave was sequentially pressurized with H2, CO and CO2 to a total pressure of 35 bar. After a selected time the reaction was stopped and cooled down, and a 0.5 g sample was analyzed for its MeOH content by GC and NMR. For the MeOH content at another time a new batch reaction with a fresh catalyst was started. The results of the methanol formation under these reaction conditions with β-CuZn/[BMIm][BF4] nanoparticles are summarized in Fig. 8. Each data point in Fig. 8 is a new experiment which started at t = 0 min and the combined results shown in Fig. 8 are evidence for the reproducibility of the system.
6 v/v/v). In a typical catalytic procedure, the high-pressure autoclave was charged with the β-CuZn colloid dispersion (5.0 g). The reaction mixture was heated to 140 °C, 180 °C or 220 °C. After reaching the reaction temperature the autoclave was sequentially pressurized with H2, CO and CO2 to a total pressure of 35 bar. After a selected time the reaction was stopped and cooled down, and a 0.5 g sample was analyzed for its MeOH content by GC and NMR. For the MeOH content at another time a new batch reaction with a fresh catalyst was started. The results of the methanol formation under these reaction conditions with β-CuZn/[BMIm][BF4] nanoparticles are summarized in Fig. 8. Each data point in Fig. 8 is a new experiment which started at t = 0 min and the combined results shown in Fig. 8 are evidence for the reproducibility of the system.
The β-CuZn/[BMIm][BF4] dispersion proved to be a precursor for an active catalyst for methanol synthesis. Interestingly, a temperature dependent induction period between 1 and 2 h is needed for the onset of methanol formation. The gaseous components H2/CO/CO2 react in equilibrium with the formation of H2O by the water–gas shift reaction: H2 + CO2 ⇆ H2O + CO. ZnO also as nanoparticles is known to form from zinc and H2O/CO2 mixtures at higher temperatures.49 Highly active binary Cu/ZnO methanol catalysts are suggested to be nanocomposite microstructures with matching Cu and ZnO particle sizes.50 The induction period seen in Fig. 8 reflects the suggested formation of Cu/ZnO which is also detected after catalysis (see below). Furthermore, the formation of nanocomposites of different activities is time-dependent and they form at different temperatures. It is quite possible that in addition to the formation of the Cu/ZnO nanocomposite during the induction period (no methanol formation), which essentially refers to the preferential oxidation (corrosion) of the Zn-component of the Cu/Zn nano alloy (as we have discussed in detail in the manuscript), other processes of surface restructuring and/or morphological changes of the Cu/ZnO composites take place during the progressing catalysis test. At 140 °C induction to low-active species takes place over 100 min. At 180 °C induction needs less than 100 min with the same low-active species forming initially. Then after a total of 150 min at this temperature a higher active nanocomposite forms and the catalytic reaction continues with increased turnover (red data points in Fig. 8). These high-active species are presumably directly formed at 220 °C in less than 100 min (blue data points).
The productivity of methanol formation is obtained from the slope of the linear regression of the data points after the induction period (e.g. 0.0286 mg MeOH (g(IL) min)−1 at 220 °C, Fig. 8). The slope at 220 °C calculates into a productivity of 10.7 mol(MeOH) (kg(Cu) h)−1. For the much smaller 3–5 nm Cu-nanoparticles Schüth et al. reported a maximum productivity of 25.2 mol(MeOH) (kg(Cu) 1 h)−1 following an induction period of about 4.5 h.47
No catalyst deactivation was observed up to 300 min (5 h) in this series of experiments (Fig. 8). Most likely the initial β-CuZn nanoparticles undergo certain changes upon exposure to H2/CO/CO2 gas mixtures under the conditions of the catalytic experiment. Based on the previous work on related Cu/Zn and Cu/ZnO nanoparticle and nanocomposite systems tested in methanol synthesis we suggest that selective oxidation of the Zn component of β-CuZn has to be taken into account which is likely to yield nanocomposite particles Cu1Zn1−δ/(ZnOx)δ whose composition and microstructure are possibly more or less comparable to the related species obtained by co-pyrolysis of [Cu(OCHMeCH2NMe2)2] and ZnEt2 in squalane.48 Note that the co-pyrolysis of copper and zinc stearate salts in squalane in the presence of H2 and CO was studied in detail and showed an induction period, too. Ex situ HRTEM studies revealed ZnO decorated Cu nanoparticles as the active species in this case.4 Similar work is needed to elucidate the formation mechanism and the microstructural features of the active particles derived from β-CuZn/[BMIm][BF4] as the nanocatalyst precursor.
Investigation of the β-CuZn/[BMIm][BF4] dispersion after catalytic methanol formation at 220 °C and 300 min by STEM still showed particles in the 50 nm diameter range (Fig. 9) as before the catalysis (Table 2). The white particles in Fig. 9 are crystalline with a high Cu content. The regions around the white particles are amorphous and contain mostly ZnO according to EDX. Over a larger particle region EDX gave a molar Cu![[thin space (1/6-em)]](https://www.rsc.org/images/entities/char_2009.gif) :
:![[thin space (1/6-em)]](https://www.rsc.org/images/entities/char_2009.gif) Zn ratio of 47.3
Zn ratio of 47.3![[thin space (1/6-em)]](https://www.rsc.org/images/entities/char_2009.gif) :
:![[thin space (1/6-em)]](https://www.rsc.org/images/entities/char_2009.gif) 52.7 after catalysis compared to 49
52.7 after catalysis compared to 49![[thin space (1/6-em)]](https://www.rsc.org/images/entities/char_2009.gif) :
:![[thin space (1/6-em)]](https://www.rsc.org/images/entities/char_2009.gif) 51 before catalysis for β-CuZn (Table 3). EDX also showed that the oxygen content of the post-catalytic sample had increased substantially (Fig. 9).
51 before catalysis for β-CuZn (Table 3). EDX also showed that the oxygen content of the post-catalytic sample had increased substantially (Fig. 9).
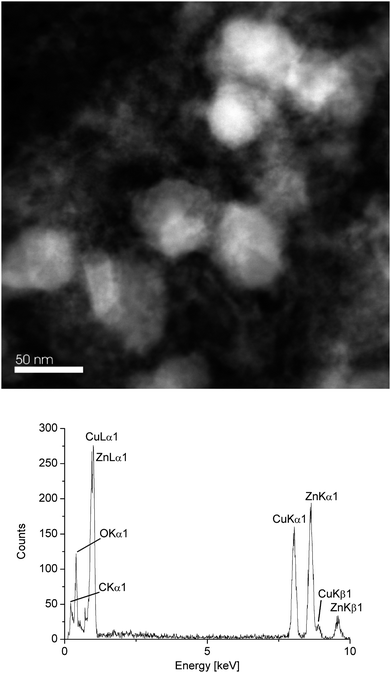 | ||
| Fig. 9 HAADF-STEM (top) and EDX (bottom, averaged over 10 particles) of dispersion after catalytic MeOH formation at 220 °C and 300 min. | ||
PXRD of the nanoparticles separated from the same dispersion (Fig. 10) reveals that only a fraction of the original β-CuZn phase remained, with the rest having turned into crystalline Cu-NPs and amorphous ZnO (cf.Fig. 9).
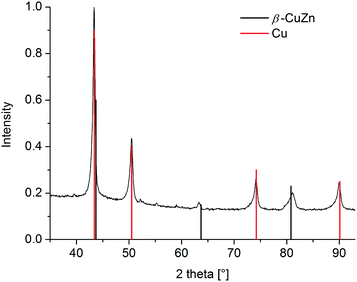 | ||
| Fig. 10 PXRD of dispersion after catalytic MeOH formation at 220 °C and 300 min (Cu reference peaks in red from COD 9013014; black reference peaks for β-CuZn from COD 9008814). | ||
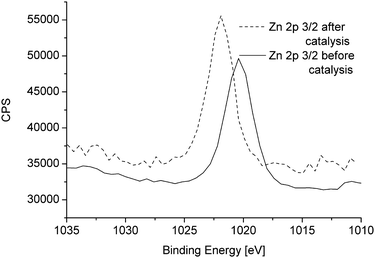
The XPS spectra of Zn 2p 3/2 before and after catalysis are shown in Fig. 11. The Zn 2p 3/2 peak at 1020.4 eV in β-CuZn (cf.Fig. 7) is shifted to 1022.0 eV which corresponds to ZnO.51
Conclusion
We describe here simple, reproducible, and broadly applicable microwave-induced metal amidinate decomposition for the synthesis of small and uniform Cu-NPs (av. diameter starting at 11 ± 6 nm) and Zn-NPs (3 ± 1 nm) in 1-butyl-3-methylimidazolium tetrafluoroborate ([BMIm][BF4]) and propylene carbonate (PC). Co-decomposition of the two amidinates selectively yields the intermetallic phases β-CuZn and γ-Cu3Zn depending on the chosen molar ratios of the precursors. The obtained β-CuZn alloy particles served as precursors to active catalysts for methanol synthesis from the synthesis gas H2/CO/CO2. Thus, Cu/Zn-NP formation from amidinate precursors in IL turned out to be superior to the conventional co-hydrogenolysis of [CpCu(PMe3)] and [ZnCp2*] in mesitylene with surfactant additives, as these latter samples were inactive for methanol synthesis. The results nicely show the advantages of a novel metal–organic precursor concept based on metal amidinates together with choosing non-conventional solvents and microwave-assisted pyrolysis52 in the absence of additional surfactants and other reducing agents (e.g. hydrogen) for soft chemical nanoalloy formation.Experimental section
All synthesis experiments were carried out with Schlenk techniques under nitrogen or argon since the amidinates are hygroscopic and air sensitive. The solvents (acetone, acetonitrile, n-hexane, toluene, tetrahydrofuran) were dried using the MBraun solvent purification system. Propylene carbonate, PC, was dried under high vacuum (10−3 mbar) for several days. 1,3-Diisopropylcarbodiimide (>99%), copper(I)-chloride (>99%), zinc(II)chloride (>98%), methyllithium, 1-chlorobutane (>99%), and 1-methylimidazole(>99%) were obtained from Sigma-Aldrich and used without further purification; racemic propylene carbonate (PC) was from Sigma-Aldrich (purity 99.7%, H2O free).{[Me(C(NiPr)2)]Cu}2 (1) and [Me(C(NiPr)2)]2Zn (2) were synthesized by deprotonation and methylation of 1,3-diisopropylcarbodiimide with methyllithium. The resulting lithium amidinates were then reacted with copper(I) or zinc(II) chloride according to literature procedures.53,54
The ionic liquid [BMIm][BF4] was synthesized by reacting 1-methylimidazole with 1-chlorobutane to yield first [BMIm][Cl] which was further reacted with HBF4 to give [BMIm][BF4]. The IL was dried under high vacuum (10−7 mbar) at 80 °C for several days. Quantitative anion exchange and, thus, IL purity was assessed by ion chromatography (Dionex ICS-1100, with IonPac® AS14, 4 × 250 mm column) to be >99%. The water content determined by coulometric Karl Fischer titration (ECH/ANALYTIK JENA AQUA 40.00) was less than 10 ppm.
The X-ray photoelectron spectroscopy, XPS-(ESCA-) measurement was performed with a Fisons/VG Scientific ESCALAB 200X XP-spectrometer, operating at room temperature, a pressure of 1.0 × 10⁻⁸ bar and a sample angle of 30°. Using this spectrometer, electron spectra were recorded using polychromatic Al-Kα excitation (14 kV, 20 mA) and an emission angle of 0°. Calibration of the XPS was carried out by recording spectra, using Al Kα X-rays, from clean samples of copper, silver and gold, at 20 eV and 10 eV pass energies and compared with reference values.
PXRD data were obtained at ambient temperature on a Bruker D2 Phaser using a flat sample holder and Cu-Kα radiation (λ = 1.54182 Å, 35 kV). The samples had been precipitated with acetone from the NP/IL and NP/PC dispersion and washed with acetonitrile. PXRDs were measured for 2–12 h.
GC/MS data were recorded on a Thermo Finnigan Trace DSQ.
NMR spectra were recorded on a Bruker Avance DRX 200 and Avance DRX 500 (1H, 200 MHz; 13C, 125.57 MHz) at 298 K in C6D6 and CDCl3 and the chemical shifts are referenced to the residual proton solvent peaks against TMS.
High-angle annular dark field-scanning transmission electron microscopy (HAADF-STEM) images were taken at room temperature on a Fei Tecnai G20 TEM operating at an accelerating voltage of 200 kV. Samples were deposited on 200 μm carbon-coated gold grids. The size distribution was calculated from manual diameter determination over a minimum of 50 isolated particles.
TEM-EDX: FEI Tecnai f20, 136 kV, the exposure time for individual EDX spectra is 3 min. EDX analysis always shows traces of oxygen. Preparation on the grids was carried out in a glove-box. However, there is an unavoidable 30 s air contact upon placing the grid in the TEM chamber before evacuation. A low intensity oxygen signal at 0.52 eV is ubiquitous and always present also on noble metal samples and pure carbon grids (from surface oxidation).
A Malvern Zetasizer Nano-ZS was used for the dynamic light scattering (DLS) measurements working at 633 nm wavelength. Care was taken for choosing the right parameters, such as the index of refraction of the transition metals at their wavelengths (Table S2†). Samples were prepared by dissolution of 0.05 or 0.1 mL of the 1.0 or 0.5 wt% metal/PC dispersion in acetone (99% p.a.; particle free) in a glass cuvette before measurement. Acetone is also capable of stabilizing nanostructured metal clusters for a short time.55,56
Metal nanoparticle (M-NP) synthesis: decomposition by means of microwave irradiation was carried out under nitrogen. In a typical reaction, the amidinate powders (see Tables 4 and 5) were dissolved/suspended (≈12 h) under a nitrogen atmosphere at room temperature in dried and deoxygenated [BMIm][BF4] or PC for a 1.0 wt% total M-NP dispersion. For the synthesis, the mixture was placed in a microwave (CEM, Discover) under an inert nitrogen atmosphere and the conversion was finished within 10 min at a power of 50 W and a temperature of 220 °C. Each decomposition reaction was carried out at least twice.
| Precursor | M-NP | mg (mmol) {[Me(C(NiPr)2)]Cu}2 (1)b | mg (mmol) [Me(C(NiPr)2)]2Zn (2)b |
|---|---|---|---|
| a See Table 1. b Molar mass of {[Me(C(NiPr)2)]Cu}2 (1) 409.56 g mol−1; [Me(C(NiPr)2)]2Zn (2) 347.85 g mol−1; density [BMIm][BF4]: 1.21 g mL−1, density PC: 1.19 g mL−1. | |||
| In [BMIm][BF 4 ] | |||
| 1 | Cu | 32.2 (0.078) | — |
| 2 | Zn | — | 53.2 (0.153) |
| In propylene carbonate (PC) | |||
| 1 | Cu | 32.2 (0.078) | — |
| 2 | Zn | — | 53.2 (0.153) |
| Entrya | Molar ratio of copper![[thin space (1/6-em)]](https://www.rsc.org/images/entities/char_2009.gif) : :![[thin space (1/6-em)]](https://www.rsc.org/images/entities/char_2009.gif) zinc precursor zinc precursor |
mg (mmol) {[Me(C(NiPr)2)]Cu}2 (1)b | mg (mmol) [Me(C(NiPr)2)]2Zn (2)b |
|---|---|---|---|
| a Refers to entries in Tables 2 and 3. b Molar mass of {[Me(C(NiPr)2)]Cu}2 (1) 409.56 g mol−1; [Me(C(NiPr)2)]2Zn (2) 347.85 g mol−1; density [BMIm][BF4]: 1.21 g mL−1, density PC: 1.19 g mL−1. | |||
| In [BMIm][BF 4 ] | |||
| 1 | 1![[thin space (1/6-em)]](https://www.rsc.org/images/entities/char_2009.gif) : :![[thin space (1/6-em)]](https://www.rsc.org/images/entities/char_2009.gif) 1 1 |
16.1 (0.039) | 26.5 (0.076) |
| 2 | 3![[thin space (1/6-em)]](https://www.rsc.org/images/entities/char_2009.gif) : :![[thin space (1/6-em)]](https://www.rsc.org/images/entities/char_2009.gif) 1 1 |
24.2 (0.059) | 13.3 (0.038) |
| In propylene carbonate (PC) | |||
| 3 | 1![[thin space (1/6-em)]](https://www.rsc.org/images/entities/char_2009.gif) : :![[thin space (1/6-em)]](https://www.rsc.org/images/entities/char_2009.gif) 1 1 |
16.1 (0.039) | 26.5 (0.076) |
| 4 | 3![[thin space (1/6-em)]](https://www.rsc.org/images/entities/char_2009.gif) : :![[thin space (1/6-em)]](https://www.rsc.org/images/entities/char_2009.gif) 1 1 |
24.2 (0.059) | 13.3 (0.038) |
Catalysis
A Büchi stainless-steel autoclave with glass inlet was charged with 5 g freshly synthesized β-CuZn/[BMIm][BF4] nanoparticle suspension (1.0 wt%). The ratio of gases in the reaction gas mixture was adjusted to H2/CO/CO2 = 74![[thin space (1/6-em)]](https://www.rsc.org/images/entities/char_2009.gif) :
:![[thin space (1/6-em)]](https://www.rsc.org/images/entities/char_2009.gif) 20
20![[thin space (1/6-em)]](https://www.rsc.org/images/entities/char_2009.gif) :
:![[thin space (1/6-em)]](https://www.rsc.org/images/entities/char_2009.gif) 6 volume ratio (Büchi pressflow gas controller, bpc). The reaction mixture was heated to 140 °C, 180 °C and 220 °C. After reaching the reaction temperature the autoclave was sequentially pressurized with H2, CO and CO2 to a pressure of 35 bar which was kept constant by the Büchi bpc. After the chosen time the reaction was stopped and cooled down, and a 0.5 g sample was analyzed for its MeOH content by GC/MS and NMR analyses. A 1H NMR spectrum was recorded by dissolving 0.05 mL of the sample in deuterated chloroform (see Fig. S7 in the ESI†). The spectra were compared to a calibration curve obtained with different methanol concentrations in [BMIm][BF4]. The intensity of the methyl group in methanol was used for quantification.
6 volume ratio (Büchi pressflow gas controller, bpc). The reaction mixture was heated to 140 °C, 180 °C and 220 °C. After reaching the reaction temperature the autoclave was sequentially pressurized with H2, CO and CO2 to a pressure of 35 bar which was kept constant by the Büchi bpc. After the chosen time the reaction was stopped and cooled down, and a 0.5 g sample was analyzed for its MeOH content by GC/MS and NMR analyses. A 1H NMR spectrum was recorded by dissolving 0.05 mL of the sample in deuterated chloroform (see Fig. S7 in the ESI†). The spectra were compared to a calibration curve obtained with different methanol concentrations in [BMIm][BF4]. The intensity of the methyl group in methanol was used for quantification.
Acknowledgements
The authors are thankful to the Deutsche Forschungsgemeinschaft (DFG) for financial support.Notes and references
- A. Zychma, R. Wansing, V. Schott, U. Köhler, C. Wöll, M. Muhler and A. Birkner, Phys. Status Solidi B, 2013, 250, 1071–1080 CrossRef CAS.
- M. Behrens, F. Studt, I. Kasatkin, S. Kühl, M. Hävecker, F. Abild-Pedersen, S. Zander, F. Girgsdies, P. Kurr, B.-L. Kniep, M. Tovar, R. W. Fischer, J. K. Norskov and R. Schlögl, Science, 2012, 336, 893–897 CrossRef CAS PubMed; S. Zander, B. Seidlhofer and M. Behrens, Dalton Trans., 2012, 41, 13413–13422 RSC.
- J. Hambrock, M. K. Schroeter, A. Birkner, C. Woell and R. A. Fischer, Chem. Mater., 2003, 15, 4217–4222 CrossRef.
- S. Schimpf, A. Rittermeier, X. N. Zhang, Z. A. Li, M. Spasova, M. W. E. van den Berg, M. Farle, Y. M. Wang, R. A. Fischer and M. Muhler, ChemCatChem, 2010, 2, 214–222 CrossRef CAS.
- M. Cokoja, Nanometallurgy in organic solution: organometallic synthesis of intermetallic transition metal aluminide and -zincide nanoparticles, Dissertation, Ruhr-University Bochum, 2007.
- M. K. Schröter, Kolloidale Cu-Katalysatoren für die Methanolsynthese in der flüssigen phase, Dissertation, Ruhr-University Bochum, 2007.
- M. Cokoja, H. Parala, M. K. Schroeter, A. Birkner, M. W. van den Berg, K. V. Klementiev, W. Gruenert and R. A. Fischer, J. Mater. Chem., 2006, 16, 2420–2428 RSC.
- (a) P. Lara, O. R. Wheelaghan, S. Conejero, R. Poteau, K. Philippot and B. Chaudret, Angew. Chem., Int. Ed., 2011, 50, 12080–12084 CrossRef PubMed; (b) T. C. Golindano, S. I. Martínez, O. Z. Delgado and G. P. Rivas, Nanotechnology, 2005, 2, 634–637 Search PubMed; (c) N. Cordente, C. Amiens, B. Chaudret, M. Respaud and F. Senocq, J. Appl. Phys., 2003, 94, 6358–6365 CrossRef PubMed; (d) Y. Li, J. Liu, Y. Wang and Z. L. Wang, Chem. Mater., 2001, 13, 1008–1014 CrossRef CAS.
- B. Cormary, F. Dumestre, N. Liakakos, K. Soulantica and B. Chaudret, Dalton Trans., 2013, 42, 12546–12553 RSC; M. V. Kovalenko and C. Coperet, Dalton Trans., 2013, 42, 12520 RSC; Ö. Metin, X. Sun and S. Sun, Nanoscale, 2013,(5), 910–912 RSC; C. Kumara and A. Dass, Nanoscale, 2012, 4, 4084–4086 RSC; Z.-C. Zhang, J.-F. Hui, Z.-G. Guo, Q.-Y. Yu, B. Xu, X. Zhang, Z.-C. Liu, C.-M. Xu, J.-S. Gao and X. Wang, Nanoscale, 2012, 4, 2633–2639 RSC; C. Kumara and A. Dass, Nanoscale, 2011, 3, 3064–3067 RSC.
- N. Bahlawane, K. Kohse-Hoinghaus, P. A. Premkumar and D. Lenoble, Chem. Sci., 2012, 3, 929–941 RSC.
- V. Krisyuk, L. Aloui, N. Prud'homme, S. Sysoev, F. Senocq, D. Samelor and C. Vahlas, Electrochem. Solid-State Lett., 2011, 14, D26–D29 CrossRef CAS PubMed.
- J. Bayardon, J. Holz, B. Schäffner, V. Andrushko, S. Verevkin, A. Preetz and A. Börner, Angew. Chem., Int. Ed., 2007, 46, 5971–5974 CrossRef CAS PubMed.
- S. P. Verevkin, V. N. Emel'yanenko, A. V. Toktonov, Y. Chernyak, B. Schäffner and A. Börner, J. Chem. Thermodyn., 2008, 40, 1428–1432 CrossRef CAS PubMed.
- B. Schäffner, S. P. Verevkin and A. Börner, Chem. Unserer Zeit, 2009, 43, 12–21 CrossRef.
- C. Vollmer, R. Thomann and C. Janiak, Dalton Trans., 2012, 41, 9722–9727 RSC.
- J. Demel, J. Čejka, S. Bakardjieva and P. Štěpnička, J. Mol. Catal. A: Chem., 2007, 263, 259–265 CrossRef CAS PubMed; M. Reetz and G. Lohmer, Chem. Commun., 1996, 1921–1922 RSC; A. Behr, N. Döring, S. Durowicz-Heil, B. Ellenberg, C. Kozik, C. Lohr and H. Schmidke, Fat Sci. Technol., 1993(95), 2–12 Search PubMed; A. Behr and H. Schmidke, Chem.-Ing.-Tech., 1993, 65, 568–569 CrossRef.
- T. Welton, Chem. Rev., 1999, 99, 2071–2084 CrossRef CAS PubMed.
- C. Feldmann, Z. Naturforsch., B: J. Chem. Sci, 2013, 68, 1057 CrossRef . Introduction to special issue on ionic liquids in chemical synthesis.
- J. P. Hallett and T. Welton, Chem. Rev., 2011, 111, 3508–3576 CrossRef CAS PubMed.
- T. Torimoto, T. Tsuda, K. Okazaki and S. Kuwabata, Adv. Mater., 2010, 22, 1196–1221 CrossRef CAS PubMed.
- C. Janiak, Z. Naturforsch., B: J. Chem. Sci, 2013, 68, 1059–1089 CAS.
- P. S. Campbell, M. H. G. Prechtl, C. C. Santini and P.-H. Haumesser, Curr. Org. Chem., 2013, 17, 414–429 CrossRef CAS.
- D. Freudenmann, S. Wolf, M. Wolff and C. Feldmann, Angew. Chem., Int. Ed., 2011, 50, 11050–11060 CrossRef CAS PubMed.
- E. Ahmed, J. Breternitz, M. F. Groh and M. Ruck, CrystEngComm, 2012, 14, 4874–4885 RSC; E. Ahmed and M. Ruck, Dalton Trans., 2011, 40, 9347–9357 RSC; M. F. Groh, U. Müller, E. Ahmed, A. Rothenberger and M. Ruck, Z. Naturforsch., B: J. Chem. Sci, 2013, 68, 1108–1122 Search PubMed.
- R. E. Morris, Chem. Commun., 2009, 2990–2998 RSC.
- E. R. Parnham and R. E. Morris, Acc. Chem. Res., 2007, 40, 1005–1013 CrossRef CAS PubMed.
- E. R. Cooper, C. D. Andrews, P. S. Wheatley, P. B. Webb, P. Wormald and R. E. Morris, Nature, 2004, 430, 1012–1016 CrossRef CAS PubMed.
- J. Dupont and J. D. Scholten, Chem. Soc. Rev., 2010, 39, 1780–1804 RSC.
- Y. Lin and S. Dehnen, Inorg. Chem., 2011, 50, 7913–7915 CrossRef CAS PubMed.
- P. Lodge, Science, 2008, 321, 50–51 CrossRef PubMed.
- G. S. Fonseca, G. Machado, S. R. Teixeira, G. H. Fecher, J. Morais, M. C. M. Alves and J. Dupont, J. Colloid Interface Sci., 2006, 301, 193–204 CrossRef CAS PubMed; G. S. Fonseca, J. B. Domingos, F. Nome and J. Dupont, J. Mol. Catal. A: Chem., 2006, 248, 10–16 CrossRef PubMed; G. S. Fonseca, A. P. Umpierre, P. F. P. Fichtner, S. R. Teixeira and J. Dupont, Chem. – Eur. J., 2003, 9, 3263–3269 CrossRef PubMed; J. Dupont, G. S. Fonseca, A. P. Umpierre, P. F. P. Fichter and S. R. Teixeira, J. Am. Chem. Soc., 2002, 124, 4228–4229 CrossRef PubMed.
- P. Arquillière, P. H. Haumesser and C. C. Santini, Microelectron. Eng., 2012, 92, 149–151 CrossRef CAS PubMed; E. T. Silveira, A. P. Umpierre, L. M. Rossi, G. Machado, J. Morais, G. V. Soares, I. J. R. Baumvol, S. R. Teixeira, P. F. P. Fichtner and J. Dupont, Chem. – Eur. J., 2004, 10, 3734–3740 CrossRef PubMed.
- P. Migowski, G. Machado, S. R. Teixeira, M. C. M. Alves, J. Morais, A. Traverse and J. Dupont, Phys. Chem. Chem. Phys., 2007, 9, 4814–4821 RSC.
- E. Redel, M. Walter, R. Thomann, L. Hussein, M. Krüger and C. Janiak, Chem. Commun., 2010, 46, 1159–1161 RSC; E. Redel, M. Walter, R. Thomann, C. Vollmer, L. Hussein, H. Scherer, M. Krüger and C. Janiak, Chem. – Eur. J., 2009, 15, 10047–10059 CrossRef CAS PubMed; E. Redel, R. Thomann and C. Janiak, Inorg. Chem., 2008, 47, 14–16 CrossRef PubMed.
- D. Marquardt, J. Barthel, M. Braun, C. Ganter and C. Janiak, CrystEngComm, 2012, 14, 7607–7615 RSC; G. Salas, A. Podgorsek, P. S. Campbell, C. C. Santini, A. A. H. Pádua, M. F. Costa Gomes, K. Philippot, B. Chaudret and M. Turmine, Phys. Chem. Chem. Phys., 2011, 13, 13527–13536 RSC; T. Gutel, J. Garcia-Antón, K. Pelzer, K. Philippot, C. C. Santini, Y. Chauvin, B. Chaudret and J.-M. Basset, J. Mater. Chem., 2007, 17, 3290–3292 RSC.
- C. Vollmer and C. Janiak, Coord. Chem. Rev., 2011, 255, 2039–2057 CrossRef CAS PubMed; C. Vollmer, M. Schröder, Y. Thomann, R. Thomann and C. Janiak, Appl. Catal., A, 2012, 425–426, 178–183 CrossRef PubMed; D. Marquardt, C. Vollmer, R. Thomann, P. Steurer, R. Mülhaupt, E. Redel and C. Janiak, Carbon, 2011, 49, 1326–1332 CrossRef PubMed; D. Marquardt, Z. Xie, A. Taubert, R. Thomann and C. Janiak, Dalton Trans., 2011, 40, 8290–8293 RSC; C. Vollmer, E. Redel, K. Abu-Shandi, R. Thomann, H. Manyar, C. Hardacre and C. Janiak, Chem. – Eur. J., 2010, 16, 3849–3858 CrossRef PubMed; E. Redel, J. Krämer, R. Thomann and C. Janiak, J. Organomet. Chem., 2009, 694, 1069–1075 CrossRef PubMed; J. Krämer, E. Redel, R. Thomann and C. Janiak, Organometallics, 2008, 27, 1976–1978 CrossRef; E. Redel, R. Thomann and C. Janiak, Chem. Commun., 2008, 1789–1791 RSC.
- J. M. Zhu, Y. H. Shen, A. J. Xie, L. G. Qiu, Q. Zhang and X. Y. Zhang, J. Phys. Chem. C, 2007, 111, 7629–7633 Search PubMed; M. A. Firestone, M. L. Dietz, S. Seifert, S. Trasobares, D. J. Miller and N. J. Zaluzec, Small, 2005, 1, 754–760 CrossRef CAS PubMed.
- F. Endres. D. MacFarlane and A. Abbott, Electrodeposition from Ionic Liquids, Wiley-VCH, Weinheim, 2008 Search PubMed.
- D. Marquardt and C. Janiak, Nachr. Chem., 2013, 61, 754–757 CrossRef.
- G. Schmid, Nanoparticles, Wiley-VCH, Weinheim, 2004, pp. 185–238 CrossRef CAS PubMed; M. Antonietti, D. Kuang, B. Smarly and Y. Zhou, Angew. Chem., Int. Ed., 2004,(43), 4988–4922 CrossRef CAS PubMed; D. Astruc, F. Lu and J. R. Aranzaes, Angew. Chem., Int. Ed., 2005, 44, 7852–7872 CrossRef PubMed; H. Kaper, F. Endres, I. Djerdj, M. Antonietti, B. M. Smarsly, J. Maier and Y.-S. Hu, Small, 2007, 3, 1753–1763 CrossRef PubMed.
- B. Schäffner, F. Schäffner, S. P. Verevkin and A. Börner, Chem. Rev., 2010, 110, 4554–4581 CrossRef PubMed.
- Z. Li, T. Barry and R. G. Gordon, Inorg. Chem., 2005, 44, 1728–1735 CrossRef CAS PubMed.
- J. I. Langford and A. J. C. Wilson, J. Appl. Crystallogr., 1978, 11, 102–113 CrossRef CAS.
- R. Ferrando, J. Jellinek and R. L. Johnston, Chem. Rev., 2008, 108, 846–910 CrossRef PubMed.
- M. Sankar, N. Dimitratros, P. J. Miedziak, P. P. Wells, C. J. Kiely and G. J. Hutchings, Chem. Soc. Rev., 2012, 41, 8099–8139 RSC.
- J. D. Scholten, B. C. Leal and J. Dupont, ACS Catal., 2012, 2, 184–200 CrossRef CAS; M. Zahmakiran and S. Özkar, Nanoscale, 2011, 3, 3462–3481 RSC; V. I. Pârvulescu and C. Hardacre, Chem. Rev., 2007, 107, 2615–2665 CrossRef PubMed.
- S. Vukojević, O. Trapp, J.-D. Grunwaldt, C. Kiener and F. Schüth, Angew. Chem., Int. Ed., 2005, 44, 7978–7981 CrossRef PubMed.
- M. K. Schröter, L. Khodeir, M. W. E. van den Berg, T. Hikov, M. Cokoja, S. J. Miao, W. Grünert, M. Muhler and R. A. Fischer, Chem. Commun., 2006, 2498–2500 RSC.
- A. A. Vostrikov, O. N. Fedyaeva, A. V. Shishkin and M. Ya Sokol, J. Supercrit. Fluids, 2009, 48, 161–166 CrossRef CAS PubMed; A. A. Vostrikov, O. N. Fedyaeva, A. V. Shishkin and M. Ya Sokol, J. Supercrit. Fluids, 2009, 48, 154–160 CrossRef PubMed.
- M. A. Sliem, S. Turner, D. Heeskens, S. B. Kalidindi, G. Van Tendeloo, M. Muhler and R. A. Fischer, Phys. Chem. Chem. Phys., 2012, 14, 8170–8178 RSC.
- C. Battistoni, J. L. Dormann, D. Fiorani, E. Paparazzo and S. Viticoli, Solid State Commun., 1981, 39, 581 CrossRef CAS; X.-L. Shang, B. Zhang, E.-H. Han and W. Ke, Electrochim. Acta, 2012, 65, 294–304 CrossRef PubMed.
- I. Bilecka and M. Niederberger, Nanoscale, 2010, 2, 1358–1374 RSC.
- B. S. Lim, A. Rahtu, J.-S. Park and R. G. Gordon, Inorg. Chem., 2003, 42, 7951–7958 CrossRef CAS PubMed.
- S. Schmidt, S. Schulz, D. Blaeser, R. Boese and M. Bolte, Organometallics, 2010, 29, 6097–6103 CrossRef CAS.
- K. J. Klabunde and G. Cárdenas-Trivino, in Active Metals: Preparation, Characterization, Applications, ed. A. Fürstner, VCH, Weinheim, 1996, pp. 247, 263, 264 Search PubMed.
- G. Cárdenas, S. Salinas and R. Oliva, Colloid Polym. Sci., 2003, 282, 41–47 Search PubMed; G. Cárdenas, R. Segura, J. Morales, H. Soto and C. A. Lima, Mater. Res. Bull., 2000, 35, 1251–1259 CrossRef CAS; K. Cheng, Q. Chen, Z. Wu, M. Wang and H. Wang, CrystEngComm, 2011, 13, 5394–5400 RSC.
Footnote |
| † Electronic supplementary information (ESI) available: Cu/Zn phase diagram, NMR spectra, and additional TEM and EDX spectra for NP/IL and PC dispersions. See DOI: 10.1039/c3nr05780a |
| This journal is © The Royal Society of Chemistry 2014 |

