A positron annihilation spectroscopic investigation of europium-doped cerium oxide nanoparticles†
Atul V.
Thorat
ab,
Tandra
Ghoshal
ab,
Justin D.
Holmes
ab,
P. M. G.
Nambissan
c and
Michael A.
Morris
*ab
aMaterials research group, Department of Chemistry, and Tyndall National Institute, University College Cork, Cork, Ireland. E-mail: m.morris@ucc.ie; Fax: +353 21 427 4097; Tel: + 353 21 490 2180
bCRANN, Trinity College Dublin, Dublin, Ireland
cApplied Nuclear Physics Division, Saha Institute of Nuclear Physics, 1/AF Bidhannagar, Kolkata 700064, India
First published on 28th October 2013
Abstract
Doping in ceria (CeO2) nanoparticles with europium (Eu) of varying concentrations (0, 0.1, 0.5, …, 50 atom%) is studied using complementary experimental techniques and novel observations were made during the investigation. The immediate observable effect was a distinct reduction in particle sizes with increasing Eu concentration attributed to the relaxation of strain introduced due to the replacement of Ce4+ ions by Eu3+ ions of larger radius. However, this general trend was reversed in the doping concentration range of 0.1–1 atom% due to the reduction of Ce4+ to Ce3+ and the formation of anion vacancies. Quantum confinement effects became evident with the increase of band gap energy when the particle sizes reduced below 7–8 nm. Positron annihilation studies indicated the presence of vacancy type defects in the form of vacancy clusters within the nanoparticles. Some positron annihilation was also seen on the surface of crystallites as a result of diffusion of thermalized positrons before annihilation. Coincidence Doppler broadening measurements indicated the annihilation of positrons with electrons of different species of atoms and the characteristic S–W plot showed a kink-like feature at the particle sizes where quantum confinement effects began.
1. Introduction
Ceria is an oxide with a wide range of uses including polishing materials, catalysis, fuel cells, advanced ceramics and sensors amongst others.1–4 Many of its applications rely on the ability of ceria to transport and act as a labile source of oxygen.5,6 To this effect, it is often ‘doped’ with lower valence ions particularly trivalent lanthanide cations.7–9 These ions are introduced into the lattice to substitute Ce4+ ions and it is generally believed that anion vacancies are created as a means of charge compensation10 although other defect mechanisms have been proposed by Yeriskin et al.11 The study of the defect chemistry of cerium oxide nanoparticles doped with europium (Eu) ions has become of significant interest because of the modification of the optical and luminescent properties of the material on doping.12 Numerous studies have recently appeared in the literature emphasizing the roles of vacancy type defects and their evolution during the changes in crystallite sizes13 and doping concentrations.14 However, a comprehensive study of the defect structure and dynamics has yet to be carried out for this system. In this work, we will address this issue with a systematic study of the defects generated by europium doping. We shall also study the interaction of the defects with the dopant ions when Eu is doped in discrete and varying concentrations. Positron annihilation spectroscopy is used as an effective method to study the defects and their evolution on doping. This is thought to be extremely pertinent since, discussed by us earlier, techniques such as X-ray photoelectron spectroscopy (XPS) and X-ray diffraction (XRD) have limitations in the study of these systems because of complex spectral peak shapes and the sensitivity of ceria to X-ray irradiation.12 Positron annihilation is a technique that can be used to study defects in material systems very reliably and it can be sensitive to even very low defect concentrations.15,162. Experimental
2.1 Positron annihilation studies
Positron annihilation experiments were performed by placing a sufficient amount of sample in a glass tube of approximately 10 mm diameter so as to embed a positron emitting 22Na radioactive isotope at its geometric centre. The source, about 400 kBq in strength, was made in the form of a small deposition of 22NaHCO3 on part of a thin (∼2 mg cm−2) Ni foil with the remaining foil used to cover and protect the source. The glass tube containing the source-sample assembly was continuously evacuated to maintain a clean and dry atmosphere in it. The gamma rays resulting from positron emission and subsequent annihilation were recorded using nuclear radiation detectors and the signals were processed using the associated electronics. Two types of experiments were carried out, the first of which recorded the positron lifetime spectrum using a gamma–gamma slow-fast coincidence spectrometer and the other recorded the Doppler broadening of the positron annihilation gamma ray spectrum in coincidence mode using two high pure germanium (HPGe) detectors.17 In the former, about 1–1.5 million counts were collected in each spectrum and the spectra were analyzed using the program PALSfit.18 In the coincidence Doppler broadening spectra (CDBS), about 8 million events were generated from the counts accumulated. Briefly, gamma ray events at energies E1 and E2 were recorded from two high-sensitive HPGe detectors and a two-parameter spectrum was generated from their time corrections with E1 + E2 and E1 − E2 as two coplanar axes and counts distributed accordingly.19,20 The projected one-dimensional spectrum parallel to the energy-difference axis within the energy-sum segment (1022 − 2.4) keV < E1 + E2 < (1022 + 2.4) keV of each sample is then divided by an area-normalized identical spectrum obtained for a pair of pure (99.999%) Al single crystalline samples prior annealed at 625 °C for 2 h in vacuum (p < 10−5 mbar).2.2 Characterization
Powder X-ray diffraction (XRD) patterns were recorded on a PANalytical MPD instrument using an Xcelerator detector and a Cu Kα radiation source at a working power of 45 kV and 40 mA. For optical absorption measurements, the powder samples were dispersed in spectroscopic grade ethanol using an ultrasonicator and the absorption spectra were recorded with a spectro-photometer (Cary 50). Total reflectance X-ray fluorescence spectroscopy (TXRF) was performed to obtain the actual Ce:Eu concentration of the samples using a Bruker S2 Picofox instrument.3. Results and discussion
A set of undoped and europium doped cerium oxide nanoparticles were synthesized by a simple one step solvothermal process (see ESI†). The doping concentrations were varied from 0.1 atom% to 50 atom% which subsequently represented as CEX, where X = 0, 0.1, 0.5, 1, 5, 10, 20, 30, 40, and 50 atom%. Several complementary experiments had been performed to characterize the samples and estimate the particle sizes, lattice parameters, optical band gaps, luminosity of the emission, etc. These are summarized below.Some of the illustrative XRD patterns are shown in Fig. 1. The well-defined peaks corresponding to reflections of the expected fluorite phase are described in the figure. The peak widths indicate that the samples are nanocrystalline in nature. The crystallite sizes (dc) were estimated using Scherrer formulism.21Fig. 2 shows an expected decrease of crystallite size with increasing concentration of Eu3+, although it increases during the change of concentration from 0.1 to 1%. The decrease in crystallite size suggests that the dopant introduces significant lattice strain (the ionic radius of Eu3+ (1.07 Å) is about 10% larger than that of Ce4+ (0.97 Å)) and this reduces ion transport and sintering as noted previously for doped CeO2.22 The increase in crystallite size seen between 0.1 and 1% doping concentrations may be explained by the creation of charge compensating anion vacancies which will tend to increase oxygen ion mobility favoring sintering.
 | ||
| Fig. 1 Typical X-ray diffraction patterns of the undoped and some of the Eu-doped cerium oxide nanocrystalline samples. | ||
 | ||
| Fig. 2 The average particle sizes in the undoped (shown against a concentration of 0.01 subsequently) and the Eu-doped CeO2 samples. | ||
We have also verified from total reflectance X-ray fluorescence (TXRF) data that the actual concentration of Eu in the sample is significantly less than that might be expected from concentrations in the mother liquor. Similar effects have been previously reported by us and are ascribed to limited solubility of the trivalent oxides in strongly basic conditions.23Fig. 3 illustrates the actual amount of Eu incorporated into the solid against the dopant concentration in solution. As the solution concentration of Eu increases, the effectiveness of incorporation decreases. At the highest dopant concentrations, quite large increases in solution concentration have little effect on the solid concentration. As well as complex solution effects, the data might also suggest high surface concentrations since the TXRF technique is not surface sensitive.
 | ||
| Fig. 3 The percentage (relative to the target concentration) of Eu incorporated in CeO2 at different solution concentrations of Eu determined by total reflectance X-ray fluorescence studies. | ||
The lattice parameter α of different samples, undoped and doped, was estimated as
 | (1) |
![[thin space (1/6-em)]](https://www.rsc.org/images/entities/char_2009.gif) sinθ = nλ. Fig. 4 shows unexpected trends of the lattice parameter with the dopant concentration. The lattice parameter of the samples with higher concentrations of doped Eu is obviously larger than the ones with lower Eu concentration. However in the region [Eu] = 0.1 to 1% where an increase in particle size had been earlier observed (Fig. 2), there is a complex dependence of the lattice parameter and dimensions.
sinθ = nλ. Fig. 4 shows unexpected trends of the lattice parameter with the dopant concentration. The lattice parameter of the samples with higher concentrations of doped Eu is obviously larger than the ones with lower Eu concentration. However in the region [Eu] = 0.1 to 1% where an increase in particle size had been earlier observed (Fig. 2), there is a complex dependence of the lattice parameter and dimensions.
 | ||
| Fig. 4 The lattice parameters (α) of the undoped and Eu-doped CeO2 samples. | ||
Fig. 5(a) presents a semi-log plot of the two quantities showing that the lattice parameter steadily increases with decrease in nanoparticle sizes. A relationship can be obtained between the change in lattice parameter Δα with respect to the lattice parameter of bulk CeO2 (5.410 Å) and the particle size dc in a log–log plot (Fig. 5(b)) as
| log(Δα) = −1.7437log(dc) − 0.4947 | (2a) |
| Δα = 0.32dc−1.7437 | (2b) |
 | ||
| Fig. 5 (a) A plot of the lattice parameter (α) versus size of the nanoparticles in the undoped and the Eu-doped CeO2 samples. (b) The change in lattice parameter (Δα) versus size of the nanoparticles in the undoped and the Eu-doped CeO2 samples. | ||
The relation is however markedly different from a similar relation obtained earlier by Deshpande et al.24 The differences could be attributed to the cause of lattice parameter variation, i.e., doping by Eu in the present case versus crystallites of different sizes of undoped CeO2 in the said work.
The optical properties of CeO2 also showed an unusual variation in the band gap energy (Eg) with Eu doping and, consequently, the crystallite size. Typical data are given in Fig. 6 as optical absorption spectra. Eg can be calculated using
| αhν = A(hν − Eg)n | (3) |
 | (4) |
 | ||
| Fig. 6 Optical absorption spectra of the undoped and a few of the Eu-doped CeO2 samples. | ||
 | ||
| Fig. 7 (a) The calculated band gap energies of the undoped and Eu-doped CeO2 samples. (b) The same versus size of the nanoparticles in the undoped and the Eu-doped CeO2 samples. | ||
The above data clearly detail the response of the host ceria fluorite lattice to Eu ion inclusion. However, the defect mechanism associated with this process has not been discussed. It is clear that the number of vacancies will increase with Eu doping to charge compensate the 3+ states substituting for 4+ lattice cations. Less clear is an understanding of Ce3+-vacancy combinations that might be formed as a result of lattice and other energy changes resulting from Eu inclusion. Positron annihilation studies might prove useful as defect sites can act as positron trapping sites and authors such as Liu et al. have demonstrated the usefulness of this spectroscopic method.31 The results of the present investigation are shown in Fig. 8(a)–(e). These results show distinct differences from those of Liu et al. on pristine ceria materials. As in earlier work, three different components of the positron lifetime were observed in all the samples. The lifetimes are labelled as τ1, τ2 and τ3 in increasing order of their magnitudes and their relative intensities are named I1, I2 and I3, respectively. As can be seen in the data, the variation of each lifetime component with Eu concentration is similar suggesting some interactions between the states.
 | ||
| Fig. 8 The positron lifetimes (a) τ1, (b) τ2 and (c) τ3 and intensities (d) I2 and (e) I3versus the concentrations of Eu doping in the CeO2 nanocrystalline samples. The values shown against 0.01 stand for the undoped sample. | ||
The longest component, τ3, can be assigned to the formation of orthopositronium atoms in the free volume separating the nanoparticles since positrons in such extended defects will have very long lifetimes due to the temporary bound states formed. Although the intensities (I3) are very small, they were needed to be included in the data analysis to adequately fit the data and since they follow the same pattern of variation as the other positron lifetime parameters, their presence cannot be ignored.
The intermediate positron lifetime τ2 is not typical of other single lifetime features seen in bulk materials and it is suggested that this lifetime is assignable to Ce3+-vacancy combination sites within the nanocrystallites. The values of τ2 (>400 ps) would suggest the presence of large size voids or vacancy clusters, but this is inconsistent with the structure of dense nanocrystallites as described above. Since the sizes of the nanocrystallites formed here are below the thermal diffusion lengths of positrons in typical metallic oxides (∼50–100 nm), it could be suggested that τ2 is the lifetime based around the contribution from surface positron annihilation and a defect specific lifetime. However, since the variation of τ2 is quite similar to that of the other parameters, τ1 and τ3, changes taking place in the crystal structure may also have important bearing on its values and variation.
Notably, significant difference between the shortest positron lifetime τ1 and those previously reported can be seen.31 Liu et al. had attributed τ1 ∼ 236–247 ps to neutral Ce3+-oxygen vacancy associates. Here in this work, the magnitudes of τ1 are smaller (τ1 ∼ 172–179 ps) and their variations are also relatively less. They are also significantly less than those reported in other studies that have assigned the same lattice defect where values of τ1 ∼ 262 ps32 and τ1 ∼ 187.9–211.1 ps33 have been reported. Although the mean positron lifetime (defined later) may differ by small amounts due to differing sample conditions, the differences between this work and the previous ones would suggest that τ1 contribution is not due to those types of defects and instead we suggest that the shortest lifetime τ1 is related to free positrons, i.e., those which do not get trapped by the vacancy defects within the nanoparticles. Note that these are not typical of bulk lifetimes (τb) since the crystallites are so small that free positrons can diffuse to the surface where they are annihilated. Further τ1 shows a small qualitative variation (Fig. 8(a)) similar to that of τ2 and it is posited that a minor contribution to τ1 may arise from the Bloch-state residence time of trapped positrons, in accordance with the positron trapping model.
According to the two-state positron trapping model,34i.e., a situation where there is only one dominant type of positron trapping site (i.e. a Ce3+-oxygen vacancy associates), the positron trapping rate κ for the ‘bulk-like state’ is given by the relationship
 | (5) |
 | (6) |
For all concentrations of Eu, the data suggest that κexp > κ. As suggested above, the defect related lifetime τ2 is larger (394–423 ps) than that expected for a cerium-anion vacancy combination (i.e. not all positrons with lifetime τ2 and intensity I2 are providing Bloch-state residence time) and it can be suggested that the majority of positrons are being annihilated at the nanoparticle surfaces. Note that κexp can be reduced to κ either by assuming smaller values of τ2 or alternatively decreasing I2 by a factor κ/κexp. The first option is unlikely since τ2 is determined by the concentration of positron trapping vacancy clusters and this is unlikely to be significant in these small particles. It is more reasonable to assume that a fraction (κ/κexp)I2 of positrons is annihilated in vacancy clusters within the nanoparticles and reduce τb to τ1 by admixing the Bloch-state residence time with it.
The experimentally measured τ2 can be expressed as a linear combination of positron lifetime at the defect vacancy (τvacancy) and the positron lifetime at surface (τsurface) as
 | (7) |
The results of this analysis are summarized in Fig. 9(a) and (b). The magnitudes of the defect related lifetime show two distinct ranges. In the range from [Eu] = 0 to 1%, τvacancy is approximately constant within 277–293 ps and its values are typical of the positron lifetime in Ce3+-oxygen vacancy associates and monovacancies as reported by others.31–33 Beyond this concentration, it increases monotonously to values 325–330 ps. Significantly, these observations are consistent with the reports available in the literature.31–33 It is also noteworthy that τvacancy does not exhibit any explicit dependence on the particle size (Fig. 9(b)). For example, the positron lifetime fell considerably from 302 ps to 273 ps when the particle size varied rather little (4.8 to 4.86 nm only) although this change was caused by an increase in the dopant Eu concentration from 5 to 30%. On the other hand, during the increase of particle size from 4.86 to 7.75 nm, the positron lifetime changed by about 20 ps only and even the final decrease by about 16 ps took place when the particle size varied only from 7.75 to 8.77 nm. This means that the change in positron lifetimes, which signifies a change in the defect characteristics (i.e., size or environment), is dependent on the dopant concentration and is less sensitive to the sizes of the nanoparticles. This observation is in sharp contrast to the results illustrated in Fig. 7(a) and (b) in which the quantum confinement was shown essentially as a finite size effect and less dependent on the dopant concentration.
 | ||
| Fig. 9 (a) The derived positron lifetime in vacancy-type defects τvacancy of the undoped (shown against a concentration 0.01) and the Eu-doped CeO2 samples. (b) The same versus size of the nanoparticles in the undoped and the Eu-doped CeO2 samples. | ||
The variation of the positron lifetimes and their intensities with Eu doping and also with the sizes of the nanoparticles can give further information on the evolution of defects and their interaction with the doped ions. The value of τvacancy = 277 ps in the undoped sample is larger than the lifetime τ0 = 187 ps of positrons annihilating in bulk crystals of CeO2 by about just 90 ps, which is the typical enhancement in positron lifetime due to trapping in monovacancies. Hence, the positron trapping defects in the undoped sample can be reasonably understood to be of the monovacancy-type within the lattice (i.e., an isolated small polaron state associated with anion vacancy production). The polaron states are generally very strong trapping centers for positrons and should therefore have short lifetimes. On addition of Eu, the additional anion vacancies may allow delocalization of the electrons and, hence, increase of the positron lifetimes. At high Eu concentrations, it seems likely that defect clusters are produced and this results in significant increase in the lifetimes. Although there are no reported values of positron lifetimes in vacancy clusters of CeO2, a similar enhancement in other materials suggests that the value τ2 = 325–330 ps when compared to τ2 = 187 ps corresponds to vacancy cluster defects consisting of about 4–5 monovacancies. At lower concentrations of doping, since Ce ions were in the 4+ state, the replacement by Eu3+ ions creates charge imbalance and formation of an oxygen vacancy which is positively charged. In the region of concentration [Eu] = 0.1 to 1%, it would appear that these anion vacancies are associated with Ce4+ ions (effectively reduction to Ce3+) and Ce3+-vacancy clusters or associates are formed. With further increase in the doping concentration, these isolated small associates will agglomerate to form the larger vacancy clusters that results in the very sharp rise of τ2 to 325–330 ps, as shown here. It might be conjectured that these larger associates are similar in structure to local regions of the M2O3 structure consisting of Ce3+ and Eu3+ metal ions.
As already pointed out, the region of doping [Eu] = 0.1 to 1% is of particular interest since it is associated with an intermittent increase of particle sizes (Fig. 2) and lattice contraction (Fig. 4). The calculated vacancy-sensitive lifetime τvacancy showed little change in this region (Fig. 9(a)) whereas the measured positron lifetimes τ1, τ2 and τ3 fall in this region and the intensities I2 and I3 increase. It is, therefore, tempting to assign changes in the measured lifetimes as being due to changing surface effects which appear to cause the apparent high value of τ2. It is suggested that the first decrease in lifetime seen at low [Eu] = 0.1% concentration is associated with the lattice contraction mentioned above. There is then an increase in τ2 which is probably associated with the increased values of τvacancy. This could also be supported by the nanocrystallite size reduction which allows more rapid movement of positrons to the nanocrystallite surface. The initial decrease of the intensities I2 and I3 stems from the lattice expansion effects where the decreasing electron density will reduce the probability of annihilation. Conversely, when the lattice contracts, the intensities would increase. This appears to be true as seen in Fig. 8(d) and (e). Furthermore, when the crystallite sizes decrease, it would enhance the number of positrons diffusing to the surfaces and the widening of the intercrystallite region would cause more orthopositronium atoms to form and then undergo pick-off annihilation with the typical lifetimes as shown in Fig. 8(c).
CDBS experiments can provide clarity on changes to the electron momentum distribution in the samples and how positrons develop affinity to these changes. After recording the gamma ray events E1 and E2 from the two high sensitive HPGe detectors and noting their time correlations, a two-parameter spectra is generated with E1 + E2 and E1 − E2 in the two coplanar axes and counts distributed accordingly.23,24 The projected one-dimensional spectrum parallel to the energy-difference axis within the energy-sum segment (1022 − 2.4) keV < (E1 + E2) < (1022 + 2.4) keV of each sample is then divided by an area-normalized identical spectrum obtained for a pair of pure (99.999%) Al single crystalline samples prior annealed at 625 °C for 2 h in vacuum (p < 10−5 mbar). The quotient spectra generated for all the samples are shown in Fig. 10. The individual features represent positron annihilation events (via interaction with the core electrons of oxygen ions surrounding the cationic vacancies and their clusters) within the samples. The series of the peaks at different momentum appear at pL (10−3m0c) = 9.4, 23.5, 32.1, 39.2 and 43.1. The features at different positions probably reflect different local structural arrangements of vacancies and the cations ranging from simple, isolated point defects to complex 3D structural arrangements within clusters of defects. Similar features and positions are seen in all samples, but the relative amplitudes of each feature change from sample to sample.
 | ||
| Fig. 10 The ratio curves or quotient spectra of the different samples with respect to the spectrum of reference Al. | ||
The above argument is based on the elemental or ionic sites that are probable in the crystal structure of the Eu-doped CeO2 or Ce2O3. While the peaks appear at the same values of pL in all the samples, there are differences in the amplitudes of the peaks for the different samples. The variations in these amplitudes are illustrated in Fig. 11 and these can be used to further understand the defect mechanism outlined above. In the initial stage of doping, i.e., from the undoped to the 0.1%-doped sample, the amplitudes increase indicating increased annihilation of positrons. We suggest that this is due to the decreasing particle size at this stage which increases positron annihilation at surface states. The succeeding doping interval 0.1 to 1% is the region where the particle size has increased again (Fig. 2). The opposite effect is, therefore, reflected in the amplitudes. Between 1% and 20% Eu loading, there is a general increase in amplitude for the low momentum states indicating increased anion vacancy addition. This increase (to around 10% loading) is seen only at low momentum whereas at high momentum, continued decreases are seen. This may be because these states are more sensitive to clusters of defects which are only present at higher dopant levels and we suggest that high momentum features are due to anion defect clusters and the low momentum states are due to isolated defect states.
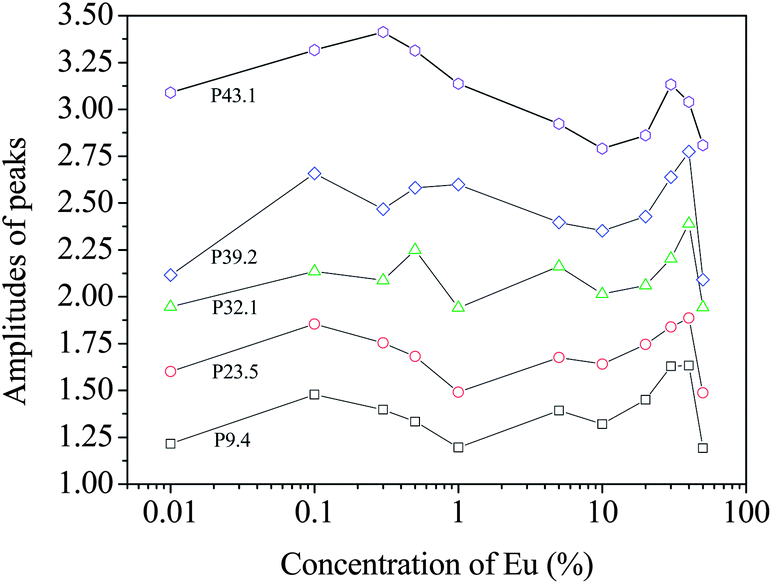 | ||
| Fig. 11 The variation of the amplitudes of the different peaks in the CDB spectra of the samples. For the sake of clarity, the amplitudes have been vertically shifted by 0.5 (P23.5), 0.75 (P32.1), 1.0 (P39.2) and 1.25 (P43.1). | ||
Between 20% and 40% loading levels, there is a decrease in positron annihilation for all features. It is posited that this decrease is due to the change in stoichiometry of the oxide which is tending towards M2O3 rather than MO2−x at these loadings and the structure becomes progressively less defective. However, this region is also characterized by the partial reduction of CeO2 to Ce2O3 by the formation of oxygen vacancy and hence the decrease is partly arrested in the case of the peaks at high momentum values (i.e., 32.1, 39.2 and 43.1). In the region from 1% to 40% of Eu doping, the particle sizes reduce again and the lattice expands due to further reduction of Ce4+ to Ce3+. While Ce4+ has eight coordinated O2− ions, it decreases to seven when reduced to Ce3+ and hence oxygen vacancies further enrich the lattice. Since oxygen vacancies are positively charged, positron trapping is reduced at this stage.
The drastic fall in amplitude of the peak at pL (10−3m0c) = 43.1 testifies to this argument. A rather unusual trend is seen at [Eu] = 50% where all the amplitudes fall down and this may be an indication of segregation of unincorporated Eu3+ ions and additional doping may result in the development of new phases, as seen in a similar case earlier.35
The S–W plot also indicated the quantum confinement effect through a peak-like kink in the curve, indicating the sensitivity of positron annihilation as a technique and the various parameters derived from its data for better understanding of the defect-related aspects in nanocrystalline systems (see ESI†).
The S parameter values when plotted against the corresponding W in the ascending order of the latter throws another interesting observation of a distinct kink-like variation in it, as shown in Fig. 12. Incidentally this happens for the same region of variation of the crystallite size where the indication of quantum confinement effects had been observed from optical absorption measurements (Fig. 7(b)). More systematic studies on samples with well-controlled particle sizes are required to comment further on the exact relationship between the fraction of low momentum electrons annihilated by positrons and the changing band gap in the crystallites.
 | ||
| Fig. 12 The S parameter versus W in ascending order of magnitude depicting the peak-like variation around the crystallite sizes where quantum confinement effects are prominent. The inset shows the full figure. The region around the peak is expanded in the main figure for clarity. | ||
4. Summary and conclusions
The results of a detailed investigation carried out using several complementary experimental techniques on CeO2 nanocrystalline samples doped with varying concentrations of Eu are presented in this paper. A notable observation is the decreasing particle size with increase in the concentration of doping but the trend is interrupted in medium concentrations of doping due to the reduction of Ce4+ to Ce3+ when an increasing concentration of oxygen vacancies resulted in an increase in particle size. The change in lattice parameter had the opposite trend and a linear relationship was obtained between this and the particle size. Optical absorption measurements showed a decrease in band gap energy with increasing doping. However, quantum confinement effects being size related manifested in particles of dimensions exactly below the exciton Bohr radius, giving a characteristic blue shift in the optical absorption spectra. The vacancy type defects were investigated through positron lifetime and CDBS measurements. The intermediate particle size enhancement came as a result of the generation of additional oxygen vacancies in the samples and is indicated by a distinct change in the intensity of positrons trapped in the defects. The positron lifetime within the vacancies was delineated from that due to annihilation at the crystallite surfaces and it was found to enhance due to vacancy agglomeration at higher concentrations of doping. The CDBS measurements demonstrated annihilation taking place with the electrons of ions of different charges and momentum distributions and the variation of the lineshape parameters derived from it further supported the findings from positron lifetime measurements.Acknowledgements
The authors would like to thank Science Foundation Ireland for support of this project through the Strategic Research Cluster FORME grant, 09/SIRG/I1621 grant and the CSET CRANN grant. The contribution of the Foundation's Principal Investigator support is also acknowledged. One of the authors (PMGN) wishes to thank Mr Kumar Das, Mr Sudip Mukherjee and Mr Suvankar Chakravarty for their help and cooperation during the experiments.References
- H. Treichel, R. Frausto, S. Srivatsan, B. Whithers, T. Meyer and R. Morishige, J. Vac. Sci. Technol., A, 1999, 17, 1160–1167 CAS.
- P. Bera, A. Gayen, M. S. Hegde, N. P. Lalla, L. Spadaro, F. Frusteri and F. Arena, J. Phys. Chem. B, 2003, 107, 6122–6130 CrossRef CAS.
- M. Mogensen, N. M. Sammes and G. A. Tompsett, Solid State Ionics, 2000, 129, 63–94 CrossRef CAS.
- R. Bene, I. V. Perczel, F. Réti, F. A. Meyer, M. Fleisher and H. Meixner, Sens. Actuators, B, 2000, 71, 36–41 CrossRef CAS.
- B. Murugan and A. V. Ramaswamy, J. Am. Chem. Soc., 2007, 129, 3062 CrossRef CAS PubMed.
- P. Dutta, S. Pal, M. S. Seehra, Y. Shi, E. M. Eyring and R. D. Ernst, Chem. Mater., 2006, 18, 5144–5146 CrossRef CAS.
- X. Wang, J. C. Hanson, G. Liu, J. A. Rodriguez, A. Iglesias-Juez and M. Fernandez-Garcia, J. Chem. Phys., 2004, 121, 5434–5444 CrossRef CAS PubMed.
- D. A. Andersson, S. I. Simak, N. V. Skorodumova, I. A. Abrikosov and B. Johansson, Proc. Natl. Acad. Sci. U. S. A., 2006, 103, 3518–3521 CrossRef CAS PubMed.
- H. Borchert, Y. V. Frolova, V. V. Kaichev, I. P. Prosvirin, G. M. Alikina, A. I. Lukashevich, V. I. Zaikovskii, E. M. Moroz, S. N. Trukhan, V. P. Ivanov, E. A. Paukshtis, V. I. Bukhtiyarov and V. A. Sadykov, J. Phys. Chem. B, 2005, 109, 5728–5738 CrossRef CAS PubMed.
- T. H. Etsell and S. N. Flengas, Chem. Rev., 1970, 70, 339–376 CrossRef CAS.
- I. Yeriskin and M. Nolan, J. Phys.: Condens. Matter, 2010, 22, 135004 CrossRef PubMed.
- L. Chen, P. Fleming, V. Morris, J. D. Holmes and M. A. Morris, J. Phys. Chem. C, 2010, 114, 12909–12919 CAS.
- S. Tsunekawa, J. T. Wang and Y. Kawazoe, J. Alloys Compd., 2006, 408–412, 1145–1148 CrossRef CAS PubMed.
- A. Kumar, S. Babu, A. S. Karakoti, A. Schulte and S. Seal, Langmuir, 2009, 25, 10998–11007 CrossRef CAS PubMed.
- P. M. G. Nambissan, Defect characterization in nanomaterials through positron annihilation spectroscopy, Studium Press LLC, Houston, USA, 2013 Search PubMed.
- P. M. G. Nambissan, J. Phys.: Conf. Ser., 2013, 443, 012040 CrossRef.
- R. W. Siegel, Annu. Rev. Mater. Sci., 1980, 10, 393–425 CrossRef CAS.
- J. V. Olsen, P. Kirkegaard, N. J. Pedersen and M. Eldrup, Phys. Status Solidi C, 2007, 4, 4004–4006 CrossRef CAS.
- P. AsokaKumar, M. Alatalo, V. J. Ghosh, A. C. Kruseman, B. Nielsen and K. G. Lynn, Phys. Rev. Lett., 1996, 77, 2097–2100 CrossRef CAS.
- S. Szpala, P. Asoka-Kumar, B. Nielsen, J. P. Peng, S. Hayakawa, K. G. Lynn and H. J. Gossmann, Phys. Rev. B: Condens. Matter Mater. Phys., 1996, 54, 4722–4731 CrossRef CAS.
- A. L. Patterson, Phys. Rev., 1939, 56, 978–982 CrossRef CAS.
- K. M. Ryan, J. P. McGrath, R. A. Farrell, W. M. O'Neill, C. J. Barnes and M. A. Morris, J. Phys.: Condens. Matter, 2003, 15, L49–L58 CrossRef CAS.
- V. Morris, P. Fleming, M. Conroy, J. D. Holmes and M. A. Morris, Chem. Phys. Lett., 2012, 536, 109–112 CrossRef CAS PubMed.
- S. Deshpande, S. Patil, S. V. N. T. Kuchibhatla and S. Seal, Appl. Phys. Lett., 2005, 87, 133113 CrossRef.
- S. Tsunekawa, T. Fukuda and A. Kasuya, J. Appl. Phys., 2000, 87, 1318–1321 CrossRef CAS.
- J. Tauc, R. Grigorovici and A. Vancu, Phys. Status Solidi B, 1966, 15, 627–637 CrossRef CAS.
- L. E. Brus, J. Chem. Phys., 1983, 79, 5566–5571 CrossRef CAS.
- G.-R. Li, D.-L. Qu, L. Arurault and Y.-X. Tong, J. Phys. Chem. C, 2009, 113, 1235–1241 CAS.
- S. Kar, S. Biswas, S. Chaudhuri and P. M. G. Nambissan, Phys. Rev. B: Condens. Matter Mater. Phys., 2005, 72, 075338 CrossRef.
- Y. Zhang, T. Cheng, Q. Hu, Z. Fang and K. Han, J. Mater. Res., 2007, 22, 1472–1478 CrossRef CAS.
- X. Liu, K. Zhou, L. Wang, B. Wang and Y. Li, J. Am. Chem. Soc., 2009, 131, 3140–3141 CrossRef CAS PubMed.
- S. Chang, M. Li, Q. Hua, L. Zhang, Y. Ma, B. Ye and W. Huang, J. Catal., 2012, 293, 195–204 CrossRef CAS PubMed.
- W. Shi, Y. Li, J. Hou, H. Lv, X. Zhao, P. Fang, F. Zheng and S. Wang, J. Mater. Chem. A, 2013, 1, 728–734 CAS.
- P. Hautojärvi and C. Corbel, Positron Spectroscopy of Solids, in Proceedings of the International School of Physics “Enrico Fermi”, 1993, vol. 125, pp. 491–532 Search PubMed.
- B. Roy, B. Karmakar, P. M. G. Nambissan and M. Pal, NANO, 2011, 06, 173–183 CrossRef CAS.
Footnote |
| † Electronic supplementary information (ESI) available. See DOI: 10.1039/c3nr03936f |
| This journal is © The Royal Society of Chemistry 2014 |