 Open Access Article
 This Open Access Article is licensed under a
 Creative Commons Attribution 3.0 Unported Licence
The role of electrostatic induction in secondary isotope effects on acidity: theory and computational confirmation†
E. Amitai
Halevi
Schulich Faculty of Chemistry, Technion–Israel Institute of Technology, Haifa, IL 3200000, Israel. E-mail: chr04ha@tx.technion.ac.il
First published on 29th May 2014
Abstract
The role of electrostatic induction in secondary isotope effects (SIEs) on acidity is reconsidered. A first order perturbation treatment demonstrates that an electric charge acting on a C–H bond vibrating in its anharmonic potential induces a mass-dependent change in its harmonic force constant and – accordingly – an isotope-dependent shift of its zero-point vibrational energy (ZPVE). Its sense and magnitude are determined by the bond-dipole derivative, dμ/dr. The SIE on the dissociation equilibrium of formic acid was evaluated by gas-phase computations (MP2/311G**) on formic acid and the formate ion, bare and variously hydrated. The CH-stretching frequencies, as well as the IEs on the ZPVE and free energy of ionization (ΔG0298), are in linear correlation with Δμ/Δre, the ratio of the change in the C–H bond moment upon protonation to the corresponding equilibrium bond length difference, suggesting that Δμ/Δre is an adequate linear approximation to dμ/dr and confirming the electrostatic origin of the isotope effect. Similar computations on the dissociation of acetic acid and methylammonium ions yield analogous results. In both cases, the mean equilibrium length of the methyl CH bonds, rm, depends strongly on μg, the CH3 group dipole moment and, when allowance is made for steric effects, the IEs on ZPVE and ΔG0298 are in linear correlation with μg. In each of the three equilibria, the isotopic ΔpKa value computed for the polyhydrated acid and conjugate base is smaller – in the case of the carboxylic acids much smaller – than that computed with the bare species, reproducing the published experimental values in aqueous solution to within a factor of two.
1. Introduction
The inductive effect is defined in the IUPAC Gold Book as “an experimentally observable effect … of the transmission of charge through a chain of atoms by electrostatic induction”. The initial observation that substitution of hydrogen by deuterium in the alkyl group of a carboxylic acid reduces its acidity and that a similar substitution in an alkylamine increases its basicity was attributed to electrostatic induction, in analogy to the very much larger inductive effects of chemically distinct substituent atoms and groups.1–3 Accordingly, it was concluded that deuterium bound to a carbon atom is effectively more electropositive than protium. The reduced acidity of deuterioformic acid relative to normal formic acid could be attributed to differential polarization of deuterium relative to protium by the negatively charged carboxylate ion, and the reduced acidity of methyl-deuterated acetic acid to transmission of the induced negative charge to the methyl H/D atoms via the C-atom as the one-link “chain”.Analogous secondary deuterium isotope effects (SIEs) had already been observed on the rates of solvolysis and ascribed to less effective hyperconjugative electron release from deuterium than from protium.4,5 These SIEs, as well as others that showed up soon thereafter in a variety of reactions, were discussed in similar terms: inductive, hyperconjugative, steric and hybridization-dependent, and were reviewed by this author half a century ago.6 While it is universally recognized that isotope effects are vibrational in origin, the practice of discussing secondary deuterium isotope effects in terms that characterize genuine electronic, stereoelectronic and steric substituent effects persists in the current physical organic and biochemical literature.7
Charles Perrin and his co-workers carried out an extensive re-investigation of the secondary deuterium isotope effects on the acidity of carboxylic acids,8 and the basicity of amines.9,10 While the authors' experimental data are unexceptionable, Perrin and Flach's conclusion that “[there is] no contribution of an inductive effect to secondary deuterium isotope effects on acidity”,11 which was emphasized in Perrin's review of the field12 and is already being cited in textbooks as an established fact,13 bears scrutiny.
The theoretical justification for assigning a dominant role to electrostatic induction in SIEs on acidity is outlined in the following section; the mathematical proof is relegated to the Appendix (Section 5). In the subsequent sections the results of computations on the secondary deuterium isotope effects on three prototypical acid–base equilibria:
HCO2H ![[left over right harpoons]](https://www.rsc.org/images/entities/char_21cb.gif) HCO2− + H+ HCO2− + H+ | (1) |
| CH3CO2H CH3CO2− + H+ | (2) |
| CH3NH2 + H+ CH3NH3+ | (3) |
2. Theoretical considerations
Perrin and Flach reject the contribution of electrostatic induction to the SIE on acidity because, in solution, it manifests itself almost entirely in the enthalpy of reaction, whereas they argue that the inductive effect must appear in its entropy.15 It must be recognized that polarization of an atom within a molecule is an electronic phenomenon. As such, it operates in the gas phase at absolute zero, at which the entropy of reaction necessarily vanishes, except for the possible trivial incursion of a symmetry number. Therefore, in the gas phase reaction at 0 K, IEs due to electrostatic induction cannot appear in the entropy of reaction. The entropy of solvation, as well as the entropy due to the internal motions of the reactants, may indeed contribute to SIEs on acidity in solution at ambient temperature, but it is not a criterion for the presence or absence of an inductive effect.The second argument raised against assigning a significant role to electrostatic induction deserves consideration in detail. It runs as follows: SIEs, like all isotope effects, can be attributed solely to vibrational frequency shifts, whereas the inductive effect is an electronic phenomenon that – at most – can make a trivial contribution to them. Specifically, electrostatic induction depends on the charge–dipole interaction, whereas the dipole moment differences between the isotopologs, which are due to the anharmonicity of the CH/CD stretching modes, are too small to account for the SIEs on acidity.
Although it is possible to compute isotope effects without separating the energy into its nuclear and electronic components, as for example by the “nuclear-electronic approach” of Hammes–Schiffer,16 the conventional procedure is to separate them.17 It is assumed that the reaction occurs on a single adiabatic potential energy surface based on the Born–Oppenheimer approximation, and that the relativistic effects can be neglected. If the vibrations are harmonic and the rotations are regarded as classical, all IEs can be expressed as ratios of the relevant vibrational partition functions, which – for the isotopes of hydrogen at moderate temperatures – are dominated by differences in their zero-point vibrational energy (ZPVE). However, the fact that this approximation constrains isotopologs to have the same electronic energy does not mean that electronic phenomena cannot give rise to isotope effects. It merely requires that these effects, including those that are due to the anharmonicity of vibrational modes, are incorporated in isotope-dependent shifts of their frequencies. This is true for all so-called isotopic substituent effects: inductive, hyperconjugative, steric, hybridization-dependent, etc.
The mechanism by which this occurs in the case of electrostatic polarization was demonstrated with a simple model reaction, developed in discussions with Professors Ruben Pauncz and Max Wolfsberg at the Uppsala University Summer School in Lidingö, Sweden in the summer of 1959, and summarized in ref. 6. An amplified version of the formal proof is given below in the Appendix (Section 5).
First order perturbation theory is applied to an idealized “reaction”, in which an isolated vibrating H–X bond is perturbed by a positive charge placed along its axis towards its X end (Fig. 1). It is postulated that electrical anharmonicity can be neglected, i.e. that the perturbing potential (ax) is effectively linear over the vibrational amplitude. If the one-dimensional potential is purely harmonic, the potential energy curve is shifted upwards or downwards, so that the equilibrium bond length is increased or decreased (Fig. 2), but its curvature remains the same. Thus, the quadratic force constant common to both the H–X bond and the corresponding D–X bond is unchanged, so the frequencies and the isotopic ZPVE difference of the perturbed bonds (the “products”) are the same as those of the unperturbed bonds (the “reactants”); hence no isotope effect. However, if the model's potential well is anharmonic, i.e. includes a cubic term (gx3) in the expression for the potential energy, the harmonic force constant at the displaced minimum changes, resulting in a change in the vibrational frequency and ZPVE of the perturbed bond. Thus, rather than being an additional factor, separate from the vibrational frequency shifts, electric polarization is the driving force for their occurrence.
 | ||
| Fig. 1 Interaction of a charge with a bond vibrating in an anharmonic potential (from ref. 6). | ||
 | ||
| Fig. 2 Effect of a linear perturbation on a harmonic potential (from ref. 6). | ||
The direction of the IE depends on the bond's dipole moment derivative (dμ/dr). For example, if X is chlorine, the polarity of the Cl–H bond dipole is Clδ−Hδ+, so the interaction of the perturbing positive charge with the bond dipole is attractive. As a result, the equilibrium bond length (re) is increased and the potential energy minimum is lowered. (Fig. 2 illustrates the reverse situation: a repulsive interaction that increases with bond extension. The curve is shifted upward and re is decreased.)
The dipole moment derivative of HCl is positive,18,19i.e., μ increases as the bond is stretched and decreases as it contracts. The charge–dipole interaction is attractive, so the potential energy of the vibrating bond decreases during expansion and increases during compression. In a harmonic potential, its average value does not change, as stabilization during bond extension is exactly compensated by destabilization during contraction. In an anharmonic potential, the positive displacement during extension is larger than the negative displacement during contraction. Therefore, the potential energy – averaged over the vibrational cycle – is diminished by reducing the harmonic force constant, lowering the frequency of the vibration and increasing its amplitude.
A conceptual error that has led to a gross underestimate of the role of anharmonicity in the secondary isotope effects is the misidentification of the potential energy of a bond computed at its vibrationally averaged distance ![[r with combining macron]](https://www.rsc.org/images/entities/i_char_0072_0304.gif) 0 with the average value of the potential energy computed over the vibrational cycle.20 The X–H bond length, averaged over its zeroth vibrational level H0, is slightly longer than the similarly averaged X–D bond, D0, which lies below it in the anharmonic potential well (Fig. 1). The dipole moments of X–H and X–D differ accordingly. The isotope effect on the potential energy computed at these slightly different bond lengths is very small, reflecting the change in the charge–dipole interaction in the shallow region near the minimum of the potential well. In contrast, the average potential energy samples the interaction over the entire vibrational amplitude, from the bond's minimal length at compression to its length at full extension. Thanks to the cubic term, gx3, in the anharmonic potential (see Appendix), the interaction is strongest when the bond is fully extended. Thus, depending on whether the cubic coefficient is positive or negative, the electrostatic perturbation raises or lowers the average potential energy of the X–D bond less than that of the X–H bond, which extends farther during the expansion phase of the vibration. This point is illustrated computationally below in Section 3.1.3 (Digression). It should be noted that the virial theorem requires the average potential energy of the harmonic oscillator to be exactly half of its total vibrational energy. At 0 K this holds in good approximation for the anharmonic oscillator as well, so the average potential energy is very close to half of the ZPVE.
0 with the average value of the potential energy computed over the vibrational cycle.20 The X–H bond length, averaged over its zeroth vibrational level H0, is slightly longer than the similarly averaged X–D bond, D0, which lies below it in the anharmonic potential well (Fig. 1). The dipole moments of X–H and X–D differ accordingly. The isotope effect on the potential energy computed at these slightly different bond lengths is very small, reflecting the change in the charge–dipole interaction in the shallow region near the minimum of the potential well. In contrast, the average potential energy samples the interaction over the entire vibrational amplitude, from the bond's minimal length at compression to its length at full extension. Thanks to the cubic term, gx3, in the anharmonic potential (see Appendix), the interaction is strongest when the bond is fully extended. Thus, depending on whether the cubic coefficient is positive or negative, the electrostatic perturbation raises or lowers the average potential energy of the X–D bond less than that of the X–H bond, which extends farther during the expansion phase of the vibration. This point is illustrated computationally below in Section 3.1.3 (Digression). It should be noted that the virial theorem requires the average potential energy of the harmonic oscillator to be exactly half of its total vibrational energy. At 0 K this holds in good approximation for the anharmonic oscillator as well, so the average potential energy is very close to half of the ZPVE.
3. Results and discussion
3.1. Deuterium isotope effect on the acidity of formic acid
| μ = 1/2 (qC − qH) rCH | (4) |
As shown in Table 1, the long CH-bond of the formate ion is shortened upon protonation and its stretching frequency is increased accordingly. The correlation of the frequency change, and hence of the IE on acidity, with Δμ/Δre should go a long way to confirm its electrostatic origin.
| Atomic charge scale | Charge on H-atom (e) | Charge on C-atom (e) | CH bond momenta (Debye) | CH bond length (Å) | CH-stretch frequency (cm−1) | |
|---|---|---|---|---|---|---|
| a 1 eÅ = 4.8032 Debye. | ||||||
| HCOOH | Mulliken | 0.105 | 0.446 | 0.899 | 1.0972 | 3120.7 |
| APT | −0.005 | 1.041 | 2.756 | |||
| HCOO− | Mulliken | −0.118 | 0.419 | 1.482 | 1.1493 | 2511.1 |
| APT | −0.309 | 1.247 | 4.293 | |||
| Δ(HCOOH–HCOO−) | Mulliken | 0.223 | 0.027 | −0.583 | −0.0521 | 609.6 |
| APT | 0.304 | −0.206 | −1.537 | |||
The Gaussian program provides two estimates of atomic charge distribution, the familiar Mulliken scale and the APT (Atomic Polar Tensor) scale.22 According to both, the bond is polarized in the sense Cδ+Hδ−, which will henceforth be referred to as positive. The Mulliken and APT charge distributions differ widely in both the acid and anion,23 but both schemes yield a larger C–H bond dipole in the anion than in the acid (Δμ = −0.583 and −1.537 Debye Å−1 respectively).
Evidently, the bond-moment derivative, dμ/dr, is positive, i.e. the dipole moment increases with the bond length.24 Protonation of the anion interacts repulsively with the C–H dipole, reducing it, shortening the CH-bond and increasing the force constant for the CH-stretching mode of formic acid (6.272 mdyn Å−1) above that of the formate ion (3.930 mdyn Å−1). Consequently, the frequency of the CH/CD-stretching mode is increased for both isotopologs: HCOOH: 3120.7 cm−1 and DCOOH: 2319.9 cm−1vs. HCOO: 2511.1 cm−1 and DCOO−: 1828.5 cm−1. Thus, the corresponding increase in ZPVE is less for the deuterated formate ion (Δν = 246 cm−1) than for its protio isotopolog (Δν = 305 cm−1), so it is the stronger base; accordingly, deuterated formic acid is a weaker acid than normal formic acid.
In order to estimate the extent to which isotopic ZPVE differences determine the IE at ambient temperature, we consider the computed thermochemical properties at 1 atm and 298 K, summarized in Table 2. Although thermal excitation of the vibrations and rotations makes a substantial contribution to the enthalpy and entropy of each of the four entities, it is cancelled out almost entirely in the IE. Thus, ΔΔH0298 and ΔΔG0298 are both dominated by ΔΔZPVE, approximately 60% of which is due directly to the CH/CD stretching frequency.
| G 0298 | ZPVEa | H 0298 | TS0298 | |
|---|---|---|---|---|
| a In parentheses: contribution of CH/CD-stretching mode. | ||||
| HCO2H | 6.482 | 21.590 (4.461) | 24.160 | 17.678 |
| DCO2H | 4.329 | 19.567 (3.316) | 22.174 | 17.845 |
| Δ isotopic | 2.153 | 2.023 (1.145) | 1.986 | −0.167 |
| HCO2− | −1.819 | 12.702 (3.590) | 15.157 | 16.976 |
| DCO2− | −3.723 | 10.955 (2.614) | 13.439 | 17.162 |
| Δ isotopic | 1.904 | 1.747 (0.976) | 1.717 | −0.186 |
| ΔΔ acid–anion | 0.249 | 0.276 (0.169) | 0.269 | 0.019 |
The computed value, ΔΔG0298 = 0.249 kcal mol−1, corresponds to ΔpKa = −0.183 (KH/KD = 1.52) for gas phase deprotonation of formic acid. It is in reasonably good agreement with the values (−ΔpKa = 0.140–0.164) computed by Perrin and Dong8 with a variety of methods, none of which allows for H-atom polarization. Moreover, all of their values are based directly on ΔΔZPVE; i.e., they apply to the gas-phase reaction at 0 K, at which the present computation yields ΔpKa = −0.202 (KHKD = 1.59). All of the computations predict an IE in the gas phase that is much larger than that measured in aqueous solution25 (KH/KD = 1.082; ΔpKa = 0.0342), where solvation evidently has a strong moderating effect.
Seven hydrates of the formate ion were optimized: a monohydrate (1), two dihydrates (2, 3), two trihydrates (4, 5), and two tetrahydrates (6, 7). Seven hydrates of formic acid were similarly optimized: a monohydrate (8), two dihydrates (9, 10), three trihydrates (11, 12, 13) and a tetrahydrate (14).

Needless to say, these two sets of hydrates do not exhaust the possibilities. Stangret and his collaborators,26 employing IR spectroscopy of HDO and DFT computations, characterized hydrated formate ions containing up to seven water molecules, whereas Chizhik and his coworkers,27 using nuclear magnetic relaxation data, identified hydrated acetate ions with as many as sixteen water molecules. However, computations with the Reference Interaction Site Model (RISM)28 indicate that the average number of H-bonds formed by the carboxylate group of the acetate ion in aqueous solution is 6 and those formed by the carboxyl group of acetic acid average only 2.5.29 Moreover, it can be assumed that the charge density at the C–H bond of the formate ion will be primarily affected by direct bonding to the carboxylate O-atoms, which can accommodate no more than four H-bonds. Thus, at most four water molecules can be H-bonded directly to the ion. The additional water molecules in the hydration shell, being bonded to one another, can presumably have only a secondary effect. Hydration of the acid is less pronounced than that of the anion, so it was taken as a working hypothesis that the anion hydrates (1–7) and acid hydrates (8–14) would suffice to indicate a trend. Their relevant properties are summarized in Tables 3 and 4.
| Formate ion hydrates | ΔG0hydration![[thin space (1/6-em)]](https://www.rsc.org/images/entities/char_2009.gif) a a |
ΔZPVEa | ΔH0a |
ΔTS0a |
ΔG0a |
r e (Å) |
μ
CHb |
|---|---|---|---|---|---|---|---|
| a kcal mol−1. b Debye, calculated with Mulliken charges. | |||||||
| H/DCO2− | — | 1.748 | 1.717 | −0.186 | 1.904 | 1.1493 | 1.482 |
| H/DCO2−⋯H2O (1) | −14.051 | 1.854 | 1.795 | −0.180 | 1.975 | 1.1325 | 1.311 |
| H/DCO2−⋯(H2O)2 (2) | −18.438 | 1.917 | 1.855 | −0.173 | 2.028 | 1.1264 | 1.370 |
| H/DCO2−⋯(H2O)2 (3) | −22.858 | 1.885 | 1.828 | −0.180 | 2.007 | 1.1255 | 1.246 |
| H/DCO2−⋯(H2O)3 (4) | −27.231 | 1.965 | 1.897 | −0.169 | 2.056 | 1.1180 | 1.251 |
| H/DCO2−⋯(H2O)3 (5) | −29.334 | 1.905 | 1.846 | −0.187 | 2.023 | 1.1208 | 1.185 |
| H/DCO2−⋯(H2O)4 (6) | −34.093 | 1.916 | 1.854 | −0.179 | 2.033 | 1.1189 | 1.172 |
| H/DCO2−⋯(H2O)4 (7) | −34.844 | 1.992 | 1.923 | −0.165 | 2.089 | 1.1141 | 1.256 |
| Formic acid hydrates | ΔG0hydrationa |
ΔZPVEa | ΔH0a |
ΔTS0a |
ΔG0a |
r e (Å) |
μ
CHb |
|---|---|---|---|---|---|---|---|
| a kcal mol−1. b Debye, calculated with Mulliken charges. | |||||||
| H/DCO2H | — | 2.023 | 1.986 | −0.167 | 2.153 | 1.0972 | 0.899 |
| H/DCO2H⋯H2O (8) | −1.832 | 2.058 | 1.994 | −0.164 | 2.158 | 1.0971 | 0.898 |
| H/DCO2H⋯(H2O)2 (9) | −0.866 | 2.091 | 2.024 | −0.159 | 2.183 | 1.0944 | 0.794 |
| H/DCO2H⋯(H2O)2 (10) | −4.869 | 2.065 | 1.999 | −0.163 | 2.162 | 1.0978 | 0.940 |
| H/DCO2H⋯(H2O)3 (11) | −1.824 | 2.099 | 2.031 | −0.156 | 2.187 | 1.0950 | 0.915 |
| H/DCO2H⋯(H2O)3 (12) | −1.823 | 2.098 | 2.030 | −0.157 | 2.187 | 1.0953 | 0.888 |
| H/DCO2H⋯(H2O)3 (13) | −5.676 | 2.068 | 2.001 | −0.163 | 2.164 | 1.0977 | 0.937 |
| H/DCO2H⋯(H2O)4 (14) | +1.079 | 2.130 | 2.061 | −0.150 | 2.211 | 1.0932 | 0.903 |
Fig. 3 shows an unweighted linear least-squares plot of the dipole moment (Mulliken) of the C–H bond vs. the equilibrium bond length for all of the data points in Tables 3 and 4. The slope of the plot, Δμ/Δre = 12.0 Debye Å−1, is quite close to the value derived above for the bare anion and acid, Δμ/Δre = 11.2 (thin blue line). This supports the assumption that Δμ/Δre is an adequate approximation to the bond dipole moment derivative, dμ/dr, which – within our rather wide limits of precision – is constant over the entire range. The relative values for hydrates with the same n depend on the detailed structure of the hydrate, e.g., how large is the angle between the CH-bond and the molecular dipole moment, whether the water molecules are H-bonded directly to the carboxylate group or to other hydrating water molecules, whether or not they are close enough to the C–H bond to interact with them directly. For example, the three points above the line (2, 4 and 7) refer to hydrates in which the C-bonded H-atom is surrounded by hydrogen atoms of the hydrating water molecules, and can be presumed to be in steric interaction with them, increasing the C–H stretching frequency – and no-doubt the bending frequencies as well – above the increase caused by electrostatic induction.
 | ||
| Fig. 3 Correlation between the C–H bond moment and the bond length in variously hydrated HCO2− and HCOOH. | ||
All of the points for the acid, including that of the bare molecule, are clustered at the left of the plot, confirming the insensitivity of the C–H bond length – and hence its vibrational frequency – to hydration. Comparing the structures of the monohydrated acid (8) and anion (1), we see that whereas in 1 the water molecule acts as an electrophile, withdrawing negative charge from the carboxylate O-atoms, the interaction in 8 is ambiphilic: withdrawing negative charge from one of the carboxyl group's O-atoms and feeding it to the other via its H-atom.
Fig. 4 shows an unweighted linear least-squares plot, for all of the data points in Tables 3 and 4, of the isotopic free energy difference, ΔG0, against the CH-bond dipole moment, μ (Mulliken).30 Although ΔG0 and μ are plotted for convenience along the X and Y axis respectively, μ is clearly the independent variable and ΔG0 the dependent variable. The plot is reasonably linear; the rather low coefficient of determination (R2 = 0.88) is due to the three anomalous formate points: 2, 4 and 7.
 | ||
| Fig. 4 Correlation between ΔG0 of H/DCO2H and H/DCO2 and the C–H bond dipole moment. | ||
The formic acid points are not clumped together as closely as in Fig. 3. The points for monohydrate (8), dihydrate (10) and trihydrate (13) are very close to one another, but those for dihydrate (9), trihydrates (11) and (12), and tetrahydrate (14) extend to higher values of ΔG0 than would be expected on the basis of Δμ alone. Note that in all of the latter four hydrates H-atoms of the bound water molecules are contiguous to the H-atom of the C–H bond. The consequent steric repulsion is evidently responsible for increasing the frequencies of the C–H vibrations. Steric repulsion also appears to be the reason why, unlike 10 and 13, none of the sterically hindered polyhydrates has a significantly larger free energy of hydration than the monohydrate (8).
The linear correlation between Δμ and ΔG0 illustrated in Fig. 4 constitutes strong evidence that hydration reduces the magnitude of the SIE by moderating the electron demand of the carboxylate group in the formate ion, thus reducing its C–H stretching frequency. Departures from linearity occur for those hydrates of the formate ion (2, 4 and 7) and formic acid (9, 11, 12 and 14) in which the ZPVE is increased by superposition of a steric isotope effect.
In order to compare the results of gas phase computations on the various hydrates of formic acid and the formate ion with the experimental results, it must be decided which of the specific hydrates of the acid and anion are most likely to be present in dilute aqueous solution. We recognize that hydration of the anion is exergonic, favoring the higher hydrates. However, the standard free energy of hydration for the equilibrium:
| HCO2− + nH2O HCO2−⋯(H2O)n | (5) |
It would not be correct to conclude similarly that the main form of the acid in solution would also be the tetrahydrate. In dilute aqueous solution the equilibrium in eqn (1) would indeed be shifted to the right, favouring the higher hydrates, however, from the values in Table 4, the standard free energy difference for the equilibrium:
| HCO2H⋯(H2O)3 + H2O HCO2H⋯(H2O)4 | (6) |
| (H2O)3 + H2O (H2O)4 | (7) |
Adopting the values ΔG0298 = 2.164 kcal mol−1 for the acid (13 in Table 4) and 2.089 kcal mol−1 for the anion (7 in Table 3), we obtain ΔΔG0298 = 0.075 kcal mol−1 (ΔpKa = −0.055; KHKD = 1.135), only slightly larger than the experimental result for the dissociation of formic acid in water (ΔpKa = −0.034; KHKD = 1.082). As noted above, external hydration of 7 would be expected to bring it even closer.
| μ0 = μe + (Δμ/Δre) (0 − re) | (8) |
The vibrationally averaged bond lengths (H0 and D0) of both the acid and anion are significantly larger than their equilibrium bond lengths (re), the difference being 0.0027 Å larger in the anion. The corresponding bond-dipole moment differences differ by 0.03 Debye. The energy difference computed for the anion frozen at H0 and D0 is larger by a minuscule 0.000034 Hartrees (0.021 kcal mol−1) than the corresponding difference for the acid. This is less than 8% of the ZPVE difference for the bare acid and anion, 0.276 kcal mol−1 (Table 2), or some 16% of the average potential energy. Thus, although the IE is indeed due to the charge–dipole interaction, any estimate of its magnitude based on the difference between the dipole moments of the isotopologs at their vibrationally averaged geometries, such as that attempted by Perrin and Dong,8 would be a gross underestimate.
|
0 (Å) |
E el (Hartrees) | μ 0 (Debye) | |
|---|---|---|---|
| a Calculated with eqn (8) (Δμ/Δr = 11.2). | |||
| Formic acid | r e = 1.0972 | −189.351729 | μ e = 0.899 |
|
H0 (HCO2H) |
1.1065 | −189.351585 | 1.003 |
|
D0 (DCO2H) |
1.1050 | −189.351606 | 0.986 |
| Δ isotopic | 0.0015 | 0.000021 | 0.017 |
| Formate ion | r e = 1.1493 | −188.769191 | μ e = 1.482 |
|
CH0 (HCO2−) |
1.1685 | −188.769010 | 1.697 |
|
CD0 (DCO2−) |
1.1643 | −188.769065 | 1.650 |
| Δ isotopic | 0.0042 | 0.000055 | 0.047 |
| ΔΔ (acid–anion) | −0.0027 | −0.000034 | −0.030 |
3.2. Deuterium isotope effect on the acidity of acetic acid
Table 6 lists the values of the projection on the C–C axis of the CH3-group dipole moment, μg, computed with Mulliken and APT charges as the vector sum of the three CH-bond moments. Despite the disparity between the dipole moments computed for each species separately, both scales yield the same difference between the acid and its conjugate base, a reduction of 0.3 Debye. The mean equilibrium bond length of the three methyl bonds, rm, is some 0.004 Å shorter in the acid than in the anion, so Δμg/Δrm the quantity analogous to the bond dipole moment, Δμ/Δre, would be an enormous 75 Debye Å−1.
| Scale |
μ
ga (Debye) |
r
mb (Å) |
ν
symc (cm−1) |
|
|---|---|---|---|---|
| a Vector sum of C–H bond moments projected on the C–C axis. b Mean equilibrium C–H bond length. c Frequency of “symmetric” C–H-stretching mode. | ||||
| CH3COOH | Mulliken | −1.165 | 1.0914 | CH3 3086.7 |
| APT | −0.307 | CD3 2219.4 | ||
| CH3COO− | Mulliken | −0.876 | 1.0961 | CH3 3039.4 |
| APT | −0.004 | CD3 2179.7 | ||
| Δ (acid–anion) | Mulliken | 0.289 | −0.0041 | CH3 47.3 |
| APT | 0.303 | CD3 39.7 | ||
Nevertheless, Δμg/Δrm cannot be regarded as the methyl group's dipole moment derivative, because the variation in the length of the C–H bonds within each methyl group is no smaller than the difference between the two mean values (e.g., in the acid: re = 1.0881, 1.0931, 1.0931 Å). Nor does it take their varying angles relative to the C–C axis into account, and moreover, ignores the contribution of the CH-bending modes to μg. The latter is difficult to isolate because the bending modes mix with CH-stretching modes of the same symmetry species – particularly in the deuterated isotopologs – as well as with skeletal modes of appropriate symmetry and energy. Early LCAO-MO computations suggest that variation in hybridization due to the change in the CH-bending angle does not shift the electronic charge markedly,32 so the CH-bending modes need not be considered separately in the present context. It should be noted that they achieve crucial importance when there is an empty p-orbital on the adjacent carbon atom, as in CH3CH2+, in which case they are a major contributor to the hyperconjugative SIE.33
Protonation of the acetate ion interacts favourably with each of the C–H bonds shortening it and lowering the potential well in which it is vibrating but – if the potential was harmonic – its vibrational force constant would not be affected. Since the well is anharmonic and the dipole derivative is negative, the extension of the bond is disfavoured relative to contraction, the curvature of the potential well increases in order to reduce its amplitude and raises its force constant. The frequency of the methyl stretching modes and their isotopic differences are increased, as illustrated in Table 6 for the “symmetric” stretch.34
The computed thermochemical data for acetic acid and the acetate ion are listed in Table 7. As in formic acid, the IE is dominated by the ZPVE differences, but the direct contribution of the CH3/CD3 stretching modes is only about 33%. The entropy of both the isolated acid and its conjugate base increases substantially upon thermal excitation from 0 to 298 K. It is higher for the deuterated isotopologs of both, due to the lower frequencies of their methyl modes, and is only partially canceled by the concomitant increase in enthalpy. Nevertheless, the influence of entropy on the isotope effect is slight.
| ZPVEa |
H
0298a |
TS0298a |
G
0298a |
|
|---|---|---|---|---|
| a kcal mol−1. b Direct contribution of CH3/CD3 stretching modes. | ||||
| CH3COO− | 30.493 | 33.866 | 20.680 | 13.186 |
| CD3COO− | 24.618 | 28.171 | 21.260 | 6.911 |
| Δ isotopic (acetate ion) | 5.875 (3.550)b | 5.695 | −0.580 | 6.275 |
| CH3COOH | 39.025 | 42.513 | 20.411 | 22.102 |
| CD3COOH | 32.973 | 36.647 | 20.961 | 15.686 |
| Δ isotopic (acetic acid) | 6.054 (3.607)b | 5.867 | −0.550 | 6.416 |
| ΔΔ (anion–acid) | −0.179 (−0.057)b | −0.172 | −0.031 | −0.140 |
The contribution of the ZPVE to the isotope effect (0.179 kcal mol−1) is somewhat larger than that computed by Perrin and Dong8 with B3LYP/6-31G* (0.152 kcal mol−1), from which they obtain ΔpKa = −0.111. The IE derived from the ΔΔG0 value in Table 7 (ΔpKa = −0.103) is fortuitously close to theirs, but both are much larger than the experimental value, ΔpKa = −0.0139.25 Evidently, here too solvation reduces the IE on acidity drastically.

| Acetate ion hydrates | ΔG0hydrationa,b |
ΔZPVEb | ΔH0b |
ΔTS0b |
ΔG0b |
μ
gc,d |
|---|---|---|---|---|---|---|
|
a For: CH3CO2− + n(H2O) CH3CO2−⋯(OH2)n.
b kcal mol−1.
c Debye, calculated with Mulliken charges.
d Projection on the CC axis.
|
||||||
| CH3/CD3CO2− | — | 5.875 | 5.695 | −0.580 | 6.275 | −0.876 |
| CH3/CD3CO2−⋯H2O (15) | −24.714 | 5.923 | 5.749 | −0.548 | 6.297 | −0.832 |
| CH3/CD3CO2−⋯(H2O)2 (16) | −39.051 | 6.070 | 5.864 | −0.534 | 6.398 | −1.111 |
| CH3/CD3CO2−⋯(H2O)2 (17) | −44.573 | 5.951 | 5.774 | −0.565 | 6.339 | −0.860 |
| Acetic acid hydrates | ΔG0hydrationa,b |
ΔZPVEb | ΔH0b |
ΔTS0b |
ΔG0b |
μ
gc,d |
|---|---|---|---|---|---|---|
|
a For: CH3CO2− + n(H2O) CH3CO2−⋯(OH2)n.
b kcal mol−1.
c Debye, calculated with Mulliken charges.
d Projection on the CC axis.
|
||||||
| CH3/CD3CO2H | — | 6.054 | 5.867 | −0.550 | 6.416 | −1.165 |
| CH3/CD3CO2H⋯H2O (18) | −8.087 | 6.066 | 5.881 | −0.552 | 6.433 | −0.969 |
| CH3/CD3CO2H⋯(H2O)2 (19) | −5.989 | 6.128 | 5.924 | −0.531 | 6.464 | −0.963 |
| CH3/CD3CO2H⋯(H2O)2 (20) | −11.066 | 6.064 | 5.879 | −0.552 | 6.432 | −1.031 |
Hydration of both acid and base is exergonic, more strongly so in the latter. Here too, the main factor is the electrophilic interaction of successive water molecules with the anion, a partial protonation that increases the CH-stretching frequencies and increases ΔZPVE and ΔG0.
Fig. 5 shows an unweighted linear least-squares plot of the isotopic free energy difference (ΔG0) against the methyl-group dipole moment, μg (Mulliken), for all of the data points in Tables 8 and 9. The correlation is poor; the worst offender is anion dihydrate 16, in which two of the methyl H-atoms are contiguous (RHH = 2.227 and 2.247 Å) to H-atoms of two adjacent water molecules and interact with them sterically. If 16 is ignored, the remaining hydrates can be fit to the blue line lying just below the regression line, and – like it – considerably less steep than the blue line connecting the anhydrous anion and acid. The quantitative mismatch is not difficult to rationalize. The quantity listed in the tables as “CH3-group dipole” is actually its component along the C–C axis, which lies at a different angle to the molecular dipole in the hydrates from those in the bare acid and anion.
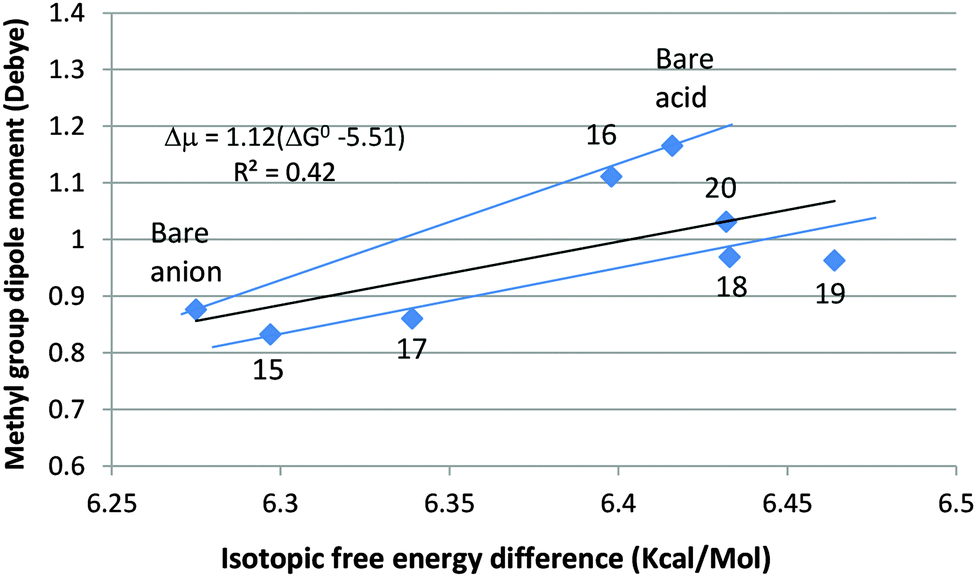 | ||
| Fig. 5 Correlation between ΔG0 of CH3/CD3CO2− and CH3/CD3CO2H and the CH3-group dipole moment. | ||
The striking similarity of the hydrates of acetate to those of formate makes it probable that the predominant species in solution would be a tetrahydrate homologous to 7, in which the inner solvation shell is complete. In order to make an educated guess as to its thermochemistry, we draw a semi-quantitative analogy with formate, as follows: ΔG0 of formate increases by 0.103 kcal mol−1 on going from the bare ion to the more stable dihydrate 3. This is 56% of the total increase to tetrahydrate 7 (0.185 kcal mol−1). When the same ratio is adopted for acetate, the increase to dihydrate 17 (0.064 kcal mol−1) suggests that ΔG0 of acetate would increase by 0.115 kcal mol−1 to 6.39 kcal mol−1 or thereabouts for the tetrahydrate, perhaps a bit higher due to external hydration.
In 18, as in formic acid monohydrate (8), hydration is ambiphilic. Here too electron attraction is more effective than electron donation, so the C–H stretching frequencies are increased slightly and – with them – the isotopic differences in ZPVE and free energy. The second water molecule in dihydrate 19 acts only as an electrophile, whereas both water molecules in the more stable dihydrate 20 are ambiphilic and are loosely bonded to one another. ΔG0 of 18 and 20 is a virtually identical 6.43 kcal mol−1. Turning back to Table 4, we note that the corresponding monohydrate (8) and dihydrate (10) of formic acid also have the same ΔG0 value (2.16 kcal mol−1). So does the trihydrate (13), which was recognized above as probably being the prevalent hydrate of formic acid in solution. It can reasonably be assumed that ΔG0 of the homologous trihydrate of acetic acid will also be close to that of 18 and 20: 6.43 kcal mol−1. On the assumption that the anion in solution is predominantly a tetrahydrate analogous to 7 and the acid a trihydrate analogous to 13, the estimated value of ΔΔG0298 for the IE on the ionization of acetic acid in aqueous solution becomes −0.04 kcal mol−1 (ΔpKa = 0.03; KH/KD = 1.07), and would be reduced a bit more by external hydration of the tetrahydrated anion. This is as close to the experimental value (ΔpKa = −0.0139; KH/KD = 1.032) as can be anticipated.
A feature that has not been taken into account is the effect of hydrophobic interaction between the methyl hydrogen atoms and water molecules that are not H-bonded to the carboxylate or carboxyl group. The RISM computations referred to above29 indicate that a large number of water molecules are involved in it – on the average 8.9 in the acid and 10 in the ion. While the internal motions of these molecules may well contribute to the enthalpy and entropy of solvation, they evidently do not make a significant contribution to the isotope effect on the acidity of acetic acid.
3.3. Deuterium isotope effect on the basicity of methylamine
| Scale | μ g (Debye) |
r
mb (Å) |
ν
symc (cm−1) |
|
|---|---|---|---|---|
| a Projection the C–C axis. b Mean equilibrium C–H bond length. c Frequency of “symmetric” CH3/CD3 stretching mode. | ||||
| CH3NH3+ | Mulliken | −0.740 | 1.0880 | CH3 3132.4; CD3 2244.3 |
| APT | +0.456 | |||
| CH3NH2 | Mulliken | −0.515a | 1.0948 | CH3 3032.3; CD3 2185.7 |
| APT | +1.113a | |||
| Δ (CH3NH3+–CH3NH2) | Mulliken | −0.225 | 0.068 | CH3 100.1; CD3 58.6 |
| APT | −0.657 | |||
(1) Mulliken: the charge–dipole interaction at the methyl carbon upon protonation is attractive. The moderately increased magnitude (0.225 Debye) of the (negative) group dipole moment indicates that electron release from the methyl H-atoms is larger than that from the C-atom, even though they were less negatively charged to begin with. Since Δμg is positive and Δμg/Δrm is negative, the CH-bonds become shorter and the methyl stretching frequencies are increased.
(2) APT: the charge–dipole interaction is repulsive. The greatly reduced magnitude (0.657 Debye) of the (positive) group dipole moment indicates substantial electron release from the negatively charged H-atoms to the positively charged C-atom. Since both μ and dμ/dr are positive, the decreased dipole moment is accompanied by shorter CH-bonds and higher methyl stretching frequencies.
Thus, whichever of the two schemes is correct, both produce the same qualitative result: a net shift of the negative charge within the methyl group from hydrogen to carbon, a consequent increase in the CH-stretching frequencies, and an inverse isotope effect. Therefore, in this context, the expression “deuterium is effectively more electron-releasing than protium” is not a solecism.
The computed thermodynamic properties are summarized in Table 11. The three CH-bonds in methylamine are not identical. The antiperiplanar bond, i.e. trans to the nitrogen lone pair, is slightly longer (1.0995 Å) than the two synclinal bonds near 60° and 120° (1.0295 Å), and its bond dipole – computed with Mulliken charges – is lower: −0.440 vs. −0.499 Debye. These results are in qualitative agreement with a model computation by Perrin and his coworkers,10 according to which the length of an isolated alkyl CH-bond is at a maximum and its stretching frequency is at a minimum in the antiperiplanar conformation, whereas the bond is shortest and its frequency highest in the synclinal conformation. The authors ascribe the effect to varying degrees of negative hyperconjugation. However, the basicities in aqueous solution of all the conformationally constrained amines cited by them (Table 1 of ref. 10) lie in the range: ΔΔG0 = 22 ± 5 cal per mol per D-atom. Thus, whatever the steric or stereoelectronic source of the observed conformational variation may be, it is evidently a secondary effect superimposed on electrostatic induction, which they had summarily dismissed.
| ZPVEa,b |
H
0298a |
TS0298a |
G
0298a |
|
|---|---|---|---|---|
| a kcal mol−1. b In parentheses: direct contribution of the CH3/CD3 stretching modes. | ||||
| CH3NH3+ | 50.544 | 53.275 | 16.602 | 36.673 |
| CD3NH3+ | 44.264 | 47.118 | 17.100 | 30.018 |
| Δ isotope (CH3NH3+–CD3NH3+) | 6.280 (3.652) | 6.157 | −0.498 | 6.655 |
| CH3NH2 | 40.919 | 43.620 | 17.061 | 26.559 |
| CD3NH2 | 34.791 | 37.611 | 17.576 | 20.035 |
| Δ isotope (CH3NH2–CD3NH2) | 6.128 (3.550) | 6.009 | −0.515 | 6.524 |
| ΔΔ (cation–base) | 0.152 (0.102) | 0.148 | 0.017 | 0.131 |

The relevant thermochemical properties of the methylammonium ion and its conjugate base are summarized in Tables 12 and 13 respectively.
| Methylammonium ion hydrates | ΔG0hydrationa,b |
ΔZPVEb | ΔH0b |
ΔTS0b |
ΔG0b |
μ
gc |
|---|---|---|---|---|---|---|
|
a For: CH3NH3+ + nH2O CH3NH3+⋯(OH2)n.
b kcal mol−1.
c Debye, calculated with Mulliken charges.
d Projection on the CN axis.
|
||||||
| CH3/CD3NH3+ | — | 6.280 | 6.157 | −0.498 | 6.655 | −0.740 |
| CH3/CD3NH3+⋯H2O (21) | −14.097 | 6.303 | 6.146 | −0.508 | 6.654 | −0.719d |
| CH3/CD3NH3+⋯(H2O)2 (22) | −25.980 | 6.307 | 6.140 | −0.502 | 6.642 | −0.688d |
| CH3/CD3NH3+⋯(H2O)3 (23) | −32.158 | 6.304 | 6.131 | −0.508 | 6.639 | −0.683 |
| Methylamine hydrates | ΔG0hydrationa,b |
ΔZPVEb | ΔH0b |
ΔTS0b |
ΔG0b |
μ
gc,d |
|---|---|---|---|---|---|---|
|
a For: CH3NH2 + n(H2O) CH3NH2⋯(OH2)n.
b kcal mol−1.
c Debye, calculated with Mulliken charges.
d Projection on the CN axis.
|
||||||
| CH3/CD3NH2 | — | 6.128 | 6.009 | −0.515 | 6.524 | −0.515 |
| CH3/CD3NH2⋯H2O (24) | 0.527 | 6.201 | 6.049 | −0.500 | 6.548 | −0.570 |
| CH3/CD3NH2⋯(H2O)2 (25) | −1.197 | 6.198 | 6.037 | −0.512 | 6.550 | −0.491 |
An unweighted linear least-squares plot of the methyl-group dipole moment vs. the isotopic free energy difference is displayed in Fig. 6. Hydration of the methylammonium ion is solely nucleophilic. The H-atoms of the water molecules are not directly involved in the binding and are sufficiently far from the methyl group to preclude a direct steric or stereoelectronic interaction between them. Increasing the number of water molecules H-bonded to the cation causes a slight, monotonic decrease in the magnitude of the CH3-group dipole, accompanied by a slight but consistent decrease in the isotopic free energy difference. Points 21–23 lie just below the line (not drawn in the figure) connecting the bare cation and amine, confirming that ΔG0 is an effectively linear function of μg when the hydrated ions are not encumbered by steric interactions and/or gross departures from axial symmetry, such as those noted in the case of the acetate ion. In the amine monohydrate (24), the water molecule acts as an electrophile, increasing ΔG0 slightly. It is retained in the dihydrate (25), in which a second water molecule is H-bonded to its O-atom, as well as – loosely (RHN = 2.27 Å) – to one of the amino H-atoms, leaving ΔG0 unchanged.
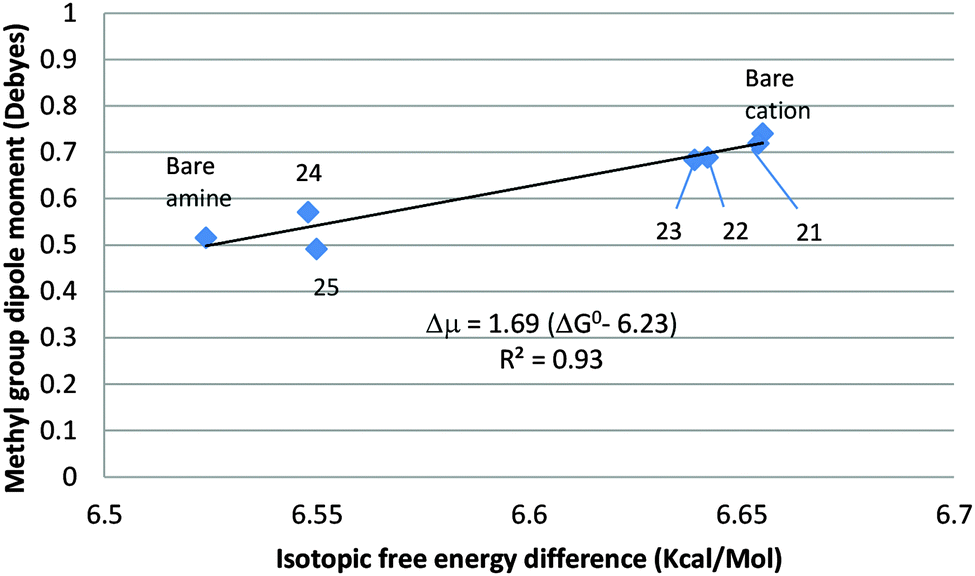 | ||
| Fig. 6 Correlation between ΔG0 of CH3/CD3NH2 and CH3/CD3NH3+ and the CH3-group dipole moment. | ||
Hydration of the methylammonium ion is strongly exergonic, guaranteeing that the trihydrate, 23, in which the inner hydration shell is complete, will be the dominant species in dilute aqueous solution. It may be assumed that the more highly hydrated amine 25 will predominate in dilute aqueous solution. Therefore, taking 23 to be the principal form of the methylammonium ion in solution and 25 to represent methylamine, we obtain ΔΔG0298 = 0.090 kcal mol−1, ΔpKb = 0.066, only 30% larger than the experimental value of the IE on the basicity of methylamine in aqueous solution (ΔΔG0298 = 0.070 kcal mol−1, ΔpKb = 0.051).9 The contribution of entropy of solvation to the isotope effect is negligible. Thus, gas phase computation of the hydrated species provides a good approximation to the secondary isotope effect on amine basicity in aqueous solution.
These results are consistent with RISM computations35 indicating that, in solution, the methylammonium ion forms three hydrogen bonds to water, and methylamine – on average – forms 2.5. For both the base and cation, these computations also indicate the presence of many water molecules in hydrophobic interaction with the methyl group. Here too, as in the case of acetic acid, its contribution to the isotope effect is evidently negligible.
4. Conclusions
The mechanism by which electrostatic induction alters the frequency of C–H/C–D stretching modes and produces secondary isotope effects is described in terms of a one-dimensional model. Within the constraints of first-order perturbation theory, the interaction between a perturbing charge and the polar bond has two separate effects:(1) Lengthening or shortening of the equilibrium bond length (re) and an upward or downward shift of the potential energy minimum depending on whether the interaction is attractive or repulsive.
(2) In an anharmonic potential, an increase or decrease of the harmonic force constant, according to whether the sign of the bond dipole derivative, dμ/dr, is positive or negative.
This model is applied to the protonation of the formate ion. The computations show that the C–H bond is shorter in formic acid than in the formate ion and its dipole moment is smaller; evidently dμ/dr is positive. Δμ/Δre, the difference between the CH-bond dipole moments of the acid and its conjugate base divided by the difference between their equilibrium bond lengths, is thus a linear approximation to dμ/dr. Protonation increases the vibrational frequency of the bond and – in consequence – the isotopic differences in its zero-point energy (ΔΔZPVE) and Gibbs free energy (ΔΔG0) increase as well, producing a normal isotope effect on acidity: HCOOH is a stronger acid than DCOOH. The inductive origin of the isotope effect is confirmed by computations on various hydrates of formic acid and the formate ion. The slope of a linear plot of μ vs. re is in good agreement with Δμ/Δre, and a plot of ΔΔG0vs. μ is also adequately linear. In both plots, the linear correlation is improved when the steric interaction between the C–H bond and the H-atoms of hydrating water molecules in several of the hydrates is taken into account.
Similar computations were carried out on the acid–conjugate base pairs: CH3CO2H/CH3CO2− and CH3NH3+/CH3NH2. In both cases the methyl C–H bonds are shorter in the acid than in its conjugate base and their frequencies higher, leading to a normal SIE on the acidity of acetic acid and an inverse SIE on the basicity of methylamine. Bond shortening is accompanied by a reduction of μg, the projection of the methyl-group dipole moment on the C–C axis, representing a shift of the electron density from H to C. The plot of μg against ΔΔG0 is adequately linear when steric interactions are taken into account.
The SIEs computed with the anhydrous acids and their conjugate bases are larger than the published experimental values in solution; much larger for the carboxylic acids, slightly larger for methylamine. Binding an increasing number of water molecules, especially to the ionic component, reduces the isotope effect. In all three cases: the SIE computed with the polyhydrates in the gas phase at 298 K is reduced to within a factor of two of the experimental value in aqueous solution. The contribution of entropy of solvation to the SIE is negligible. Hydration reduces the SIE primarily by modifying electron release from the carboxylate group in the first case and electron demand from the ammonium group in the second, confirming its inductive origin.
5. Appendix
The essential features of the proof in ref. 6 are as follows:If a harmonic oscillator (1/2kx2, where x = r − re) is acted upon by a linear perturbation (Ve + ax), the potential energy function becomes:
| V′ = Ve + ax + 1/2kx2 | (A.1) |
We note immediately that the force constant, i.e. the second derivative of the potential energy, is unchanged:
| d2V′/dx2 = k | (A.2) |
Eqn (A.1) can be rearranged to
| V′ = (Ve − a2/2k) + 1/2k(x + a/k)2 | (A.3) |
The minimum has been shifted upwards or downwards, depending on the sign and magnitude of Ve, and to the right or left, depending on the sign of a, by −a/k (see Fig. 2). Both the original and final potentials are harmonic, with the same force constant, so the linear perturbation cannot give rise to a frequency change or an isotope effect.
If the potential is anharmonic, as in the case of CH-bonds, it contains a cubic term, gx3. The perturbed potential is
| V′ = Ve + ax + 1/2kx2 + gx3 | (A.4) |
| dV′/dx = a + kx + 3gx2 | (A.5) |
| d2V′/dx2 = k + 6gx | (A.6) |
Equating the quadratic expression in (A.5) to zero, we obtain two solutions for the position of the new extremum,
| x{1,2} = [−k ± (k2 − 12ga)1/2]/6g | (A.7) |
| x = −k[1 + (1 − 12ga/k2)1/2]/6g | (A.7′) |
Since 12ga is much smaller than k2, the square root can be expanded in good approximation to (1–6ga/k2), yielding, after substitution and collection of terms, the same displacement to the new minimum derived above for the harmonic potential: x ≅ −a/k. Introducing the new value into eqn (A.6), we obtain
| d2V′/dx2 ≅ k − 6ag/k | (A.8) |
The harmonic force constant, vibrational frequency and isotopic zero point energy difference have thus been changed by the linear perturbation, but only because the original potential energy function includes a cubic anharmonic term.
The nature of the perturbation, implied in ref. 6 but not stated there explicitly, is the charge–dipole interaction. For the interaction of a charge q and dipole μ aligned as in Fig. 1, it is expressed by
| V = – μq/4πε0r2 | (A.9) |
Including the charge and the universal constants in a single coefficient, C, it becomes
| V = Cμr−2 | (A.9′) |
Neglecting electrical anharmonicity, i.e. assuming that the dipole moment varies linearly with distance, the coefficient is
| a = C[d(μr−2)/dr] | (A.10) |
| a = C[r−2dμ/dr + μ d(r−2)/dr] | (A.10′) |
| a = C/r2 [dμ/dr − μ/2r] | (A.10′′) |
The minute change in 1/r2 between the equilibrium lengths of the perturbed and unperturbed C–H bonds is negligible, so C/r2 can be seen as a constant coefficient.
The second term in brackets is of the order of 1 Debye Å−1, whereas dμ/dr is somewhere between 10 and 30 Debye Å−1, depending on the charge distribution scheme used to estimate it. It follows that the coefficient a, which – along with g – is responsible for the isotope effect, can be regarded, for the semi-quantitative purposes of the present paper, as directly proportional to the dipole moment derivative,
| a ≅ C′dμ/dr | (A.11) |
It is an implicit assumption of the model that the bond-dipole moment is an intrinsic function of the bond length that is not affected by the perturbation, i.e. that the charge-induced dipole interaction can be neglected, so that the same value of dμ/dr applies to both the perturbed and unperturbed bonds.
Acknowledgements
The author is indebted to Dr Miri Karni for guidance on computations with the Gaussian program and to Professor Jacob Katriel for ongoing discussions and valuable critical readings of the manuscript. A particularly careful review by one of the referees is gratefully acknowledged.Notes and references
- E. A. Halevi and M. Nussim, Bull. Res. Counc. Isr., Sect. A: Math., Phys. Chem., 1956, 5, 263 Search PubMed.
- E. A. Halevi, M. Nussim and A. Ron, J. Chem. Soc., 1963, 866 RSC.
- Y. Bary, H. Gilboa and E. A. Halevi, J. Chem. Soc., Perkin Trans. 2, 1979, 938 RSC , in which several of the early values were revised.
- E. S. Lewis and C. E. Boozer, J. Am. Chem. Soc., 1952, 74, 6306 CrossRef CAS.
- V. J. Shiner, J. Am. Chem. Soc., 1953, 75, 292 CrossRef.
- E. A. Halevi, Prog. Phys. Org. Chem., 1963, 1, 109–184 CrossRef CAS.
- A. C. Hengge, in Isotope Effects in Chemistry and Biology, ed. A. Kohen and H. Limbach, Taylor and Francis, Boca Raton, 2006, pp. 955–974, and papers cited therein Search PubMed.
- C. L. Perrin and Y. Dong, J. Am. Chem. Soc., 2007, 129, 4490 CrossRef CAS PubMed.
- C. L. Perrin, B. K. Ohta and J. Kuperman, J. Am. Chem. Soc., 2003, 125, 15008 CrossRef CAS PubMed.
- C. L. Perrin, B. K. Ohta, J. Kuperman, J. Liberman and M. Erdélyi, J. Am. Chem. Soc., 2005, 127, 9641 CrossRef CAS PubMed.
- C. L. Perrin and A. Flach, Angew. Chem., Int. Ed., 2011, 50, 7674 CrossRef CAS PubMed.
- C. L. Perrin, Adv. Phys. Org. Chem., 2010, 44, 123–171 CrossRef CAS.
- See e.g.F. A. Carroll, Perspectives in Structure and Mechanism in Organic Chemistry, Wiley, Hoboken, 2010, p. 383 Search PubMed.
- M. J. Frisch, G. W. Trucks, H. B. Schlegel, G. E. Scuseria, M. A. Robb, J. R. Cheeseman, J. A. Montgomery Jr., T. Vreven, K. N. Kudin, J. C. Burant, J. M. Millam, S. S. Iyengar, J. Tomasi, V. Barone, B. Mennucci, M. Cossi, G. Scalmani, N. Rega, G. A. Petersson, H. Nakatsuji, M. Hada, M. Ehara, K. Toyota, R. Fukuda, J. Hasegawa, M. Ishida, T. Nakajima, Y. Honda, O. Kitao, H. Nakai, M. Klene, X. Li, J. E. Knox, H. P. Hratchian, J. B. Cross, C. Adamo, J. Jaramillo, R. Gomperts, R. E. Stratmann, O. Yazyev, A. J. Austin, R. Cammi, C. Pomelli, J. W. Ochterski, P. Y. Ayala, K. Morokuma, G. A. Voth, P. Salvador, J. J. Dannenberg, V. G. Zakrzewski, S. Dapprich, A. D. Daniels, M. C. Strain, O. Farkas, D. K. Malick, A. D. Rabuck, K. Raghavachari, J. B. Foresman, J. V. Ortiz, Q. Cui, A. G. Baboul, S. Clifford, J. Cioslowski, B. B. Stefanov, G. Liu, A. Liashenko, P. Piskorz, I. Komaromi, R. L. Martin, D. J. Fox, T. Keith, M. A. Al-Laham, C. Y. Peng, A. Nanayakkara, M. Challacombe, P. M. W. Gill, B. Johnson, W. Chen, M. W. Wong, C. Gonzalez and J. A. Pople, Gaussian 03, revision B.04, Gaussian, Inc., Pittsburgh, PA, 2003 Search PubMed.
- The author is partially responsible for this misconception. A poorly worded speculation in ref. 2, intended to suggest that the altered charge distribution may be reflected in the energy and entropy of solvation and erroneously assigned to the inductive effect, was misinterpreted. The idea is expressed more clearly on pp. 129–130 of ref. 6.
- A. Reyes, M. V. Pak and S. Hammes-Schiffer, J. Chem. Phys., 2005, 123, 64104 CrossRef PubMed.
- J. Bigeleisen and M. G. Mayer, J. Chem. Phys., 1947, 15, 261 CrossRef CAS.
- E. W. Kaiser, J. Chem. Phys., 1970, 53, 1686 CrossRef CAS.
- E. A. Halevi, Internat. J. Quantum Chemistry, 1971, Symposium No. 5, 367.
- Regrettably, this distinction was not brought out clearly in ref. 6.
- This is an oversimplification, but it is adequate for the present qualitative purposes.
- J. Cioslowski, J. Am. Chem. Soc., 1989, 111, 8333 CrossRef CAS.
- Confidence in the APT scale is reduced by its placement of a larger positive charge on the carbon atom in the anion than in the acid.
- The corresponding values of Δμ/Δre (11.2 and 29.5 respectively), which may seem excessively large at first sight for a bond ca.1 Å long with a dipole moment of a few Debyes, reflect the fact that the magnitude of the C–H bond dipole – and even its sign – vary over a small fraction of the bond length.
- T. Pehk, E. Kiirend, E. Lippmaa, U. Ragnarsson and L. Grehn, J. Chem. Soc., Perkin Trans. 2, 1997, 445 RSC.
- M. Śmiechowski, E. Goiło and J. Stangret, J. Phys. Chem. B, 2011, 115, 4834 CrossRef PubMed and papers cited therein.
- M. A. Vovk, M. S. Pavlova, V. I. Chizhik and A. A. Vorontzova, Russ. J. Phys. Chem., 2011, 85, 1597 CrossRef CAS.
- S. Ten-no, F. Hirata and S. Kato, J. Chem. Phys., 1994, 100, 7443 CrossRef CAS.
- M. V. Fedotova and S. E. Kruchinin, J. Mol. Liq., 2011, 164, 201 CrossRef CAS.
- A plot with ΔZPVE as the abscissa would be nearly identical.
- R. Superfine, J. Y. Huang and Y. R. Shen, Chem. Phys. Lett., 1990, 172, 3 CrossRef.
- E. A. Halevi and R. Pauncz, J. Chem. Soc., 1959, 1974 RSC.
- A. Ron, E. A. Halevi and R. Pauncz, J. Chem. Soc., 1960, 630 RSC.
- “Symmetric stretch” refers to the lowest of the three CH-stretching frequencies. It is more nearly symmetric (a′) in the anion, which has Cs symmetry, than in the acid.
- M. V. Fedotova and S. E. Kruchinin, Russ. Chem. Bull., 2012, 61(2), 240 CrossRef CAS.
Footnote |
| † Electronic supplementary information (ESI) available: Cartesian coordinate matrices of all optimized structures. See DOI: 10.1039/c4nj00221k |
| This journal is © The Royal Society of Chemistry and the Centre National de la Recherche Scientifique 2014 |