
 Open Access Article
 This Open Access Article is licensed under a
 Creative Commons Attribution 3.0 Unported Licence
Quantitation and localization of intracellular redox active metals by X-ray fluorescence microscopy in cortical neurons derived from APP and APLP2 knockout tissue
Giuseppe D.
Ciccotosto
*a,
Simon A.
James
bc,
Matteo
Altissimo
d,
David
Paterson
b,
Stefan
Vogt
e,
Barry
Lai
e,
Martin D.
de Jonge
b,
Daryl L.
Howard
 b,
Ashley I.
Bush
f and
Roberto
Cappai
a
b,
Ashley I.
Bush
f and
Roberto
Cappai
a
aDepartment of Pathology and Bio21 Molecular Science and Biotechnology Institute, The University of Melbourne, Victoria 3010, Australia. E-mail: j.ciccotosto@unimelb.edu.au
bAustralian Synchrotron, Victoria 3168, Australia
cCSIRO Materials Science and Engineering, Victoria 3189, Australia
dElettra Sincrotrone Trieste S.C.p.A. S.S. 14, 34149 Trieste-Basovizza, Italy
eX-ray Science Division Advanced Photon Source, Argonne National Laboratory, Argonne, IL 60439, USA
fThe Florey Institute of Neuroscience and Mental Health, The University of Melbourne, Victoria 3010, Australia
First published on 28th July 2014
Abstract
The amyloid precursor protein (APP) gene family includes APP and the amyloid precursor-like proteins, APLP1 and APLP2. These proteins contain metal binding sites for copper, zinc and iron and are known to have physiological roles in modulating the metal homeostasis in brain cells. Here we report the application of X-ray fluorescence microscopy (XFM) to investigate the subcellular distribution patterns of the metal ions Cu, Zn, Fe, and Ca in individual neurons derived from APP and APLP2 knockout mice brains to further define their role in metal homeostasis. These studies add to the growing body of data that the APP family of proteins are metalloproteins that have shared as well as distinct effects on metals. As we continue to delineate the cellular effects of the APP family of proteins it is important to consider how metals are involved in their actions.
Introduction
The amyloid precursor protein (APP) is a type I transmembrane glycoprotein and a member of the multigene family that contains the paralogue amyloid precursor-like proteins 1 and 2 (APLP1 and APLP2).1 The metabolism of APP has been intensely studied due to it being the source of the neurotoxic amyloid beta (Aβ) peptide which is central to Alzheimer's disease (AD) pathogenesis. Unlike APP, neither APLP1 nor APLP2 contains the Aβ peptide sequence, but all three paralogues are similarly processed by the same α-, β- and γ-secretases (reviewed by Walsh et al. and Müller et al.).2,3 APP and APLP2 are expressed ubiquitously throughout the body and highest concentrations are in the central nervous system predominantly co-expressed in the same neuronal populations.1,4 Although the phenotypes of single knockout (−/−) mice are fairly mild, in vivo and in vitro studies suggest that the APP gene family of protein functions include cell and synaptic adhesion, promote synaptotrophic and neuroprotective activity and have roles in the intracellular signalling and regulation of gene expression (reviewed by Walsh et al. and Müller et al.).2,3 While the single gene knockout and the combined double APP−/−APLP1−/− mice produce viable offspring, deleting APLP2 in combination with either APP or APLP1 (APP−/−APLP2−/− or APLP1−/−APLP2−/−) causes embryonic lethality suggesting that the APLP2 protein has a key physiological role in animal survival.5,6 The APP gene family of proteins are classified as metalloproteins because they play an essential role in regulating cellular metal homeostasis which has both physiological as well as pathological consequences.7–9APP has a copper-binding domain (CuBD) located in the N-terminal cysteine-rich region10,11 and the full-length protein as well as peptides derived from the CuBD are able to coordinate and reduce Cu2+ to Cu+.11–13 The tertiary structure of the APP CuBD is an α-helix packed in a triple strand β-sheet topology.14 This characteristic secondary structure is shared by three other proteins known to be involved in copper chaperone activity – the Menkes copper-transporting ATPase fragment,15 the metallochaperone Atx116 and the SOD1 copper chaperone.17In vivo, brain Cu levels display an age dependent increase over time9 while the APP−/− and APLP2−/− adult mice have significantly elevated copper levels in the cerebral cortex compared to wt.9,13 Conversely, transgenic mice that overexpress APP have reduced Cu levels in the brain.18–20In vitro cell culture models using primary cortical neurons or embryonic fibroblasts derived from the APP-family of knockout mice demonstrated that they had accumulated exogenously added Cu indicating that APP and APLP2 have an important role in regulating copper homeostasis in these cells.8
Aberrant metal homeostasis is observed in patients with AD and this may contribute to AD pathogenesis, by enhancing the formation of reactive oxygen species (ROS) and toxic Aβ oligomers, and facilitating the formation of the hallmark amyloid deposits in AD brain.21 Abnormal metabolism of APP and Aβ would impair brain metal homeostasis, as part of the AD pathogenic process. Aβ and APP expression can decrease brain Cu levels, whereas increasing brain Cu availability results in decreased levels of Aβ and amyloid plaque formation in transgenic mice.22–24 Lowering Cu levels can down-regulate the transcription of APP, strengthening the hypothesis that APP and Aβ form part of the Cu homeostatic machinery in the brain. However, an unresolved question is the cellular location of the metals in individual brain neurons from APP−/− and APLP2−/− mice compared to wt. This study provides useful insights into how the APP gene family modulates metal homeostasis, as well as the function of the APP-family. This study used the X-ray fluorescence microscopy (XFM) instrumentation based at the Advanced Photon Source (APS, Argonne, IL) and from the XFM beamline at Australian Synchrotron to both localize and measure metals in primary cortical neurons and brain tissue slices from gene knockout mice of the APP family.
Methods
Materials
Unless otherwise stated all reagents were of analytical grade or higher and purchased from Sigma-Aldrich (St Louis, MO). Milli-Q ultraclean water (18.2 MΩ cm resistivity) was used throughout this study.Generation of APP+/−APLP2−/− mice
Generation of APP−/− mice25 and APLP2−/− mice26 has previously been described. The wild type mice (APP+/+APLP2+/+), APP−/−, APLP2−/−, and APP+/−APLP2−/− knockout mice were of the same C57BL6J × 129/Sv background strain (n = 5, 6, 6, and 6, respectively). Genotypes were determined by PCR using specific primer sets.26 Animals were housed with a 12 h light–dark cycle, room temperature was set at 21 °C, and the humidity of the individually ventilated cages ranges from 40 to 65%. These mice also had ad libitum access to standard rodent chow and filtered (0.2 micron) tap water for drinking.Primary neuronal cultures
Mouse cortical neuronal cultures were prepared under sterile conditions as described previously and approved by a local institutional Ethics committee.27,28 Briefly, at embryonic day 14 BL6J × 129sv mouse cortices were removed, dissected free of meninges, and dissociated in 0.025% (w/v) trypsin in Krebs buffer. The dissociated cells were triturated using a filter-plugged fine pipette tip, pelleted, resuspended in the plating medium (minimum Eagle's medium, 10% fetal calf serum, 5% horse serum), and counted. Poly-D-lysine coated silicon nitride windows (an area of 2 × 2 mm2, a 5 × 5 mm2 frame, and a thickness of 1000 nm) manufactured by Silson (Blisworth, UK) were placed in 4 well plates and cortical neurons seeded at a density of 75![[thin space (1/6-em)]](https://www.rsc.org/images/entities/char_2009.gif) 000 cells per well in plating medium. All cultures were maintained in an incubator (lined with stainless steel) set at 37 °C with 5% CO2. After 2 h the plating medium was replaced with fresh neurobasal medium containing B27 supplements, geneticin, and 0.5 mM glutamine (all tissue culture reagents were purchased from Invitrogen unless otherwise stated). This method resulted in cultures highly enriched for neurons (>95% purity) with minimal astrocyte and microglial contamination as determined by immunostaining culture preparations using specific marker antibodies (data not shown).
000 cells per well in plating medium. All cultures were maintained in an incubator (lined with stainless steel) set at 37 °C with 5% CO2. After 2 h the plating medium was replaced with fresh neurobasal medium containing B27 supplements, geneticin, and 0.5 mM glutamine (all tissue culture reagents were purchased from Invitrogen unless otherwise stated). This method resulted in cultures highly enriched for neurons (>95% purity) with minimal astrocyte and microglial contamination as determined by immunostaining culture preparations using specific marker antibodies (data not shown).
After 5 days in culture, neurons were washed with phosphate-buffered saline (PBS) pH 7.2, followed by fixation in 4% paraformaldehyde in PBS for 20 min. Neurons were washed again in PBS then residual PBS was removed by washing in isotonic 0.1 M ammonium acetate and then allowed to air dry for several days before imaging.
Optical images of the cells were captured on a DMXRE microscope (Leica Microsystems, Wetzlar, Germany) by using Normaski differential interference contrast microscopy and ×40 and ×100 air objectives with a Sensicam QE camera (Cooke Co., Auburn Hills, MI) and processed using SLidebook software (Intelligent Imaging Innovations, Denver, CO).
Preparation of brain slices for imaging
Brains were harvested from 1 and 6 month old wt, APP−/−, and APLP2−/− mice (n = 3 per group) that were transcardially perfused while under anesthesia with a high-purity solution of 4% paraformaldehyde in PBS. These procedures were approved by local institutional Ethics Committee. The brains were removed then put into a sucrose solution overnight at 4 °C before snap freezing in liquid nitrogen cooled isopentane and stored at −80 °C before sectioning. Brains were warmed to −20 °C and a crytostat was used to cut serial slices of 12 micron thickness from each of the brains before adhering to the silicon nitride windows (2 micron thick; a 5 × 5 mm2 window within a 10 × 10 mm2 silicon frame). The brain slices were allowed to air dry overnight before further analysis.29X-ray fluorescence microscopy
For the data acquisition of the primary cultured neurons, imaging data were acquired using the scanning X-ray microprobe at beamlines 2-ID-D and 2-ID-E at the Advanced Photon Source (APS, Argonne, IL) and from the XFM beamline at Australian Synchrotron. For the data collected at APS, incident X-rays of 10 keV energy were chosen to excite elements from P to Zn. A Fresnel zone plate optics (X-radia, Concord, CA) was used to focus the X-ray beam to a spot size of 0.1 × 0.1 μm2 on the specimen. Cells were raster-scanned in steps of 0.4 μm per pixel, and fluorescence spectra were collected for 1 s per pixel dwell time using a three-element UltraLE GE-detector (Canberra, Meridien, CT). Typically a 25 × 25 μm2 area was typically scanned. For “zoomed” images, cells were raster-scanned in steps of 0.1 μm per pixel, and fluorescence spectra were collected for 1 s per pixel dwell time and a 5 × 5 μm2 area was typically scanned for analysis. This approach provided greater contrast in the resulting elemental maps for regions of special interest. For data collected at the Australian Synchrotron, neurons were scanned using a zone-plate nanoprobe (X-radia, Concord, CA) equipped with a single element Vortex-EM energy-dispersive detector.30 As above the 10 keV excitation beam was chosen to excite elemental fluorescence from elements with an atomic number <30. The X-ray focus was around 0.4 μm in diameter, and so cells were raster-scanned in 0.4 μm steps, with fluorescence spectra collected for 1 s per pixel dwell.Metal distributions in the mouse brain sections were mapped using a monochromatic 12.73 keV X-ray beam focused to a FWHM spot size of around 2 microns using the Kirkpatrick–Baez mirror pair. The sample stage was fly scanned (0.128 mm s−1) over a selected region on a window area with a step size of 2 × 2 micron (15.6 ms dwell per 2 μm pixel). Full-spectral images were obtained using the Maia detector and quantitation was performed using GeoPIXE software and by measurement of foils of calibrated area density.31
Quantitation and image-processing
For the primary cell cultures, the quantitation and image-processing of all nanoprobe data were performed using MAPS software32 and standardization to convert the fluorescence signal to a two-dimensional concentration in μg cm−2 was achieved by fitting spectra against the signal derived from thin-film standards NBS-1832 and NBS-1833 (National Bureau of Standards, Gaithersburg, MD). The integrated spectra were generated using the MAPS software and used to calibrate the metal concentrations in each sample analysed (Fig. 1A). The region of interest (ROI) of each cell was determined by tracing around individual cells manually using the MAPS software and the metal content of the highlighted region was used for subsequent analysis (Fig. 1B). For the brain slices, the calibrated images using GeoPIXE software were saved in a tif file format. These files were imported into ImageJ software (1.48 s) and the average pixel intensity was determined for each image slice. The data set was normalized to the average pixel intensity of the wt brain slices.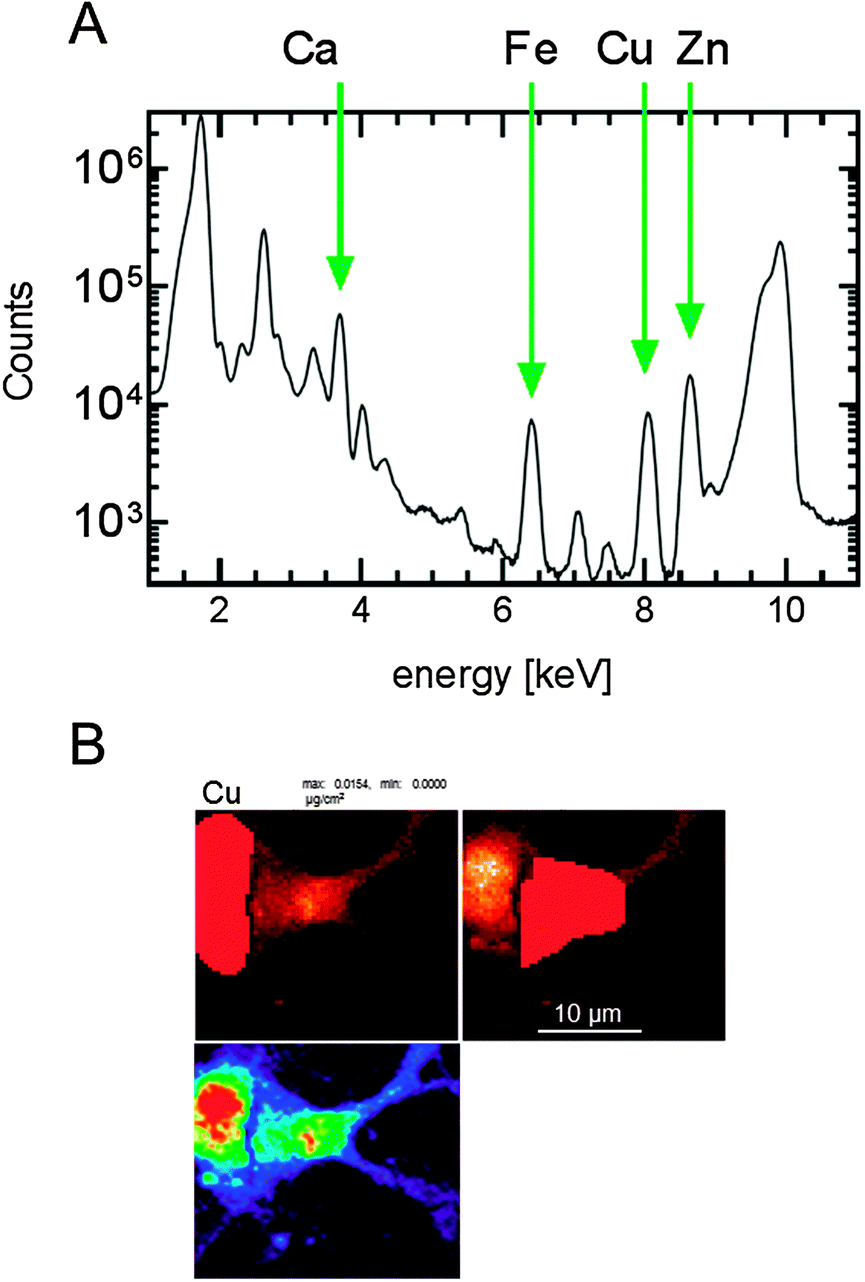 | ||
| Fig. 1 Integrated spectra and ROI analysis of cells. (A) These representative integrated spectra were generated using the MAPS software and used to calibrate the metal concentrations in each sample analysed. (B) The ROI of each cell was determined by tracing around each cell manually using the MAPS software and the metal content of the highlighted region used for subsequent analysis. | ||
Statistical analysis
When comparing the mean of two groups this study made use of Student's t-test, with Welch's correction, to account for unequal variances. When indicated one way analysis of variance (anova) was used to interrogate differences within three or more groups and a post hoc Tukey test was used to identify differences between group means. Throughout this work the significance level is defined as *, #; p < 0.05, **, ##; p < 0.01, ***, ###; p < 0.001. The statistical tests and graphing of data were done using the Graphpad Prism v6 software. Results were presented as mean ± SEM.Results
Neuronal size was increased in mice lacking APLP2
The bioinorganic metabolism of primary cortical neurons from wt, APP−/−, APLP2−/− and APP+/−APLP2−/− mice was investigated by measuring the concentration of various elements in individual neurons derived from the cortex of embryonic day 14 (E14) mice. The concentration and distribution of the different elements were determined at each pixel location and the resultant calibrated data were used to generate elemental maps. The neuronal cell body was manually selected and included only the cell body without extended cell processes (Fig. 1B). The total number of pixels analysed per cell body area was similar for wt (673 ± 60 pixels) and APP−/− (769 ± 92) and was significantly higher in the APLP2−/− (1662 ± 215 pixels, p < 0.01) and APP+/−APLP2−/− (1381 ± 141 pixels, p < 0.05) compared to wt. As expected, the calculated area of the neuronal cell body for wt and the APP−/− genotype was similar while neurons lacking APLP2 proteins (APLP2−/− and APP+/−APLP2−/−) showed at least a two-fold increase in the area size compared to that in the wt (Fig. 2A). Sulphur (S) containing amino acids (Met and Cys) are present within larger proteins in very high concentrations.33,34 Phosphorous (P) is a component of DNA, RNA, and ATP which are mostly concentrated within the nucleus and biological membranes. Therefore to assess whether there were differences in the metabolism of the APP family genotypes, the abundance and distribution of P and S were compared. We found no significant difference in the levels of S and P (Fig. 2B–C) or in the ratio of S/P (data not shown) between mice genotype groups suggesting that the cellular protein content is similar between all 4 genotypes examined.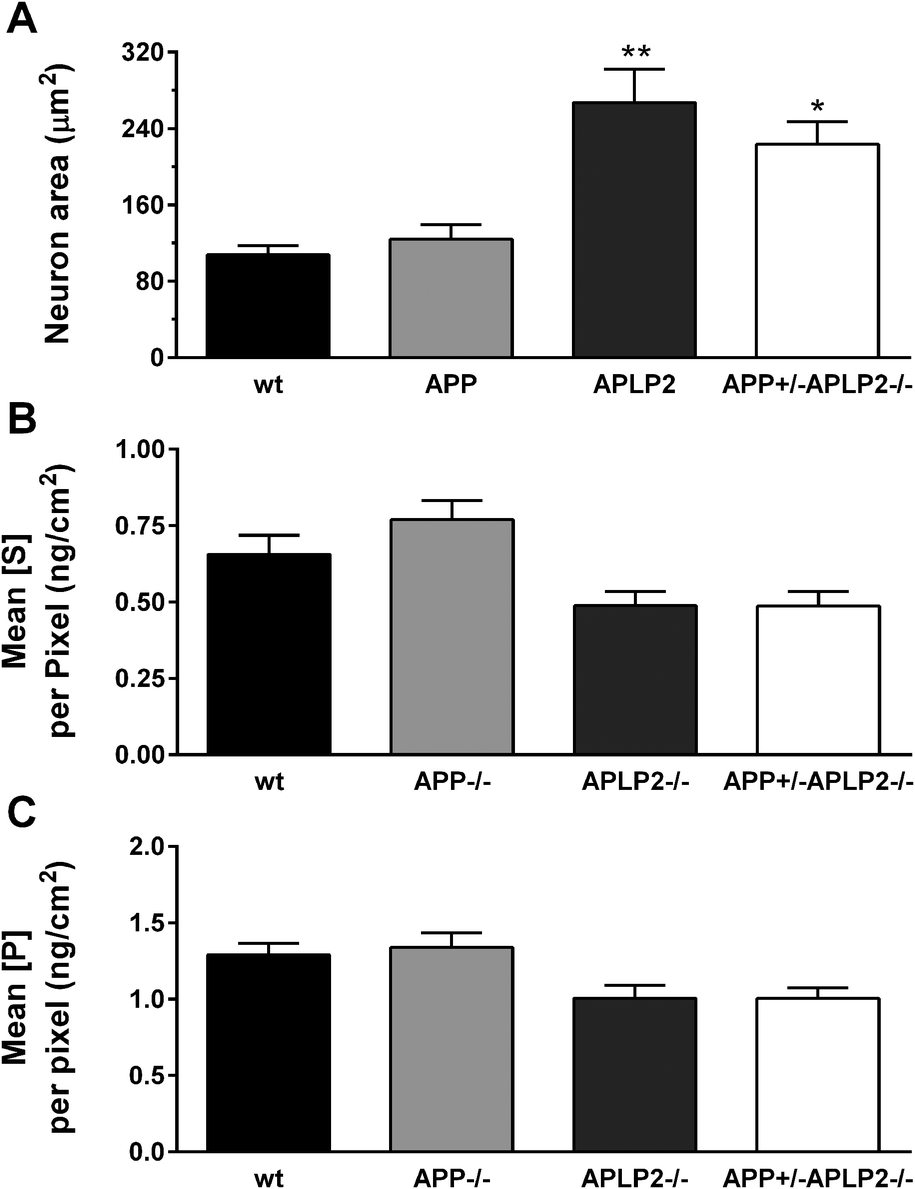 | ||
| Fig. 2 Neuronal area and endogenous S and P levels. The (A) ROI area was calculated and the (B) S and (C) P concentrations per pixel were determined in neurons of the wt, APP−/−, APLP2−/− and APP+/−APLP2−/− type mice. Results are mean ± SEM, n = 5–6. *, p < 0.05; **, p < 0.01 vs. wt. Scale bar = 5 microns. | ||
Cu and Zn concentration distribution maps in neuronal cells
The Cu concentration distribution maps in neuronal cells from wt mice was examined by XFM and the per pixel elemental concentration was presented on a linear color scale (highest = red > yellow > green > blue > purple > black = lowest). The highest areal density of Cu was observed in the cytoplasmic region of the neuron and predominantly localized towards the major axon branching point (Fig. 3A). Higher contrast imaging of selected regions in cells where Cu concentrations were high (Fig. 3B), a portion of the axon from these same cells shown in Fig. 3C, revealed an unremarkable distribution pattern. The Zn concentration distribution maps were similar to those of Cu, with the highest Zn levels present near the axon branching point (Fig. 3D). Higher definition of the cell body and the axon terminal illustrates that Zn levels are more evenly spread throughout these regions compared to Cu (Fig. 3E and F). In addition, the regions with higher concentrations of transition metals overlapped with elevated S (data not shown), consistent with expectations that there will be little solvated Cu or Zn present within the cellular milieu. Furthermore, the ratio of S/Cu in the wt neurons was around 0.07 and at least 10-fold lower compared to what has been reported in astrocytes35 suggesting that the metals would be bound to large cellular proteins such as SOD1.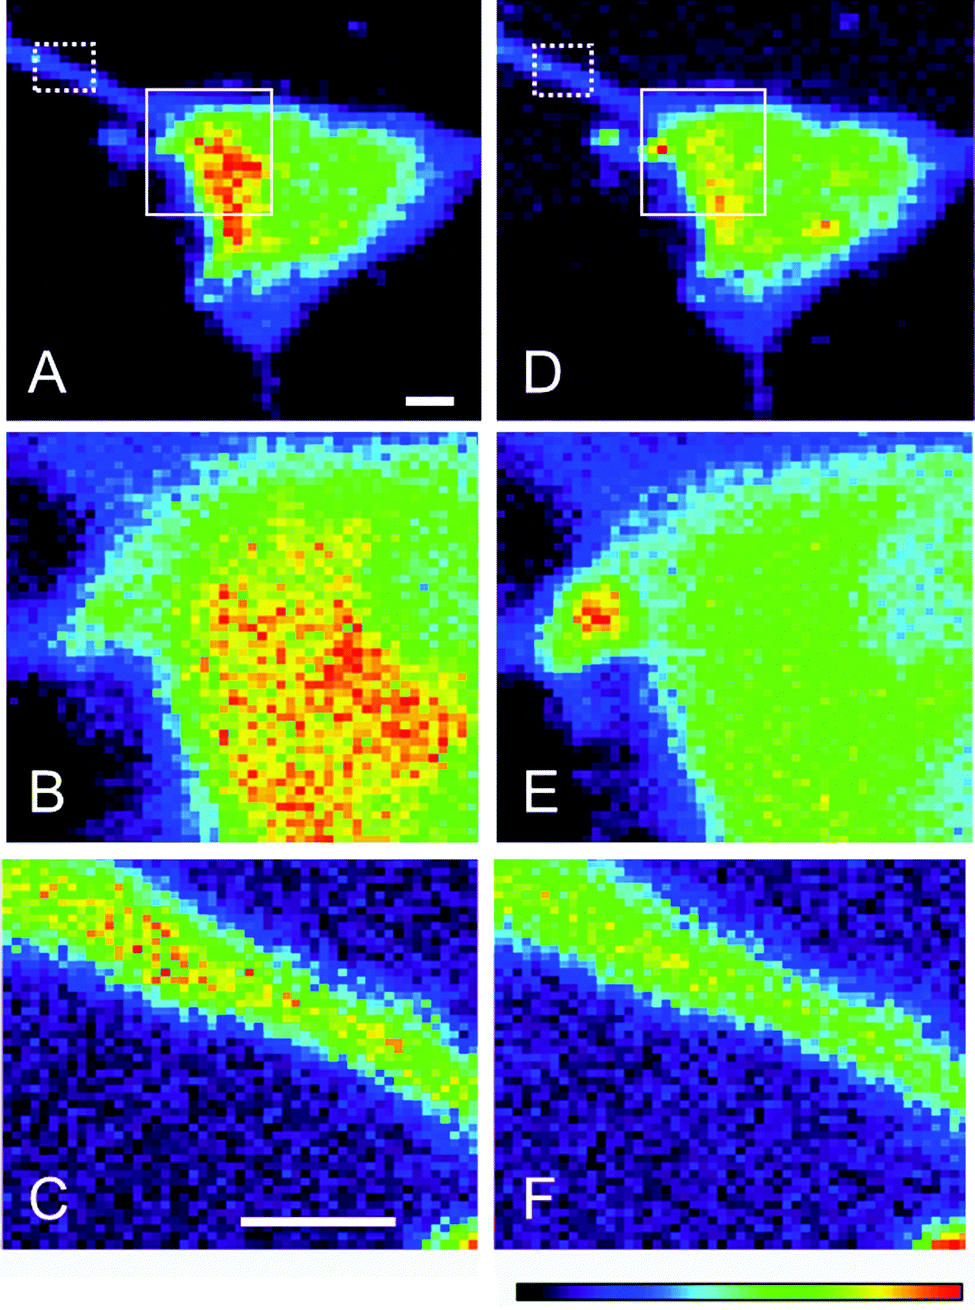 | ||
| Fig. 3 Cu and Zn concentration intensity distribution maps in single neurons from control mice. Endogenous (A) Cu and (D) Zn distribution in neurons with higher resolution area maps for cell body and portion of the axon for Cu (B and C respectively) and Zn (E and F). Scale bar = 2 microns. | ||
Distribution of Cu and Zn shows substantial overlap in neurons of all four genotypes
To test the degree of co-localization between Cu and Zn, the Cu and Zn maps were overlayed and the Cu/Zn ratio was calculated for all 4 genotypes (Fig. 4). The overlay of the Cu (green) and Zn (red) resulted in mostly yellow and green coloured areas in the cells for wt, APLP2−/− and the neurons. The APP−/− neurons were predominantly orange in colour suggesting that there was more Cu than Zn and this was confirmed by calculating a higher Cu/Zn ratio compared to the other 3 genotypes (Fig. 4M). In contrast, the APP+/−APLP2−/− neuron had a lower Cu/Zn ratio compared to the other genotypes, which was significantly lower compared to APP−/− neuron only. Overall, the data highlight that the majority of the cellular Cu and Zn are co-located and this suggests that they are likely bound to metalloproteins such as the Cu/Zn SOD-1 protein36 or metallothionein.35 Neurons derived from all 4 genotypes showed some degree of co-registration indicating that Cu and Zn metabolism is not completely orthogonalized by the loss of APP or its paralogues. | ||
| Fig. 4 Cu and Zn co-localization images of the different mouse knockout genotypes. (A–D) Cu levels in neurons are represented by the red color and (E–H) Zn levels in neurons are shown in green color while the combined (I–L) Cu and Zn images show overlapping areas in yellow color. Primary cortical neurons from wt (A, E, I); APP−/− (B, F, J); APLP2−/− (C, G, K); APP+/−APLP2−/− (D, H, L) mice were compared and the Cu/Zn ratio for each genotype was plotted (M). Results are mean ± SEM, n = 5–6, #, p < 0.05 vs. APP−/−. Scale bar = 5 microns. | ||
Concentrations of Cu and Zn are altered in primary cortical neurons lacking APP and APLP2
The metal concentrations of Cu and Zn were determined in individual neuronal cells from the 4 mouse genotype variants (Fig. 5). The mean Cu concentration per pixel was significantly lower in neurons for both the APP−/− and APLP2−/− (41% and 33% respectively) compared to the wt (Fig. 5M). For the double APP+/−APLP2−/− genotype neurons, the mean Cu concentration per pixel was significantly lower compared to both APLP2−/− and wt (29% and 62% respectively, Fig. 5M). To determine whether there was any variance in the concentration of the metals throughout the neuron, we compared the minimum (min) and maximum (max) metal concentrations per pixel. The min Cu (Fig. 5N) and max Cu (Fig. 5O) concentrations per pixel were similar between the 4 genotypes examined suggesting that the Cu distribution throughout the neuron cell body is fairly uniform considering that at least 600 data points (or pixels) were examined in the wt neurons alone. The total element concentration per neuron, which represents the sum total of each pixel Cu concentration inside each cell body area, was significantly elevated in the APLP2−/− neuron compared to wt and APP−/− and the double APP+/−APLP2−/− neuron (Fig. 5P). The concentration of Zn, like Cu, was significantly lower in the APP−/− and APP+/−APLP2−/− knockout neurons by 59% and 51%, respectively, compared to the wt neurons while the APLP2−/− levels were decreased by 37% and not statistically different (Fig. 5Q). While the minimum Zn concentration per pixel for the APP+/−APLP2−/− mice was significantly lower compared to wt and APP−/− neurons (Fig. 5R), the minimum levels between the wt and single knockout neurons were similar and the max Zn concentration per pixel between the 4 genotypes were similar too (Fig. 5S). The total Zn concentration per neuron was significantly higher only in APLP2−/− compared to APP−/− neurons (Fig. 5T).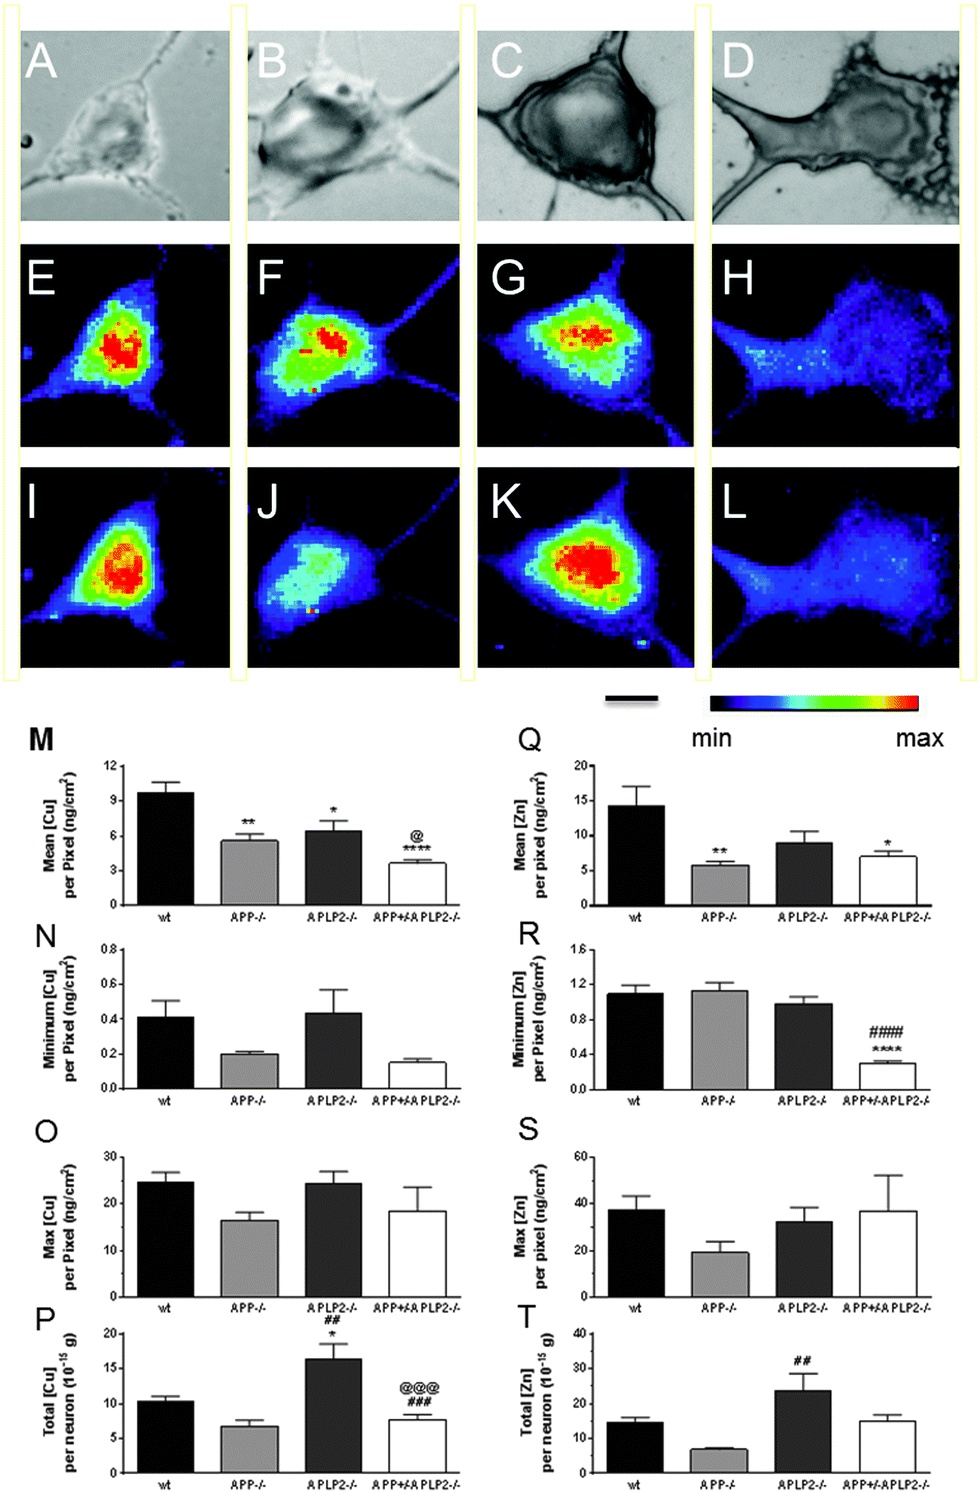 | ||
| Fig. 5 Cu and Zn distribution maps and concentrations in primary cortical neurons from different mice genotypes. Phase images were taken from neurons isolated from (A) wt, (B) APP−/−, (C) APLP2−/− and (D) APP+/−APLP2−/− genotypes examined. The metal distribution maps for Cu (E–H) and Zn (I–L) were prepared for the different genotypes, respectively, with the minimum and maximum (Min–Max) intensity rainbow map settings for Cu (0.6–20 ng cm−2) and Zn (0.6–35 ng cm−2), which were identical across the different mice genotypes examined. The quantitated mean, minimum, maximum and total metal concentrations of Cu (M–P respectively) and Zn (Q–T respectively) were determined for the different mice genotypes. Results are mean ± SEM, n = 5–6. *, p < 0.05; **, p < 0.01, ***, p < 0.001; ****, p < 0.0001 vs. wt, # vs. APP−/−, and @ vs. APLP2−/−. Scale bar = 5 microns. | ||
Localization of transition metals in mouse brain slices
Having established that metal levels are significantly altered in single cultured neurons from embryonic mice, we then examined metal distribution in brain slices from 1 month (Fig. 6A–C and G–I) and 6 month old adult mice (Fig. 6D–F and J–L). We compared the metal distribution patterns on a gross scale examining the hippocampal and cortical regions in the wt mice brains compared to the single knockout mice brain tissue slices only. Unlike the analysis of neurons at the single cell level, we did not observe any differences in the distribution patterns of Cu (Fig. 6A–F) and Zn (Fig. 6G–L) throughout the tissue slices between the different genotypes and between the two different age groups at the gross anatomical level. Further analysis of the brain slices were performed and the average pixel intensity levels were measured in the brain slices for Cu and Zn (Fig. 6M and N respectively) and scanned intensity levels normalized to the 1 month old wt brain tissue slice. This analysis showed that the Cu concentrations were lower for the APP and APLP2 KO brain slices compared to wt but this was not found to be statistically different. However we did find that the Cu levels were significantly higher at 6 months of age compared to 1 month for wt only (Fig. 6M). Zn levels across the 3 genotypes and two age groups were relatively unchanged (Fig. 6N). | ||
| Fig. 6 Cu and Zn distribution maps and pixel intensity quantitation in 1 and 6 month old adult brain slices from different mice genotypes. Metal distribution maps for Cu (A–F) and Zn (G and H) were prepared for 1 month (A–C, G–I) and 6 month (D–F, J–L) old adult mice brains from wt (A, G, D, J), APP−/− (B, H, E, K), and APLP2−/− (C, I, F, L). The Cu (M) and Zn (N) pixel intensity levels were quantitated for the adult brain slices and the data were normalized to the 1 month old wt group. Results are mean ± SEM. n = 3. Scale bar = 1 mm. | ||
Concentration of Fe is altered in primary cortical neurons lacking APP and APLP2
The distribution of Fe in neurons differs considerably from Cu and Zn, where it is found to be much more concentrated and limited to only a few pixels in all genotypes examined (Fig. 7). The mean Fe concentration per pixel was significantly lower in APLP2−/− and APP+/−APLP2−/− neurons only (Fig. 7E). While the min and max Fe concentrations per pixel were not statistically different between the 4 mouse genotypes examined, there is a greater than 150-fold difference in the concentration of Fe between the lowest and highest Fe concentrations (Fig. 7F and G) compared to a 60- to 70-fold difference that was calculated for the Cu and Zn elements (Fig. 5). Total Fe concentration per neuron was significantly higher in the APLP2−/− neuron compared to the wt neuron. | ||
| Fig. 7 Fe distribution maps and concentrations in primary cortical neurons from different mice genotypes. Metal distribution maps of neurons isolated from (A) wt, (B) APP−/−, (C) APLP2−/− and (D) APP+/−APLP2−/− genotypes were examined and the minimum and maximum (Min–Max) intensity settings for Fe (0.6–90 ng cm−2) were identical across the different mice genotypes examined. The Fe levels were quantitated and the (E) mean, (F) minimum, (G) maximum and (H) total metal concentrations were calculated for the different mice genotypes examined. Results are mean ± SEM, n = 5–6. *, p < 0.05; vs. wt. Scale bar = 5 microns. | ||
Concentration of Ca is dramatically decreased in primary cortical neurons lacking APP and APLP2 expression
The mean Ca concentration per pixel in the single APP−/− and APLP2−/− and double knockout APP+/−APLP2−/− neurons was significantly lower compared to the wt neurons (Fig. 8E). In fact, even the min and max and total Ca concentrations per pixel were significantly lower in the neurons from the knockout mice compared to that from the wt (Fig. 8F, G, H respectively). However, the Ca concentration in the knockout mice genotypes were similar for each analysis group. In addition, the knockout neurons contain on average, around 80% less Ca compared to the wt neurons across all parameters examined.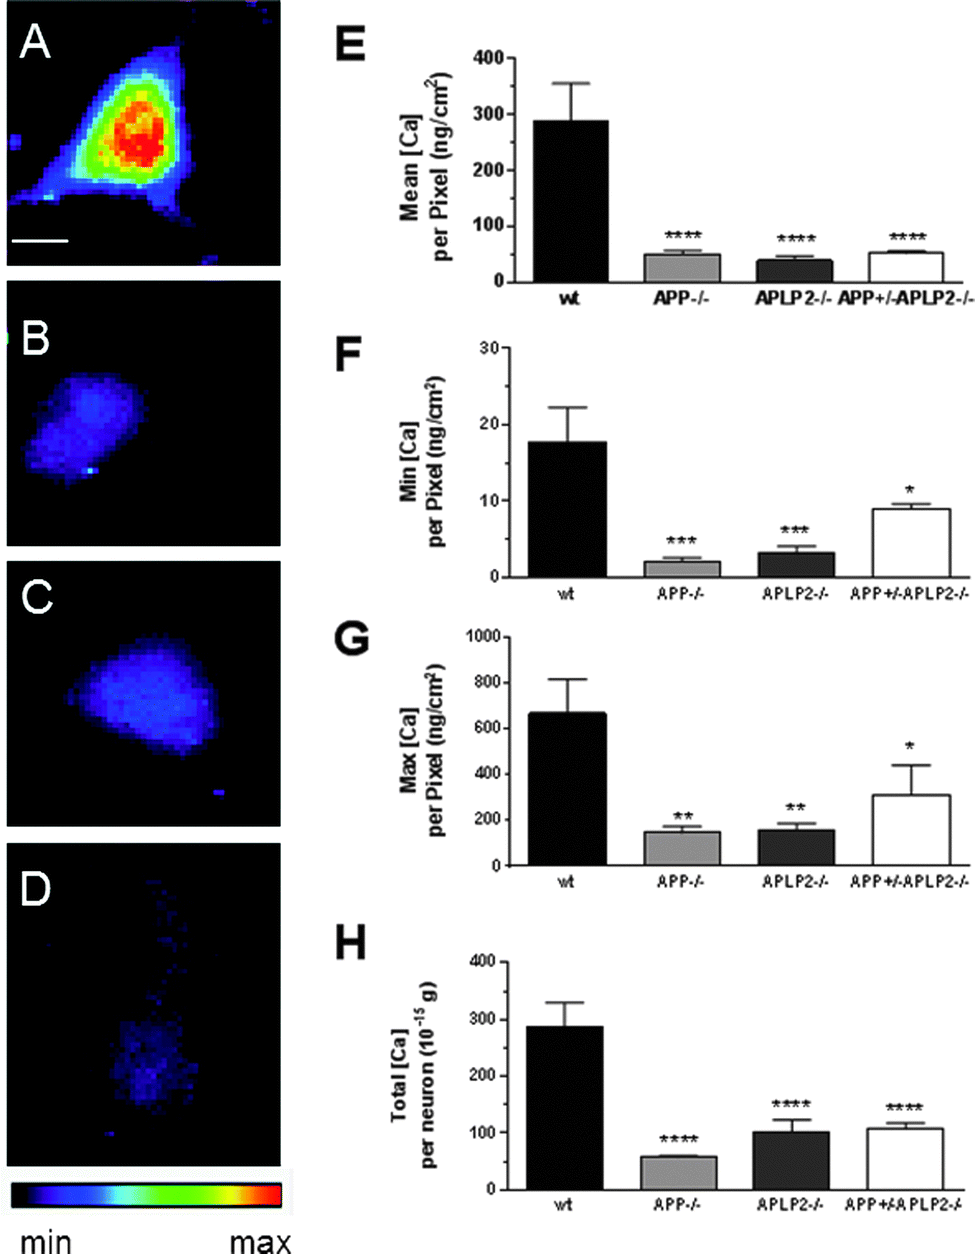 | ||
| Fig. 8 Ca distribution maps and concentrations in primary cortical neurons from different mice genotypes. Metal distribution maps of neurons isolated from (A) wt, (B) APP−/−, (C) APLP2−/− and (D) APP+/−APLP2−/− genotypes were examined and the minimum and maximum (Min–Max) intensity settings for Ca (2–700 ng cm−2) were identical across the different mice genotypes examined. The (E) mean, (F) minimum, (G) maximum and (H) total metal concentrations were calculated for the different mice genotypes examined. Results are mean ± SEM, n = 5–6. *, p < 0.05; vs. wt. Scale bar = 5 microns. | ||
The frequency distribution of the Cu, Zn and Ca concentrations per pixel within the cell body area was altered in neurons lacking APP or APLP2 expression
To get a better understanding of the metal homeostasis within a cell, the XFS technique was used to measure metal concentrations at a resolution of 0.1 μm2 per pixel therefore generating from 600 to 1600 data points per neuron for analysis. The metal concentrations of each pixel were binned into narrow concentration ranges (0.002 μg cm−2 for Cu, Zn, and Fe and 0.05 for Ca) and the frequency distribution data set was normalized to the total number of pixels analysed per cell. Using this procedure, we observed a striking difference in the distribution patterns of the Cu, Zn, and Ca elements when comparing the wt mice to mice lacking APP or APLP2 (Fig. 9). In wt neurons, Cu and Zn displayed a bimodal distribution pattern; a lower concentration range peaks at 4–6 and 6–8 μg cm−2 and at 2- to 3-fold higher range of 12–14 and 14–16 μg cm−2, respectively. While in neurons lacking APP or APLP2, the peak at the higher concentration range (as denoted by the arrow in Fig. 9A and B) is no longer evident, rather a single peak was observed at a lower concentration of 2–4 μg cm−2 for both metals. The concentration and distribution pattern of Fe was similar across the four mice genotypes with the majority of the Fe concentration distribution pattern ranging between 2 and 4 μg cm−2. The concentration of Fe in the few pixels colored red on the elemental distribution MAPS (Fig. 7) was at least 10- to 50-fold higher (see * in Fig. 9C). Unlike Cu and Zn which had a clear bimodal distribution pattern, the distribution frequency of the Ca metal concentration was simply uniform across a broad range (100 to 350 μg cm−2) in the wt neurons while in the cells lacking APP or APLP2, a single narrow peak with a concentration range of 0–5 μg cm−2 was observed (Fig. 9D).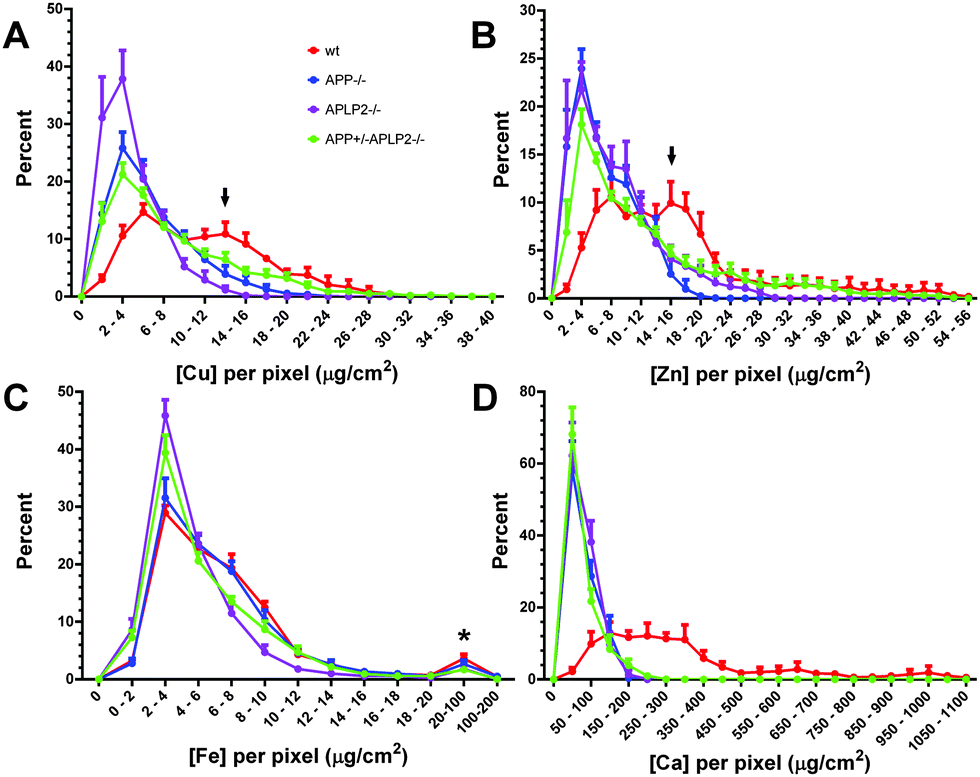 | ||
| Fig. 9 Analysis of the selected metal concentration per pixel in primary cortical neurons from different mice genotypes. For comparison between genotypes, the metal concentration per pixel for each neuronal cell body area was examined by binning the data set and plotting the normalized frequency distribution for each metal (A) Cu, (B) Zn, (C) Fe, and (D) Ca. Results are mean ± SEM, n = 5–6. | ||
Discussion
APP and APLP2 are important modulators of brain metal homeostasis since altering APP and APLP2 expression levels is associated with significant changes in Cu, Zn and Fe homeostasis.7–9,13,24,37 While previous studies examined metal levels in whole brains or in whole cell culture models using inductively coupled plasma mass spectrometry (ICP-MS) or atomic absorption spectrometry, this current study used XFM to both localize and quantitate metal levels in response to changes in APP-family expression. The advantage of using XFM is that it provides high elemental sensitivity for investigating medium to high trace metal elements, irrespective of its coordination or redox status, and provide a higher level of resolution, thereby enabling greater quantitative information and spatial mapping of metal elements in biological structures at the submicron scale. Analysis of the elemental maps and examination of the frequency distribution of the metal concentrations showed a dramatic shift in the manner in which neurons can store the metal elements. Not only were the concentrations of the Cu, Zn, and Fe significantly altered in neurons lacking APP and or APLP2 expression, now we can also include Ca in this list of metals that are significantly altered. Therefore, using this technology, we were able to extend our understanding of how APP and APLP2 protein expression affects metal homeostasis and cellular distribution in neurons at the single cell level.Under basal culture conditions, endogenous APP normally resides in a perinuclear location in the neuron38 and it will redistribute to the plasma or Golgi compartment depending on whether the Cu concentration in the conditioned media is removed by chelation or elevated.39 Under basal culture conditions, we observed that the highest accumulation of Cu was localized to the cytoplasmic compartment of the cell with an apparent peri-nucleus localization as illustrated by the red colored pixels shown in the elemental distribution maps (Fig. 5). This Cu distribution pattern was similarly seen in different cell types such as endothelial and fibroblasts.35,40,41 Although the images illustrating the Cu elemental maps for APP and APLP2 knockout neurons were similar, the cellular Cu levels were significantly altered compared to wt. By further analysis of the Cu concentrations at each pixel, we discovered that the Cu concentration appears to exist in a binomial manner in wt neurons, while in the neurons from the knockout mice, only a lower concentration peak distribution was observed suggesting that expression of both APP and APLP2 proteins is important for maintaining Cu homeostasis in neurons. Like the neurons in culture, Cu levels in brain slices from adult mice were 10–20% and 50% lower from 1 and 6 month old mice, respectively, but these levels were not statistically significant, which is most likely due to the limited number of brain slices that were examined in this experiment. In addition, Cu levels were higher in the 6 month old brains compared to the 1 month old brains for all genotypes examined confirming that brain Cu levels increase with age.9
In the APP gene family, Cu and Zn bind to the E2 domain and mediate the oligomerisation of APP but not APLP2.42 Like Cu, the mean Zn concentration per pixel was significantly decreased in APP−/− and APLP2−/− APP+/−, but not in the APLP2−/− cells. While the total Zn concentration per neuron was still significantly lower in the APP−/− neurons, conversely, like Cu, the total Zn concentration per neuron was significantly higher in APLP2−/− neurons. The higher total Zn concentration in the embryonic APLP2−/− neurons can explain why total Zn concentration levels in whole mouse brain were significantly elevated in adult APLP2−/− mice.9 Like Cu, the Zn concentration per pixel analysis showed a similar alteration from a binomial to unimodal concentration distribution in the neurons lacking the APP gene family of proteins. Therefore, the higher Zn concentration measured in these neurons suggests that APLP2 also has a regulatory role in neuronal Zn homeostasis.
Based on our ROI analysis data, the size of the primary cortical neurons which lack APLP2 expression was significantly larger compared to the wt and APPKO neurons suggesting that APLP2 may be important for regulating neuronal morphology. These size differences do not reflect changes in viability since we (data not shown) and others5 saw no significant differences in plating efficiency or viability in culture. This significant increase in the neuronal size contrasts with the observation that the APLP2−/− mice (both single and double−/−) have significantly reduced body weights and diminished head widths compared to wt.6 In contrast, neurons lacking APP expression have a similar size to the wt neurons suggesting that it has a redundant role in maintaining the neuronal cell size.
APP can facilitate Fe export from cells with APP−/− neurons exposed to Fe retaining more Fe after treatment compared to wt cells.7 In this study, the mean Fe concentration per pixel in neurons under basal conditions was significantly lower in APLP2−/− neurons while the total amount of Fe was significantly higher. This higher concentration could be explained by the larger cell size observed for APLP2−/− neurons. In contrast, no changes in Fe levels were observed for the APP−/− neurons compared to wt. In whole brain, the Fe concentration was significantly higher in APP−/− at 12 and 18 m compared to wt while in APLP2−/− brains, Fe was significantly lower at the younger, three month time point only.9 These results confirm that APP has a more important role in regulating basal Fe levels in older adult brains while APLP2 may affect Fe homeostasis in embryonic neurons.
A novel finding of the present study is the large decrease in Ca levels in neurons from both single and APP+/−APLP2−/− mice compared to wt mice. The reduction in intracellular Ca stores could explain the poor muscle function/reduced grip strength and locomotor activity,43 decreased brain synaptic activity and spatial learning activities.44,45 Synaptic transmission is largely regulated by the activation of N- and L-type Ca channels and concomitant release of pools of Ca into the synaptic cleft from nerve terminals and assists in the activation of post synaptic sites such as the neuromuscular junction.46 Yang et al. proposed that Ca homeostasis is regulated by APP since they observed increased asynchronous release during repetitive stimulation of the neuromuscular junction in APP−/− mice.46 This may, in part, be explained by Ca levels being significantly decreased in the plasma of embryonic APP and APLP2−/−.6
Conclusions
We have provided new insights into the effects of APP and APLP2 expression on the subcellular localization and distribution of Cu, Fe, Zn, and Ca in neurons, as well as further defined their role in metal homeostasis. These studies add to the growing body of data that the APP-family of proteins are metalloproteins that have shared as well as distinct effects on metals. As we continue to delineate the cellular effects of the APP family of proteins it is important to consider how metals are involved in their actions.Acknowledgements
This work was supported by funds from the Australian Research Council, the Australian National Health and Medical Research Council and Operational Infrastructure Support Victorian State Government. This research used resources of the Advanced Photon Source, a U.S. Department of Energy (DOE) Office of Science User Facility operated for the DOE Office of Science by Argonne National Laboratory under Contract No. DE-AC02-06CH11357. Access was made possible through the financial assistance of the Australian Synchrotron Research Fund (proposal AS_IA083/APS10858). We acknowledge travel funding provided by the International Synchrotron Access Program managed by the Australian Synchrotron and funded by the Australian Government. Part of this research was undertaken on the XFM beamline at the Australian Synchrotron, Victoria, Australia.References
- W. Wasco, S. Gurubhagavatula, M. D. Paradis, D. M. Romano, S. S. Sisodia, B. T. Hyman, R. L. Neve and R. E. Tanzi, Isolation and characterization of APLP2 encoding a homologue of the Alzheimer's associated amyloid beta protein precursor, Nat. Genet., 1993, 5, 95–100 CrossRef CAS PubMed.
- D. M. Walsh, A. M. Minogue, C. Sala Frigerio, J. V. Fadeeva, W. Wasco and D. J. Selkoe, The APP family of proteins: similarities and differences, Biochem. Soc. Trans., 2007, 35, 416–420 CrossRef CAS PubMed.
- U. C. Müller and H. Zheng, Physiological Functions of APP Family Proteins, Cold Spring Harbor Perspect. Med., 2012, 4, a006288 Search PubMed.
- B. J. Crain, W. Hu, C. I. Sze, H. H. Slunt, E. H. Koo, D. L. Price, G. Thinakaran and S. S. Sisodia, Expression and distribution of amyloid precursor protein-like protein-2 in Alzheimer's disease and in normal brain, Am. J. Pathol., 1996, 149, 1087–1095 CAS.
- S. Heber, J. Herms, V. Gajic, J. Hainfellner, A. Aguzzi, T. Rulicke, H. von Kretzschmar, C. von Koch, S. Sisodia, P. Tremml, H. P. Lipp, D. P. Wolfer and U. Müller, Mice with combined gene knock-outs reveal essential and partially redundant functions of amyloid precursor protein family members, J. Neurosci., 2000, 20, 7951–7963 CAS.
- B. Needham, M. Wlodek, G. Ciccotosto, B. Fam, C. Masters, J. Proietto, S. Andrikopoulos and R. Cappai, Identification of the Alzheimer's disease amyloid precursor protein (APP) and its homologue APLP2 as essential modulators of glucose and insulin homeostasis and growth, J. Pathol., 2008, 215, 155–163 CrossRef CAS PubMed.
- J. A. Duce, A. Tsatsanis, M. A. Cater, S. A. James, E. Robb, K. Wikhe, S. L. Leong, K. Perez, T. Johanssen, M. A. Greenough, H. H. Cho, D. Galatis, R. D. Moir, C. L. Masters, C. McLean, R. E. Tanzi, R. Cappai, K. J. Barnham, G. D. Ciccotosto, J. T. Rogers and A. I. Bush, Iron-export ferroxidase activity of beta-amyloid precursor protein is inhibited by zinc in Alzheimer's disease, Cell, 2010, 142, 857–867 CrossRef CAS PubMed.
- S. A. Bellingham, G. D. Ciccotosto, B. E. Needham, L. R. Fodero, A. R. White, C. L. Masters, R. Cappai and J. Camakaris, Gene knockout of amyloid precursor protein and amyloid precursor-like protein-2 increases cellular copper levels in primary mouse cortical neurons and embryonic fibroblasts, J. Neurochem., 2004, 91, 423–428 CrossRef CAS PubMed.
- B. E. Needham, G. D. Ciccotosto and R. Cappai, Combined deletions of amyloid precursor protein and amyloid precursor-like protein 2 reveal different effects on mouse brain metal homeostasis, Metallomics, 2014, 6, 598–603 RSC.
- L. Hesse, D. Beher, C. L. Masters and G. Multhaup, The beta A4 amyloid precursor protein binding to copper, FEBS Lett., 1994, 349, 109–116 CrossRef CAS.
- G. Multhaup, A. Schlicksupp, L. Hesse, D. Beher, T. Ruppert, C. L. Masters and K. Beyreuther, The amyloid precursor protein of Alzheimer's disease in the reduction of copper(II) to copper(I), Science, 1996, 271, 1406–1409 CAS.
- F. H. Ruiz, M. González, M. Bodini, C. Opazo and N. C. Inestrosa, Cysteine 144 Is a Key Residue in the Copper Reduction by the β-Amyloid Precursor Protein, J. Neurochem., 1999, 73, 1288–1292 CrossRef CAS.
- A. R. White, R. Reyes, J. F. Mercer, J. Camakaris, H. Zheng, A. I. Bush, G. Multhaup, K. Beyreuther, C. L. Masters and R. Cappai, Copper levels are increased in the cerebral cortex and liver of APP and APLP2 knockout mice, Brain Res., 1999, 842, 439–444 CrossRef CAS.
- K. J. Barnham, W. J. McKinstry, G. Multhaup, D. Galatis, C. J. Morton, C. C. Curtain, N. A. Williamson, A. R. White, M. G. Hinds, R. S. Norton, K. Beyreuther, C. L. Masters, M. W. Parker and R. Cappai, Structure of the Alzheimer's disease amyloid precursor protein copper binding domain. A regulator of neuronal copper homeostasis, J. Biol. Chem., 2003, 278, 17401–17407 CrossRef CAS PubMed.
- J. Gitschier, B. Moffat, D. Reilly, W. I. Wood and W. J. Fairbrother, Solution structure of the fourth metal-binding domain from the Menkes copper-transporting ATPase, Nat. Struct. Biol., 1998, 5, 47–54 CrossRef CAS PubMed.
- F. Arnesano, L. Banci, I. Bertini, D. L. Huffman and T. V. O'Halloran, Solution structure of the Cu(I) and apo forms of the yeast metallochaperone, Atx, 1, Biochemistry, 2001, 40, 1528–1539 CrossRef CAS PubMed.
- A. L. Lamb, A. K. Wernimont, R. A. Pufahl, V. C. Culotta, T. V. O'Halloran and A. C. Rosenzweig, Crystal structure of the copper chaperone for superoxide dismutase, Nat. Struct. Biol., 1999, 6, 724–729 CrossRef CAS PubMed.
- C. J. Maynard, R. Cappai, I. Volitakis, R. A. Cherny, A. R. White, K. Beyreuther, C. L. Masters, A. I. Bush and Q.-X. Li, Overexpression of Alzheimer's Disease Amyloid-beta Opposes the Age-dependent Elevations of Brain Copper and Iron, J. Biol. Chem., 2002, 277, 44670–44676 CrossRef CAS PubMed.
- A. L. Phinney, B. Drisaldi, S. D. Schmidt, S. Lugowski, V. Coronado, Y. Liang, P. Horne, J. Yang, J. Sekoulidis, J. Coomaraswamy, M. A. Chishti, D. W. Cox, P. M. Mathews, R. A. Nixon, G. A. Carlson, P. St George-Hyslop and D. Westaway, In vivo reduction of amyloid-beta by a mutant copper transporter, Proc. Natl. Acad. Sci. U. S. A., 2003, 100, 14193–14198 CrossRef CAS PubMed.
- T. A. Bayer, S. Schafer, A. Simons, A. Kemmling, T. Kamer, R. Tepest, A. Eckert, K. Schussel, O. Eikenberg, C. Sturchler-Pierrat, D. Abramowski, M. Staufenbiel and G. Multhaup, Dietary Cu stabilizes brain superoxide dismutase 1 activity and reduces amyloid Abeta production in APP23 transgenic mice, Proc. Natl. Acad. Sci. U. S. A., 2003, 100, 14187–14192 CrossRef CAS PubMed.
- D. Kaden, A. I. Bush, R. Danzeisen, T. A. Bayer and G. Multhaup, Disturbed copper bioavailability in Alzheimer's disease, Int. J. Alzheimer's Dis., 2011, 2011, 345614 Search PubMed.
- A. L. Phinney, B. Drisaldi, S. D. Schmidt, S. Lugowski, V. Coronado, Y. Liang, P. Horne, J. Yang, J. Sekoulidis, J. Coomaraswamy, M. A. Chishti, D. W. Cox, P. M. Mathews, R. A. Nixon, G. A. Carlson, P. S. George-Hyslop and D. Westaway, In vivo reduction of amyloid-{beta} by a mutant copper transporter, Proc. Natl. Acad. Sci. U. S. A., 2003, 100, 14193–14198 CrossRef CAS PubMed.
- T. A. Bayer, S. Schafer, A. Simons, A. Kemmling, T. Kamer, R. Tepests, A. Eckert, K. Schussel, O. Eikenberg, C. Sturchler-Pierrat, D. Abramowski, M. Staufenbiel and G. Multhaup, Dietary Cu stabilizes brain superoxide dismutase 1 activity and reduces amyloid A{beta} production in APP23 transgenic mice, Proc. Natl. Acad. Sci. U. S. A., 2003, 100, 14187–14192 CrossRef CAS PubMed.
- C. J. Maynard, R. Cappai, I. Volitakis, R. A. Cherny, A. R. White, K. Beyreuther, C. L. Masters, A. I. Bush and Q. X. Li, Overexpression of Alzheimer's disease amyloid-beta opposes the age-dependent elevations of brain copper and iron, J. Biol. Chem., 2002, 277, 44670–44676 CrossRef CAS PubMed.
- H. Zheng, M. Jiang, M. E. Trumbauer, D. J. Sirinathsinghji, R. Hopkins, D. W. Smith, R. P. Heavens, G. R. Dawson, S. Boyce and M. W. Conner, et al., beta-Amyloid precursor protein-deficient mice show reactive gliosis and decreased locomotor activity, Cell, 1995, 81, 525–531 CrossRef CAS.
- C. S. von Koch, H. Zheng, H. Chen, M. Trumbauer, G. Thinakaran, L. H. van der Ploeg, D. L. Price and S. S. Sisodia, Generation of APLP2 KO mice and early postnatal lethality in APLP2/APP double KO mice, Neurobiol. Aging, 1997, 18, 661–669 CrossRef CAS.
- G. D. Ciccotosto, D. Tew, C. C. Curtain, D. Smith, D. Carrington, C. L. Masters, A. I. Bush, R. A. Cherny, R. Cappai and K. J. Barnham, Enhanced toxicity and cellular binding of a modified amyloid beta peptide with a methionine to valine substitution, J. Biol. Chem., 2004, 279, 42528–42534 CrossRef CAS PubMed.
- G. D. Ciccotosto, D. J. Tew, S. C. Drew, D. G. Smith, T. Johanssen, V. Lal, T. L. Lau, K. Perez, C. C. Curtain, J. D. Wade, F. Separovic, C. L. Masters, J. P. Smith, K. J. Barnham and R. Cappai, Stereospecific interactions are necessary for Alzheimer disease amyloid-beta toxicity, Neurobiol. Aging, 2011, 32, 235–248 CrossRef CAS PubMed.
- M. J. Hackett, J. A. McQuillan, F. El-Assaad, J. B. Aitken, A. Levina, D. D. Cohen, R. Siegele, E. A. Carter, G. E. Grau, N. H. Hunt and P. A. Lay, Chemical alterations to murine brain tissue induced by formalin fixation: implications for biospectroscopic imaging and mapping studies of disease pathogenesis, Analyst, 2011, 136, 2941–2952 RSC.
- D. Paterson, M. D. de Jonge, D. L. Howard, W. Lewis, J. McKinlay, A. Starritt, M. Kusel, C. G. Ryan, R. Kirkham, G. Moorhead and D. P. Siddons, The X-ray Fluorescence Microscopy Beamline at the Australian Synchrotron, AIP Conf. Proc., 2011, 1365, 219–222 CrossRef PubMed.
- C. G. Ryan, E. van Achterbergh, C. J. Yeats, T. Tin Win and G. Cripps, Quantitative PIXE trace element imaging of minerals using the new CSIRO–GEMOC Nuclear Microprobe, Nucl. Instrum. Methods Phys. Res., Sect. B, 2002, 189, 400–407 CrossRef CAS.
- S. Vogt, MAPS: A set of sofware tools for analysis and visualization of 3D X-ray fluorescence data sets., J. Phys. IV, 2003, 104, 635–638 CAS.
- L. Brocchieri and S. Karlin, Protein length in eukaryotic and prokaryotic proteomes, Nucleic Acids Res., 2005, 33, 3390–3400 CrossRef CAS PubMed.
- J. T. Brosnan and M. E. Brosnan, The sulfur-containing amino acids: an overview, J. Nutr., 2006, 136, 1636S–1640S CAS.
- Y. Pushkar, G. Robison, B. Sullivan, S. X. Fu, M. Kohne, W. Jiang, S. Rohr, B. Lai, M. A. Marcus, T. Zakharova and W. Zheng, Aging results in copper accumulations in glial fibrillary acidic protein-positive cells in the subventricular zone, Aging Cell, 2013, 12, 823–832 CrossRef CAS PubMed.
- H. L. Lelie, A. Liba, M. W. Bourassa, M. Chattopadhyay, P. K. Chan, E. B. Gralla, L. M. Miller, D. R. Borchelt, J. S. Valentine and J. P. Whitelegge, Copper and zinc metallation status of copper-zinc superoxide dismutase from amyotrophic lateral sclerosis transgenic mice, J. Biol. Chem., 2011, 286, 2795–2806 CrossRef CAS PubMed.
- A. R. White, R. Reyes, J. F. Mercer, J. Camakaris, H. Zheng, A. I. Bush, G. Multhaup, K. Beyreuther, C. L. Masters and R. Cappai, Copper levels are increased in the cerebral cortex and liver of APP and APLP2 knockout mice, Brain Res., 1999, 842, 439–444 CrossRef CAS.
- G. Palacios, J. M. Palacios, G. Mengod and P. Frey, Beta-amyloid precursor protein localization in the Golgi apparatus in neurons and oligodendrocytes. An immunocytochemical structural and ultrastructural study in normal and axotomized neurons, Mol. Brain Res., 1992, 15, 195–206 CrossRef CAS.
- K. M. Acevedo, Y. H. Hung, A. H. Dalziel, Q. X. Li, K. Laughton, K. Wikhe, A. Rembach, B. Roberts, C. L. Masters, A. I. Bush and J. Camakaris, Copper promotes the trafficking of the amyloid precursor protein, J. Biol. Chem., 2011, 286, 8252–8262 CrossRef CAS PubMed.
- L. Finney, S. Mandava, L. Ursos, W. Zhang, D. Rodi, S. Vogt, D. Legnini, J. Maser, F. Ikpatt, O. I. Olopade and D. Glesne, X-ray fluorescence microscopy reveals large-scale relocalization and extracellular translocation of cellular copper during angiogenesis, Proc. Natl. Acad. Sci. U. S. A., 2007, 104, 2247–2252 CrossRef CAS PubMed.
- L. Yang, R. McRae, M. M. Henary, R. Patel, B. Lai, S. Vogt and C. J. Fahrni, Imaging of the intracellular topography of copper with a fluorescent sensor and by synchrotron X-ray fluorescence microscopy, Proc. Natl. Acad. Sci. U. S. A., 2005, 102, 11179–11184 CrossRef CAS PubMed.
- M. C. Mayer, D. Kaden, L. Schauenburg, M. A. Hancock, P. Voigt, D. Roeser, C. Barucker, M. E. Than, M. Schaefer and G. Multhaup, Novel Zinc-binding Site in the E2 Domain Regulates Amyloid Precursor-like Protein 1 (APLP1) Oligomerization, J. Biol. Chem., 2014, 289, 19019–19030 CrossRef CAS PubMed.
- H. Zheng, M. Jiang, M. E. Trumbauer, D. J. Sirinathsinghji, R. Hopkins, D. W. Smith, R. P. Heavens, G. R. Dawson, S. Boyce, M. W. Conner, K. A. Stevens, H. H. Slunt, S. S. Sisoda, H. Y. Chen and L. H. Van der Ploeg, beta-Amyloid precursor protein-deficient mice show reactive gliosis and decreased locomotor activity, Cell, 1995, 81, 525–531 CrossRef CAS.
- Z. Wang, B. Wang, L. Yang, Q. Guo, N. Aithmitti, Z. Songyang and H. Zheng, Presynaptic and postsynaptic interaction of the amyloid precursor protein promotes peripheral and central synaptogenesis, J. Neurosci., 2009, 29, 10788–10801 CrossRef CAS PubMed.
- G. R. Seabrook, D. W. Smith, B. J. Bowery, A. Easter, T. Reynolds, S. M. Fitzjohn, R. A. Morton, H. Zheng, G. R. Dawson, D. J. Sirinathsinghji, C. H. Davies, G. L. Collingridge and R. G. Hill, Mechanisms contributing to the deficits in hippocampal synaptic plasticity in mice lacking amyloid precursor protein, Neuropharmacology, 1999, 38, 349–359 CrossRef CAS.
- L. Yang, B. Wang, C. Long, G. Wu and H. Zheng, Increased asynchronous release and aberrant calcium channel activation in amyloid precursor protein deficient neuromuscular synapses, Neuroscience, 2007, 149, 768–778 CrossRef CAS PubMed.
| This journal is © The Royal Society of Chemistry 2014 |