 Open Access Article
Exploring the meaning of sugar configuration in a supramolecular environment: comparison of six octyl glycoside micelles by ITC and NMR spectroscopy†
Jörn
Schmidt-Lassen
and
Thisbe K.
Lindhorst
*
Otto Diels Institute of Organic Chemistry, Christiana Albertina University of Kiel, Otto-Hahn-Platz 3-4, D-24098 Kiel, Germany. E-mail: tklind@oc.uni-kiel.de
First published on 30th May 2014
Abstract
A series of octyl α- and β-glycosides of the manno- galacto- and gluco-series were synthesized and employed in formation of homo- and hetero-micelles in water. Critical micelle concentrations (cmc), thermodynamic quantities of demicellation and, to some extent, the hydrodynamic radii of glycomicelles were determined by isothermal titration calorimetry (ITC) and diffusion NMR studies. The goal of this work was to determine the significance of anomeric configuration as well as of epimerisation at the sugar ring for supramolecular features of the respective glycoside. A new projection of glycoside structures is proposed to facilitate interpretation of structure–property relationships in this regard.
Introduction
Carbohydrates are constituents of every cell surface (glycocalyx) where they play crucial roles in cellular communication, both in health and disease states of an organism. A lot is known about the biological importance of the glycosylated cell surface;1 but little has been disclosed about the meaning of specific sugar configurations within this supramolecular environment. However, for the advancement of the medicinal chemistry of carbohydrates, it is important to improve our knowledge about the impact of sugar configuration on the cell surface biology. To date, it is not obvious how the subtle differences between biologically important carbohydrate structures,2 for example D-mannose, D-galactose or D-glucose, contribute to specificity and regulation in cell biology, while being embedded into a highly dynamic molecular context that expands over 100 nm width or more. Moreover, there are no direct experimental means to investigate and compare the structural effects of individual monosaccharides in vivo. Therefore, we have used glycomicelles as a highly simplified but well approved multivalent and supramolecular construct,3–5 to probe how the configuration of sugars influences their interactions in water. Eventually, determination of structure–property relationships in micelle formation will allow us to draw conclusions about the impact of configurational differences in a supramolecular carbohydrate environment.Glycomicelles are robust and well investigated supramolecular systems that have been used earlier in biological chemistry6 such as for the study of self-assembly properties of glycolipids, for example.7–10 They are amenable to different biophysical techniques, e.g. surface tension measurements, fluorescence spectroscopy, or various scattering methods (DLS, SANS, SAXS).8 In addition, methods that allow to measure kinetic and thermodynamic parameters of micelles are of relevance in a biological context.
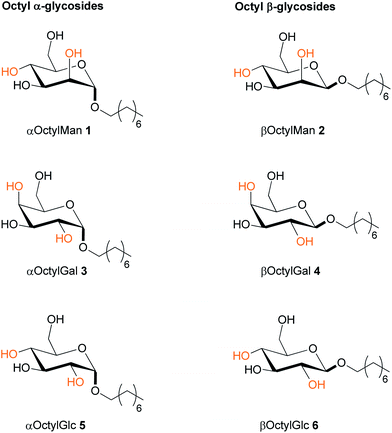
Here, a collection of six different octyl glycosides were synthesized and employed (Fig. 1) in isothermal calorimetry titrations and NMR-spectroscopic studies, including well-known octyl β-glucoside (6), which is commercially available and regularly used for the formation of glycomicelles. Two series of octyl glycosides were tested, α-D-mannoside (1), α-D-galactoside (3), and α-D-glucoside (5), and the respective β-glycosides 2, 4, and 6. Hence, the influence of the anomeric configuration on micelle formation can be compared, as well as the meaning of inversion of configuration at C2 and C4 of the sugar ring, respectively. In addition, mixed, so-called hetero-glycomicelles were formed and compared with the respective homo-glycomicelles.
Results
Synthesis
The employed amphiphilic octyl glycosides 1–6 are literature-known and were synthesized according to described procedures (cf. Experimental and ESI†).ITC measurements of homo-glycomicelles
At first, isothermal titration calorimetry (ITC) was used to study homo-micelle formation of the octyl α-glycosides 1, 3, 5 and of the corresponding octyl β-glycosides 2, 4 and 6. ITC is a standard technique to determine thermodynamic parameters of molecular interactions in solution11–15 including micelle formation and determination of critical micelle concentrations (cmc).16,17 Cmc values are frequently obtained in demicellation studies employing concentrated solutions of each sample to be titrated into water. In our study, as expected, exothermic demicellation processes were observed in all cases as reflected by the obtained ITC diagrams (Fig. 2); cmc values were deduced from their inflection points. The obtained data are collected in the table insert of Fig. 2. Owing to its low water solubility, the cmc of αOctylGlc (5) could not be determined by ITC. The cmc of 5, however, has been reported in the literature based on tensiometric studies (Fig. 2, table insert).18,19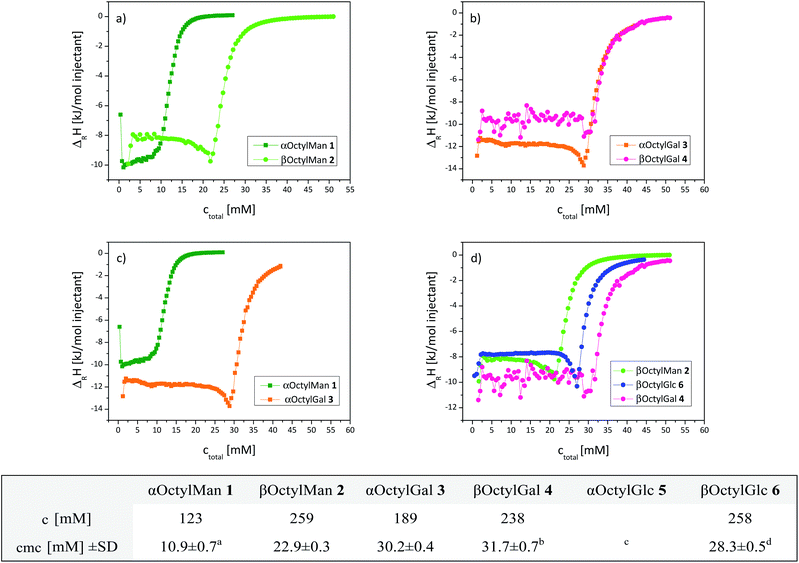 | ||
| Fig. 2 Integrated ITC titration curves of homo-glycomicelles obtained at 298 K. Effect of anomeric configuration: (a) α- and β-octyl mannoside micelles formed of 1 and 2; (b) α- and β-octyl galactoside micelles formed of 3 and 4. Effect of configuration of the sugar ring: (c) α-anomeric micelles formed of 1 and 3, respectively (5 was not sufficiently soluble in water); (d) β-anomeric micelles formed of 2, 4, and 6, respectively. Representative curves are shown. ΔRH: reaction enthalpy per injection. ITC starting concentrations c and obtained mean cmc values are listed in the table insert; SD: standard deviation. (a) 6.0;19 (b) 16;19 (c) 6.3,18 12;19 (d) 20,19 23,16 25.8.20 | ||
Thus, the effect of anomeric configuration on micelle formation could be studied in the manno- as well as the galacto-series (Fig. 2a and b). No significant difference between the α- and β-glycomicelles was detected in the galacto-series, but the manno-series, on the other hand, exhibits a distinctive effect with a much lower cmc for the α-micelle (10.9 mM) than for the respective β-micelle (22.9 mM). Accordingly, formation of α-mannomicelles starts at ∼half the concentration which is required for formation of the corresponding β-micelle. In the gluco-series, we determined a cmc of 28.3 mM for the β-glucoside. Literature reports on cmc values of octyl glucosides diverge to some extent, which can be due to different determination methods employed. Focher18 and Matsumura19 and co-workers used a surface tension method for cmc determination, where effects of dilution and all intermolecular interactions are not taken into account. Consequently lower cmc values were found. Focher et al. determined the cmc value for the β-glucoside 6 as 19 mM and for the α-glucoside 5 as 6.3 mM.18 Paula et al., on the other hand, used titration calorimetry and obtained a cmc of 23.0 mM (ref. 16) for the β-glucoside 6. Regardless of these differences, the gluco-series shows, in analogy to the manno-case, that α-glucomicelles are formed at lower concentrations than β-glucomicelles. This effect is less pronounced in case of the galactoside micelles.
Next, the influence of configurational characteristics of the sugar ring on micelle formation was studied (Fig. 2c and d). The two α-glycosides 1 and 3 show a significant difference in glycomicelle formation, with the cmc of mannoside 1 (10.9 mM) being much smaller than the cmc of galactoside 3 (30.2 mM). In the series of the three β-glycosides 2, 4, and 6, again the cmc of the galactoside (4, 31.7 mM) was found to be the highest. Overall, within both series of α- and β-octyl glycosides a carbohydrate-specific dependency of cmc values was observed, namely cmc(αMan) ≈ cmc(αGlc) < cmc(αGal), and cmc(βMan) < cmc(βGlc) < cmc(βGal).
Next, thermodynamic data of micelle formation were deduced from the measured ITC curves, using the so-called phase-separation model.16 In this model, the glycomicelle is considered as a separate microphase. At high aggregation numbers of the investigated micellar systems (assumed according to the literature16,20–22) the Gibbs free energy of demicellation is defined by the chemical potential of the amphiphile in water and the amphiphile in micellar phase (eqn (1)). To obtain the Gibbs free energy ΔG from measured cmc values, molar fractions cmc′ are pluged in.
ΔG°demic = μ0w − μ0mic = −RT![[thin space (1/6-em)]](https://www.rsc.org/images/entities/char_2009.gif) ln ln![[thin space (1/6-em)]](https://www.rsc.org/images/entities/char_2009.gif) cmc′ cmc′ | (1) |
Demicellation enthalpy, ΔH°demic, and demicellation entropy, ΔS°demic, are obtained from ΔG°demic according to the Gibbs–Helmholtz relation (2).
| ΔG = ΔH − TΔS | (2) |
The enthalpy of demicellation (ΔH°demic) can be calculated according to eqn (3).
 | (3) |
For this calculation, csyringe was considered as equal to cmono + cmic. Here the approximation is used that above the cmc, the concentration of the monomers remains constant. Thus, the thermodynamic parameters of demicellation could be deduced from measured cmc values and are collected in Table 1.
| αOctylMan 1 | βOctylMan 2 | αOctylGal 3 | βOctylGal 4 | βOctylGlc 6 | |
|---|---|---|---|---|---|
| cmc′ (×10−4) | 1.95 ± 0.13 | 4.11 ± 0.06 | 5.42 ± 0.07 | 5.68 ± 0.06 | 5.07 ± 0.09 |
ln![[thin space (1/6-em)]](https://www.rsc.org/images/entities/char_2009.gif) cmc′ cmc′ |
−8.55 ± 0.07 | −7.80 ± 0.03 | −7.52 ± 0.04 | −7.47 ± 0.03 | −7.59 ± 0.05 |
| ΔG°demic [kJ mol−1] = −ΔG°mic | 21.2 ± 0.2 | 19.3 ± 0.1 | 18.6 ± 0.1 | 18.5 ± 0.2 | 18.8 ± 0.2 |
| ΔH°demic [kJ mol−1] | −10.3 ± 1.7 | −9.7 ± 0.9 | −9.2 ± 1.0 | −8.4 ± 0.7 | −6.4 ± 1.2 |
| TΔS°demic [kJ mol−1] | −31.5 ± 1.9 | −29.1 ± 0.8 | −27.9 ± 1.1 | −26.9 ± 1.2 | −25.2 ± 1.4 |
| ΔS°demic [J K−1 mol−1] | −105.6 ± 6.5 | −97.5 ± 2.8 | −93.5 ± 3.3 | −90.2 ± 3.1 | −84.6 ± 4.6 |
The thermodynamic data summarized in Table 1 show that micelle formation is an exergonic process with negative ΔG°mic values. Enthalpy changes of micelle formation, ΔH°mic, are positive though, but enthalpy–entropy compensation23 results in an overall exergonic process. Positive ΔS°mic values indicate that micelle formation is entropically favoured, an effect which has been explained by desolvation of monomers during micelle formation.24 This behavior is observed for all investigated glycomicelles.
ITC measurements of hetero-glycomicelles
In the next step, we extended our project to the investigation of mixed glycomicelles, called hetero-micelles. Such systems are of particular interest as they reflect more of the carbohydrate diversity of the natural glycocalyx than homo-glycomicelles. Equally, hetero-glycoclusters have become important in the glycosciences, showing unexpected, so-called hetero-glycocluster effects.25 To date, self-aggregation of mixed micellar systems formed of octyl glycosides and ionic surfactants have been described.26,27 Furthermore, the aggregation behavior of mixed micelles formed of alkyl maltosides with varying alkyl chain length was investigated.28 Also bolaamphiphiles were studied as mixed micelles with octyl glycoside doping.29Here, we have employed 1![[thin space (1/6-em)]](https://www.rsc.org/images/entities/char_2009.gif) :
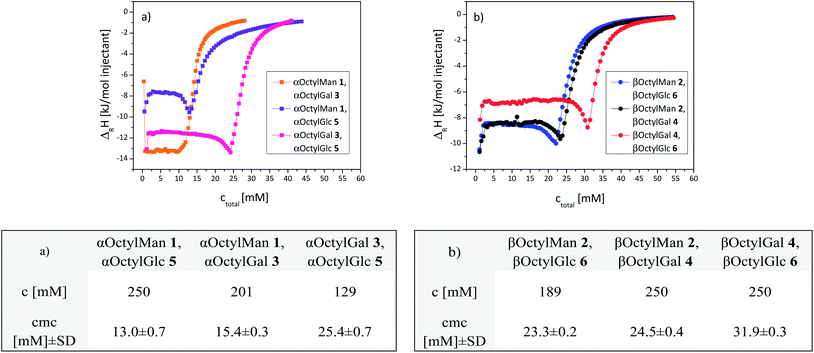
:![[thin space (1/6-em)]](https://www.rsc.org/images/entities/char_2009.gif) 1-mixtures of two amphiphilic glycosides of the same anomeric configuration in a first series of experiments. The standard demicellation protocol was followed to obtain ITC curves of the investigated six mixed micelles, three α-hetero-micelles (Fig. 3a) and three β-hetero-micelles (Fig. 3b). Strikingly, in all cases the titration curves show exactly one point of inflection (reflecting one cmc value) indicating the formation of just one type of mixed micelle. Hence, it can be concluded that the employed 1
1-mixtures of two amphiphilic glycosides of the same anomeric configuration in a first series of experiments. The standard demicellation protocol was followed to obtain ITC curves of the investigated six mixed micelles, three α-hetero-micelles (Fig. 3a) and three β-hetero-micelles (Fig. 3b). Strikingly, in all cases the titration curves show exactly one point of inflection (reflecting one cmc value) indicating the formation of just one type of mixed micelle. Hence, it can be concluded that the employed 1![[thin space (1/6-em)]](https://www.rsc.org/images/entities/char_2009.gif) :
:![[thin space (1/6-em)]](https://www.rsc.org/images/entities/char_2009.gif) 1-mixtures form homogeneous hetero-glycomicelles and that phase separation or homo-micelle formation is not effectively competing in this self-aggregation process.
1-mixtures form homogeneous hetero-glycomicelles and that phase separation or homo-micelle formation is not effectively competing in this self-aggregation process.
Also in hetero-micelle formation, the investigated mannosides exerted a special effect. All mannoside-containing hetero-micelles had lower cmc values than mannoside-free hetero-micelles. In the α-series, the mixed micelles containing octyl mannoside had cmc values of 13.0 ± 0.7 mM and 15.4 ± 0.3 mM, whereas the mannose-free hetero-micelle had cmc = 25.4 ± 0.7 (Fig. 3, table insert). In the β-series, the analogous behaviour was observed. It should be noted, that calculation of cmc values of mixed micelles has been reported in the literature.30,31 In these cases, cmc values were either obtained according to a model for ideal mixing behaviour, or the employed relation was adapted for non-ideal mixing of the components using regular solution theory by Rubingh and colleagues.32
In our experiments it was striking, that it was possible to employ the weakly water-soluble octyl α-D-glucoside 5 in a binary system and to determine the cmc values of the respective hetero-glycomicelles. This demonstrates that the supramolecular properties of mixed micelles can differ significantly from pure homo-micelles. Similar effects have found technical applications in other binary systems.33
In Table 2 the thermodynamic parameters of the investigated hetero-micelles are summarized which were calculated in analogy to what has been described for the homo-glycomicelles. Again, formation of hetero-glycomicelles is entropically driven leading to overall exergonic processes.
| αOctylMan 1, αOctylGlc 5 | αOctylMan 1, αOctylGal 3 | αOctylGal 3, αOctylGlc 5 | βOctylMan 2, βOctylGlc 6 | βOctylMan 2, βOctylGal 4 | βOctylGal 4, βOctylGlc 6 | |
|---|---|---|---|---|---|---|
| cmc′ (×10−4) | 2.34 ± 0.14 | 2.76 ± 0.06 | 4.48 ± 0.16 | 4.18 ± 0.04 | 4.39 ± 0.07 | 5.71 ± 0.06 |
ln![[thin space (1/6-em)]](https://www.rsc.org/images/entities/char_2009.gif) cmc′ cmc′ |
−8.36 ± 0.06 | −8.20 ± 0.03 | −7.71 ± 0.07 | −7.78 ± 0.01 | −7.73 ± 0.04 | −7.47 ± 0.03 |
| ΔG°demic [kJ mol−1] = −ΔG°mic | 20.7 ± 0.2 | 20.3 ± 0.1 | 19.1 ± 0.2 | 19.3 ± 0.1 | 19.2 ± 0.2 | 18.5 ± 0.1 |
| ΔH°demic [kJ mol−1] | −12.3 ± 0.1 | 5.2 ± 0.3 | −10.6 ± 0.1 | −8.6 ± 0.4 | −8.5 ± 0.2 | −7.2 ± 0.9 |
| TΔS°demic [kJ mol−1] | −33.1 ± 0.1 | −25.2 ± 0.3 | −29.7 ± 0.1 | −27.9 ± 0.4 | −27.7 ± 0.3 | −25.7 ± 0.9 |
| ΔS°demic [J K−1·mol−1] | −110.9 ± 0.4 | −85.7 ± 1.3 | −99.8 ± 0.3 | −93.4 ± 1.3 | −92.8 ± 0.9 | −86.1 ± 3.1 |
DOSY NMR experiments
While ITC experiments are suited to describe the equilibrium state of a micellar system, diffusion ordered NMR spectroscopy (DOSY) can be used to measure the diffusion rate of molecules or aggregates, respectively. Thus, information about the dynamics of self-assembly and the size of formed micelles can be gained.34,35 NMR diffusion measurements involve the so-called pulsed field gradient spin echo NMR experiment (PFGSE) which has found numerous applications in supramolecular chemistry. It is based on a pulse sequence, in which the intensity of an echo signal depends on molecular motion in a pulsed field gradient. Faster moving molecules lead to echo signals of lower intensity. From the signal decrease the diffusion coefficient can be calculated.36Here, the two anomeric glycosides, α- and β-octyl mannoside 1 and 2, were selected for diffusion NMR experiments, as they showed the most pronounced effect of anomeric configuration on micelle formation. For determination of the diffusion coefficients Dobs, four different regions in the 1H NMR spectra of the investigated compounds were used (δ = 4.00–3.30, 1.65–1![[thin space (1/6-em)]](https://www.rsc.org/images/entities/char_2009.gif) :
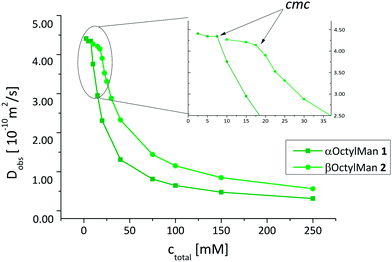
:![[thin space (1/6-em)]](https://www.rsc.org/images/entities/char_2009.gif) 37, 1.36–1.00, and 0.90–0.60 ppm). Samples were measured at concentrations between 2.5 and 250 mM for 1, and 10 and 250 mM for 2, employing the PFGSE experiment and measured Dobs values plotted against sample concentration (Fig. 4). As expected,34Dobs values decrease rapidly with concentrations increasing beyond the cmc, resulting from the limited molecular motion within the micellar assembly.
37, 1.36–1.00, and 0.90–0.60 ppm). Samples were measured at concentrations between 2.5 and 250 mM for 1, and 10 and 250 mM for 2, employing the PFGSE experiment and measured Dobs values plotted against sample concentration (Fig. 4). As expected,34Dobs values decrease rapidly with concentrations increasing beyond the cmc, resulting from the limited molecular motion within the micellar assembly.
All diffusion NMR experiments showed just one diffusing species. Thus, it can be concluded that the equilibrium between monomeric and micellar molecules is fast on the time scale of the NMR experiment. Consequently, the observed diffusion coefficient Dobs is a weighted average from two states of the investigated octyl mannoside (1 or 2, respectively), monomeric and micellar. Hence, Dobs can be expressed by eqn (4).34,37
 | (4) |
Eqn (4) is valid for concentrations >cmc, and thus only respective data points were used. Dmono was inserted into the equation as a fixed parameter that was obtained by NMR measurements at concentrations below the cmc.34ctotal was inserted as an independent variable.
However, in eqn (4) obstruction effects that occur at finite aggregation concentrations, are not taken into account. Therefore, according to Nilsson and Söderman,34eqn (4) was corrected using relation (5).
| Dmic = Dmic,0 (1 − kϕmic) | (5) |
In (5), k is an interaction constant, representing dynamic interactions of hard spheres. According to the literature, k was chosen as 1.73.38ϕmic represents the volume fraction of the micelles. It was obtained using eqn (6).
 | (6) |
In eqn (6), M is the molecular weight of the octyl mannoside (1 or 2, respectively) and d its density (cf. ESI).
By insertion of eqn (5) and (6) into (4), expression (7) is obtained that was used for fitting of the data points of the PGSE NMR experiment (cf.Fig. 5).
 | (7) |

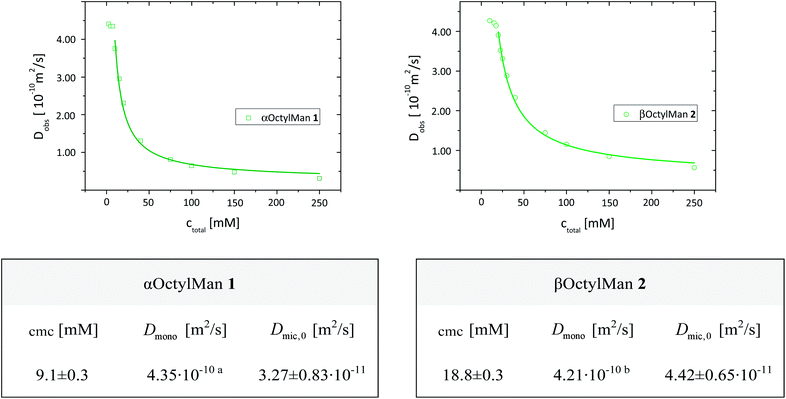 | ||
| Fig. 5 Determination of cmc values and diffusion coefficients Dmono and Dmic,0 for aggregation systems formed with α- and β-mannosides 1 and 2, respectively, at 298 K. For fitting, eqn (7) and data points of ctotal > cmc were used; (a) Dmono at ctotal = 5 and 7.5 mM; (b) Dmono at ctotal = 15 mM. | ||
Thus, self-diffusion coefficients Dmic,0 for the micellar state of octyl mannosides could be determined and the obtained data are summarized in Fig. 5.
Both experimental methods, ITC and DOSY NMR spectroscopy, led to very similar cmc values for 1 and 2. However, the cmc values determined by diffusion NMR spectroscopy for mannoside 1 (9.1 mM) and 2, (18.8 mM) were found somewhat lower than the respective values determined by ITC (10.9 mM for 1 and 22.9 mM for 2). This finding has in principal been described before for association constants of calixpyrrols39 and can be explained by additional intermolecular interactions during demicellation occurring in the ITC experiment.
The diffusion coefficients Dmono determined for both mannosides, 1 and 2, were found equal within error limits (4.35 × 10⁻¹⁰ m2 s−1 for 1 and 4.21 × 10⁻¹⁰ m2 s−1 for 2) and similar to published data for βOctylGlc (6).40 On the contrary, the diffusion coefficients Dmic,0 of the respective micelles were found to differ significantly with Dmic,0 (1) of 3.27 × 10⁻¹¹ m2 s−1 and Dmic,0 (2) of 4.42 × 10⁻¹¹ m2 s−1. Hence, the α-mannosidic micelle diffuses more slowly than the β-mannosidic micelle. This corresponds to larger aggregates in the α-case than in the β-case. Thus, again a significant influence of the anomeric configuration of the mannosidic amphiphile on self-aggregation was revealed.
To obtain an estimate of the size of the investigated micelles the Stokes–Einstein eqn (8) was employed.
 | (8) |
In (8)Rh is the hydrodynamic radius of the micelle, η the dynamic viscosity of the used solvent, T the temperature and kB the Boltzmann constant. With the dynamic viscosity of D2O = 1.10 mNs m−2,41Rh of the α-mannosidic micelle was calculated as 60.7 Å and for the corresponding β-mannosidic micelle as 44.9 Å. Thus, the α-mannosidic micelle is significantly bigger than its β-analogue. It has to be kept in mind, however, that the Stokes–Einstein equation assumes a spherical shape for micelles, while the investigated systems might have a different form and thus other sizes than the calculated ones (vide infra).
Discussion and conclusion
Glycomicelles have been employed in various research to date. This account is dedicated to glycomicelles in order to study the significance of configurational changes of glycosides in a supramolecular context. Thus, micelle formation has been investigated with the complete set of amphiphilic octyl glycosides of the manno-, gluco- and galacto-series of both anomeric configurations using ITC and DOSY NMR spectroscopy. With this selection, we were able to investigate the influence of anomeric configuration as well as of the configuration at C-2 and C-4 of the sugar ring on glycomicelle formation. Our data, in agreement with the available published work, have clearly revealed that the tendency to form micelles in water decreases from mannose over glucose to galactose (cmc(αMan) ≈ cmc(αGlc) < cmc(αGal), and cmc(βMan) < cmc(βGlc) < cmc(βGal)). Moreover, it was shown that all investigated α-configured glycomicelles form more easily than their β-analogues. Overall, octyl α-mannoside requires the lowest concentrations for micelle formation in water among the six investigated octyl glycosides (Fig. 6).The employed mannosides were also unique when employed in the formation of mixed micelles. Thus, the cmc value that is obtained for αOctylMan/αOctylGal hetero-micelles is significantly affected by the α-mannosidic component (Fig. 3). Equally, the cmc values obtained for βOctylMan/βOctylGlc as well as for βOctylMan/βOctylGal hetero-micelles are particularly affected by the β-mannoside component βOctylMan, hence increasing the tendency to micelle formation.
The micellar hydrodynamic radii Rh obtained for 1 and 2 using a PFGSE NMR experiment, namely 60.7 Å and 44.9 Å, are rather large compared to reported micelle sizes (∼23–27 Å).42–44 As occurring obstruction effects were taken into account in our fitting procedure, the reason for the large Rh values may be found by re-considering the shape of the investigated micelles. In the employed Stokes–Einstein equation a spherical shape of micelles is assumed, however, the herein investigated micelles might adopt a different form, probably rodlike or ellipsoidal. We will perform additional studies to specify the shape of octyl mannoside micelles and understand differences caused by the anomeric configuration (α or β).
It has become obvious in our study, that subtle structural changes such as epimerisation at C-2 of octyl glycosides lead to significant effects in a supramolecular context, including hetero-micelles However, how structural details determine the self-aggregation process, remains a secret until this day.
It has been reasoned earlier that configuration and different tilt angles of α- and β-glycosides influence the geometry as well as the hydrophilicity of glycosides, factors that can determine glycomicelle formation.18,19,45 In addition, theoretical studies have highlighted the importance of variable hydrogen bonding in glycomicelle formation of glucosides.46 MD simulations with octyl β-glucoside and octyl β-galactoside suggested that the β-galactoside has a slightly higher tendency to form inter- and intramolecular hydrogen bonds than the corresponding β-glucoside.47 How this results in lower cmc values for the glucoside is not completely clear given that micelle formation is an entropically driven process.
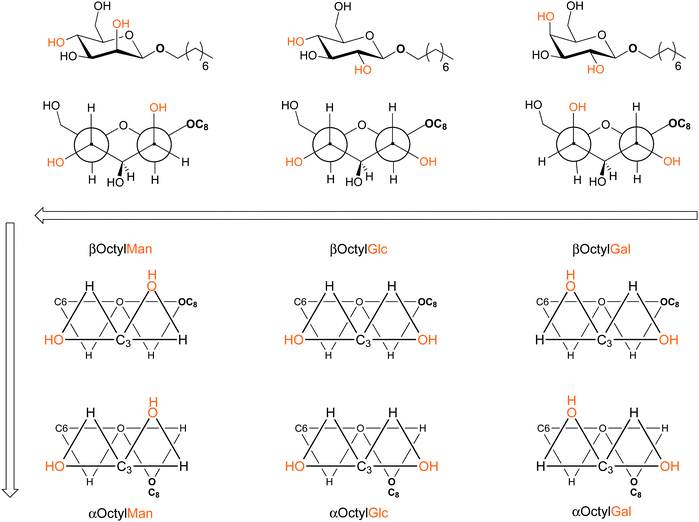
To facilitate the interpretation of structure–property relationships, we suggest an alternative structure view on glycosides to assess the configurational characteristics of the investigated α- and β-octyl glycosides in new light (Fig. 6). In the proposed projections, the relative positions of the hydroxy groups at C-2 and C-4 are depicted at respective edges of two fused triangles, forming the ‘front face’ of the glycoside, in relation to the octyl aglycone moiety in the rear of the molecule. Interestingly, this structural representation suggests that the glucosides can be considered as ‘transition’ between mannoside (low cmc) and galactoside (high cmc) features. The two front triangles of the mannosides on the one hand and the glucosides on the other, are mirror images of one another, whereas the relative position of the aglycone moiety at the far end of the molecule remains constant. The different positioning of the 2,4-dihydroxy group pair relative to the octyl aglycone in the α- and β-case, respectively, also becomes very obvious using the suggested projection. The depicted projection could even be further expanded by including the direction of the O–H bonds. This would demonstrate how the hydroxyl hydrogen atoms are exposed to the surrounding of the glycoside, featuring a particular hydrogen bonding behavior. The proposed projection could equally support the interpretation of self-aggregation of mixed micelles, which were shown to display different properties than the homo-micelles. In our further work, we will expand the present study in both an experimental and a theoretical context and we will make an attempt to draw inspiration from the proposed ‘trinity projection’ of glycosides. In particular, we have commenced MD simulations to understand the notable effects of octyl α- and β-mannosides on micelle formation.
Experimental
Synthesis of octyl glycosides
The 1,2-trans glycosides 1,19,484,19,49 and 6 (ref. 50) were synthesized according to the literature. The 1,2-cis glycosides 2,50,513 and 5 (ref. 19) were prepared using Fischer glycosylation52 according to modified literature procedures.53 Separation of anomeric mixtures was accomplished by flash column chromatography. Analytical data of the synthetic glycosides are reported in the ESI.†ITC demicellation protocol16,54
ITC measurements were performed on a MicroCal VP-ITC (MicroCal, Inc., Northhampton, MA, now GE Healthcare).Sample preparation
For ITC, highly concentrated solutions (10-fold concentration of cmc in double distilled water) were prepared in a 1 or 2 mL volumetric flask and used after ultrasonic degassing for 5 min.Titration procedure
The cells (reference cell and sample cell) were filled with double distilled water and the amphiphilic solution was added using the injection syringe. The number of aliquots was 70 up to 93. At higher aliquot numbers an injection volume of 3 μL was used, at lower aliquot numbers 4 μL were titrated into the sample cell. An interval of 540 s was used between titration steps. The sample was stirred by the syringe during titration with stirring speed 300 rpm. Experiments were carried out at 298 K (shield 297 K) and a reference power of 10 μcal s−1. Every titration was performed three times and then it was averaged (cf. ESI† for representative titration curves).Cleaning of the injection syringe and the cells
After draining off residual solution, the syringe was washed with 100 mL of double distilled water and 50 mL methanol (HPLC grade). Using the ThermoVac the syringe was dried for 10 min under vacuum and maintained at reduced pressure for least 1 h until the next measurement was performed. The sample cell was first washed with Contrad 70 liquid detergent (10% in double distilled water) and subsequently with double distilled water (twice 300 mL) using the ThermoVac.Data analysis
For measurements and data analysis ORIGIN 7.2 (OriginLab) with ITC plugin was used. The reference data of a water-to-water titration were subtracted and the resulting data were plotted. From the resulting curves, the critical micelle concentration (cmc) was obtained as the maximum of the first derivative.Diffusion NMR spectroscopy
The NMR diffusion measurements were carried out on a Bruker Avance 600 spectrometer at a temperature of 298 K. A concentration series of octyl α-D-mannopyranoside (1, 11 concentrations from 2.5 to 250 mM) and octyl β-D-mannopyranoside (2, 12 concentrations from 10 to 250 mM) were measured in 500 μL D2O. At every concentration, a series of 1H NMR spectra was recorded (32 spectra) with a decreasing field gradient. The parameters of the duration of the gradient δ and the separation between the leading edges of the pulsed gradients Δ (diffusion time) were adjusted for each sample so that the signal intensity of the last spectra was about 10% of the starting intensity. The analysis of the diffusion series was performed using the T1/T2-relaxation routine of TOPSPIN 3.2 (Bruker).Acknowledgements
We thank Prof. Dr. F. D. Sönnichsen and Dipl.-Chem. H. Kobarg for their support in NMR diffusion experiments. Valuable discussions with V. Baronin Staël von Holstein, Dipl.-Ing. are gratefully acknowledged.Notes and references
- R. A. Dwek, Chem. Rev., 1996, 96, 683–720 CrossRef CAS PubMed.
- D. B. Werz, R. Ranzinger, S. Herget, A. Adibekian, C.-W. von der Lieth and P. H. Seeberger, ACS Chem. Biol., 2007, 2, 685–691 CrossRef CAS PubMed.
- P. Boullanger, in Glycoscience Synthesis of Substrate Analogs and Mimetics, ed. D. H. Driguez and P. D. J. Thiem, Springer Berlin Heidelberg, 1997, pp. 275–312 Search PubMed.
- N. Jayaraman, K. Maiti and K. Naresh, Chem. Soc. Rev., 2013, 42, 4640–4656 RSC.
- P. M. Levine, T. P. Carberry, J. M. Holub and K. Kirshenbaum, Med. Chem. Commun., 2013, 4, 493–509 RSC.
- T. K. Lindhorst and S. Kubik, in Supramolecular Chemistry: From Molecules to Nanomaterials, John Wiley & Sons, Ltd, 2012, pp. 1685–1712 Search PubMed.
- C. Stubenrauch, Curr. Opin. Colloid Interface Sci., 2001, 6, 160–170 CrossRef CAS.
- P. H. Thiesen, H. Rosenfeld, P. Konidala, V. M. Garamus, L. He, A. Prange and B. Niemeyer, J. Biotechnol., 2006, 124, 284–301 CrossRef CAS PubMed.
- M. Corti, L. Cantù, P. Brocca and E. Del Favero, Curr. Opin. Colloid Interface Sci., 2007, 12, 148–154 CrossRef CAS PubMed.
- G. Milkereit, V. M. Garamus, S. Gerber and R. Willumeit, Langmuir, 2007, 23, 11488–11495 CrossRef CAS PubMed.
- J. R. Livingstone, Nature, 1996, 384, 491–492 CrossRef CAS PubMed.
- A. Ababou and J. E. Ladbury, J. Mol. Recognit., 2006, 19, 79–89 CrossRef CAS PubMed.
- M. Durka, K. Buffet, J. Iehl, M. Holler, J.-F. Nierengarten, J. Taganna, J. Bouckaert and S. P. Vincent, Chem. Commun., 2011, 47, 1321–1323 RSC.
- L. Pang, S. Kleeb, K. Lemme, S. Rabbani, M. Scharenberg, A. Zalewski, F. Schädler, O. Schwardt and B. Ernst, ChemMedChem, 2012, 7, 1404–1422 CrossRef CAS PubMed.
- H. Heerklotz and A. Blume, in Comprehensive Biophysics, ed. E. H. Egelman, Elsevier, Amsterdam, 2012, pp. 63–91 Search PubMed.
- S. Paula, W. Sues, J. Tuchtenhagen and A. Blume, J. Phys. Chem., 1995, 99, 11742–11751 CrossRef CAS.
- P. Garidel, A. Hildebrand, R. Neubert and A. Blume, Langmuir, 2000, 16, 5267–5275 CrossRef.
- B. Focher, G. Savelli, G. Torri, G. Vecchio, D. C. McKenzie, D. F. Nicoli and C. A. Bunton, Chem. Phys. Lett., 1989, 158, 491–494 CrossRef CAS.
- S. Matsumura, K. Imai, S. Yoshikawa, K. Kawada and T. Uchibor, J. Am. Oil Chem. Soc., 1990, 67, 996–1001 CrossRef CAS.
- K. Kameyama and T. Takagi, J. Colloid Interface Sci., 1990, 137, 1–10 CrossRef CAS.
- L. He, V. Garamus, S. S. Funari, M. Malfois, R. Willumeit and B. Niemeyer, J. Phys. Chem. B, 2002, 106, 7596–7604 CrossRef CAS.
- M. Frindi, B. Michels and R. Zana, J. Phys. Chem., 1992, 96, 8137–8141 CrossRef CAS.
- C. Jolicoeur and P. R. Philip, Can. J. Chem., 1974, 52, 1834–1839 CrossRef CAS.
- H.-D. Dörfler, Grenzflächen und kolloid-disperse Systeme: Physik und Chemie, Springer DE, 2002 Search PubMed.
- M. Gómez-García, J. M. Benito, D. Rodríguez-Lucena, J.-X. Yu, K. Chmurski, C. Ortiz Mellet, R. Gutiérrez Gallego, A. Maestre, J. Defaye and J. M. García Fernández, J. Am. Chem. Soc., 2005, 127, 7970–7971 CrossRef PubMed.
- P. del Burgo, E. Junquera and E. Aicart, Langmuir, 2004, 20, 1587–1596 CrossRef CAS.
- A. Lainez, P. del Burgo, E. Junquera and E. Aicart, Langmuir, 2004, 20, 5745–5752 CrossRef CAS.
- A. D. Tsamaloukas, A. Beck and H. Heerklotz, Langmuir, 2009, 25, 4393–4401 CrossRef CAS PubMed.
- V. M. Garamus, G. Milkereit, S. Gerber and V. Vill, Chem. Phys. Lett., 2004, 392, 105–109 CrossRef CAS PubMed.
- H. Lange and K. H. Beck, Kolloid Z. Z. Polym., 1973, 251, 424–431 CAS.
- J. H. Clint, J. Chem. Soc., Faraday Trans., 1975, 71, 1327–1334 RSC.
- D. N. Rubingh, Mixed micelle solution, in Solution chemistry of surfactants, ed. K. L. Mittal, Plenum Press, New York, 1st edn, 1979, pp. 337–354 Search PubMed.
- C.-L. Lo, C.-K. Huang, K.-M. Lin and G.-H. Hsiue, Biomaterials, 2007, 28, 1225–1235 CrossRef CAS PubMed.
- F. Nilsson, O. Söderman and I. Johansson, Langmuir, 1996, 12, 902–908 CrossRef CAS.
- F. Nilsson, O. Söderman and I. Johansson, J. Colloid Interface Sci., 1998, 203, 131–139 CrossRef CAS.
- Y. Cohen, L. Avram and L. Frish, Angew. Chem., 2005, 117, 524–560 ( Angew. Chem., Int. Ed. , 2005 , 44 , 520–554 ) CrossRef.
- V. Molinier, B. Fenet, J. Fitremann, A. Bouchu and Y. Queneau, J. Colloid Interface Sci., 2005, 286, 360–368 CrossRef CAS PubMed.
- T. Ohtsuki and K. Okano, J. Chem. Phys., 1982, 77, 1443–1450 CrossRef CAS PubMed.
- J. L. Sessler, D. E. Gross, W.-S. Cho, V. M. Lynch, F. P. Schmidtchen, G. W. Bates, M. E. Light and P. A. Gale, J. Am. Chem. Soc., 2006, 128, 12281–12288 CrossRef CAS PubMed.
- O. Vinogradova, F. D. Sönnichsen and C. R. Sanders, J. Biomol. NMR, 1998, 11, 381–386 CrossRef CAS.
- L. G. Longsworth, J. Phys. Chem., 1960, 64, 1914–1917 CrossRef CAS.
- B. Lorber, J. B. Bishop and L. J. DeLucas, Biochim. Biophys. Acta, 1990, 1023, 254–265 CrossRef CAS.
- A. D'Aprano, R. Giordano, M. P. Jannelli, S. Magazù, G. Maisano and B. Sesta, J. Mol. Struct., 1996, 383, 177–182 CrossRef.
- L.-Z. He, V. Garamus, B. Niemeyer, H. Helmholz and R. Willumeit, J. Mol. Liq., 2000, 89, 239–249 CrossRef CAS.
- C. Dupuy, X. Auvray, C. Petipas, I. Rico-Lattes and A. Lattes, Langmuir, 1997, 13, 3965–3967 CrossRef CAS.
- A. R. van Buuren and H. J. C. Berendsen, Langmuir, 1994, 10, 1703–1713 CrossRef CAS.
- T. T. Chong, R. Hashim and R. A. Bryce, J. Phys. Chem. B, 2006, 110, 4978–4984 CrossRef CAS PubMed.
- Y. Kikuchi, H. Toi and Y. Aoyama, Bull. Chem. Soc. Jpn., 1993, 66, 1856–1858 CrossRef CAS.
- X. Zhang, T. Kamiya, N. Otsubo, H. Ishida and M. Kiso, J. Carbohydr. Chem., 1999, 18, 225–239 CrossRef CAS.
- K. J. Kaur and O. Hindsgaul, Glycoconjugate J., 1991, 8, 90–94 CrossRef CAS.
- F. Barresi and O. Hindsgaul, J. Am. Chem. Soc., 1991, 113, 9376–9377 CrossRef CAS.
- E. Fischer, Ber. Dtsch. Chem. Ges., 1893, 26, 2400–2412 CrossRef.
- F. M. Winnik, J. P. Carver and J. J. Krepinsky, J. Org. Chem., 1982, 47, 2701–2707 CrossRef CAS.
- P. Garidel and A. Hildebrand, J. Therm. Anal. Calorim., 2005, 82, 483–489 CrossRef CAS.
Footnote |
| † Electronic supplementary information (ESI) is available: Containing details of synthesis, ITC and DOSY NMR measurements. See DOI: 10.1039/c4md00122b |
| This journal is © The Royal Society of Chemistry 2014 |

