 Open Access Article
 This Open Access Article is licensed under a
 Creative Commons Attribution 3.0 Unported Licence
A metabolomics investigation into the effects of HIV protease inhibitors on HPV16 E6 expressing cervical carcinoma cells†
Dong-Hyun
Kim‡§
a,
J. William
Allwood§¶
a,
Rowan E.
Moore
b,
Emma
Marsden-Edwards||
b,
Warwick B.
Dunn¶
a,
Yun
Xu
a,
Lynne
Hampson
c,
Ian N.
Hampson
c and
Royston
Goodacre
*ad
aSchool of Chemistry, Manchester Institute of Biotechnology, The University of Manchester, 131 Princess Street, Manchester, M1 7DN, UK. E-mail: roy.goodacre@manchester.ac.uk; Fax: +44 (0)161 3064519; Tel: +44 (0)161 3064480
bWaters Corporation, Atlas Park, Simonsway, Manchester, M22 5PP, UK
cThe University of Manchester, Gynaecological Oncology Laboratories, Human Development, St Mary's Hospital, Manchester, M13 OJH, UK
dManchester Centre for Integrative Systems Biology (MCISB), Manchester Institute of Biotechnology, The University of Manchester, 131 Princess Street, Manchester, M1 7DN, UK
First published on 6th January 2014
Abstract
Recently, it has been reported that anti-viral drugs, such as indinavir and lopinavir (originally targeted for HIV), also inhibit E6-mediated proteasomal degradation of mutant p53 in E6-transfected C33A cells. In order to understand more about the mode-of-action(s) of these drugs the metabolome of HPV16 E6 expressing cervical carcinoma cell lines was investigated using mass spectrometry (MS)-based metabolic profiling. The metabolite profiling of C33A parent and E6-transfected cells exposed to these two anti-viral drugs was performed by ultra performance liquid chromatography (UPLC)-MS and gas chromatography (GC)-time of flight (TOF)-MS. Using a combination of univariate and multivariate analyses, these metabolic profiles were investigated for analytical and biological reproducibility and to discover key metabolite differences elicited during anti-viral drug challenge. This approach revealed both distinct and common effects of these two drugs on the metabolome of two different cell lines. Finally, intracellular drug levels were quantified, which suggested in the case of lopinavir that increased activity of membrane transporters may contribute to the drug sensitivity of HPV infected cells.
Introduction
Cervical cancer is the major gynecological cancer among women diagnosed in the UK. Each year in the UK, over 2800 women are diagnosed and approximately 1000 deaths are caused by this cancer (UK Cervical Cancer Statistics, Cancer Research UK. www.cancerresearchuk.org). The global figures are even more astounding, with an estimated 473![[thin space (1/6-em)]](https://www.rsc.org/images/entities/char_2009.gif) 000 women affected by cervical cancer and 253500 deaths each year (National Cervical Cancer Coalition. www.nccc-online.org). Indeed in many low resource countries it is the greatest cause of women's cancer-related mortality.
000 women affected by cervical cancer and 253500 deaths each year (National Cervical Cancer Coalition. www.nccc-online.org). Indeed in many low resource countries it is the greatest cause of women's cancer-related mortality.
Human papilloma virus (HPV) is the major cause of cervical cancer1 and there are over 100 different types of HPV associated with a variety of clinical lesions with approximately 20 of these being associated with anogenital tract lesions.2 Of these HPVs, the high-risk types (e.g., HPV16 and 18) are more often found in association with pre-malignant cervical lesions and invasive cancers.1,3 HPV16 and 18 are the most widespread high-risk types associated with cervical cancer, accounting for over 60% of cases, although there are 11 other high risk types reported.4,5 Although anti-HPV vaccines have been implemented these generally only cover the high risk types (16 and 18) which mean that there is still a significant proportion of other high risk HPV-related cervical disease that will not be protected by this strategy. In addition, since there are many women persistently infected with high risk types of HPV and cervical cancer can take from 10–20 years to develop, alternative therapies are required for preventing HPV infection. Whilst surgery has been employed widely for the treatment of HPV related pre-cancerous cervical intraepithelial neoplasia (CIN),4,6 most surgical procedures of this type carry an increased risk of infertility, which leads to a need for simple, preferably self-administered non-surgical therapy providing several advantages such as better preservation of obstetric function which would enable this treatment to be offered for low grade disease.7
Expression of high risk types of the E6 and E7 viral oncoproteins is largely responsible for the oncogenic properties of HPV.8 One of the most intensively studied properties of the E6 protein is its ability to compromise the function of the p53 tumour suppressor protein.9 In association with the cellular E3 ubiquitin ligase E6-associated protein (AP), E6 binds to the p53 protein. E6 mediated activation of E6AP then catalyses the ubiquitination and subsequent proteasomal degradation of p53.10 Indeed this strategy of inappropriate activation of the proteasome is used by many other viruses to subvert the function of a variety of cellular proteins that would prove detrimental to viral persistence.1,11,12 This implies that selective inhibition of proteasomal function could prove to be an effective strategy for the treatment of HPV infections.
Although FT-IR and Raman spectroscopies are reagentless and non-invasive tools for global, sensitive and highly reproducible metabolome analyses with minimal sample preparation, there is the limitation that specific chemical structures cannot be identified. UPLC- and GC-MS are powerful and highly sensitive analytical techniques not only for the quantification of metabolites but also for the identification of known and unknown compounds in biological samples. Whilst GC-MS can detect a range of volatile compounds, non-polar fatty acids, or primary metabolites (when derivatised), UPLC-MS is more suited to the analysis of secondary metabolites and lipids when C18 reversed-phase LC is applied. Since both MS techniques are fully automated they are particularly amenable to high-throughput metabolomics analysis. Thus, UPLC-MS and GC-MS have been used widely to investigate metabolic changes in biological processes, to discover new biomarkers and drugs, and diagnose diseases.13–21
We have recently reported that the anti-viral drugs indinavir and lopinavir, which are currently used for the treatment of a human immunodeficiency virus (HIV) infection, also inhibit the ability of HPV16 E6 to degrade p53 and selectively kill E6-dependant cervical carcinoma cells in vitro22 and that the exposure of these drugs elicits phenotypic changes (i.e., metabolic alteration) of these carcinoma cells as revealed with FT-IR spectroscopy.23 However, whilst recent studies show that indinavir is targeted to the nucleus,24 the mode of action of these drugs against HPV is largely unknown. Therefore, in this study, in order to contribute to an understanding of the mechanism of these drugs against HPV on human cervical cell lines, we investigate the level and compositional changes in intracellular components of control and HPV16 E6 expressing cervical carcinoma cells upon exposure to a series of physiological relevant indinavir and lopinavir concentrations and quantify the intra-cellular concentrations of these drugs.
Materials and methods
Cell line and culture medium
HPV-negative human C33A cervical carcinoma cells (termed “C33AP”) were maintained in RPMI 1640 medium (Invitrogen, Paisley, UK) supplemented with 10% fetal bovine serum (FBS) from the same batch and 2 mM L-glutamine (Sigma-Aldrich Company Ltd, Dorset, UK) (complete medium) at 37 °C, 5% CO2. C33A cells stably transfected with HPV16 E6 (termed “C33AE6”) and pcDNA3.1 were derived and cultured as previously described.25Protease inhibitor
Indinavir was obtained through the NIH AIDS Research and Reference Reagent Program (Division of AIDS, NIAID, NIH) as indinavir sulphate (8145). Lopinavir was provided as a generous gift from Abbott Laboratories, Park Road, Abbott Park, IL 60064-6187, USA. Indinavir and lopinavir were dissolved in sterile distilled water and DMSO (Sigma-Aldrich Company Ltd, UK), respectively, at working stock concentrations of 20 mM.Sample preparation
For UPLC-MS metabolite profiling, after incubation, the complete medium was removed and 800 μL of trypsin was added in order to detach the adherent cells from the flask. Cells were then incubated for 3 min at 37 °C, 5% CO2. After this period, cells were resuspended in 10 mL of the complete medium and were counted. Each 1 × 10⁶ of C33AP and C33AE6 cells were then seeded in large scale T75 culture flasks (to provide five drug conditions and five biological replicates for each drug) and allowed to adhere and reach 80–90% confluence at 37 °C, 5% CO2. Indinavir (0, 0.05, 0.15, 0.5 and 1.0 mM) and lopinavir (0, 7.5, 15, 22.5 and 30 μM), or water and DMSO (as respective controls) were added to the relevant flasks and cells were incubated for 24 h at 37 °C, 5% CO2; these concentrations were investigated previously and found to be physiologically relevant.22,23 Three flasks were employed per drug concentration in order to obtain enough biomass to be detected by UPLC-MS. After the incubation period, the growth media were poured off and the cells were washed with PBS warmed at 37 °C (matching the incubation temperature). 3 mL of pure methanol (MeOH, −48 °C) was added for quenching metabolism and cells were scraped from the surface of the culture flask whilst being kept on ice. After combining three flasks, cells were freeze-thaw extracted and lyophilised (i.e., flash frozen in liquid N2 for 1 min and thawed at 4 °C then vortexed for 30 s × 4) and then centrifuged at 3000 × g for 10 min. Next, the supernatants (cell extracts) were evaporated at room temperature and each dried extract was weighed for normalisation, and subsequently stored at −80 °C prior to analysis. Due to the large numbers of cultures required for the experiment, weekly batches were prepared for each cell line (i.e., week 1 – parent + indinavir; week 2 – parent + lopinavir; week 3 – E6 + indinavir; week 4 – E6 + lopinavir, each culture batch included 0 drug dose as a control). Although direct comparisons of the different cell lines and drug treatments may be at risk of identifying significant metabolic differences between the weekly culture batches, each drug treatment and cell line is still comparable within each culture batch, therefore allowing the selection of metabolic changes associated with drug treatment prior to comparing the drug responses between different cell lines and indinavir and lopinavir challenge. Before analysis, the samples were reconstituted in 20 μL mg−1 cell dry weight (DW) of 20% aqueous MeOH (HPLC grade). In total four groups (i.e. 1. parent + indinavir, 2. parent + lopinavir, 3. E6 + indinavir, 4. E6 + lopinavir) of samples were prepared and these were analysed as one batch by UPLC-MS using an Acquity UPLC™ (Waters Ltd, Manchester, UK) and SYNAPT HDMS™ (Waters Ltd, UK).In order to assess instrument performance as detailed in ref. 26–28 three pooled quality control (QC) samples were prepared: an indinavir QC to represent equal mix of all indinavir exposed samples; a lopinavir QC to represent equal mix of all lopinavir exposed samples; and a mixed QC to represent equal mix of all the samples.
The initial sample preparation for GC-MS followed the same methods as applied for UPLC-MS sample generation, with the addition of derivatisation prior to analysis. However, in order to reduce the total number of cultures, the study focused upon a smaller number of levels of anti-viral challenge. 1 × 10⁶ C33AE6 cells were seeded to each of 90 flasks (to provide three concentration levels for each drug and five biological replicates) and allowed to adhere and reach 80–90% confluence at 37 °C, 5% CO2. Treatments included 0, 0.2 and 1 mM of indinavir and 0, 15 and 30 μM of lopinavir, with additional controls of water and DMSO respectively, the cultures were incubated for 24 h at 37 °C, and 5% CO2. Three flasks were pooled for each drug concentration in order to obtain enough biomass to be detected by GC-MS. Harvesting of the cells, metabolic quenching and extraction of metabolites was performed as described for UPLC-MS. To each GC-MS extract, 100 μL of internal standard solution (0.25 mg ml−1 succinic-d4 acid, malonic-d2 acid and glycine-d5 in HPLC-grade water) was added and the extract lyophilised at room temperature by speed vacuum concentration and stored at −80 °C before analysis.
UPLC-MS and MS/MS methodologies
For metabolite profiling, UPLC was performed on an ACQUITY UPLC™ system (Waters Corporation, Milford, MA, USA). Chromatographic separations were performed on a 1 mm × 100 mm, 1.7 μm ACQUITY HSS T3 C18 column. The column was maintained at 45 °C and samples were eluted with a linear water (0.1% v/v formic acid)/acetonitrile (0.1% v/v formic acid) gradient over 10 min at a flow rate of 0.25 ml min−1 as follows: 100% A (0 min) to 100% B at 7 min to 100% B at 8 min to 100% A at 8.1 min and held to 10 min. A 5 μL injection of each sample was used for UPLC-MS(/MS).A hybrid Quadrupole/Travelling Wave IMS-oa TOF device SYNAPT HDMS (Waters, Manchester, UK) was operated in positive ion electrospray (ES +ve) mode. Data were acquired in V mode with a FWHM of 10000 with mass accuracy typically within 3 ppm root mean square (RMS). Data were acquired from 50–1000 Da, using a source temperature of 120 °C, desolvation temperature of 350 °C and cone voltage of 30 V. Low-energy data were acquired in function (1) using a collision energy (CE) of 6 eV on the Trap collision cell and 4 eV on the transfer collision cell. High-energy data were acquired in function (2) using a ramped CE on the Trap collision cell of 15–25 eV and a fixed CE on the transfer collision cell of 25 eV. Sample measurements were performed in triplicate, to account for any analytical variability. For UPLC-MS, initially the UPLC-MS profiling data were baseline corrected, aligned, and exact mass retention time (EMRT) pairs extracted within Waters MarkerLynx™ XS thus producing an X and Y data matrix of samples aligned for each EMRT. A text file of all the excipient masses was generated and employed in the cell profiling MarkerLynx™ XS processing method, thus producing an output containing only EMRT pairs that were associated with endogenous metabolites. The final output was Pareto scaled29,30 prior to statistical analysis.
UPLC-MS/MS analysis was performed under the same UPLC conditions as applied to the UPLC-MS analysis, only linked to a XEVO™ QTOF MS system (Waters, Manchester, UK). Most of the instrument parameters were made consistent with those applied to the SYNAPT HDMS with the exception of the desolvation temperature which was set at 400 °C. The target mass ion for MS/MS was selected by the quadrupole and was then subjected to CID using a CE ramp typically in the range 15–35 eV. Sample measurements were compared to those of pure analytical standards.
UPLC-MS and MS/MS metabolite identification
The process of marker identification was made up of four stages.• The first stage employed the exact mass and accurate isotope ratio data for each EMRT pair to calculate proposed elemental composition. This was automatically calculated using the Elemental Composition Calculator within MarkerLynx XS. The mass accuracy (in ppm or mDa) and isotope ratio accuracy (i-FIT value) of each proposed formula were provided allowing the quality of the elemental composition results to be assessed.
• In the second stage, each EMRT pair and its proposed elemental compositions were searched against predefined online databases (Chemspider.com) using either the exact mass or the elemental composition as the search criterion. The results from the database search were compared with the proposed elemental compositions and where a match was found (elemental composition and database result) the structure of the proposed metabolite was obtained from the database.
• The third stage of marker identification was to use MassFragment software (Waters Ltd, UK) to assign the high energy MSE fragments according to the structure of the proposed metabolite. The method of marker identification is a simple, logical process which employs all of the UPLC-MS data qualities to build confidence in assignments and therefore reduces the incidence of false positives.
• For unambiguous confirmation a fourth step is required, where comparative UPLC-MS/MS analysis was performed on both the sample EMRT pairs and an authenticated reference standard for the predicted metabolite structures. Matching of both RT and MS/MS spectra between the reference standards and sample EMRT pairs is required for unambiguous confirmation.31
• In addition, automated workflows (PutMetID) have been employed for the rapid and high-throughput annotation, and putative metabolite identification of UPLC-MS-based metabolomic data sets as described in ref. 32 and 33.
The UPLC-MS metabolite identification routine and reporting adhered to standards set out by the Metabolomics Standards Initiative.31 An example of this metabolite annotation approach is shown in ESI,† Fig. S1.
Targeted quantification of lopinavir and indinavir by UPLC-MS
For drug quantification, UPLC-MS analysis for the quantification of lopinavir within the samples was performed on a Waters ACQUITY UPLC system, whereas for indinavir were performed upon a Thermo Accela UPLC system, both UPLC systems were operated using the same column and under the same conditions as applied for metabolite profiling, but we were only interested in the peak areas for the two drugs. A number of serially diluted standards for each of the two drug compounds were analysed six times each. The sample extracts initially profiled by UPLC-MS were diluted three fold prior to analysis on the Q-TOF micro, and 24 fold prior to analysis on the LTQ-Orbitrap XL, thus preventing saturation of the MS detectors. The indinavir and lopinavir extracted peak areas, for both drug standards and samples, were transformed to their natural log values, and calibration curves were built for the two drug standards. Quantification of the indinavir and lopinavir mass peaks within the cell line samples were predicted against the calibration curves constructed using the serially diluted drug standards. All stages of the quantification process were performed within Matlab R2009.GC-MS methodology
For GC-MS metabolite profiling, samples were derivatised and analysed by GC-TOF/MS as described in ref. 34 following the optimised method for analysis of yeast cells. All experiments were run on a GC-TOF/MS instrument (Agilent 6890N gas chromatograph and LECO Pegasus III TOF mass spectrometer) using the manufacturer's software (ChromaTOF version 2.12). A DB-50 GC column (Supelco, Gillingham, UK; 30 m × 0.25 mm × 0.25 μm film thickness) was used. In the ChromaTOF software, the S/N threshold was set to 10, baseline offset to 1.0, data points for averaging to 3, and peak width to 3. Data were deconvolved within ChromaTOF and the metabolites identified by RI (±10) and MS (80% forward and reverse match) library matching with high confidence against an in-house library,32 the NIST 2002 library and the Golm Metabolome Database (GMD).35,36 The GC-MS metabolite identification routine and reporting adhered to standards set out by the Metabolomics Standards Initiative.31 The deconvoluted profiles for each sample were next aligned thus forming an X and Y matrix for statistical analyses.Data analysis
Data analysis followed the Metabolomics Standards Initiative guidelines.37 The resultant data matrix of EMRTs was submitted to multivariate statistical analysis in Matlab version 7 (The Mathworks, Inc., Matick, MA, USA). Principal components analysis (PCA) was performed on the pre-processed UPLC-MS data set. Briefly, PCA is one of the oldest and most widely used multivariate techniques, it is employed to reduce the dimensionality of metabolomics data whilst maintaining the majority of its variance and is used to visualise general trends and outliers among the observations. Therefore, it is often utilised as an initial step prior to cluster or discriminant analysis.38–40 PCA was performed according to the NIPALS (nonlinear iterative partial least squares) algorithm.41 In addition to the inspection of loadings matrices from PCA for the discovery of which metabolites were more discriminatory, as a final data mining step univariate data analyses were applied. Here, N-way ANOVA was performed within Matlab 7 software (The Mathworks, Inc., Matick, MA, USA) and was used to assess levels of significant difference for each EMRT pair between control and drug doses within each cell line individually.42Finally, Matlab was used to perform multi-block consensus PCA (cPCA) on the GC-MS data sets.42 PCA is typically applied to all of the metabolite variables and reduces them to a small number of new variables (PCs) which explain the greatest sources of variance, however conventional PCA does not always detect common trends between different sample classes. Recently, cPCA has been introduced in which each sample class or anti-viral drug that the cells have been challenged with can be divided into several blocks, the cPCA then looks to fit the data within the different blocks to discover common trends between them which may aid greatly in the production of more interpretable models. This multi-block method has been used in cases where the number of variables is large and additional information is available for blocking the variables into conceptually meaningful blocks.43,44 Since multi-block PCA can offer the potential to extend the scope of conventional PCA and to identify common trends between different blocks (e.g., E6 + indinavir vs. E6 + lopinavir), cPCA was applied to the GC-MS data sets, after samples were rearranged into two separated blocks, each one for each type of drug and their treated concentrations.
Results and discussion
UPLC-MS data quality
A total of 332 injections were performed totalling 59 h of analysis. Amongst these were 5 biological replicates for each cell line/drug treatment permutation, 3 technical replicates of each concentration level of drug treatment in each cell line, 6 replicate injections of each drug QC, 8 replicate injections of the mixed QC and drug standards. All samples were analysed in a randomised manner. Throughout the course of the analysis retention time drift was minimal and 3 ppm RMS mass accuracy was maintained.Multivariate analysis of UPLC-MS profiling data from C33A parent and E6-transfected cells
Extracts from the C33AP and C33AE6 cells grown in both the absence and presence of indinavir and lopinavir, at physiologically relevant levels, were analysed by UPLC-MS. The 3D UPLC-MS data obtained were converted into a 2D matrix by MarkerLynx XS. Each data point in the 2D matrix represents an exact mass retention time (EMRT) pair (i.e., a potential marker along with its intensity), and the matrix was converted to a tab delimited text file suitable for import into Matlab software. PCA was then carried out initially to determine basic biological differences between the two different cell types and different drug treatments, and to investigate trends determined by the drug dosing. The resultant PCA scores plots are shown in Fig. 1. As can be seen in Fig. 1A, trends between the cells treated with two different drugs were clearly observed, indicating a strong feasibility to investigate relationships between drug concentrations and mass spectra in terms of anti-viral effects on their biochemistry. In addition, the scores of the cells exposed to low concentrations of both drugs are observed in the bottom left of the PCA space (PC1 vs. PC2), as the concentration of the anti-viral drugs increases, the clusters spread from the bottom to the top left (indinavir exposed cells) or top right (lopinavir exposed cells) of the scores plot (Fig. 1A).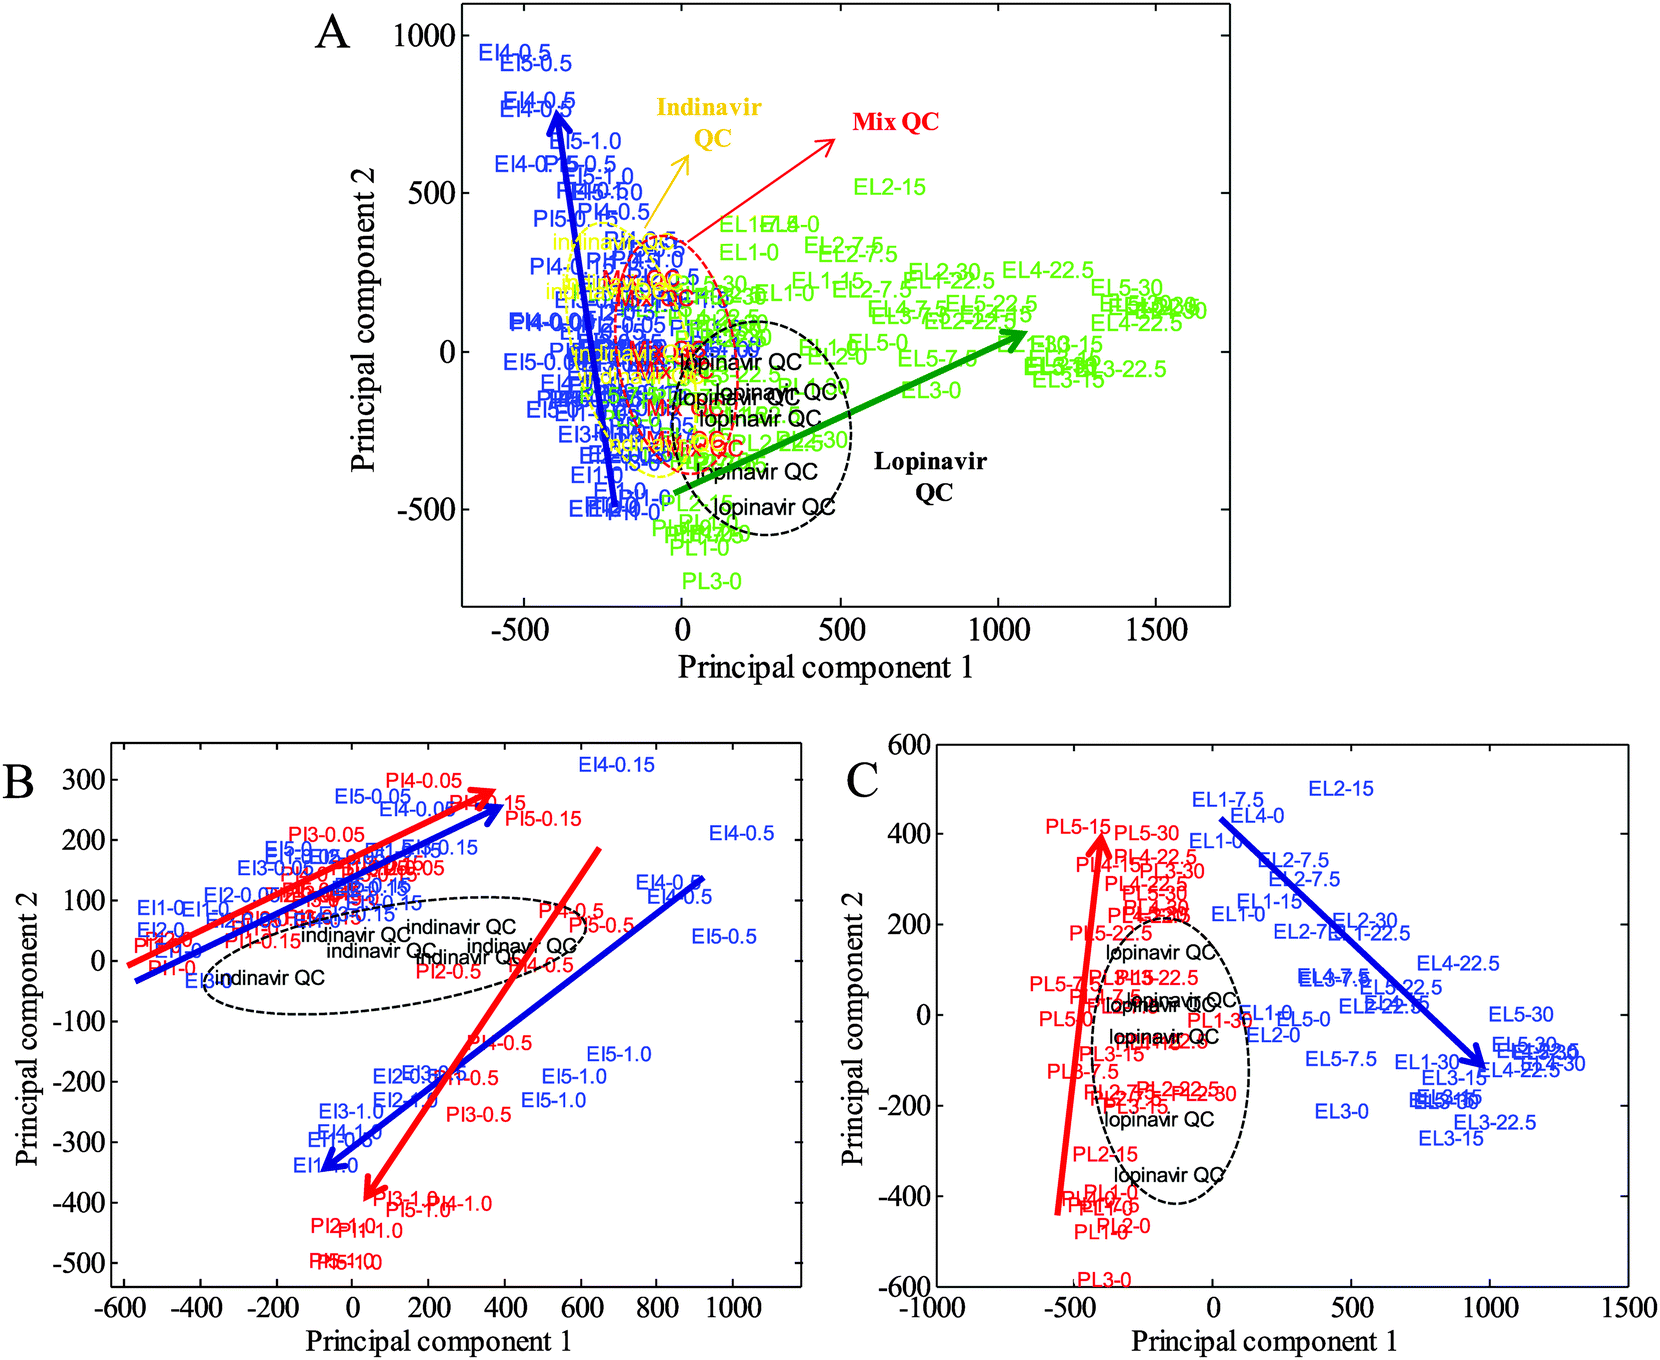 | ||
| Fig. 1 PCA scores plots from C33A parent and E6-transfected cells exposed to indinavir and lopinavir. (A) Mixed, indinavir and lopinavir quality controls (QC) are included as an indication of data quality, (B) indinavir exposed parent (PI) and E6 cells (EI) with indinavir QC, and (C) and lopinavir exposed parent (PL) and E6 cells (EL) with lopinavir QC showing the anti-viral drug effect. (A) PC1 (54.08%) versus PC2 (21.28%); blue: indinavir treated parent and E6 cells; green: lopinavir treated parent and E6 cells; (B) PC1 (51.37%) versus PC2 (17.88%); blue: indinavir challenged E6 cells; red: indinavir challenged parents cells; (C) PC1 (64.28%) versus PC2 (14.61%); blue: lopinavir challenged E6 cells; red: lopinavir challenged parents cells. In all of these plots the first two letters indicate the type of cells and the name of the drug, the third number indicates the number of biological replicates, and the last number represents the drug concentrations (mM for indinavir, μM for lopinavir). Mix QC is an equal mix of all the samples; indinavir QC comprises an equal mix of all indinavir challenged samples; lopinavir QC is an equal mix of all lopinavir challenged samples. Arrows are drawn as a visual guide indicating the relationship between the drug concentrations and the mass spectra. | ||
Next, separate PCAs of indinavir and lopinavir challenged samples were performed to investigate how differently each drug affects intracellular metabolites on C33AP and E6 cells (Fig. 1B and C). As can be seen in Fig. 1B and C, no clear separation between parent and E6 cells exposed to indinavir is observed, whilst scores of C33AP cells treated with lopinavir is separated clearly from those of C33AE6 cells treated with lopinavir. However, better discrimination between indinavir challenged C33AP and E6 cells in the different PCA space (PC1 vs. PC3, data not shown) is observed, indicating inherent differences between the parent and E6 cells in terms of their biochemistry due to the presence of the E6 oncogene in C33AE6 cells. We have recently confirmed the phenotypic differences between host C33A cells and those expressing E6 using the vibration technique of FT-IR spectroscopy.23 Interestingly on closer inspection of each PCA the scores from C33AP and E6 cells exposed to indinavir show similar trends whereas those from C33AP and E6 cells exposed to lopinavir reveal markedly different trends, suggesting that the cells are interacting with lopinavir in a different way when compared to indinavir. Therefore, these results from PCA clearly reveal that metabolite profiling using UPLC-MS is sensitive enough to detect the metabolic changes elicited by each anti-viral drug.
UPLC-MS feature selection
To investigate which mass ions contributed to the separations and trends from each cell line and drug treatment 2-way orthogonal comparisons were made between 0 dose and mid-dose, and 0 dose and high-dose samples for each drug treatment using PCA. To clarify the drug effect between drug concentrations, mid- (0.15 mM for indinavir and 15 μM for lopinavir) and high-dose (1.0 mM for indinavir and 30 μM for lopinavir) were chosen (ESI,† Fig. S2). Furthermore, to determine the chemical differences between each two sample groups, a scatter plot (S-plot) based upon PC loadings from the 2-way PCA was performed. Examples of each 2-way PCA ordination and S-plot are provided in Fig. S2 (ESI†).PCA ordination scores plots from all 2-way comparisons showed clearly separated clusters (data not shown) between non-drug exposed control cells, and mid- and high-dose exposed cells which indicate metabolic differences in terms of the level and compositional changes of intracellular metabolites caused by the anti-viral drugs. S-plots were constructed to determine significant variables contributing to the class separation. EMRT pairs making significant positive or negative contributions to the PC1 axis, which separates the classes, were selected. As a result, 225 key mass ions out of 1860 EMRT pairs were selected and cross checked with significant variables selected by univariate N-way ANOVA (with the false discovery rate Q ≤ 0.05).45p-Values and putative identification based on 1860 EMRT pairs are shown in Table S1 (ESI†). This resulted in 71 of the EMRT pairs being selected by both multivariate and univariate analyses. Possible adducts species were then removed, and finally 34 of the common key mass ions were selected for unambiguous metabolite identification (Table 1). For identification of key metabolites, the proposed elemental composition, C5H9NO2 of m/z 116.0714 [M + H]+ was calculated automatically and was searched against online databases. Following this, MassFragment software was used to assign the high energy MSE fragments according to the proposed metabolite, proline (ESI,† Fig. S1A and B) and then UPLC-MS/MS analysis was performed on both m/z 116.0714 (RT 0.3856) and the standard compound of proline (Fig. S1C and D, ESI†). As can be seen in Fig. S1B (ESI†), m/z 116.0714 was unambiguously confirmed as proline by comparing UPLC-MS/MS fragmentation of sample EMRT with that of the authenticated proline standard. Using the same procedure of UPLC-MS/MS analysis as above, m/z 120.0806 (RT 2.1775) was determined as 2,3-dihydro-1H-indole (indoline). Further putative metabolite identifications of significant variables were provided by applying the PutMetID workflow.39,40
| RT | m/z | True mass | Elemental composition | Adduct | Putative IDs | Confidence |
|---|---|---|---|---|---|---|
| a MSI metabolite identification confidence levels,31 level 1 – RT and MS/MS match to reference standard; level 2 – MS/MS match but no standard; level 3 – MS match to MMDB, GMD, or NIST 05 library; level 4 – unidentified. | ||||||
| 0.5956 | 80.0505 | 79.0432 | C5H5N | Pyridine | 3 | |
| 0.6129 | 86.992 | 85.9847 | Unidentified | 4 | ||
| 0.5292 | 87.0266 | 86.0193 | C4H6S | 2,3-Dihydrothiophene; 2,5-dihydrothiophene; but-3-yne-1-thiol | 3 | |
| 0.3856 | 116.0714 | 115.0641 | C5H9NO2 | Proline | 1 | |
| 2.3639 | 118.0662 | 117.0589 | Unidentified | 4 | ||
| 0.7755 | 119.0498 | 118.0425 | C9H8O3 | HCOOH | Coumarate; hydroxy-nonene-diynoic acid; benzoyl acetate; caffeic aldehyde; hydroxycinnamate; coumarinate; phenylpyruvate; cyclopenta[b]pyran | 3 |
| 2.1775 | 120.0806 | 119.0733 | C8H9N | Indoline | 1 | |
| 0.6267 | 123.0537 | 122.0464 | Unidentified | 4 | ||
| 0.5355 | 150.0596 | 149.0523 | C5H11NO2S | Methionine | 2 | |
| 0.7716 | 165.0551 | 164.0478 | C9H8O3 | Coumarate; hydroxy-nonene-diynoic acid; benzoyl acetate; caffeic aldehyde; hydroxycinnamate; phenylpyruvate; trans-hydroxycinnamate | 3 | |
| 2.2151 | 166.0870 | 165.0797 | C9H11NO2; C9H8O | H; NH3 | Phenylalanine; pyridyl-butanoate; aminohydrocinnamic acid; tyrosinal; hydroxy-indanone; isochromanone; hydroxycinnamyl aldehyde; coumaraldehyde; dihydrocoumarin; trans-cinnamate | 3 |
| 2.3923 | 173.0826 | 172.0753 | C8H12O4 | 2-Octenedioic acid | 3 | |
| 2.3676 | 179.0499 | 178.0426 | Unmatched adduct | 4 | ||
| 2.4619 | 187.0987 | 186.0914 | C8H12O4 | 2-Octenedioic acid adduct | 2 | |
| 2.4501 | 227.0861 | 226.0788 | C5H12N6O3 | Na | Dimethylenetriurea | 3 |
| 2.4034 | 232.1559 | 231.1486 | C11H21NO4 | (iso)Butyrylcarnitine | 2 | |
| 2.4998 | 245.0991 | 244.0918 | C15H13FO2; C10H22O2S; C7H14N4 | H; K; Na_HCOONa | Flurbiprofen; MPC-7869; octyl-hydroxyethyl sulfoxide; guancydine | 3 |
| 2.4427 | 246.1701 | 245.1628 | C12H23NO4; C13H19N5; C12H20O4 | H; NH3 | Methylbutyroylcarnitine; isovalerylcarnitine; pinacidil; dodecenedioic acid; dioxo-dodecanoic acid; traumatic acid | 3 |
| 2.458 | 267.0804 | 266.0731 | C10H14N4O2; C10H14O4; C8H16O4 | Na_Na; HCOONa; Na_HCOONa | IBMX; morinamide; (dimethoxylphenyl)ethane-diol; dihydroxymint lactone; dihydroxy-dihydro-cumate; guaifenesin; dihydroxy-octanoic acid; cladinose | 3 |
| 2.4194 | 281.1052 | 280.0979 | C15H18N2O; C14H14ClNO2; C9H11F2N3O4; C9H16N4S | K; NH3; NH3; HCOONa | Octahydroindolo[2,3-a]quinolizin-(6h)-one; huperzine A; selagine; clopirac; gemcitabine; burimamide | 3 |
| 2.3863 | 305.0824 | 304.0751 | C13H18C12N2O2; C15H14N4S; C17H14N2; C14H18N2O | H; Na; NaCl; KCl | Melphalan; methylphenylsulfanyl-quinazolinediamine; ellipticine; olivacine; camoensine; ibudilast; isopropylantipyrine | 3 |
| 0.5752 | 308.0923 | 307.085 | C10H17N3O6S; C18H13NO4; C13H19NO4S; C16H15N3 | H; H; Na; NaCl | Glutathione; stealthin C; letrozole; probenecid; epinastine | 3 |
| 2.3854 | 328.1427 | 327.1354 | C18H23NO; C11H23N7 | NaCl; KCl | Bifemelane; orphenadrine; meladrazine | 3 |
| 0.5226 | 348.0719 | 347.0646 | C10H14N5O7P | Deoxyguanosine-monophosphate; AMP; azido-deoxythymidine-monophosphate; ribosyladenine-phosphate; adenosine-phosphate; dGMP; formycin-monophosphate; vidarabine phosphate | 3 | |
| 2.3935 | 367.1521 | 366.1448 | C17H20CIN3O3; C19H22N4O; C19H22O3; C16H26O4 | NH3; Na_Na; HCOONa; HCOOK | Azasetron; aminacrine; doisynoestrol; glepidotin C; ostruthin; hydroxy juvenile hormone III; oxo-hydroxy-hexadecadienoate | 3 |
| 3.073 | 374.2459 | 373.2386 | C26H31NO | 131-I-TM-601; androsta-dienoquinolinol | 3 | |
| 2.4834 | 392.1374 | 391.1301 | C18H28NO4P; C22H23NO2; C19H27NO3; C19H21N3O; C16H24FNO | K; NaCl; KCl; HCOOK; NaCl_HCOONa | Dimemorfan phosphate; (alphaS, betaS)-alpha-ethyl-alpha-(4-methoxyphenyl)-beta-phenyl-2-pyridineethanol; enpromate; glycopyrrolate; nateglinide; protoemetine; tetrabenazine; alcaftadine; talastine; zolpidem; UH-301 | 3 |
| 5.4651 | 426.3594 | 425.3521 | Unidentified | 4 | ||
| 2.3931 | 434.1229 | 433.1151 | C22H21NO7; C18H20FN5O4; C18H23NO6; C18H24ClN3O2; C17H18FN5O2; C19H27NO3; C19H21N3O | Na; Na_Na; HCOOK; HCOOK; Na_HCOONa; NaClx2; NaCl_HCOONa | Cetocycline; gemifloxacin; riddelline; pancopride; 8-benzo[1,3]dioxol-,5-ylmethyl-9-butyl-2-fluoro-9h-purin-6-ylamine; glycopyrrolate; nateglinide; protoemetine; tetrabenazine; alcaftadine; talastine; zolpidem | 3 |
| 1.6819 | 466.1115 | 465.1042 | C15H21N7O7S; C19H25NO10; C20H21N5O6; C20H25NO2S2 | Na; K; K; Na_HCOONa | 5′-O-(N-(L-Prolyl)-sulfamoyl)adenosine; vicianin; lucumin; pemetrexed; tiagabine | 3 |
| 0.3735 | 635.1423 | 634.135 | C20H32N6O12S2 | Na | Glutathione disulfide; oxidized glutathione; oxiglutatione | 3 |
| 2.3512 | 685.1863 | 684.179 | C34H32N4O9; C31H36O12 | Na_Na; HCOOK | 2-Octenedioic acid/(iso)butyrylcarnitine adduct; nicomol | 3 |
| 2.3686 | 768.1238 | 767.1165 | C21H36N7O16P3S | 2-Octenedioic acid/(iso)butyrylcarnitine adduct; coenzyme A | 3 | |
| 5.3537 | 949.6295 | 948.6222 | C59H90O7; C53H90O6 | K; NaCl_HCOONa | Thermocryptoxanthin-13; TG(50:6) |
3 |
Drug quantification in C33A parent and E6-transfected cells exposed to indinavir and lopinavir using UPLC-MS
To determine the intra-cellular concentration of anti-viral drugs, indinavir and lopinavir in drug challenged C33AP and E6 cells, sets of serially diluted drug standards of known concentration (indinavir, 0.5, 0.75, 1, 2.5, 5, 7.5, 10, 25, 50, 75, 100, 250, 500 μM; lopinavir, 5, 10, 15, 20, 25 and 30 μM) and extracts from C33AP and E6 cells exposed to indinavir and lopinavir (profiling samples) were initially analysed by UPLC-MS as described above. Calibration curves containing a minimum of six data points were then created using data sets from the standards of known concentration (analysed six times and averaged for each concentration). The linearity of the calibration curves of indinavir and lopinavir (R2) by UPLC-MS were 0.9979 and 0.9301, respectively, and so they proved to be suitable for quantification. Following this, the extract concentrations of the two drugs for each cell line were determined against the calibration curves by comparison of the mass spectral drug intensity (extracted peak area for lopinavir or indinavir parent mass ion converted to the natural log value) recorded in the cellular extracts. The drug levels within the cellular extracts are reported in Table 2. The quantification can only be viewed as relative and the reported values as arbitrary. This relates back to issues in relating the predicted extract molar concentration back to the cell weight in each extract. Due to limited volumes of material and the requirement to perform sample processing and extraction rapidly, neither determination of sample FW or a cell count were performed, instead sample normalisation was performed according to the DW of the extract. However, as it is known that treatment with the anti-viral compounds does not reduce cell growth;23,24 in total three flasks were pooled (each containing ∼5 × 10⁶ cells) to provide enough material (∼15 × 106 cells) for metabolite extraction. Thus the values presented in Table 2 can only be related back to the estimated cell number of ∼15 × 106 cells and not to a true cell weight, as one would desire, and thus the values can only be considered as arbitrary but are still suitable for the relative comparison of anti-viral levels between the different C33A cultures.| Sample type | Lopinavir/indinavir (arbitrary) | Standard error |
|---|---|---|
| a Indinavir and lopinavir were quantified in C33AP and C33AE6 cells that had been previously challenged with various concentrations of the two anti-viral compounds. The profiling extracts were diluted so as to not saturate the mass spectrometers detector. Analytical standards for the two anti-viral compounds were serially diluted, analysed six times and the data averaged. The extracted peak areas for the anti-viral compounds parent masses within both the analytical standards and the sample extracts were transformed to their natural log values, calibration curves were constructed for the two anti-viral compounds, the concentration of the anti-viral compounds within the cellular extracts were predicted against the calibration curves. b ND: Not detected. | ||
| C33AE6 0 μM lopinavir challenged | NDb | ND |
| C33AE6 7.5 μM lopinavir challenged | 8.8 | 1.182793 |
| C33AE6 15 μM lopinavir challenged | 11.54 | 1.282809 |
| C33AE6 22.5 μM lopinavir challenged | 15.32 | 1.119553 |
| C33AE6 30 μM lopinavir challenged | 20.54 | 1.216799 |
| C33AP 0 μM lopinavir challenged | ND | ND |
| C33AP 7.5 μM lopinavir challenged | 15.36 | 1.087474 |
| C33AP 15 μM lopinavir challenged | 26.92 | 3.163131 |
| C33AP 22.5 μM lopinavir challenged | 33.18 | 2.55918 |
| C33AP 30 μM lopinavir challenged | 37.52 | 2.847174 |
| C33AE6 0 mM indinavir challenged | ND | ND |
| C33AE6 0.05 mM indinavir challenged | 52.96 | 13.91149 |
| C33AE6 0.15 mM indinavir challenged | 277.96 | 19.0113 |
| C33AE6 0.5 mM indinavir challenged | 343.44 | 25.98102 |
| C33AE6 1 mM indinavir challenged | 583.24 | 67.82022 |
| C33AP 0 mM indinavir challenged | ND | ND |
| C33AP 0.05 mM indinavir challenged | 121.88 | 29.02114 |
| C33AP 0.15 mM indinavir challenged | 162.08 | 30.96893 |
| C33AP 0.5 mM indinavir challenged | 102.44 | 19.96671 |
| C33AP 1 mM indinavir challenged | 195.28 | 61.89755 |
As can be seen in Table 2, intra-cellular levels of lopinavir were approximately two-fold lower in the C33AE6 than C33AP cells, suggesting that C33AE6 is actively excreting the lopinavir anti-viral drug from the cell. It is known that multidrug resistance is a major function of cancer cells, which develop resistance to toxic or chemotherapy drugs.46,47 This multidrug resistance has been highly correlated to the function of molecular ‘efflux pumps’, which actively excrete chemotherapy drugs from the cell.46 Interestingly, it has been reported that p53 mutations and/or a loss of p53 function strengthens multidrug resistance in neuroblastoma cell lines.48 Thus, it could be hypothesised that since expression of viral E6 proteins in C33AE6 cells inappropriately activates the 26S proteasome to degrade p53,22 very low levels of p53 proteins in the cells could cause high-level multidrug resistance, and thus lopinavir could be excreted from the cells via membrane efflux pumps. On the contrary, intra-cellular levels of indinavir were greater in the C33AE6 than C33AP cells. Perhaps one would expect that indinavir and lopinavir would act in the same way upon the C33AE6 and C33AP cells, however the concentrations of the two anti-viral compounds used for treatment differ massively (7.5–30 μM lopinavir, 0.05–1 mM indinavir), even the structures of the two anti-viral compounds differ significantly, and it is possible that a culmination of structural and dosing differences between the two anti-viral compounds may explain these effects within challenged C33AP and E6 cultures. Previous work revealed that the concentration of indinavir was approximately eight-fold greater in the nucleus than in the cytoplasm of C33A E6 cells, which demonstrated that indinavir undergoes enhanced nuclear translocation in E6 expressing cells only and this suggests that the nucleus is the most likely site of action for this compound against HPV.24 The current data perhaps reflects that due to the nuclear localisation of indinavir within C33AE6 cells, the final concentration of the drug is maintained at a greater level than in the parent cells where no such nuclear localisation has been observed in previous studies. It must also be taken into account that the reported concentrations of indinavir within the various cell lines can be quite variable; this variability was even observed within the same cell line at the same dosing concentration. It is likely that this is an indication of the problems caused due to indinavir crystallising within the challenged cell cultures, which relates to the high concentration of indinavir that the cells were subjected to. Indinavir crystallisation has even been observed within HIV patients being treated with high concentrations of indinavir.
Trend plots were employed to determine which mass ions are altered significantly by drug concentrations and these are shown in Fig. 2. In these plots the peak intensities for the selected analytes from univariate and multivariate analyses are compared across the entire concentration series, visualising those metabolites which are reduced or elevated. As can be seen in Fig. 2, there are several patterns explaining the drug associated level changes of metabolites. In indinavir challenged C33AP and E6 cells, the intensities of m/z 80.0505 at RT 0.5956 (pyridine; putative assignment), m/z 116.0714 at RT 0.3856 (proline; confirmed assignment), m/z 173.0826 at RT 2.3923 (2-octenedioic acid; putative assignment), m/z 232.1559 at RT 2.4034 ((iso)butyrylcarnitine; putative assignment) and m/z 348.0719 at RT 0.5226 (deoxyguanosine-monophosphate; putative assignment) decrease as the drug concentration increases.
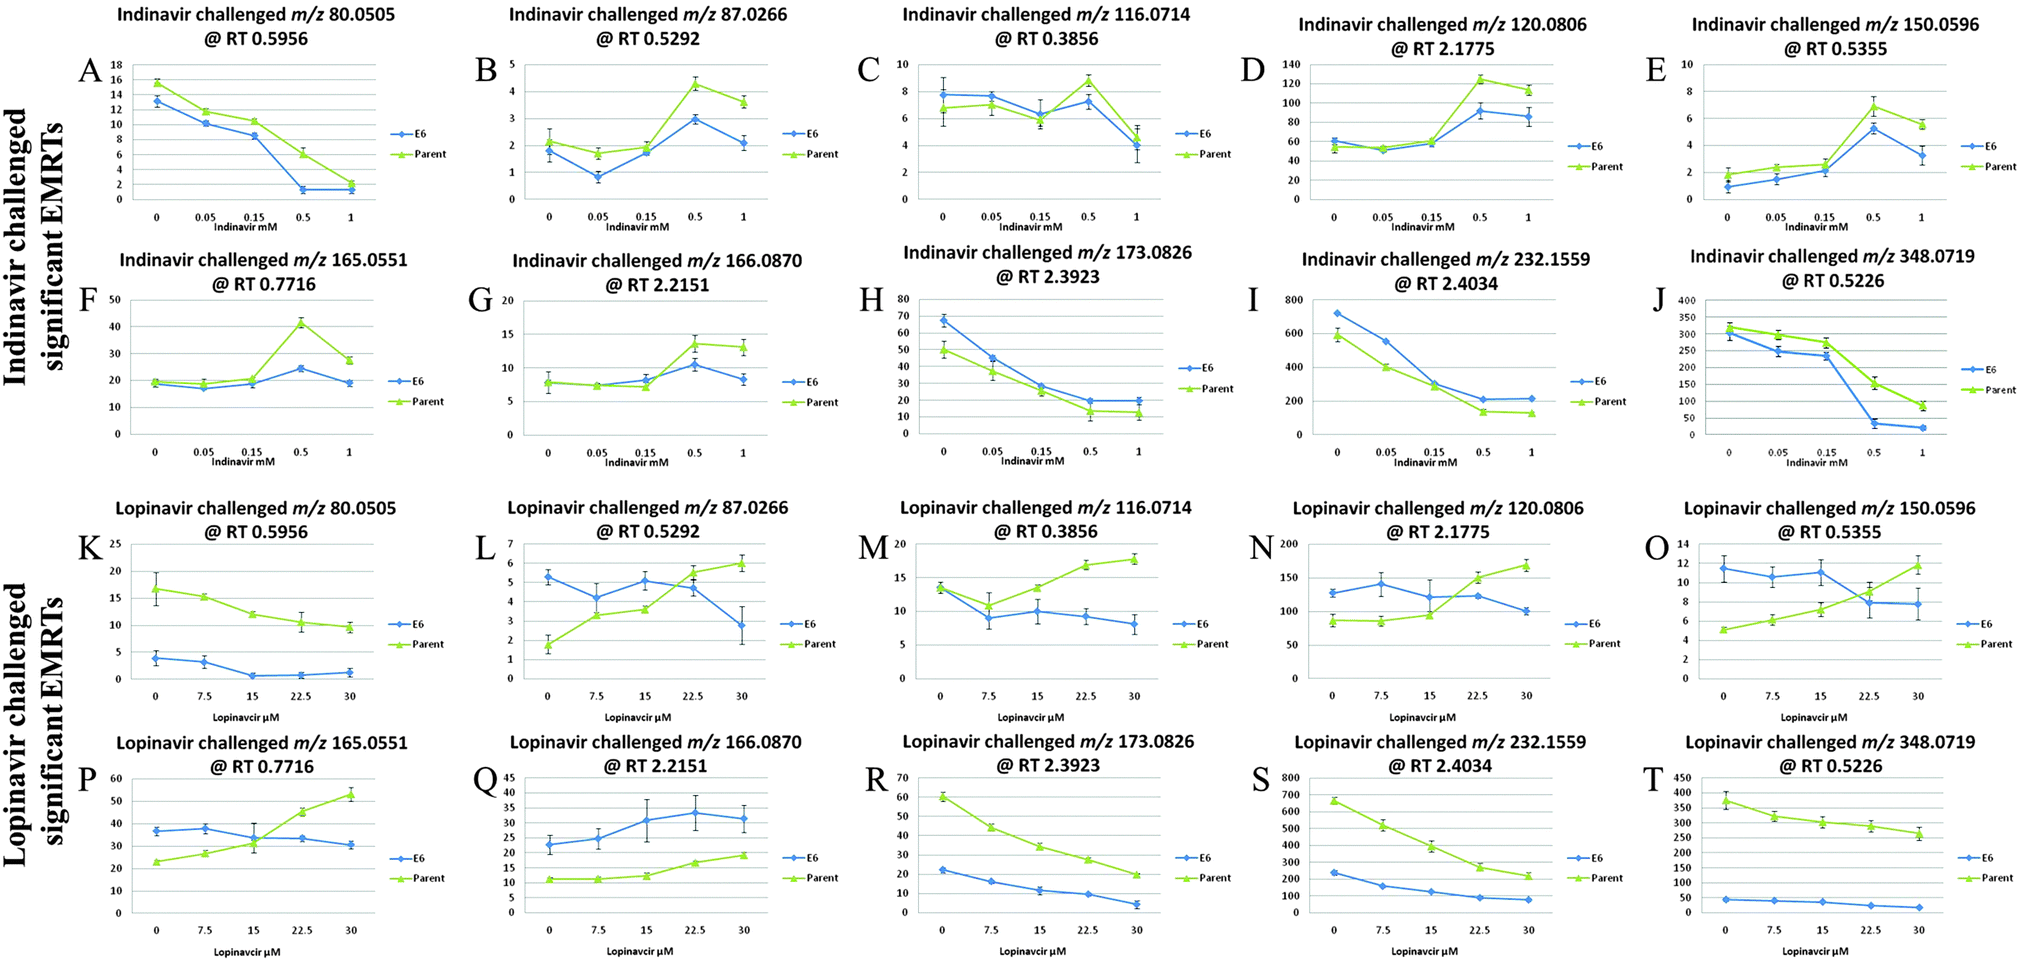 | ||
| Fig. 2 Trend plots of the 10 most significant metabolites. Blue line: C33A E6-transfected cell, green line: C33A parent cell, (A, K) 2-methylenebut-3-enenitrile (tentative assignment); (B, L) 2,3-dihydrothiophene, 2,5-dihydrothiophene or but-3-yne-1-thiol (tentative assignment); (C, M) proline (unambiguously confirmed assignment); (D, N) indoline (unambiguously confirmed assignment); (E, O) methionine (tentative assignment); (F, P) 6-acetyl-2-hydroxy-cyclohepta-2,4,6-trien-1-one or 9-hydroxynon-7-en-3,5-diynoic acid (tentative assignment); (G, Q) phenylalanine (tentative assignment); (H, R) 2-octenedioic acid (tentative assignment); (I, S) (iso)butyrylcarnitine (tentative assignment); (J, T) 2′-deoxy-guanosine 5′-phosphate (tentative assignment). | ||
The intensities of m/z 87.0266 at RT 0.5292 (2,3-dihydrothiophene, 2,5-dihydrothiophene or but-3-yne-1-thiol; putative assignment), m/z 120.0806 at RT 2.1775 (indoline; confirmed assignment), m/z 150.0596 at RT 0.5355 (methionine; putative assignment) and m/z 165.0551 at RT 0.7716 (coumarate; putative assignment) and m/z 166.0870 at RT 2.2151 (phenylalanine; putative assignment) increase as the drug concentration increases. In lopinavir challenged C33AP and E6 cells, like indinavir challenged cells, the intensities of m/z 80.0505, m/z 173.0826, m/z 232.1559 and m/z 348.0719 decrease as the drug dose increases whilst the intensity of m/z 166.0870 increases as the drug dose increases. However, the interesting features are observed in C33AP and E6 cells exposed to lopinavir in terms of the drug response against the two different cell lines. With respect to m/z 87.0266, m/z 116.0714, m/z 120.0806, m/z 150.0596 and m/z 165.0551, their intensities decrease in C33AE6 cells but increase in C33AP cells as the drug concentration increases. This trend analysis also confirms that indinavir and lopinavir interact differently with cells.
Overall, the concentration of phenylalanine increases in both C33AP and E6 cells as the doses of indinavir and lopinavir increase and the concentrations of 2-octenedioic acid, (iso)butyrylcarnitine and deoxyguanosine-monophosphate decrease in both cells as the doses of both drugs increase. The fact that the levels of these four compounds were changed in C33AP cells (which do not produce E6 oncoproteins) as well as C33AE6 could assume that these cellular components represent general drug effects on the two different cells. By contrast, only differences between C33AP and E6 cells exposed to lopinavir in terms of the level changes of metabolites is that concentrations of proline, indoline and methionine decrease in C33AE6 but increase in C33AP cells as lopinavir concentration increases. Generally, since methionine is known as the major methyl group donor of various intermediates in vivo such as methyl groups of DNA and RNA intermediates, the decrease in the level of this compound in lopinavir challenged C33AE6 cells could be connected to the drop in total cellular nucleotides and carbohydrates, as observed in our previous work.23 A decrease in carbohydrates for instance could also be potentially significant, a previous investigation reported that insulin resistance in vitro can be induced by lopinavir, which also inhibits glucose and 2-deoxyglucose uptake into primary rat adipocytes in vitro.49,50 Thus a decrease in the levels of carbohydrates and carbohydrate-based nucleotides could be related to the documented effect of lopinavir on carbohydrate metabolism.
Multivariate analysis of GC-MS profiling data from C33A parent and E6-transfected cells
The C33A E6-transfected cells were grown in the presence of indinavir at concentrations of 0, 0.2 and 1 mM, and lopinavir at concentrations of 0, 15, and 30 μM for 24 h at 37 °C, 5% CO2, giving a total of each three conditions and five biological replicates including the controls. The cells were quenched and extracted using 100% MeOH (−48 °C) and then measured using GC-MS. All the peak areas were normalised to that of the succinic-d4 acid internal standard effectively producing a semi-quantitative output. The deconvoluted and library matched GC-MS profiling data set from each condition was exported as a Microsoft excel sheet and analysed using Matlab. Multi-block cPCA was then carried out to investigate the common effect of the two anti-viral drugs on E6 cells.The plots of super scores and each block scores from cPCA are shown in Fig. 3. The common trend of the two blocks is represented by the super scores space, along with block weights which represent the contribution of each block to the super scores. As can be seen in Fig. 3A, the super scores of C33AE6 cells exposed to low concentrations of indinavir and lopinavir are observed in the bottom right hand corner, as the concentration of the anti-viral drug increases, the cluster spreads from right to left. The two drugs could not be detected by GC-MS due to their large molecular weights, thus the clustering of sample groups is dependent on cellular metabolism and not drug-associated peaks. In successive analyses, each block scores were plotted with the variables within the corresponding block. Again, each block scores from indinavir or lopinavir treated C33AE6 cells show similar patterns to the super score plot, indicating that these two anti-viral drugs have a similar effect on the cells. It is therefore valuable in the sense that these trends are directly associated with the concentrations of indinavir and lopinavir. This result clearly reveals that the metabolic profiling data from C33A HPV16 E6 expressing cervical carcinoma cells using GC-MS contain valuable information for studying the phenotypic effect of the anti-viral drug in terms of level changes of intracellular metabolites.
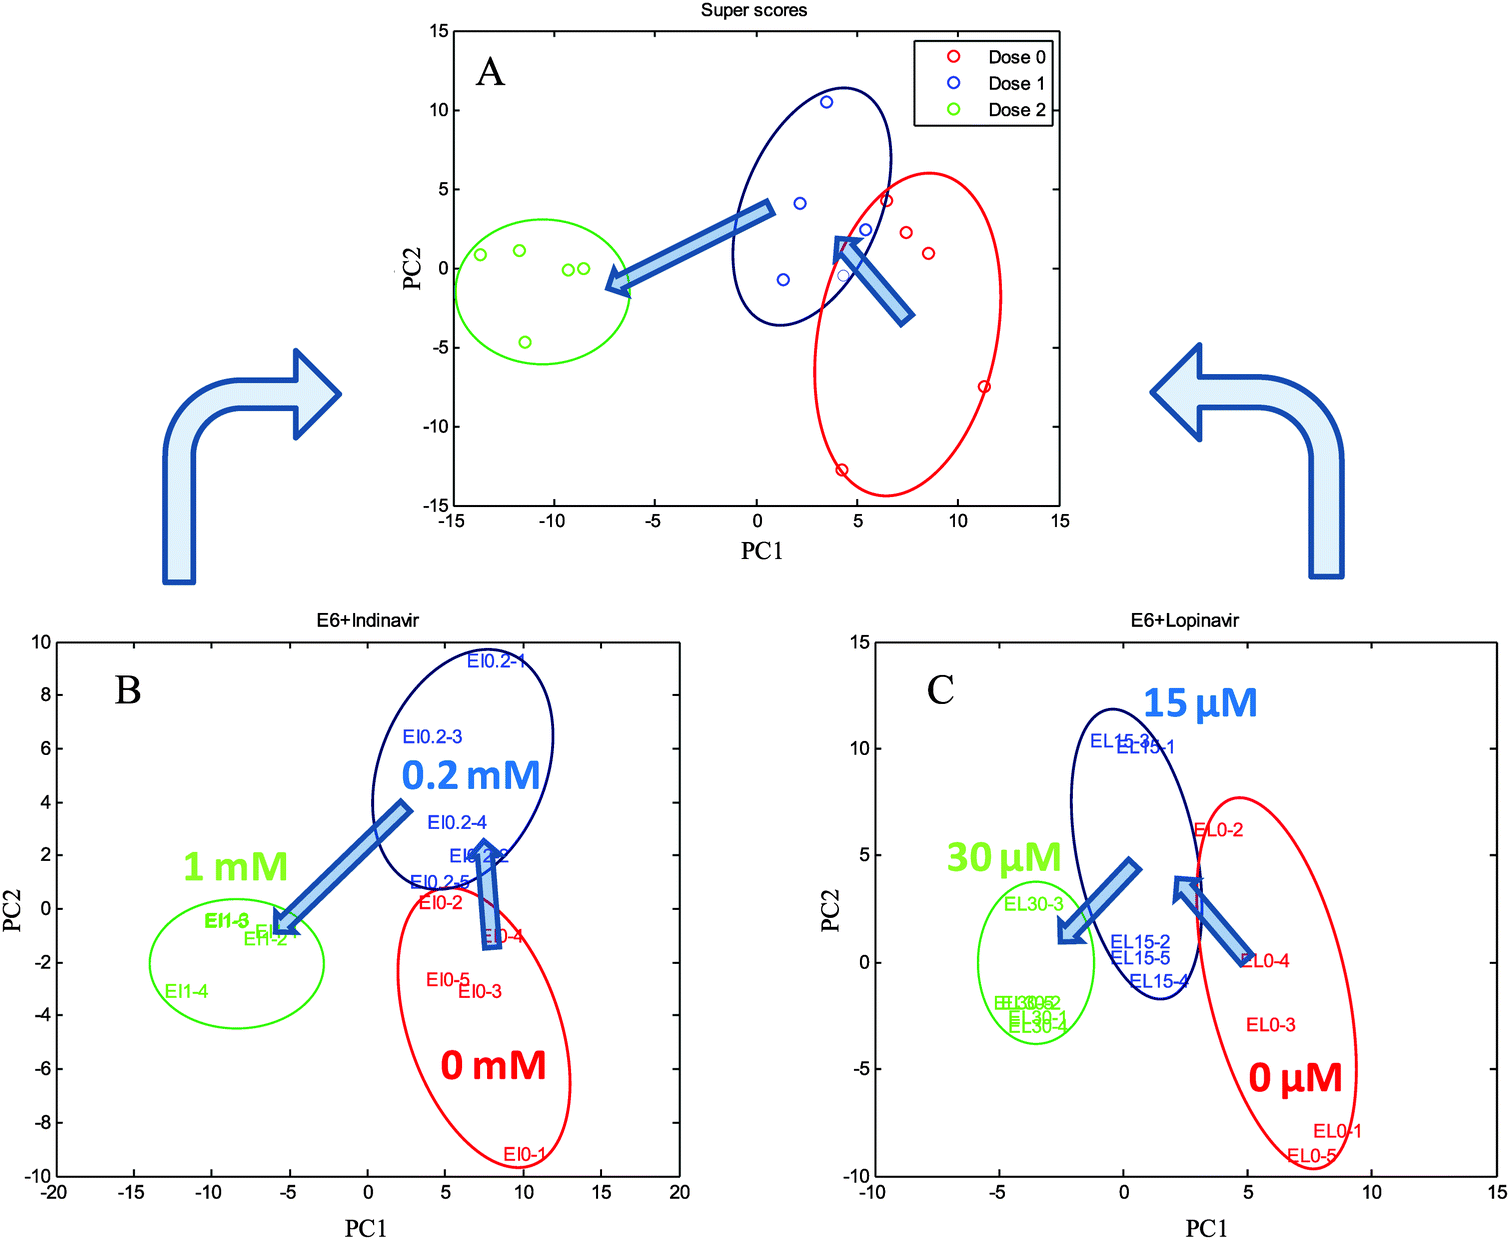 | ||
| Fig. 3 The plots of the super scores (A) and each block score (B, indinavir; C, lopinavir) from cPCA. Arrows are drawn as a visual guide indicating the relationship between the spectra and the concentrations of indinavir and lopinavir. | ||
To investigate which specific metabolites are associated with the anti-viral drug effects, the loadings vectors were calculated for each individual block and plotted (ESI,† Fig. S3). As can be seen in this figure, several significant variables marked by red were identified and confirmed as significant by the Friedman test (non-parametric 2-way ANOVA). From these loadings plots, 24 significant metabolite variables were determined and only five metabolites were unambiguously identified through in-house GC-MS libraries as reduced glutathione, aspartic acid, malic acid, cysteine and sugar phosphate, respectively, they show significant quantitative differences that correlate to the different drug doses. As can be seen in Fig. 4, the levels of these metabolites are reduced as the concentration of the anti-viral drugs increases. In addition, other than significant variables from the loadings plots, which show the common effect between two anti-viral drugs, some of the metabolites such as octadecenoic acid and lactose reveal the significant concentration change associated with increasing indinavir doses whereas no clear level changes of these metabolites are shown against increasing lopinavir concentrations (Fig. 5).
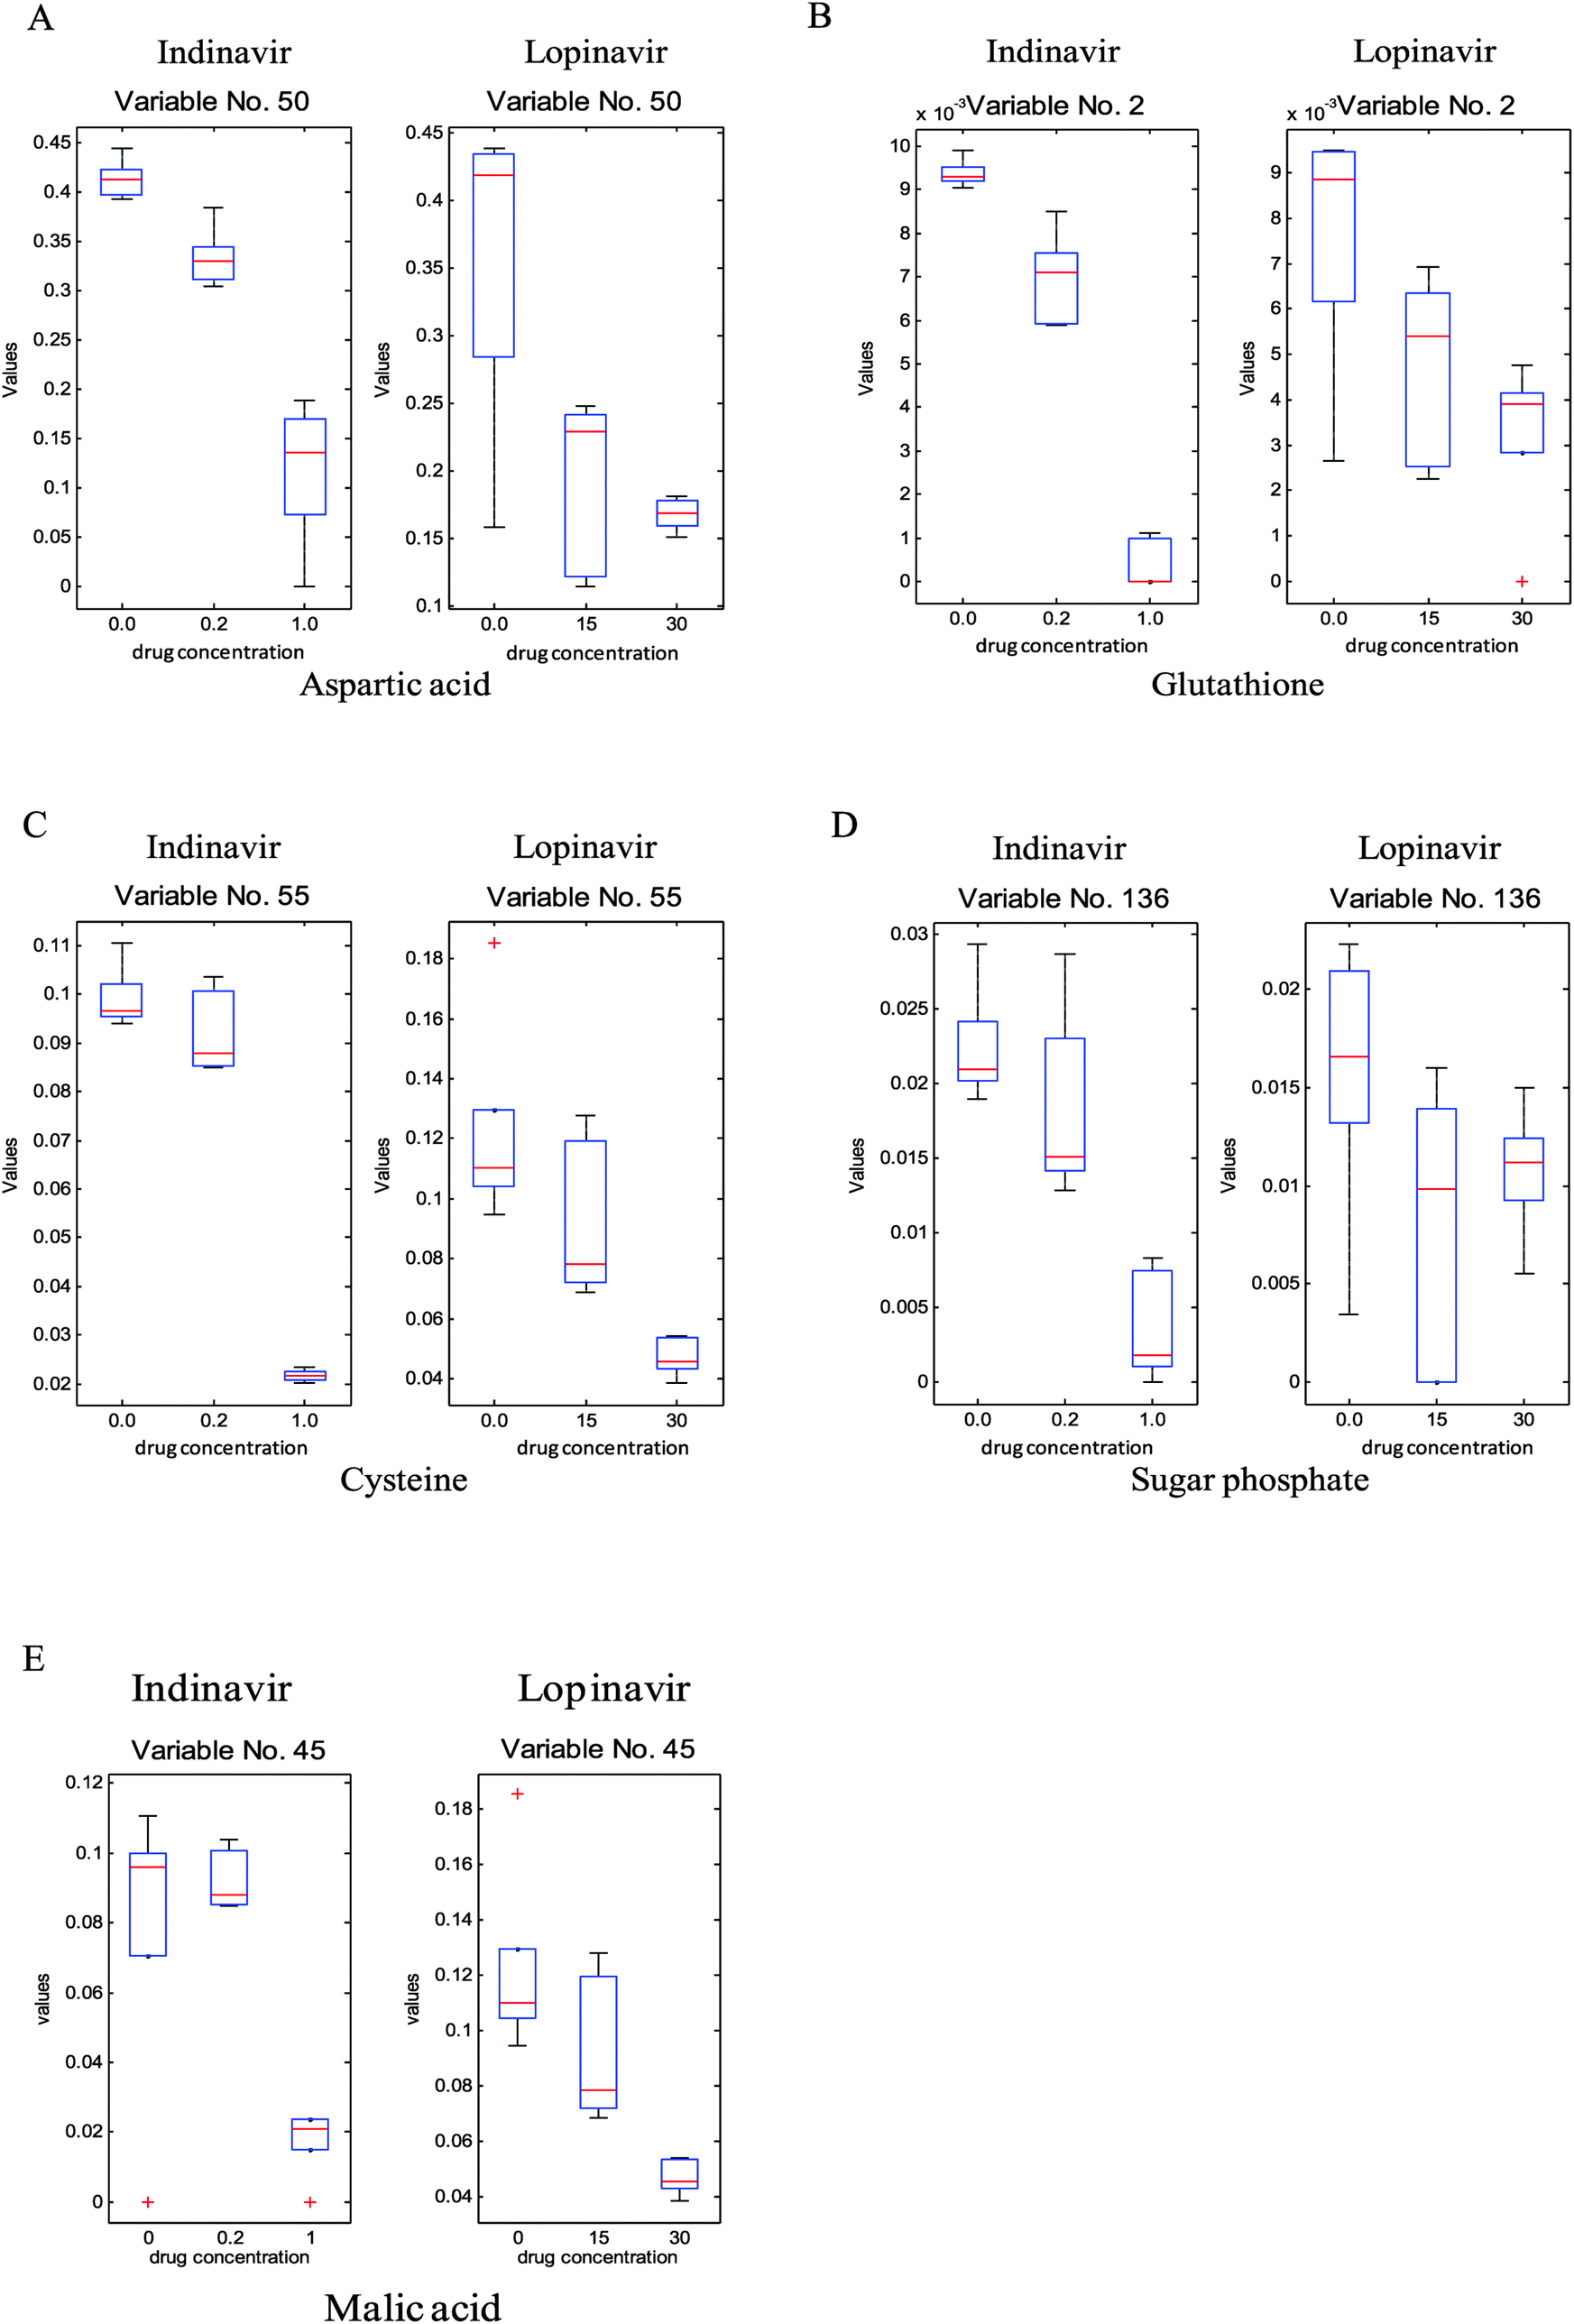 | ||
| Fig. 4 Box plots of identified metabolites (A, glutathione; B, aspartic acid; C, cysteine; D, sugar phosphate; E, malic acid) deemed as significant common trends by cPCA resulting from exposure of C33A E6 cell cultures to indinavir (left) and lopinavir (right). | ||
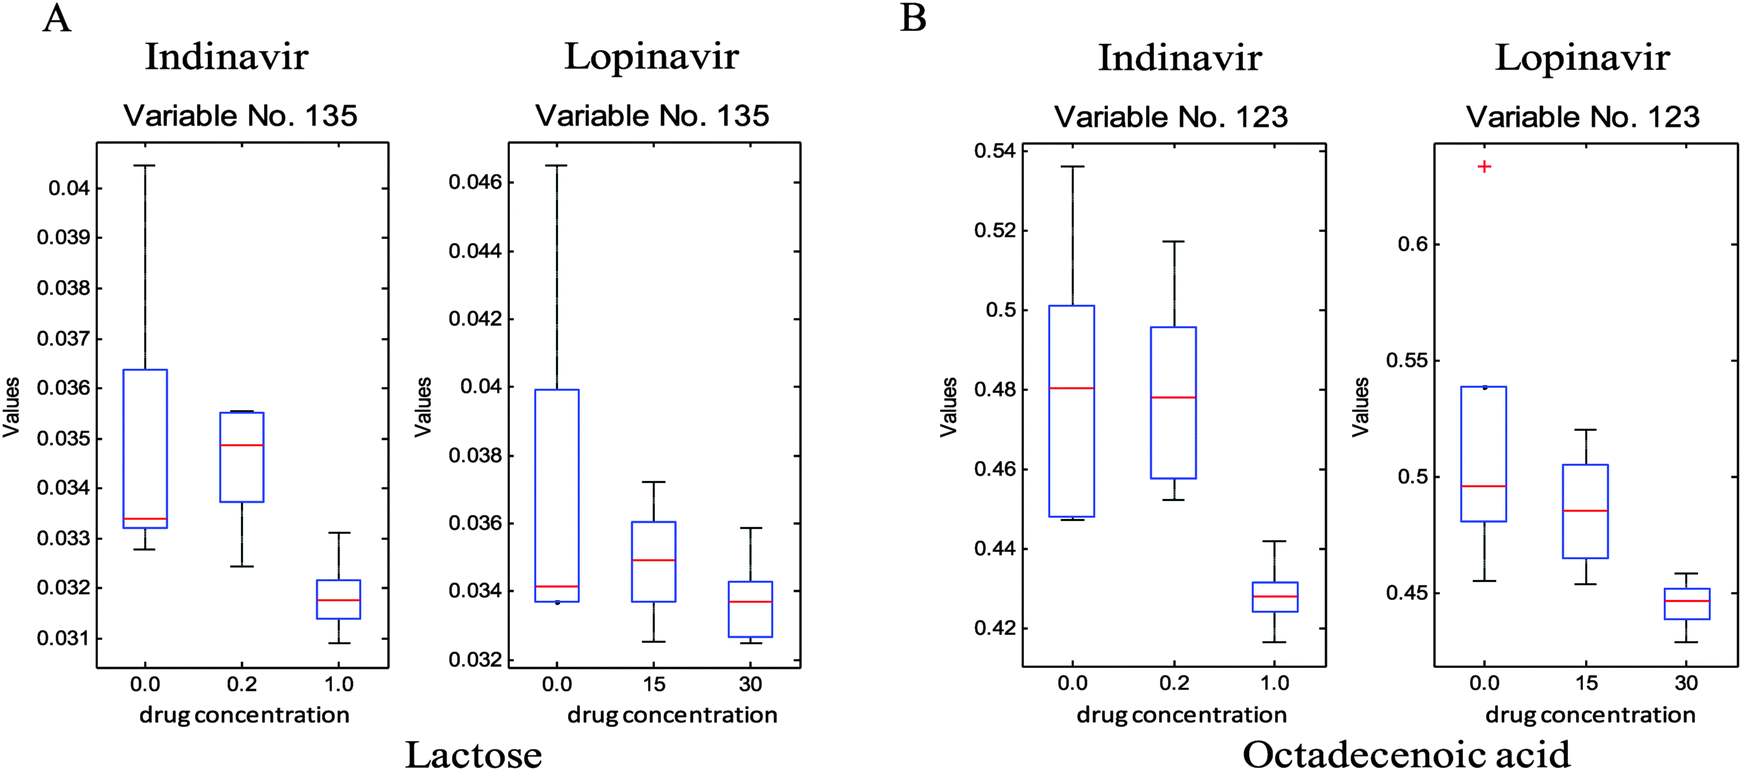 | ||
| Fig. 5 Box plots of metabolites (A, octadecenoic acid; B, lactose) against the concentrations of indinavir (left hand side) and lopinavir (right hand side). | ||
Conclusion
Intracellular metabolite changes caused by indinavir and lopinavir in the presence and absence of HPV16 E6 against an isogenic background (C33A cervical cancer cells) were investigated using MS-based metabolomics. We believe that this could help towards providing a means of defining the mode of action of these compounds against HPV, which is not the designed target for these HIV protease inhibitors. Thus the objective of the study was to identify key metabolites involved in the anti-viral response and to provide information related to the pathway relationships between these components.UPLC-MS-based metabolic profiling in combination with a variety of univariate and multivariate analyses such as N-way ANOVA and PCA is a very useful method for the determination of specific and common metabolic effects of indinavir and lopinavir on these cells. Along with identifying all peaks that are seen in UPLC-MS we also selected significantly altered metabolites from univariate and multivariate statistical methods to be subsequently identified employing UPLC-MS/MS. This process is valuable since unequivocal identification of all low molecular weight metabolites is considered to be a challenging step in the application of metabolomics. In addition, we also confirm that the change in the levels of phenylalanine, 2-octenedioic acid, (iso)butyrylcarnitine and deoxyguanosine-monophosphate in drug challenged C33AP and E6 cells could be thought of as general drug effects on both cell lines whereas a reduction of the levels of proline, indoline and methionine in only lopinavir exposed C33AE6 cells represents E6 oncogene specified effects of the drug. These compounds can potentially be used for the specific biomarkers in order to understand the mechanism of the anti-viral drug effect against HPV, and their role within the mode of action of these protease inhibitors will be an area of future work. Furthermore, we also report that the level of the lopinavir anti-viral drug detected in C33AE6 cells is significantly lower than in C33AP cells treated with the same dosing concentration. By contrast, the level of the indinavir anti-viral detected in C33AE6 cells is significantly higher than in C33AP cells treated with the same concentration. Although this is currently difficult to explain fully, several hypotheses have been generated for future research based upon the leads presented by this metabolomics investigation and our previous observation that indinavir is found at concentrations eight-fold higher in the nucleus compared to the cytoplasm.24 The multifunctional effects of HIV protease inhibitors are well known51 and the nuclear translocation of indinavir is potentially interesting. High risk HPV16 E6 also localizes predominantly in the nucleus52 and it is known that it participates not only in the proteosomal destruction of TP53 but also acts to prevent the binding of the TP53/p300 transcriptional complex to its nuclear transactivation target genes.29 Thus it is possible that nuclear indinavir may participate in suppressing the ability of E6 to block the transactivation function of TP53. However, as we have stated, the off target activities of HIV PIs are very diverse and will clearly form the basis of future studies.
To supplement this UPLC-MS analysis GC-MS was used on a subset of the samples. Unfortunately, as with the UPLC-MS metabolic profiling, the number of key statistically significant metabolites that can be identified is limited, indicating that current GC-MS libraries also need to be improved substantially for this cervical cell culture-based target matrix, however as with UPLC-MS this is greatly limited by the availability of high purity reference standards allowing unambiguous identification.31 Despite of this limitation, GC-MS analyses have resulted in the detection of several statistically significant and potentially clinically interesting metabolites such as the detoxification related compound glutathione (m/z 308.0923 at RT 0.5752) in a reduced form. A reduction in levels of the sugar lactose and also a concurrent reduction in sugar-phosphate and the unknown sugars were seen as anti-viral dosing levels increased. This may be related to a reduction in energy metabolism or the arrest more specifically of glycolysis and potentially enhanced mitochondrial energy metabolism. Malic acid was also lowered as anti-viral dosing increased potentially indicating that the anti-virals were also having a direct influence upon the TCA cycle. Reductions of the amino acid, aspartic acid, also indicate that the anti-virals are impacting greatly upon central metabolism. Unfortunately despite all amino acids being present in our in house metabolite libraries further amino acids and organic acid intermediates of the TCA cycle were not detected and/or identified by GC-MS, although the amino acids proline and methionine were shown to be reduced in C33AE6 cells and phenylalanine increased in C33AE6 cells with increased anti-viral dosing by UPLC-MS profiling. The lack of other amino and organic acids detected by GC-MS profiling indicates the need for further sample bulking in order to produce highly metabolite rich extracts in future experimentation. Octadecanoic acid levels were also seen to decrease with increasing levels of anti-viral exposure which could potentially also be related to the cellular stresses induced by the anti-viral modes of action.
In conclusion we have demonstrated that a combination of UPLC-MS based metabolic profiling with appropriate chemometric analysis is a valuable approach for studying cellular responses to anti-viral drugs. In addition, we have quantified different intracellular drug levels in C33AP and E6 cells which suggest, certainly in the case of lopinavir, that increased activity of membrane transporters may contribute to the drug sensitivity of HPV infected cells, no previous work has been carried out in this area. In future studies, the application of several metabolomics platforms (i.e., UPLC-MS, GC-MS, and potential UPLC-SPE-NMR for aiding in identification),53–55 following the same regime as presented for UPLC-MS here, and/or the use of radiolabeled anti-viral compounds for flux analyses,56 could potentially uncover a large area of effected metabolism leading to in-depth insights as to the anti-viral modes of action.
Conflicts of interest
The authors have no conflict of interest.Acknowledgements
This research was funded by an ORS award to D-H.K. In addition, J.W.A., Y.X. and R.G. wish to thank Cancer Research UK (including Experimental Cancer Medicine Centre award) and the Wolfson Foundation. E.C. and R.G. also acknowledge the EU Commonsense (www.fp7projectcommonsense.eu/) project (Grant 261809) financed by the European Commission under the seventh Framework Programme for Research and Technological Development. R.G. and W.B.D. are also grateful to both the UK BBSRC and EPSRC for financial support of the MCISB. The authors also wish to acknowledge the support of the Humane Research Trust, the Caring Cancer Research Trust and Cancer Research UK.References
- H. zur Hausen, Biochim. Biophys. Acta, Rev. Cancer, 1996, 1288, 55–78 CrossRef.
- E. M. de Villiers, J. Virol., 1989, 63, 4898 CAS.
- M. Scheffner, B. A. Werness, J. M. Huibregtse, A. J. Levine and P. M. Howley, Cell, 1990, 63, 1129–1136 CrossRef CAS.
- D. M. Harper, E. L. Franco, C. Wheeler, D. G. Ferris, D. Jenkins, A. Schuind, T. Zahaf, B. Innis, P. Naud, N. S. De Carvalho, C. M. Roteli-Martins, J. Teixeira, M. M. Blatter, A. P. Korn, W. Quint and G. Dubin, Lancet, 2004, 346, 1757–1765 CrossRef.
- N. Munoz, F. X. Bosch, S. de Sanjose, R. Herrero, X. Castellsague, K. V. Shah, P. J. F. Snijders and C. J. L. M. Meijer, N. Engl. J. Med., 2003, 348, 518–527 CrossRef PubMed.
- L. L. Villa, R. L. R. Costa, C. A. Petta, R. P. Andrade, K. A. Ault, A. R. Giuliano, C. M. Wheeler, L. A. Koutsky, C. Malm, M. Lehtinen, F. E. Skjeldestad, S. E. Olsson, M. Steinwall, D. R. Brown, R. J. Kurman, R. M. Ronnett, M. H. Stoler, A. Ferenczy, D. M. Harper, G. M. Tamms, J. Yu, L. Lupinacci, R. Railkar, F. J. Taddeo, K. U. Jansen, M. T. Essser, H. L. Sings, A. J. Saah and E. Barr, Lancet Oncol., 2005, 6, 271–278 CrossRef.
- M. Kyrgiou, G. Koliopoulos, P. Martin-Hirsch, M. Arbyn, W. Prendiville and E. Paraskevaidis, Lancet, 2006, 367, 489–498 CrossRef CAS.
- H. zur Hausen, J. Natl. Cancer Inst., 2000, 92, 690–698 CrossRef CAS PubMed.
- J. M. Huibregtse, M. Scheffner and P. M. Howley, EMBO J., 1991, 10, 4129–4135 CAS.
- J. M. Huibregtse, M. Scheffner and P. M. Howley, Mol. Cell. Biol., 1993, 13, 775–784 CAS.
- L. Banks, D. Pim and M. Thomas, Trends Biochem. Sci., 2003, 28, 452–459 CrossRef CAS.
- M. Thomas, D. Pim and L. Banks, Oncogene, 1999, 18, 7690–7700 CrossRef CAS PubMed.
- S. Wagner, K. Scholz, M. Donegan, L. Burton, J. Wingate and W. Voelkel, Anal. Chem., 2006, 78, 1296–1305 CrossRef CAS PubMed.
- M. Carrascal, K. Schneider, R. E. Calaf, S. van Leeuwen, D. Canosa, E. Gelpi and J. Abian, J. Pharm. Biomed. Anal., 1998, 17, 1129–1138 CrossRef CAS.
- O. P. Bondar, D. R. Barnidge, E. W. Klee, B. J. Davis and G. G. Klee, Clin. Chem., 2007, 53, 673–678 CAS.
- T. Kind, V. Tolstikov, O. Fiehn and R. H. Weiss, Anal. Biochem., 2007, 363, 185–195 CrossRef CAS PubMed.
- B. Winther and J. L. Reubsaet, J. Sep. Sci., 2007, 30, 234–240 CrossRef CAS.
- C. Chen, X. Ma, M. A. Malfatti, K. W. Krausz, S. Kimura, J. S. Felton, J. R. Idle and F. J. Gonzalez, Chem. Res. Toxicol., 2007, 20, 531–542 CrossRef CAS PubMed.
- C. Chen, F. J. Gonzalez and J. R. Idle, Drug Metab. Rev., 2007, 39, 581–597 CrossRef CAS PubMed.
- P. Begley, S. Francis-McIntyre, W. B. Dunn, D. I. Broadhurst, A. Halsall, A. Tseng, J. Knowles, R. Goodacre and D. B. Kell, Anal. Chem., 2009, 81, 7038–7046 CrossRef CAS PubMed.
- J. C. W. Rijk, A. A. C. M. Peijnenburg, M. H. Blokland, A. Lommen, R. L. A. P. Hoogenboom and T. F. H. Bovee, Chem. Res. Toxicol., 2012, 25, 1720–1731 CrossRef CAS PubMed.
- L. Hampson, H. C. Kitchener and I. N. Hampson, Antiviral Ther., 2006, 11, 813–825 CAS.
- D.-H. Kim, R. M. Jarvis, Y. Xu, A. W. Oliver, J. W. Allwood, L. Hampson, I. N. Hampson and R. Goodacre, Analyst, 2010, 135, 1235–1244 RSC.
- D.-H. Kim, R. M. Jarvis, J. W. Allwood, G. Batman, R. E. Moore, E. Marsden-Edwards, L. Hampson, I. N. Hampson and R. Goodacre, Anal. Bioanal. Chem., 2010, 398, 3051–3061 CrossRef CAS PubMed.
- L. Hampson, E. El Hady, J. V. Moore, H. Kitchener and I. N. Hampson, FASEB J., 2001, 15, 1445–1447 CAS.
- T. Sangster, H. Major, R. Plumb, A. J. Wilson and I. D. Wilson, Analyst, 2006, 131, 1075–1078 RSC.
- W. B. Dunn, I. D. Wilson, A. W. Nicholls and D. Broadhurst, Bioanalysis, 2012, 4, 2249–2264 CrossRef CAS PubMed.
- W. B. Dunn, D. Broadhurst, P. Begley, E. Zelena, S. Francis-McIntyre, N. Anderson, M. Brown, J. D. Knowles, A. Halsall, J. N. Haselden, A. W. Nicholls, I. D. Wilson, D. B. Kell, R. Goodacre and T. H. S. M. H. Consortium, Nat. Protoc., 2011, 6, 1060–1083 CrossRef CAS PubMed.
- M. C. Thomas and C.-M. Chiang, Mol. cell, 2005, 17, 251–264 CrossRef CAS PubMed.
- R. van den Berg, H. Hoefsloot, J. Westerhuis, A. Smilde and M. van der Werf, BMC Genomics, 2006, 7, 142 CrossRef PubMed.
- L. W. Sumner, A. Amberg, D. Barrett, M. H. Beale, R. Beger, C. A. Daykin, T. W. M. Fan, O. Fiehn, R. Goodacre, J. L. Griffin, T. Hankemeier, N. Hardy, J. Harnly, R. Higashi, J. Kopka, A. N. Lane, J. C. Lindon, P. Marriott, A. W. Nicholls, M. D. Reily, J. J. Thaden and M. R. Viant, Metabolomics, 2007, 3, 211–221 CrossRef CAS PubMed.
- M. Brown, W. B. Dunn, P. Dobson, Y. Patel, C. L. Winder, S. Francis-McIntyre, P. Begley, K. Carroll, D. Broadhurst, A. Tseng, N. Swainston, I. Spasic, R. Goodacre and D. B. Kell, Analyst, 2009, 134, 1322–1332 RSC.
- M. Brown, D. C. Wedge, R. Goodacre, D. B. Kell, P. N. Baker, L. C. Kenny, M. A. Mamas, L. Neyses and W. B. Dunn, Bioinformatics, 2011, 27, 1108–1112 CrossRef CAS PubMed.
- S. O'Hagan, W. B. Dunn, M. Brown, J. D. Knowles and D. B. Kell, Anal. Chem., 2005, 77, 290–303 CrossRef CAS PubMed.
- J. Kopka, N. Schauer, S. Krueger, C. Birkemeyer, B. Usadel, E. Bergmuller, P. Dormann, W. Weckwerth, Y. Gibon, M. Stitt, L. Willmitzer, A. R. Fernie and D. Steinhauser, Bioinformatics, 2005, 21, 1635–1638 CrossRef CAS PubMed.
- J. Hummel, N. Strehmel, J. Selbig, D. Walther and J. Kopka, Metabolomics, 2010, 6, 322–333 CrossRef CAS PubMed.
- R. Goodacre, D. Broadhurst, A. K. Smilde, B. S. Kristal, J. D. Baker, R. Beger, C. Bessant, S. Connor, G. Capuani, A. Craig, T. Ebbels, D. B. Kell, C. Manetti, J. Newton, G. Paternostro, R. Somorjai, M. Sjostrom, J. Trygg and F. Wulfert, Metabolomics, 2007, 3, 231–241 CrossRef CAS.
- I. T. Jolliffe, Principal Component Analysis, Springer-Verlag, New York, USA, 1986 Search PubMed.
- L. W. Sumner, P. Mendes and R. A. Dixon, Phytochemistry, 2003, 62, 817–836 CrossRef CAS.
- R. Goodacre, É. M. Timmins, R. Burton, N. Kaderbhai, A. M. Woodward, D. B. Kell and P. J. Rooney, Microbiology, 1998, 144, 1157–1170 CrossRef CAS PubMed.
- H. Wold, Multivariate Analysis, Academic Press, New York, USA, 1966 Search PubMed.
- Y. Xu and R. Goodacre, Metabolomics, 2012, 8, 37–51 CrossRef CAS.
- J. A. Westerhuis, T. Kourti and J. F. Macgregor, J. Chemom., 1998, 12, 301–321 CrossRef CAS.
- A. K. Smilde, J. A. Westerhuis and S. de Jong, J. Chemom., 2003, 17, 323–337 CrossRef CAS.
- Y. Benjamini and Y. Hochberg, J. R. Statist. Soc. B, 1995, 57, 289–300 Search PubMed.
- A. Persidis, Nat. Biotechnol., 1999, 17, 94–95 CrossRef CAS PubMed.
- S. L. McKenna and R. A. Padua, Br. J. Haematol., 1997, 96, 659–674 CrossRef CAS.
- N. Keshelava, J. J. Zuo, P. Chen, S. N. Waidyaratne, M. C. Luna, C. J. Gomer, T. J. Triche and C. P. Reynolds, Cancer Res., 2001, 61, 6185–6193 CAS.
- M. A. Noor, O. P. Flint, J. F. Maa and R. A. Parker, AIDS, 2006, 20, 1813–1821 CrossRef CAS PubMed.
- Q. Yan and P. W. Hruz, J. Acquired Immune Defic. Syndr., 2005, 40, 398–403 CrossRef CAS.
- G. Batman, L. Hampson and I. N. Hampson, Future Virol., 2011, 6, 1021–1023 CrossRef CAS.
- T. Mesplède, D. Gagnon, F. Bergeron-Labrecque, I. Azar, H. Sénéchal, F. Coutlée and J. Archambault, J. Virol., 2012, 86, 94–107 CrossRef PubMed.
- S. Moco, R. J. Bino, R. C. H. De Vos and J. Vervoort, TrAC, Trends Anal. Chem., 2007, 26, 855–866 CrossRef CAS PubMed.
- E. C. Tatsis, S. Boeren, V. Exarchou, A. N. Troganis, J. Vervoort and I. P. Gerothanassis, Phytochemistry, 2007, 68, 383–393 CrossRef CAS PubMed.
- G. Glauser, E. Grata, L. Dubugnon, S. Rudaz, E. E. Farmer and J.-L. Wolfender, J. Biol. Chem., 2008, 283, 16400–16407 CrossRef CAS PubMed.
- G. G. Harrigan, J. Colca, S. Szalma and L. G. Boros, Metabolomics, 2006, 2, 21–29 CrossRef CAS.
Footnotes |
| † Electronic supplementary information (ESI) available. See DOI: 10.1039/c3mb70423h |
| ‡ Current address: Centre for Analytical Bioscience, School of Pharmacy, University of Nottingham, University Park, Nottingham, NG7 2RD, UK. |
| § These authors contributed equally to this work. |
| ¶ Current address: School of Biosciences, University of Birmingham, Edgbaston, Birmingham, B15 2TT, UK. |
| || Current address: Thermo Fisher Scientific, Stafford House, Boundary Way, Hemel Hempstead, HP2 7GE, UK. |
| This journal is © The Royal Society of Chemistry 2014 |