 Open Access Article
 This Open Access Article is licensed under a Creative Commons Attribution-Non Commercial 3.0 Unported Licence
Optimization of a genetically encoded biosensor for cyclin B1-cyclin dependent kinase 1†
Ahmed Saied F.
Belal
a,
Brittney R.
Sell
b,
Hiofan
Hoi
a,
Michael W.
Davidson
b and
Robert E.
Campbell
*a
aDepartment of Chemistry, University of Alberta, Edmonton, Alberta T6G 2G2, Canada. E-mail: robert.e.campbell@ualberta.ca; Fax: +1-780-492-8231; Tel: +1-780-492-1849
bNational High Magnetic Field Laboratory and Department of Biological Science, The Florida State University, Tallahassee, Florida 32310, USA
First published on 19th November 2013
Abstract
Fluorescent protein (FP)-based biosensors have revolutionized the ability of researchers to monitor enzyme activities in live cells. While the basic design principles for FP-based biosensors are well established, first-generation biosensor constructs typically suffer from relatively low fluorescence responses that limit their general applicability. The protein engineering efforts required to substantially improve the biosensor responses are often both labour and time intensive. Here we report the application of a high throughput bacterial colony screen for improving the response of kinase biosensors. This effort led to the development of a second-generation cyclin B1-CDK1 biosensor with a 4.5-fold greater response than the first-generation biosensor.
Since the first report of using engineered FPs to construct Förster resonance energy transfer (FRET)-based biosensors for imaging of intracellular calcium ion dynamics,1 this versatile strategy has been applied to the detection of a diverse selection of biological molecules and events.2 Nonetheless, development and optimization of a biosensor remains a difficult and laborious undertaking, owing to the fact that even when guided by high resolution structural information, the specific properties of the resulting biosensor are generally difficult to predict. Accordingly, essentially all efforts to improve the performance of such biosensors depend on empirical screens of large numbers of variants,3,4 though some generally applicable improvement strategies have been reported.5,6 One promising strategy for accelerating the optimization of a FP FRET-based biosensor is to transplant the mammalian enzyme activity of interest into Escherichia coli, and perform high throughput image-based screening in the context of bacterial colonies.7 We now report the application of this screening strategy to the optimization of FRET-based biosensors for protein kinase B (PKB)/Akt and cyclin dependent kinase 1 (CDK1) in complex with cyclin B1.
Construction of a FP FRET-based biosensor requires genetic fusion of a conformationally labile protein domain, with specific molecular recognition properties, between a FRET pair of FPs.1 The conformational change that accompanies a binding or post-translational modification (PTM) event modifies the distance and/or dipole orientation between the FPs and the FRET efficiency is changed.8 For biosensors of PTMs, the conformationally labile domain is typically a peptide substrate fused to a PTM-binding domain.9,10 When the enzyme activity of interest modifies the substrate domain, the modified peptide will bind to the binding domain, causing a large conformational change and a change in FRET efficiency.
Our lab has previously reported a strategy for screening biosensor constructs for improved emission ratio change in colonies of E. coli.7 The key to this strategy is a dual expression plasmid (pUADE) for expression of two proteins under different promoters (Fig. 1). Briefly, biosensor variants are expressed under the Ptac promoter and a constitutively active enzyme, which catalyzes the post-translational modification of the FRET-based biosensor, is expressed under the PBAD promoter. The PBAD promoter provides tight control of enzyme expression, and can be induced with L-arabinose and repressed with D-glucose.11 Inducing kinase expression leads to the post-translational modification of the FRET construct and, for potentially useful biosensors, a change in FRET efficiency and emission ratio. By imaging a plate of bacterial colonies before and after induction of enzyme expression, the biosensor variants that exhibit the largest changes in emission ratio can be identified (Fig. 2). In this way, screening of large libraries for improved biosensors is feasible. A similar approach has been used to screen a library of FRET biosensors for RNA detection.12
 | ||
| Fig. 1 A protein expression system for high-throughput function-based screening of libraries of kinase biosensor variants. The plasmid encodes a constitutively active kinase downstream of the L-arabinose-inducible promoter PBAD and a kinase biosensor downstream of IPTG-inducible promoter Ptac.7 Activation of PBAD promoter in the context of E. coli colonies leads to the expression of the kinase and phosphorylation of the biosensor. | ||
 | ||
| Fig. 2 Screening methodology used in this work. Colonies of E. coli previously transformed with the plasmid library are grown on D-glucose + IPTG plates, images are acquired for both donor and acceptor emission channels, and emission ratios are calculated on a colony by colony basis. The plate is then sprayed with an L-arabinose solution and, following a 2 hours incubation period, images are again acquired as described. Emission ratio changes due to changes in FRET efficiency are calculated for each colony and those colonies with highest changes are picked for further testing, sequencing, and characterization. | ||
We previously used this system for optimization of a biosensor for histone lysine methylation, though we reasoned that this system could also be used for optimization of biosensors for kinase activity. Such biosensors are composed of a FRET pair of fluorescent proteins joined by a kinase-specific substrate sequence bound by a linker to an appropriate phosphoaminoacid-binding domain. For example, Kunkel et al. have reported the development of a PKB/Akt activity FRET-based biosensor designated B-kinase activity reporter (BKAR).10 BKAR was constructed by genetically fusing the consensus substrate sequence RKKRDRLG![[T with combining low line]](https://www.rsc.org/images/entities/char_0054_0332.gif) LGI and the forkhead-associated domain-2 (FHA2) phosphoaminoacid-binding domain between mCFP and mYFP. This biosensor gave a 30% ratio change upon phosphorylation and showed phosphorylation specificity for PKB over both PKA and PKC.10 Later efforts by Gao et al. to improve the performance of BKAR were not fruitful, and so they developed a related biosensor called Akt activity reporter (AktAR).13 AktAR is based on a PKB substrate sequence (PRPRSCTWPDPRPEF) and a FHA1 domain sandwiched between Cerulean and cpVenus-172. AktAR exhibits at least a 40% increase in emission ratio when PKB activity is stimulated in cells. Intrigued by the apparent challenge of improving the response of BKAR, we attempted to improve its dynamic range as a test case for our screening strategy.
LGI and the forkhead-associated domain-2 (FHA2) phosphoaminoacid-binding domain between mCFP and mYFP. This biosensor gave a 30% ratio change upon phosphorylation and showed phosphorylation specificity for PKB over both PKA and PKC.10 Later efforts by Gao et al. to improve the performance of BKAR were not fruitful, and so they developed a related biosensor called Akt activity reporter (AktAR).13 AktAR is based on a PKB substrate sequence (PRPRSCTWPDPRPEF) and a FHA1 domain sandwiched between Cerulean and cpVenus-172. AktAR exhibits at least a 40% increase in emission ratio when PKB activity is stimulated in cells. Intrigued by the apparent challenge of improving the response of BKAR, we attempted to improve its dynamic range as a test case for our screening strategy.
In order to apply our screening strategy to BKAR, we required both a constitutively active kinase with the ability to fold properly in E. coli, and a library of BKAR variants. Normally, PKB only becomes active following translocation to the plasma membrane and phosphorylation of Thr308 and Ser473.14 However, mutation of both PKB phosphorylation sites to aspartic acid has been shown to render PKB constitutively active.15 Accordingly, we cloned the gene for the double aspartic acid mutant of bovine PKB116 downstream of PBAD promoter of pUADE. Our library of BKAR variants was composed of 5 different cyan FPs, 22 different binding domain to substrate linkers, and 4 different yellow FPs (Table 1), giving a total diversity of 440 variants. The linker library was designed to include both unstructured (i.e., GGSGG repeats) sequences as well as sequences that were expected to be highly α-helical (i.e., EAAAK repeats).17 In addition, the original BKAR linker,10 the linkers used in our previous work,7 and the proteolytically stable “218” linker,18 were included. To maintain a reasonable library size, and to prevent library construction from becoming intractable, we did not explore linker diversity between the cyan FP and the binding domain or between the substrate and yellow FP. We have previously shown that optimization of these other linkers can lead to substantial improvements in biosensor performance.7 The gene library in pUADE was used to transform E. coli which was then plated on LB-agar with 0.04% ampicillin, 1 mM IPTG and 20 mM D-glucose.
| Diversity included in library | |
|---|---|
a Previously unreported. Spectral characterization revealed that both variants have absorbance λmax = 465 nm, emission λmax = 491 nm, extinction coefficient = 55![[thin space (1/6-em)]](https://www.rsc.org/images/entities/char_2009.gif) 000 M−1 cm−1, and quantum yield = 0.59. 000 M−1 cm−1, and quantum yield = 0.59.
|
|
| Donor FP | CFP, mTFP1,19 CyPet,20 cpmTFP193a, cpmTFP207a |
| Acceptor FP | YFP, YPet,20 cp173Venus,21 mCitrine22 |
| Binding domain to substrate linker | IR; INSR; INSRIR; INSRIRNR; INSRIRNRSR; INSRIRNRSRIR; INSRIRNRSRIR; (EAAAK)n (n = 1–10); (GGSGG)n (n = 1–10); GSTSGSGKPGSGEGSTKG (218 linker)18 |
The gene library was screened using a modified version of our previously reported procedure.7 In our previous work single colonies were picked and then respotted onto both D-glucose and L-arabinose agar plates in ordered arrays. In our current work we omitted the respotting step, and plates of colonies were simply imaged, sprayed with L-arabinose, and then imaged a second time. Pre-spray imaging was performed using a custom built imaging system that acquired fluorescence images of both donor emission (excitation 420–440 nm; emission 460–500 nm) and sensitized acceptor emission (excitation 420–440 nm; emission 520–550 nm). Plates were then sprayed with 1 M L-arabinose solution and left at room temperature for 2 hours to allow L-arabinose to diffuse through the growth medium and induce kinase expression in all colonies. Post-spray images were acquired as described above. Custom image processing macros were used to determine donor and acceptor intensities for each colony both pre- and post-spray. The data was exported to Microsoft Excel where the ratio of emission intensity of acceptor to emission intensity of donor (IAcceptor/IDonor) was calculated for each colony pre- and post-spray. The emission ratio change was calculated as ΔR/Rmin% and colonies showing the highest ratio changes (typically ΔR/Rmin > 15%) were isolated, propagated, and their plasmid DNA extracted and sequenced.
A total of 16 Petri dishes, each containing hundreds of colonies expressing BKAR variants, was screened in this manner. Sequencing of the four clones that exhibited the highest ratio changes revealed that all of them contained the mTFP1–YFP FRET pair, and they only differed in the composition of the middle linker. The clone that showed the highest FRET ratio change (ΔR/R% = 40.9%) carried the ‘218’ internal linker (Fig. 3A). The other 3 variants were found to carry the (GGSGG)2, (EAAAK)3 and IR middle linkers and exhibited ratio changes of 30.1%, 22.7% and 22.7%, respectively. Western blot using an anti-phosphothreonine antibody confirmed the biosensors were being phosphorylated when E. coli was treated with L-arabinose (Fig. 3B). Notably, the (GGSGG)2 middle linker is very similar to the linker in BKAR, and the properties of the biosensors are very similar as well. Specifically, the (GGSGG)2 biosensor and BKAR both exhibit an ∼30% decrease in emission ratio upon phosphorylation (Fig. 3D). In contrast, the variant with the ‘218’ middle linker exhibits a 41% increase in emission ratio (Fig. 3C). The variants with the (EAAAK)3 and IR middle linkers also increased in emission ratio upon phosphorylation. Such unpredictable changes in biosensor behavior with changes in linker composition emphasize the importance of high throughput screening approaches for biosensor optimization.
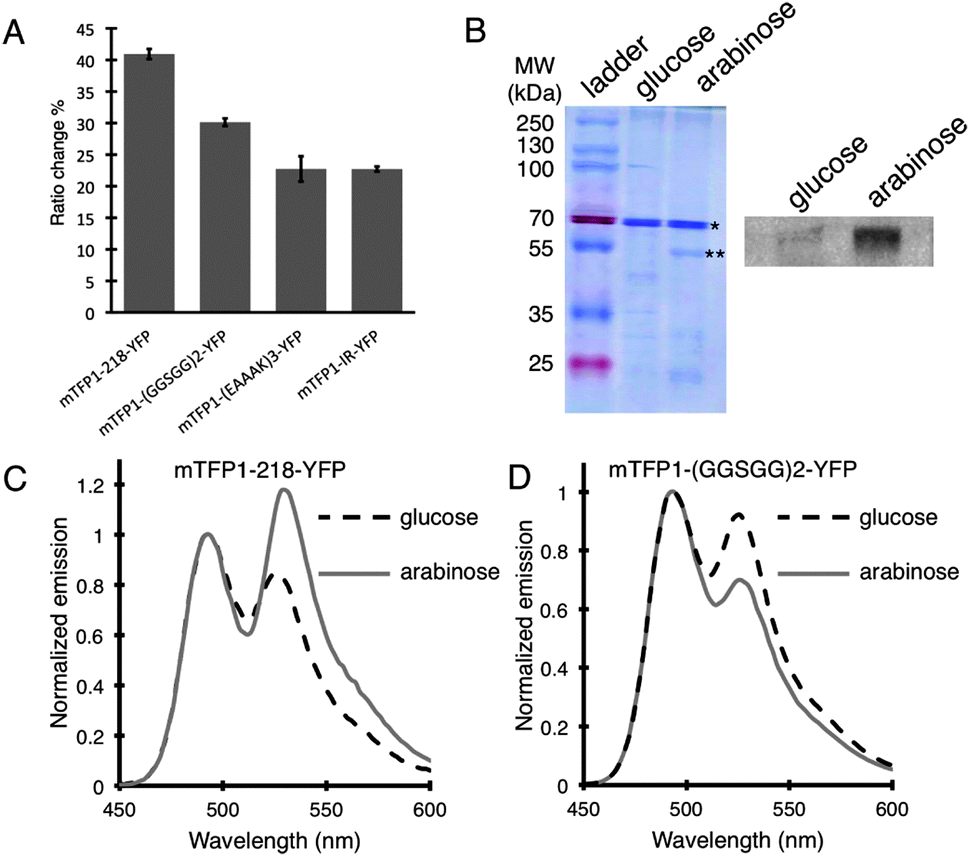 | ||
| Fig. 3 Results of screening for improved BKAR variants. (A) Candidates with the highest emission ratio changes were grown under both kinase inducing and repressing conditions, and ΔR/Rmin% was determined for the purified proteins. Error bars represent standard deviations of 4 independent experiments. (B) Coomassie blue stained SDS-PAGE gel (left side) of molecular weight (MW) ladder, of the ‘218’ variant expressed under enzyme repressing (glucose) and inducing (arabinose) conditions. The * indicates the biosensor and ** indicates the enzyme band. On the right side of the panel is an anti-phosphothreonine Western Blot for biosensor expressed under repressing and inducing conditions. (C) Emission spectra of the BKAR variant with the ‘218’ linker expressed under inducing (arabinose) and repressing (glucose) conditions. All spectra are taken at λexcitation = 430 nm and normalized with respect to maximum donor intensity. (D) The (GGSGG)2 variant represented as in (C). | ||
Having demonstrated that our screening strategy could be used for the optimization of an existing kinase biosensor, we applied it to the development of a new biosensor for CDK1 in complex with cyclin B1. The activity of the cyclin B1-CDK1 complex is well understood to determine the onset of mitosis.23 A FRET-based biosensor for cyclin B1-CDK1, composed of a substrate from human cyclin B1 (PEPILVDTS![[S with combining low line]](https://www.rsc.org/images/entities/char_0053_0332.gif) PPMET) fused to a polo-box phosphoamino acid binding domain and the mCerulean–YPet FRET pair, has previously been reported by Gavet and Pines.24,25 Despite having a relatively small emission ratio change of ∼10–15% upon cyclin B1-CDK1 activation, this biosensor has proven very useful for correlating activation of cyclin B1-CDK1 with nuclear import24 and nuclear envelope breakdown.25
PPMET) fused to a polo-box phosphoamino acid binding domain and the mCerulean–YPet FRET pair, has previously been reported by Gavet and Pines.24,25 Despite having a relatively small emission ratio change of ∼10–15% upon cyclin B1-CDK1 activation, this biosensor has proven very useful for correlating activation of cyclin B1-CDK1 with nuclear import24 and nuclear envelope breakdown.25
As expression of the previously reported biosensor gene in E. coli did not produce any soluble protein, we created a new biosensor in which the polo-box domain was replaced with the FHA2 domain. The substrate from the earlier cyclin B1-CDK1 biosensor was retained. To apply our colony based screening protocol, we also required a recombinant constitutively active kinase that could phosphorylate this substrate when expressed in E. coli. Accordingly, we cloned a polycistronic unit (CDC28–CAK1–CKS1–CLB5)26 that encodes for active Saccharomyces cerevisiae rCdc28–Clb5 (a cyclin B1-CDK1 homologue), downstream of the PBAD promoter in pUADE. In addition, a library of potential cyclin B1-CDK1 biosensors with the diversity indicated in Table 1 was inserted downstream of the Ptac promoter.
Application of the colony based screening procedure (16 Petri dishes, each with hundreds of colonies) led to the identification of seven colonies that showed large emission ratio changes. Each of these colonies was picked, propagated, and their respective biosensor variants were expressed under both enzyme inducing and repressing conditions. Fluorescence spectra of the purified proteins provided the percent ratio changes associated with phosphorylation (Fig. 4A). As with the BKAR-type biosensor, a Western blot confirmed biosensor phosphorylation under inducing conditions (Fig. 4B). DNA sequencing of the biosensor with the highest ratio change (67.0 ± 2.1%; Fig. 4C) revealed that it was composed of the mTFP1-YFP FRET pair with (GGSGG)2 as the middle linker between FHA2 and substrate sequence.
 | ||
| Fig. 4 Results from screening a library of cyclin B1-CDK1 biosensors. (A) Each top clone was grown individually under both kinase inducing and repressing conditions and ΔR/Rmin% was determined for the purified proteins of 4 independent experiments. (B) The purified (GGSGG)2 variant cultured either with or without arabinose migrated identically on SDS-PAGE gel. Anti-phosphoserine Western blot confirmed phosphorylation under kinase inducing conditions. (C) Emission spectra of the purified (GGSGG)2 variant cultured under kinase inducing (arabinose) and repressing (glucose) conditions. | ||
Encouraged by the improved ratio change of our cyclin B1-CDK1 biosensor, we expressed it in HeLa cells and imaged emission ratio changes in single cells as they progressed through mitosis (Fig. 5). These single cell imaging experiments revealed a pattern of activation very similar to the average activity for multiple cells as observed by Gavet and Pines.25 Although there was a substantial amount of cell-to-cell heterogeneity in terms of absolute ratio and the rates of activity change, several trends were consistently observed. As expected, cyclin B1-CDK1 kinase activity increased through prophase, plateaued through prometaphase and metaphase, sharply decreased at the onset of anaphase, and continued to decrease through telophase. These results indicate that the cyclin B1-CDK1 biosensor is being recognized as a substrate for endogenous cyclin B1-CDK1 in mammalian cells. Consistent with our in vitro results, emission ratio changes of up to 70% were observed for some cells.
 | ||
| Fig. 5 Cyclin B1-CDK1 kinase activity monitored during mitotic progression. (A) The emission ratios of acceptor (YFP)–donor (TFP) signals over time were recorded for 8 different HeLa S3 cells in different stages of mitosis. Data points are colored according to the mitotic phase, with black for prophase, grey for prometaphase, red for metaphase, green for anaphase, and blue for telophase. Traces have been offset along the arbitrary time axis for the sake of clarity. (B) Representative images of cell 4 as labeled in (A). Images correspond to the time points in (A) that are shown as open squares. Top row of images is pseudocolored by ratio and bottom row is differential interference contrast (DIC) images. (C) Representative images of cell 5 as labeled in (A) and represented as in (B). | ||
In conclusion, we have demonstrated the feasibility of optimizing FP FRET-based kinase biosensors in colonies of E. coli. Using this approach we were able to improve the emission ratio change of the PKB biosensor BKAR from ∼30% to ∼40%. More dramatically, we employed this approach to develop a new cyclin B1-CDK1 biosensor with a ratio change (67%) that is at least 4.5-fold that of a previously reported biosensor (∼10–15%).25 We anticipate that the improved response of the new biosensor will facilitate single cell imaging studies aimed at understanding the dynamics of cyclin B1-CDK1 activation during cell cycle progression. In particular, its improved performance should diminish the need for averaging fluorescence intensities from multiple cells in order to obtain reliable data, potentially providing a new window into cell-to-cell heterogeneity in cyclin B1-CDK1 activation.
Acknowledgements
We thank Jim Woodgett for the gene for constitutively active PKB (Addgene plasmid 14751), Alexandra Newton for pRSET B-BKAR (Addgene plasmid 14877), Olivier Gavet for the previously reported cyclin B1-CDK1 biosensor, David Stuart for pGEX6P-1/CDC28-CAK1-CKS1-CLB5, and Shelagh Campbell for helpful discussion. This work was funded by a grant to R.E.C. from the Natural Sciences and Engineering Research Council of Canada (NSERC). R.E.C. holds a Tier II Canada Research Chair in Bioanalytical Chemistry.References
- A. Miyawaki, J. Llopis, R. Heim, J. M. McCaffery, J. A. Adams, M. Ikura and R. Y. Tsien, Nature, 1997, 388, 882–887 CrossRef CAS PubMed.
- A. Ibraheem and R. E. Campbell, Curr. Opin. Chem. Biol., 2010, 14, 30–36 CrossRef CAS PubMed.
- S. A. Hires, Y. Zhu and R. Y. Tsien, Proc. Natl. Acad. Sci. U. S. A., 2008, 105, 4411–4416 CrossRef CAS PubMed.
- A. Piljić, I. de Diego, M. Wilmanns and C. Schultz, ACS Chem. Biol., 2011, 6, 685–691 CrossRef PubMed.
- N. Komatsu, K. Aoki, M. Yamada, H. Yukinaga, Y. Fujita, Y. Kamioka and M. Matsuda, Mol. Biol. Cell, 2011, 22, 4647–4656 CrossRef CAS PubMed.
- A. J. Lam, F. St-Pierre, Y. Gong, J. D. Marshall, P. J. Cranfill, M. A. Baird, M. R. McKeown, J. Wiedenmann, M. W. Davidson, M. J. Schnitzer, R. Y. Tsien and M. Z. Lin, Nat. Methods, 2012, 9, 1005–1012 CrossRef CAS PubMed.
- A. Ibraheem, H. Yap, Y. Ding and R. E. Campbell, BMC Biotechnol., 2011, 11, 105 CrossRef CAS PubMed.
- R. E. Campbell, Anal. Chem., 2009, 81, 5972–5979 CrossRef CAS PubMed.
- C. W. Lin, C. Y. Jao and A. Y. Ting, J. Am. Chem. Soc., 2004, 126, 5982–5983 CrossRef CAS PubMed.
- M. T. Kunkel, Q. Ni, R. Y. Tsien, J. Zhang and A. C. Newton, J. Biol. Chem., 2005, 280, 5581–5587 CrossRef CAS PubMed.
- L. M. Guzman, D. Belin, M. J. Carson and J. Beckwith, J. Bacteriol., 1995, 177, 4121–4130 CAS.
- M. Schifferer and O. Griesbeck, J. Am. Chem. Soc., 2012, 134, 15185–15188 CrossRef CAS PubMed.
- X. Gao and J. Zhang, Mol. Biol. Cell, 2008, 19, 4366–4373 CrossRef CAS PubMed.
- A. Toker and A. C. Newton, J. Biol. Chem., 2000, 275, 8271–8274 CrossRef CAS PubMed.
- D. R. Alessi, M. Andjelkovic, B. Caudwell, P. Cron, N. Morrice, P. Cohen and B. A. Hemmings, EMBO J., 1996, 15, 6541–6551 CAS.
- M. P. Scheid, P. A. Marignani and J. R. Woodgett, Mol. Cell. Biol., 2002, 22, 6247–6260 CrossRef CAS.
- S. Marqusee, V. H. Robbins and R. L. Baldwin, Proc. Natl. Acad. Sci. U. S. A., 1989, 86, 5286–5290 CrossRef CAS.
- M. Whitlow, B. A. Bell, S. L. Feng, D. Filpula, K. D. Hardman, S. L. Hubert, M. L. Rollence, J. F. Wood, M. E. Schott and D. E. Milenic, Protein Eng., 1993, 6, 989–995 CrossRef CAS PubMed.
- H. Ai, J. N. Henderson, S. J. Remington and R. E. Campbell, Biochem. J., 2006, 400, 531–540 CrossRef CAS PubMed.
- A. W. Nguyen and P. S. Daugherty, Nat. Biotechnol., 2005, 23, 355–360 CrossRef CAS PubMed.
- T. Nagai, S. Yamada, T. Tominaga, M. Ichikawa and A. Miyawaki, Proc. Natl. Acad. Sci. U. S. A., 2004, 101, 10554–10559 CrossRef CAS PubMed.
- O. Griesbeck, G. S. Baird, R. E. Campbell, D. A. Zacharias and R. Y. Tsien, J. Biol. Chem., 2001, 276, 29188–29194 CrossRef CAS PubMed.
- D. Fisher, L. Krasinska, D. Coudreuse and B. Novák, J. Cell Sci., 2012, 125, 4703–4711 CrossRef CAS PubMed.
- O. Gavet and J. Pines, J. Cell Biol., 2010, 189, 247–259 CrossRef CAS PubMed.
- O. Gavet and J. Pines, Dev. Cell, 2010, 18, 533–543 CrossRef CAS PubMed.
- Y. S. Tak, Y. Tanaka, S. Endo, Y. Kamimura and H. Araki, EMBO J., 2006, 25, 1987–1996 CrossRef CAS PubMed.
Footnote |
| † Electronic supplementary information (ESI) available: Experimental methods. See DOI: 10.1039/c3mb70402e |
| This journal is © The Royal Society of Chemistry 2014 |