 Open Access Article
 This Open Access Article is licensed under a
 Creative Commons Attribution 3.0 Unported Licence
Concentration gradient focusing and separation in a silica nanofluidic channel with a non-uniform electroosmotic flow†
Wei-Lun
Hsu
*a,
Dalton J. E.
Harvie
a,
Malcolm R.
Davidson
a,
Helen
Jeong
b,
Ewa M.
Goldys
c and
David W.
Inglis
bc
aDepartment of Chemical and Biomolecular Engineering, University of Melbourne, VIC 3010, Australia. E-mail: w.hsu@student.unimelb.edu.au; Fax: +61 3 8344 4153; Tel: +61 3 8344 0591
bDepartment of Engineering, Macquarie University, NSW 2109, Australia
cMQ BioFocus Research Centre, Macquarie University, NSW 2109, Australia
First published on 4th July 2014
Abstract
The simultaneous concentration gradient focusing and separation of proteins in a silica nanofluidic channel of various geometries is investigated experimentally and theoretically. Previous modelling of a similar device [Inglis et al., Angew. Chem. Int. Ed., 2011, 50, 7546] assumed a uniform velocity profile along the length of the nanochannel. Using detailed numerical analysis incorporating charge regulation and viscoelectric effects, we show that in reality the varying axial electric field and varying electric double layer thickness caused by the concentration gradient, induce a highly non-uniform velocity profile, fundamentally altering the protein trapping mechanism: the direction of the local electroosmotic flow reverses and two local vortices are formed near the centreline of the nanochannel at the low salt concentration end, enhancing trapping efficiency. Simulation results for yellow/red fluorescent protein R-PE concentration enhancement, peak focusing position and peak focusing width are in good agreement with experimental measurements, validating the model. The predicted separation of yellow/red (R-PE) from green (Dyl-Strep) fluorescent proteins mimics that from a previous experiment [Inglis et al., Angew. Chem. Int. Ed., 2011, 50, 7546] conducted in a slightly different geometry. The results will inform the design of new class of matrix-free particle focusing and separation devices.
1 Introduction
Over the last decade, micro/nanofluidics has been widely applied to biosensor technology due to the potential benefits of lower cost, reduction of reagent consumption and shorter operating times. More effective but cheaper analyte focusing and separation methods are relevant to the next generation point-of-care diagnostics. A variety of techniques have been developed to simultaneously achieve a fast focusing speed and high separation efficiency. Isoelectric focusing (IEF)1 concentrates and separates molecules based on the various isoelectric points (pIs) of amphoteric analytes (e.g., proteins, peptides). At the position where the local pH corresponds to the isoelectric point of the molecule, targeted molecules are stationary due to the zero imposed electric force. Isotachophoresis (ITP)2,3 uses discontinuous electric fields generated from various ionic mobilities in the solution to improve the performance of molecule concentration and separation. Electrochromatography4 is a method combining electrophoresis and liquid chromatography. The charged molecules are driven by the applied electric field and different molecules are concentrated and separated by introducing a physical packing column. Concentration and separation efficiencies of electrochromatography are higher than that of conventional pressure-driven high performance liquid chromatography (HPLC) because of the electroosmotic flow. O'Farrell5 introduced a pressure-driven counter-flow to further increase the focusing speed of electrochromatography, in a process known as counteracting chromatographic electrophoresis (CACE). This technique has been applied to uranium isotope and protein analyses.6,7 Although CACE can concentrate molecules quickly, a multilayered column is required to achieve high separation resolution, increasing device cost.An alternative technique known as electric field gradient focusing (EFGF) is attracting attention due to its simple mechanism.8–12 Because the electric and hydrodynamic drag force on the molecules are determined by the charge and size of the molecules, respectively, molecules with the same charge to size ratio are focused at the same location: different charge to size ratio molecules are separated. Keogler and Ivory8 used a varying cross-section area channel to establish electric field gradients along a channel to achieve molecule separation. This first generation of EFGF device had a limited concentration enhancement (focusing concentration/input concentration) and a low separation resolution of the analytes. Humble et al.9 modified the method by integrating an ionically conductive polymer slab within the device. The concentration enhancement was increased to 10![[thin space (1/6-em)]](https://www.rsc.org/images/entities/char_2009.gif) 000-fold with separation demonstrated for protein mixtures. Similarly, Ross and Locascio13 explored a method to create an electric-field gradient by imposing a temperature gradient upon a temperature dependent ionic strength buffer, however the temperature gradient also caused a non-uniform solution viscosity and density, adding complexity when predicting device behaviour. An approach explored by Greenlee and Ivory14 is to employ a conductivity/concentration gradient along the length of the channel. Because the current through a channel is uniform and approximately proportional to the product of the conductivity and the electric field, a varying electric field is simultaneously formed. Conductivity/Concentration Gradient Focusing (CGF)14–17 has a high focusing rate and good separation efficiency. A disadvantage of Greenlee and Ivory's method is that it uses a membrane to create the conductivity/concentration gradient which raises the fabrication complexity and cost.
000-fold with separation demonstrated for protein mixtures. Similarly, Ross and Locascio13 explored a method to create an electric-field gradient by imposing a temperature gradient upon a temperature dependent ionic strength buffer, however the temperature gradient also caused a non-uniform solution viscosity and density, adding complexity when predicting device behaviour. An approach explored by Greenlee and Ivory14 is to employ a conductivity/concentration gradient along the length of the channel. Because the current through a channel is uniform and approximately proportional to the product of the conductivity and the electric field, a varying electric field is simultaneously formed. Conductivity/Concentration Gradient Focusing (CGF)14–17 has a high focusing rate and good separation efficiency. A disadvantage of Greenlee and Ivory's method is that it uses a membrane to create the conductivity/concentration gradient which raises the fabrication complexity and cost.
Instead of using a membrane, Inglis et al.17 directly imposed a stationary concentration gradient along a nanochannel by placing it between two microchannels, within which were circulated solutions having different salt concentrations. Good focusing speed and separation ability were demonstrated. However, the uniform axial electroosmotic velocity assumption used in their theoretical model is incorrect as the imposed concentration gradient causes the axial electric field and electric double layer thickness to vary (amongst other things), resulting in a varying velocity profile along the channel. As a consequence, their model does not capture the flow behaviour correctly. Hence, to understand the mechanism of CGF in silica nanochannels, a more comprehensive theoretical analysis is required. Note that a similar phenomenon (varying electroosmotic velocity) has been observed in an electrolyte solution with a pH gradient in a silica capillary by Minerick et al.,18 who investigated the migration of a suspension of red blood cells in response to a non-uniform electroosmotic flow.
In this study, we investigate the simultaneous conductivity gradient focusing of proteins in four silica nanofluidic channel geometries experimentally and theoretically. We demonstrate trapping of yellow/red fluorescent proteins R-phycoerythrin (R-PE) experimentally. Simulations use silica nanochannels filled with non-uniform NaCl electrolyte concentration solutions, with a site-dissociation model on the silica surface that captures the deprotonization of the silanol groups (charge regulation). The viscoelectric effect,19 being the increase of viscosity in response to a local electric field attributed to the polarization of water molecular, and the decrease of the diffusivities of ions and protein due to the increase of viscosity, is considered for the first time in a two-dimensional (2D) nanofluidic simulation. Transient Nernst–Planck transport equations are employed to track protein concentrations throughout the nanochannels.
2. Experimental section
Devices were fabricated using standard semiconductor techniques described elsewhere.17 10 μm-deep microchannels were etched by potassium hydroxide into p-type 5–10 Ohm cm wafers. Nanochannels were plasma etched in 110 nm thermal oxide to a depth of 75 nm and a length of 100 μm. Pyrex™ wafers were bonded to these oxidized silicon wafers using the reverse RCA procedure; piranha clean followed by RCA2 then RCA1 on both wafers. Between each step the wafers were rinsed thoroughly in running de-ionized water. The sealed wafers were bonded by annealing at 425 °C for 12 hours in air. As schematically shown in Fig. 1, the chip had two microchannels connected with eight parallel nanochannels. The nanochannels were composed of two rectangular and six non-rectangular nanochannels. Microchannels on the left and right carried 7 mM and 241 mM NaCl solutions, respectively. The pH of the solutions in the microchannels was set to 8 by adding phosphate buffered saline (Gibco 10× concentrate). Large (240 kDa) yellow/red fluorescent proteins R-PE (AnaSpec Inc.) were added to the high salt microchannel to make a 6 μg ml−1 solution. Both microchannels were circulated with fresh solution continuously with the solutions coming in from the upper ports and exiting from the lower ports – hence the concentrations of NaCl and protein were fixed in the microchannels regardless of diffusion effects. Devices were re-used after flowing a detergent solution followed by 10% bleach, and a thorough rinse with water. A reference electric potential of 0 V was used at the left microchannel ports – the electric potential across the nanochannels was altered by varying the electric potential at the right microchannel ports (0.25–1.5 V).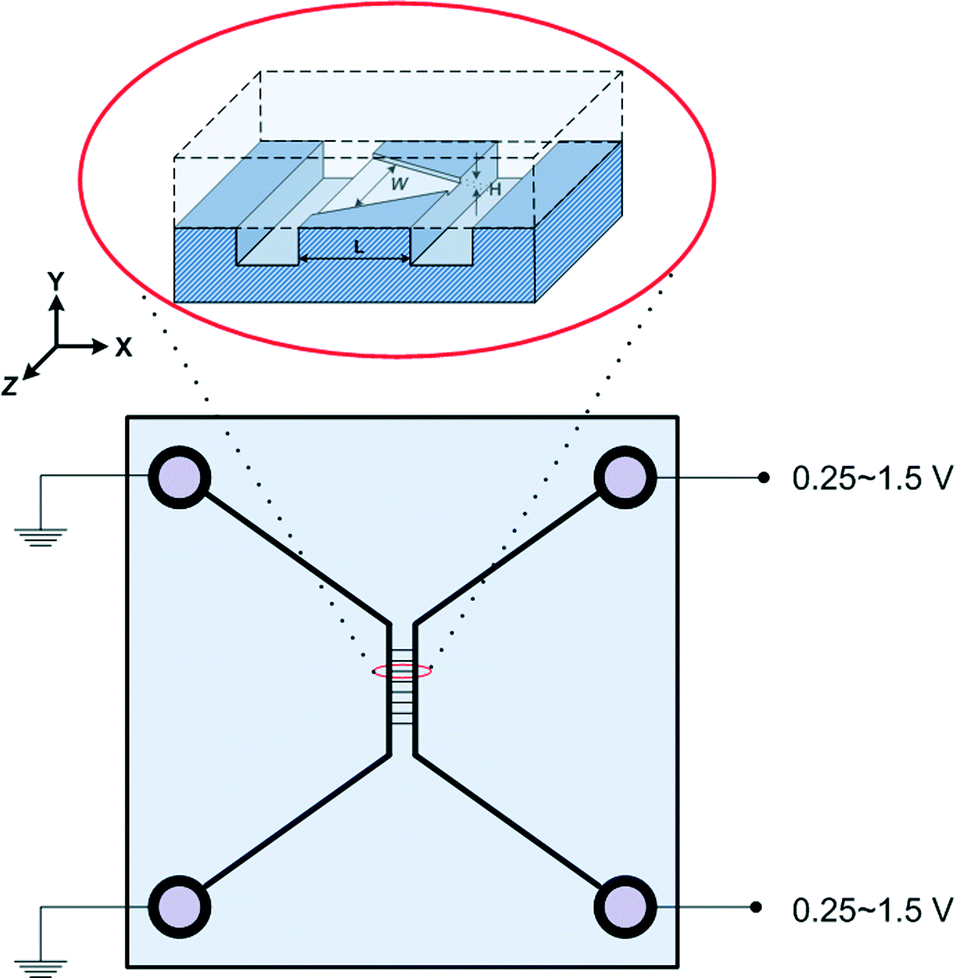 | ||
| Fig. 1 A schematic diagram of the nanofluidic device. The nanochannel depth H = 75 nm, length L = 100 μm and width W = 20 μm for rectangular channels, 15, 25 and 45 μm at the left end of the microchannel and nanochannel junction and 5 μm at the right end of the microchannel and nanochannel junction for non-rectangular channels, respectively. | ||
3. Theory
The behaviour of proteins in the nanofluidic channel under an applied voltage and conductivity gradient is investigated via numerical analysis. We consider that the device is filled with an incompressible Newtonian NaCl electrolyte solution and proteins are supplied from the high concentration microchannel ports. We assume that:(i) Steric effects for the ions and protein particles are neglected, i.e. both ions and protein particles are regarded as point charges.
(ii) The space charge density contributed from the proteins is low compared to that from the salt (NaCl) and therefore its impact on the electroosmotic velocity is neglected. This assumption is valid when the product of charge and concentration of the protein is much less than the NaCl concentration. In the experiment, the bulk protein concentration times its charge is less than 0.2% of the bulk NaCl concentration.
(iii) Electroosmosis reaches steady state instantly while the protein focusing is dependent on time. This allows us to simulate electroosmosis as steady state and only apply transient simulations to track the protein concentration. The validity of the assumption is supported by observations that the ion gradients in a similar system are established within a few seconds20 while analyte concentrations change much more slowly.17
(iv) The local double layer thickness is much smaller than the width of the nanochannel but is of a comparable magnitude to the depth of the nanochannel. For this system both the double layer thickness and half channel depth are of a nanometer scale; for instance, the Debye length, 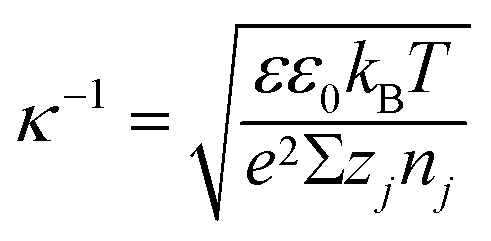 , is between 0.61 and 3.6 nm on the nanochannel surface, where ε, ε0, e, kB, T, zj and nj are the dielectric constant, permittivity of vacuum, elementary charge, Boltzmann constant, absolute temperature, valence of ionic species j and concentration (number density) of ionic species j (= Na+ and Cl−), respectively. On the other hand, the channel widths are of a micrometer scale (ranging from 5 to 45 μm), roughly three orders of magnitude greater than the Debye length, supporting this assumption.
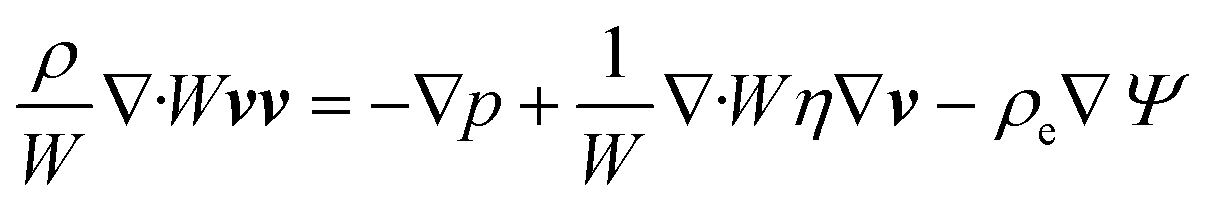
Using these assumptions the problem can be solved by employing the steady state form of the continuity equation, the modified Navier–Stokes equations (including an electrostatic term), the electric Poisson equation, the modified Nernst–Planck equations (including a conduction term) for ionic species and the transient form of the modified Nernst–Planck equation (including a conduction term) for proteins, as follows:20
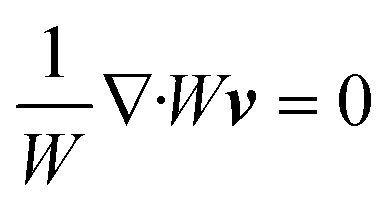 | (1) |
 | (2) |
 | (3) |
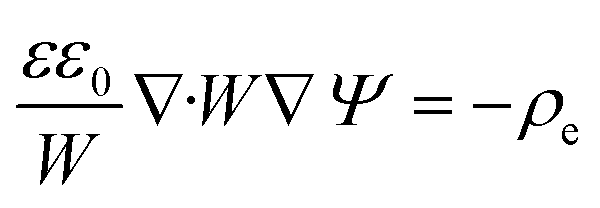
 | (4) |
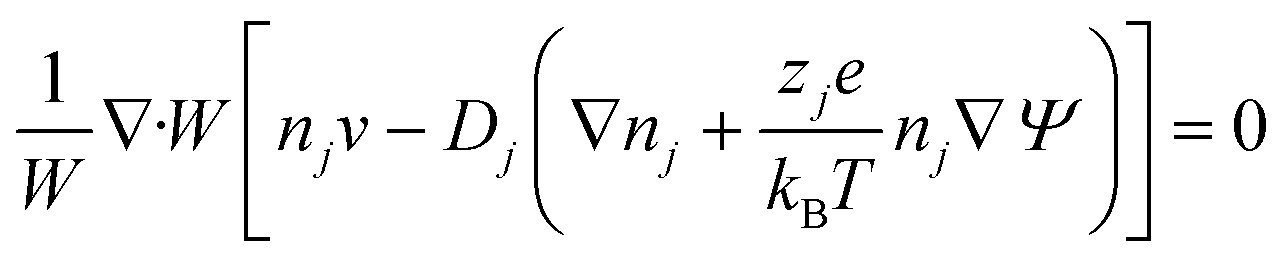
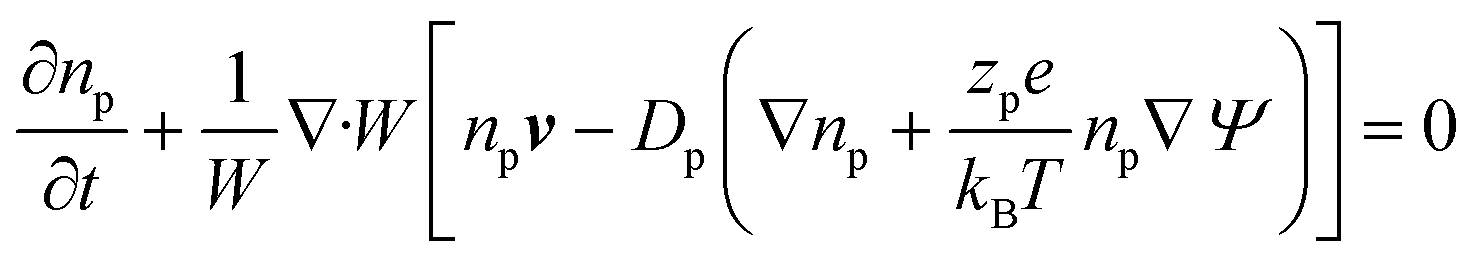 | (5) |
In these expressions, ψ, ρ, ρe, v, η, p, t and W are the electric potential, density of the liquid phase, space charge density, velocity, viscosity of the liquid phase, pressure, time and (varying) nanochannel width, respectively; Dj is the diffusivity of ionic species j, where j = Na+ and Cl−. Dp, Zp and n are the diffusivity, the effective charge and concentration (number density) of protein, respectively. Since the bulk pH is 8, the concentrations of H+ and OH− are much smaller than that of Na+ and Cl−. Hence, the charge contributed from H+ and OH− to ρe is negligible and ρe = e(nNa+ − nCl−).
The viscosity of the solvent is dependent on the magnitude of the local electric field. According to the Reynolds' equation for the viscosity of a liquid,21
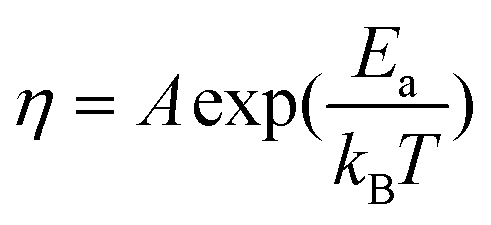 | (6) |
| η = η0(1 + f|E|2) | (7) |
According to the Stokes–Einstein equation, the diffusivities of ions are inversely proportional to the local viscosity. Also, a quasi-spherical conformation model25 is adopted for the proteins so that their diffusivity can be derived from the Stokes–Einstein equation based on their radius. These yield
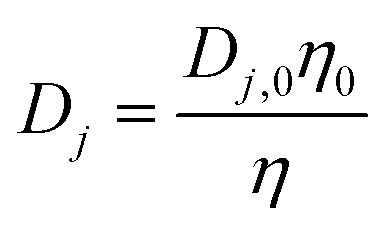 | (8) |
 | (9) |
The simulations for the present nanofluidic system are computationally challenging. The high aspect ratio (L/H) geometry of nanochannels and sharp variation of electric potential within the electric double layer require a huge computational domain with numerous tiny cells to capture the entire system. Limited by the finite computer random access memory (128 GB), we are not able to simulate the entire nanofluidic system (eight nanochannels and two microchannels) in one simulation. Instead, we simulate each nanochannel separately and employ a microfluidic circuit analysis to estimate the electric potential drops within the microchannels. Note that a similar circuit analysis was used to model concentration gradient formation in a thick double-layer nanochannel system.20
The computational domain (within the dashed lined area) is illustrated in Fig. 2a: the entire nanochannel is simulated plus the extension areas (reservoirs) at the ends of the nanochannel that reach into the bulk solutions within the microchannels. We divide the entire boundary into five sub-boundaries with each having unique boundary conditions.
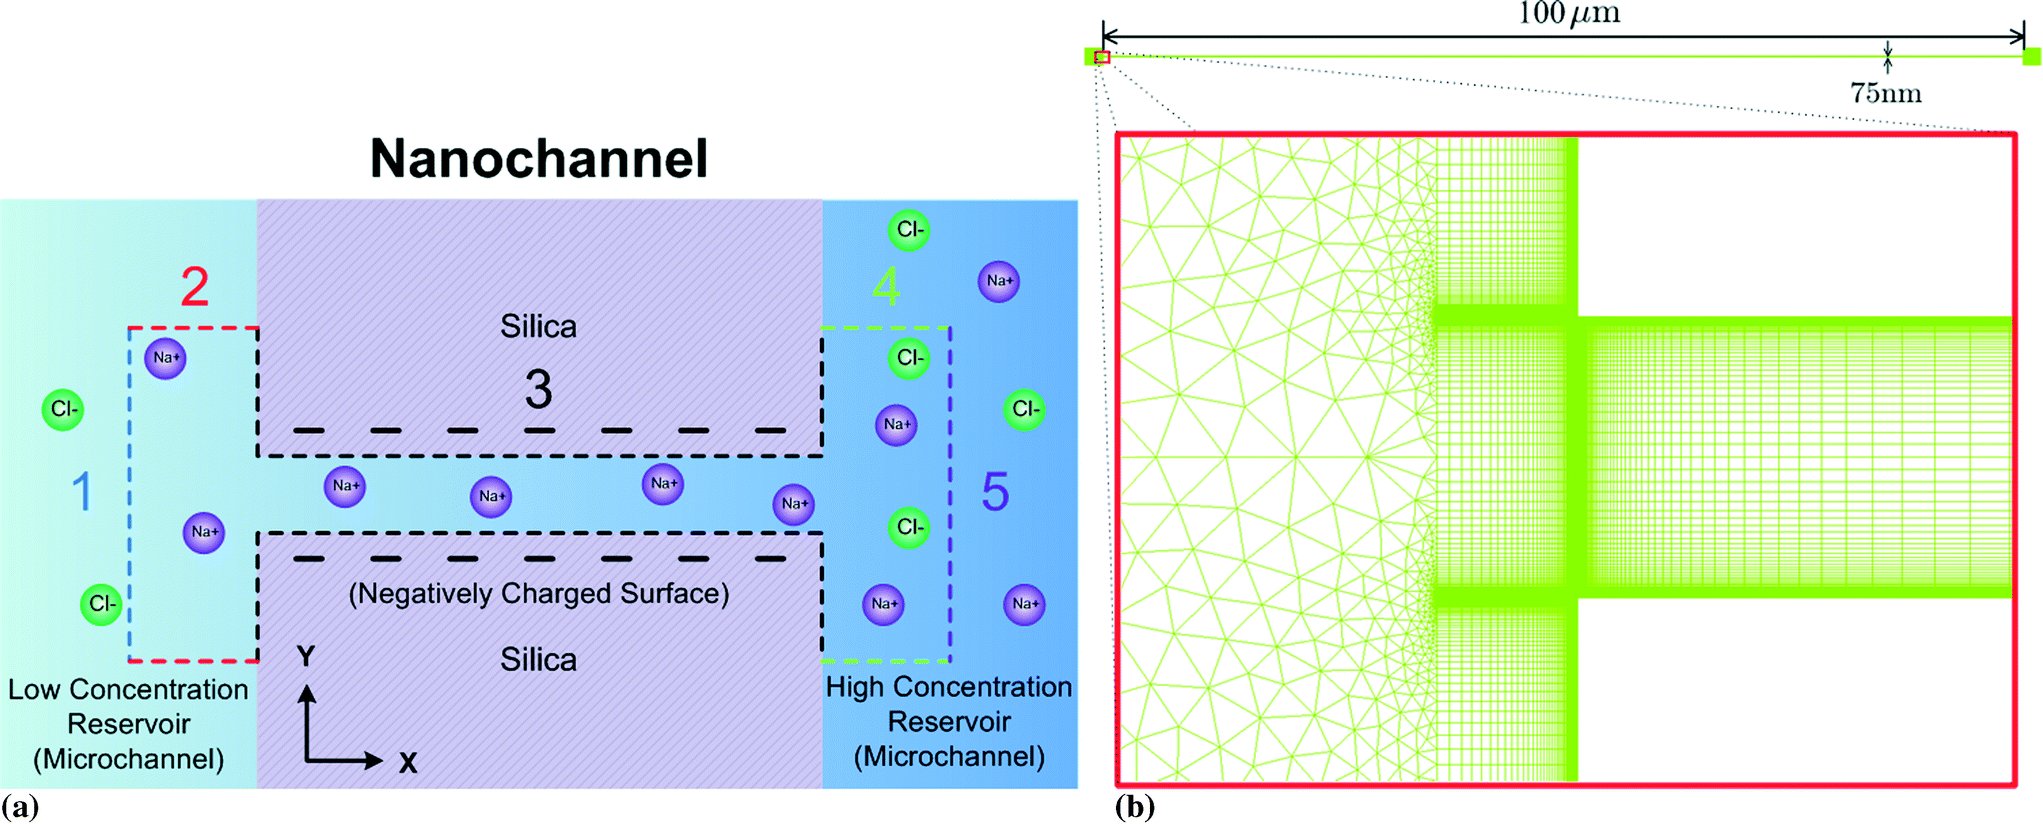 | ||
| Fig. 2 (a) A schematic diagram of the nanochannel. The nanochannel is connected to two large reservoirs at both ends which stand for the left and right microchannels. 1, 2, 3, 4 and 5 boundaries denote to the left port, left microchannel boundaries, nanochannel surfaces, right microchannel boundaries and right port, respectively. (b) The hybrid mesh used in the simulations. | ||
On the left port (BC1, blue dashed line in Fig. 2a), we assume that this boundary is far enough away from the left microchannel and nanochannel junction that:
(i) The flow is fully developed.
(ii) The potential is uniform.
(iii) The space charge density ρe is zero and ion concentrations are equal to the salt concentration in the left microchannel.
(iv) The concentration of protein is zero.
From sensitivity tests, 10 times the nanochannel depth away from the junction is sufficient to satisfy this independence: we conservatively position the boundary 25 times the nanochannel depth away from the junction.
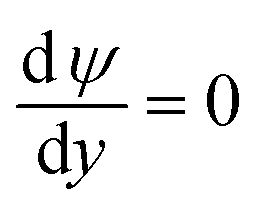
On the microchannel boundaries (BC2 and BC4, red dashed lines and green dashed lines in Fig. 2a), these boundaries are far enough away from the left microchannel and nanochannel junction in the y-direction that the variables on the boundaries are independent of the distance between the boundaries and the junction. In the simulations, we set these boundaries to be 12.5 times the nanochannel depth away from the junction and assume:
(i) The boundaries are free-slip.
(ii) The potential is uniform in the y-direction.
(iii) The concentrations of ions are uniform in the y-direction.
(iv) The concentration of protein is zero in the left reservoir and uniform in y-direction in the right reservoir.
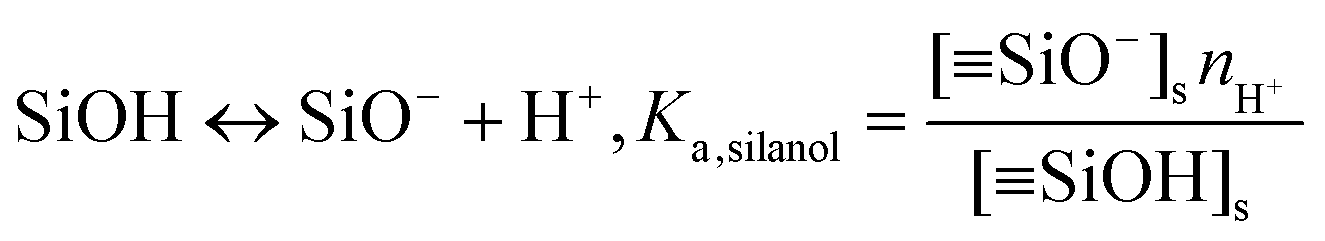
On the nanochannel surfaces (black dashed lines in Fig. 2a), the surface charge density of silica is governed by the local pH due to the surface silanol functional groups.26,27 We assume the following:
(i) The nanochannel surface is ion-impermeable.
(ii) The silica nanochannel surface is nonslip at these length scales (hydrophilic surface).
(iii) The charge conditions on the nanochannel surface depend upon the number density Γ (5 nm−2) and the equilibrium constant Ka,silanol of the surface silanol groups.26,27 The dissociation of the silanol groups can be expressed as
 | (10) |
![[triple bond, length as m-dash]](https://www.rsc.org/images/entities/char_e002.gif) SiO−]s, [SiOH]s and nH+ are the concentration of the silanol groups on the nanochannel surface, silicic acid groups on the nanochannel surface and the concentration of H+, respectively. Note that there is a wide range of Ka,silanol used in the literature. The silica surface has multiple kinds of silanol groups (i.e., isolated, vicinal and germinal groups) and each kind of group has its specific Ka,silanol.27–30 The surface charge is mainly contributed by the isolated silanol group (pKa,silanol ≅ 5.5) at low pH (acid solutions) while the vicinal silanol group is dominant in base solutions, i.e., at high pH (pKa,silanol ≅ 9).31 As the bulk pH = 8 in the present system, the vicinal silanol group are dominant and hence Ka,silanol = 10−9 M is adopted in the simulations.
SiO−]s, [SiOH]s and nH+ are the concentration of the silanol groups on the nanochannel surface, silicic acid groups on the nanochannel surface and the concentration of H+, respectively. Note that there is a wide range of Ka,silanol used in the literature. The silica surface has multiple kinds of silanol groups (i.e., isolated, vicinal and germinal groups) and each kind of group has its specific Ka,silanol.27–30 The surface charge is mainly contributed by the isolated silanol group (pKa,silanol ≅ 5.5) at low pH (acid solutions) while the vicinal silanol group is dominant in base solutions, i.e., at high pH (pKa,silanol ≅ 9).31 As the bulk pH = 8 in the present system, the vicinal silanol group are dominant and hence Ka,silanol = 10−9 M is adopted in the simulations.
(iv) As we do not track protons directly in the simulations, we need an approximation for their concentrations at the silica surface to use in eqn (10). The advection flux of protons towards the silica is small as the Peclet number for this species is low (protons have a high diffusivity), and the Reynolds number is also small, resulting in laminar flows in the nanochannels (the local velocity normal to the surface is small). This allows the Nernst–Planck equation for protons in the y-direction to be written as
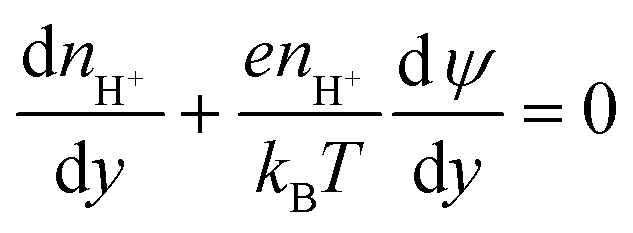 | (11) |
The electric double layer thickness is smaller than the half nanochannel depth implying that electric double layer overlap is small for this species and thus the pH on the centreline is approximately equal to that in the bulk (i.e., 8). Applying this condition to eqn (11), we derive
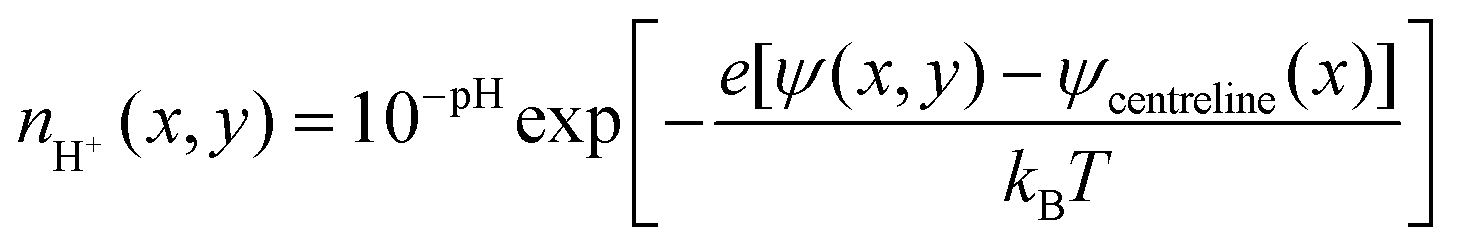 | (12) |
As for the left port, we set the distance between the boundary and the junction to be 25 times of the nanochannel depth for the right port (purple dashed line in Fig. 2a). We assume:
(i) The flow is fully developed.
(ii) The potential is uniform.
(iii) The space charge density ρe is zero and concentrations of ions are equal to the NaCl concentration in the right microchannel nright.
(iv) The protein concentration is equal to the input protein concentration np,input.
Table 1 summarises all of the boundary conditions used in the simulations. Here δx, δy, n, 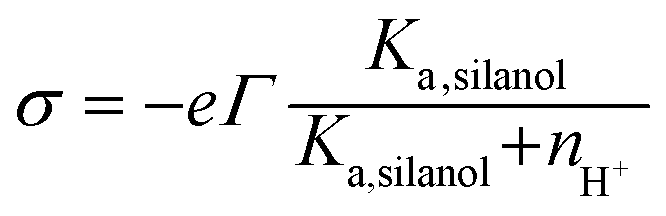 , Jj = njv − Dj
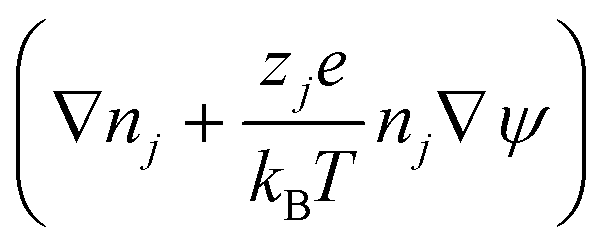 , Jp = npv − Dp
 , Δu, nleft, nright and np,input are the unit vector in the x-direction, unit vector in the y-direction, unit vector normal to the wall, surface charge density, ion flux of ionic species j, where j = Na+ and Cl−, protein flux, potential difference between the left and right ends of the nanochannel, NaCl concentration in the left microchannel (= 7 mM), NaCl concentration in the right microchannel (= 241 mM) and input protein concentration in the right microchannel, respectively.
| BC1 | BC2 | BC3 | BC4 | BC5 |
|---|---|---|---|---|
| δ x δ x : ∇v = 0 | δ x δ y : ∇v = 0 | v = 0 | δ x δ y : ∇v = 0 | δ x δ x : ∇v = 0 |
| ψ = 0 |
|
|

|
ψ = Δu |
| n j = nleft |
|
J j = 0 |
|
n j = nright |
| n p = 0 | n p = 0 | J p = 0 |
|
n p = np,input |
Electric potential drops along the microchannels make the potential difference across the nanochannels and potential difference between the microchannel ports unequal. The relationship between the potential difference across the nanochannels Δu and between the left ports and right ports of the microchannels ΔU in the present geometry can be derived from the conductance, current and flow rate in each micro and nanochannels using a circuit analysis,20viz
Δu = ΔU + Q![[script L]](https://www.rsc.org/images/entities/i_char_e144.gif) Q − II Q − II | (13) |
Q and I are the overall flow rate, overall current, overall flow rate conductance and overall current conductance in the microchannels, respectively. In the present case, Q = 9.06 × 10⁷ Vs m−3 and I = 2.11 × 10⁷ V A−1.32 The relationship between the nanochannel potential difference Δu and microchannel potential difference ΔU cannot be derived from a single simulation (one nanochannel geometry) because the total flow rate Q and current I through the eight nanochannels are needed. As the nanochannels each have a different geometry (i.e., straight and tapered), the total Q/I is not simply equal to the flow rate/current in one nanochannel times the number of nanochannels. So, here we introduce an effective number of rectangular nanochannels M whereby the total Q/I equals to the product of M and the flow rate q/current i in a rectangular nanochannel. That is| Q = Mqq | (14) |
| I = Mii. | (15) |
:1) that give the total flow rate and current through the eight varying channels, respectively. Mq and Mi can be derived from the flow rate and current through each shape of nanochannel at the same Δu as listed in Table 2 (geometry 1:1, 1:3, 1:5 and 1:9 denote the rectangular nanochannel, tapered nanochannels with 15, 25 and 45 μm channel width at the low concentration end/the left end, respectively). Δu values (i.e., 0.25, 0.5 and 1 V) selected to calculate the M values are not the actual values corresponding to the applied voltage ΔU in the experiment; however the values chosen are of a similar magnitude in the experiment. Mq and Mi (≅ 6) are largely independent of Δu in the selected range. For convenience, we fix Mq = Mi= 6 in the following simulations.
| Geometry | Δu [V] | Flow rate ×1019 [m3 s−1] | Current ×109 [A] | M q | M i |
|---|---|---|---|---|---|
| 1:1 |
0.25 | 7.27 | 4.91 | 5.97 | 5.97 |
| 1:3 |
0.25 | 3.32 | 2.24 | — | — |
| 1:5 |
0.25 | 4.52 | 3.05 | — | — |
| 1:9 |
0.25 | 6.59 | 4.46 | — | — |
| 1:1 |
0.5 | 13.1 | 12.5 | 5.97 | 5.98 |
| 1:3 |
0.5 | 5.98 | 5.71 | — | — |
| 1:5 |
0.5 | 8.14 | 7.79 | — | — |
| 1:9 |
0.5 | 11.9 | 11.4 | — | — |
| 1:1 |
1 | 23.7 | 30.7 | 5.98 | 5.97 |
| 1:3 |
1 | 10.8 | 14.0 | — | — |
| 1:5 |
1 | 14.8 | 19.1 | — | — |
| 1:9 |
1 | 21.5 | 17.9 | — | — |
We assume that there are no proteins in the system initially, i.e., np = 0 at t = 0 s. A local concentration enhancement factor CE is defined to quantify the protein focusing performance, where
 | (16) |
The present problem (eqn (1)–(5)) is solved using an implicit finite volume method33 with a hybrid mesh comprising rectangular and triangular cells as shown in Fig. 2b. To reduce the total number of cells, we use rectangular cells in the nanochannels with a cell size decreasing gradually towards the nanochannel surface. The smallest cell length is 10−4 times of the nanochannel depth (75 nm), on the nanochannel surface, to resolve the electric double layers. An unstructured mesh with large triangular cells is adopted in the extension areas (reservoirs) because variables do not vary as rapidly there. Typically, mesh independence is achieved using a total number of 850000 cells. Sensitivity testing showed that the difference between the CEs using computational time steps of Δt = 1 and 2 s at t = 60 s was smaller than 0.3%. Therefore, Δt = 1 s was used in the simulations.
4. Results and discussion
When the electric potential is applied to the nanofluidic device, the electric field (which is directed towards the low salt concentration ends) drives the counterions (Na+) along with the solution towards the cathode (the low salt concentration) end of the nanochannels. This electroosmotic flow carries the proteins from the high salt concentration microchannel into the nanochannels. Concurrently, the electric force on the negatively charged proteins pulls them towards the anode (the high salt concentration end) opposing the electroosmosis. Because the current of each ion species depends on the electric field, ion concentration and concentration gradients (as described by eqn (4)), ion conservation along the channel length constrains the field to be related to the salt concentration – in the present case where the conduction of ions is significant, the electric field magnitude increases as the salt concentration decreases (keeping the product of the two approximately constant).Therefore, after entering into the nanochannels, the electroosmotic force acting on the proteins increases while they migrate towards the low salt concentration end. In tapered nanochannels, the gradually widening geometry (from the high to low salt concentration ends) opposes this increase because the current is proportional to the salt concentration decrease as well as the nanochannel cross section area. However, in the present system, the effect of the concentration decrease (241 mM to 7 mM, >34 times) is more significant than the nanochannel cross section area increase (5 μm to 45 μm, 9 times) meaning that the electric field keeps increasing along the nanochannel to the low salt concentration end, even in the 1:9 tapered case.
The electric force Fe and the hydrodynamic drag force Fd on the proteins can be calculated by the following two equations based on a quasi-spherical conformation model for proteins:
| Fe = zpeE | (17) |
| Fd = 6πηRpv | (18) |
The experimental results of R-PE protein trapping and the modeling results of the CE in the nanochannels at t = 60 s and ΔU = 1 V are shown in Fig. 3. The simulated concentration enhancement CE, peak position and peak width in various nanochannel geometries (Fig. 3d–f) are in reasonable quantitative agreement with the experimental measurements, revealing that the trapping behaviour is affected by the shape of the nanochannels. The rectangular (1:1) nanochannels have the largest CE due to the largest inlet cross section area (75 nm × 20 μm) which is four times larger than other nanochannels. For the same inlet cross section area (at the high salt concentration end), the tapered nanochannel having the widest outlet cross section area (at the low salt concentration end) results in the lowest CE. The peak position and width are also affected by the geometry. The peaks move towards the high salt concentration end and become wider as the taper ratio increases. Note that according to the circuit analysis, the potential difference across the nanochannels Δu is smaller than the potential difference applied across the microchannels ports ΔU: Δu is only 0.082 V at ΔU = 0.25 V and therefore the CE is very weak.
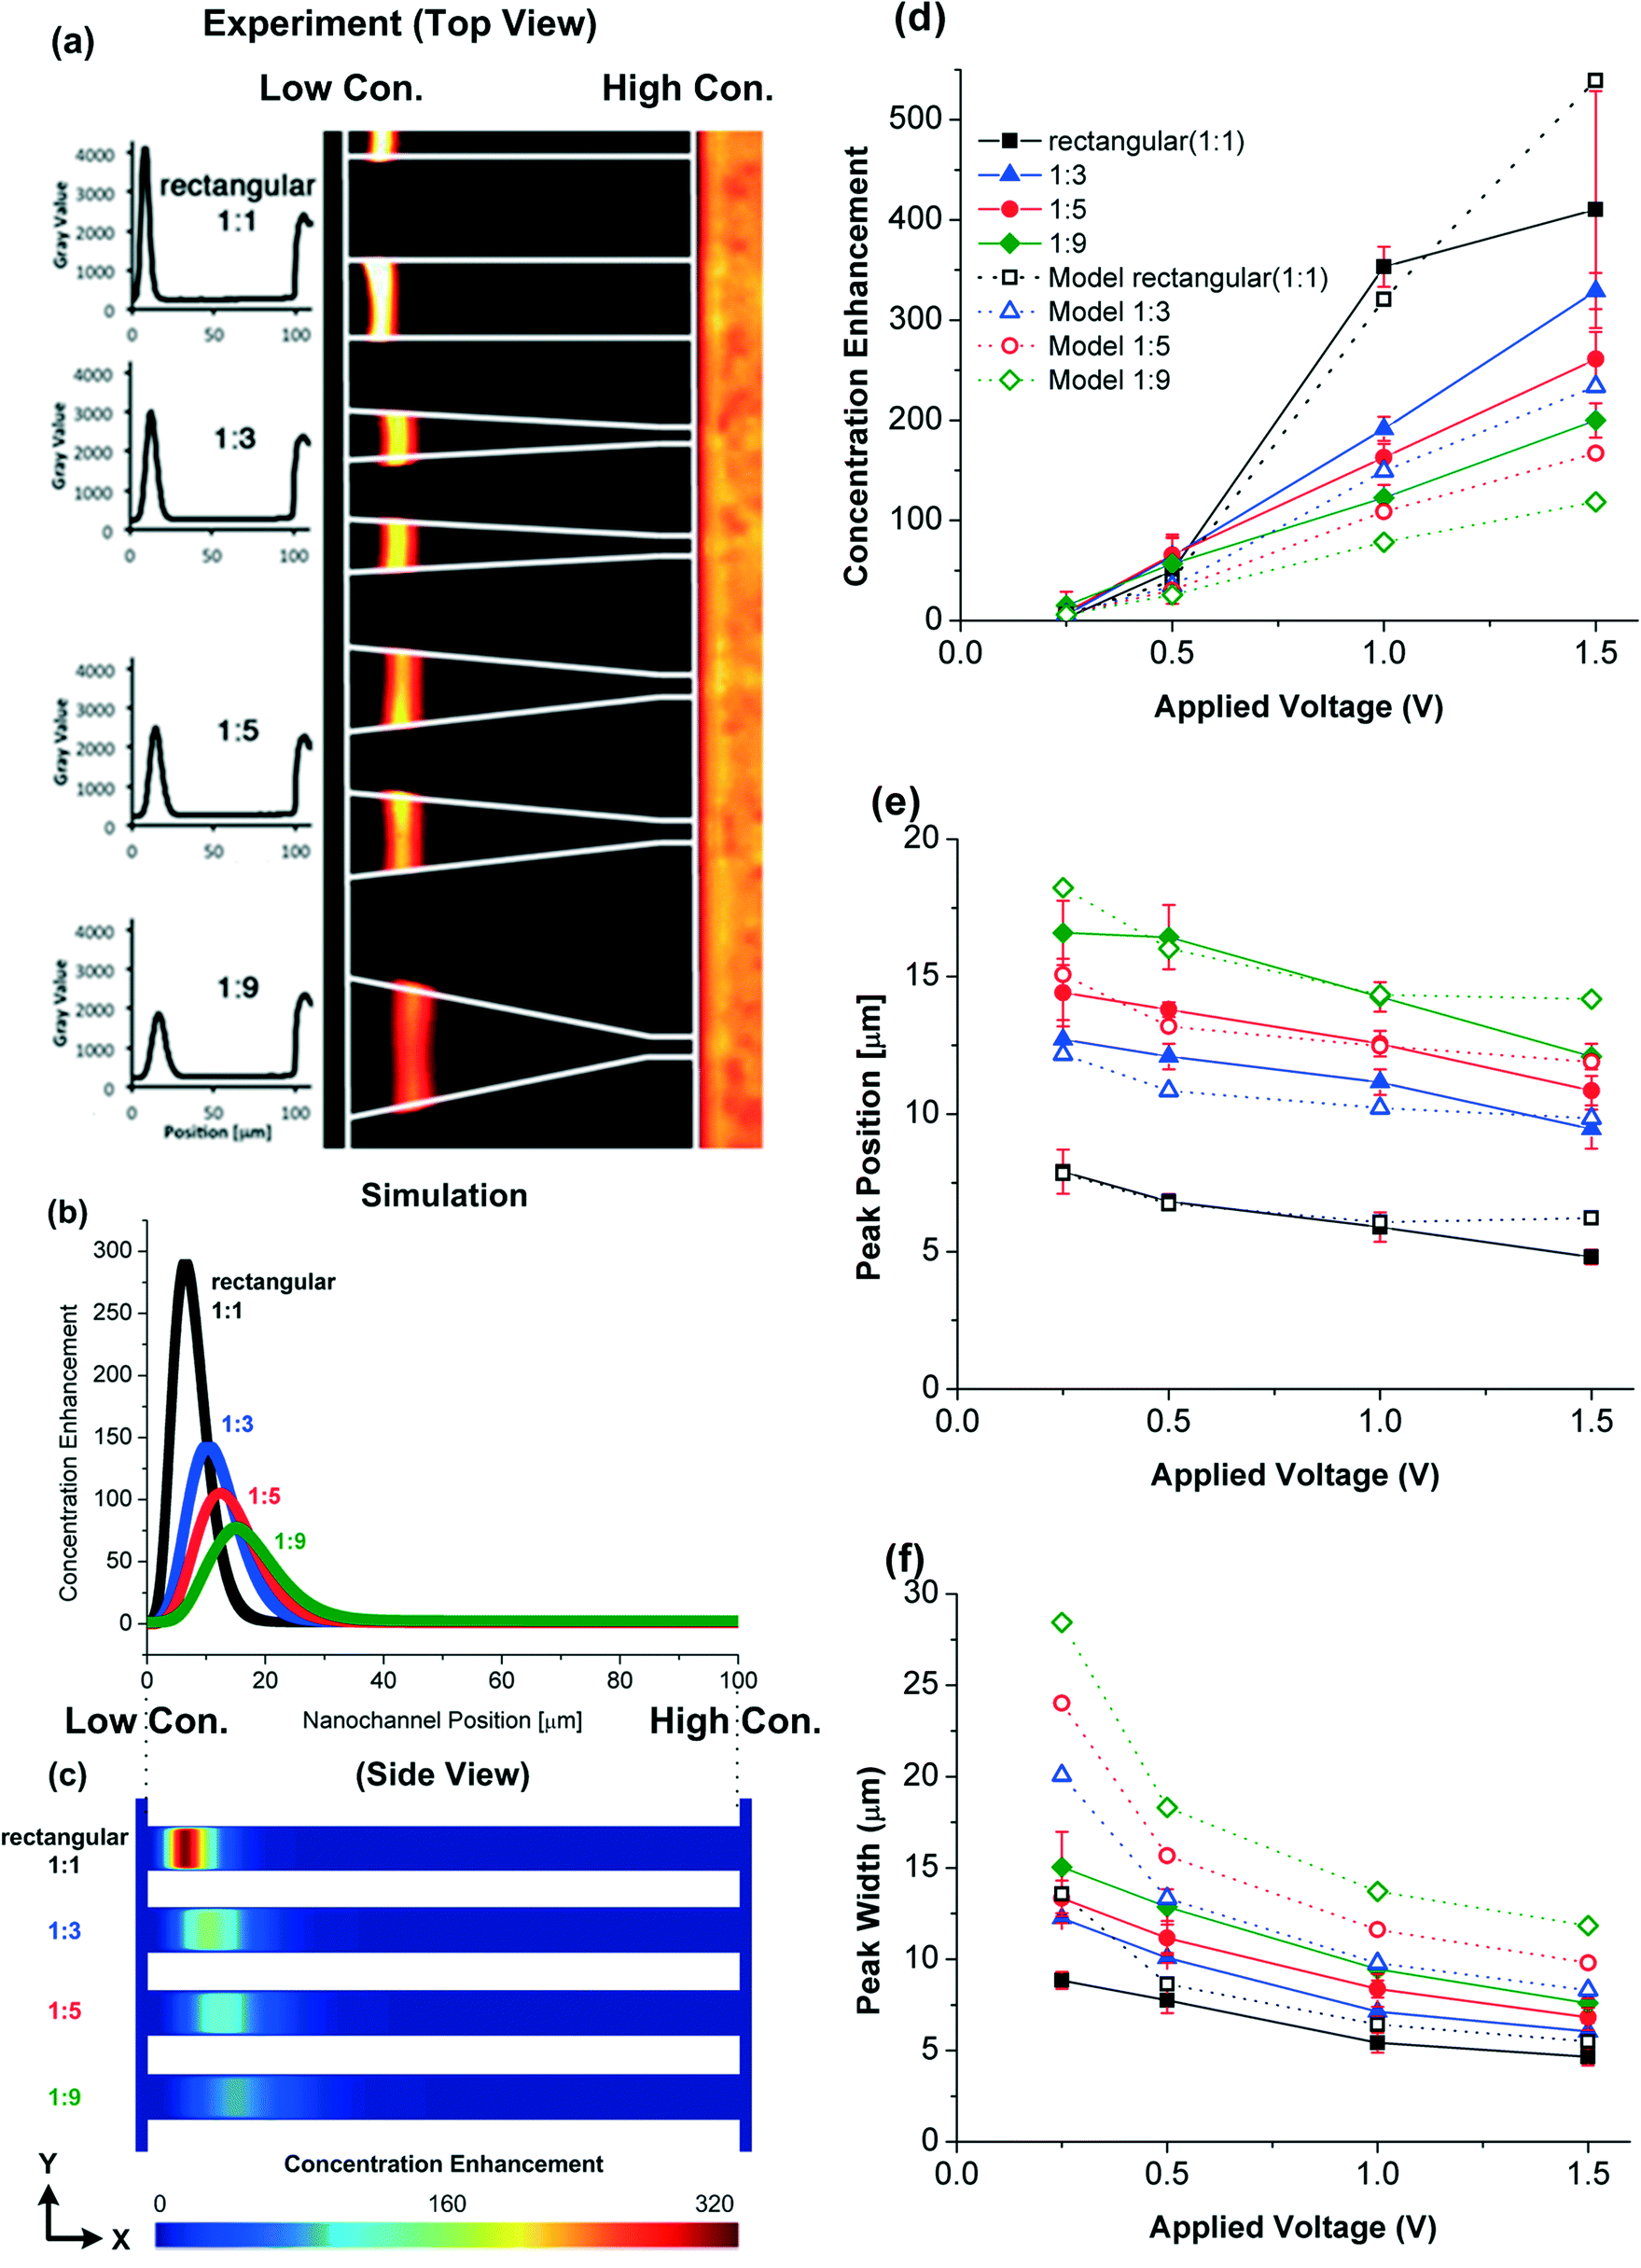 | ||
| Fig. 3 R-PE protein focusing in the nanochannels at t = 60 s and ΔU = 1 V. The nanochannel position is the position in the nanochannel axial direction where 0 and 100 μm denote to the low and high concentration ends, respectively. (a) The experimental fluorescein intensity versus the nanochannel position and the top view (X–Z plane) of the experimental trapping results. (b) Simulated CE (depth averaged) versus nanochannel position in different geometries of nanochannels. (c) The side view (X–Y plane) of the theoretical local CE (expanded 100 times in the y-direction). Variations of the (d) concentration enhancement (maximum depth averaged), (e) protein peak position and (f) protein peak width (full width at half maximum) as a function of the applied voltage. Solid lines and closed symbols are experimental results and dashed lines and open symbols are simulation results. | ||
The largest difference between the modeling and experimental CE values occurs when the CEs are high (e.g., at ΔU = 1.5 V in the 1:1 rectangular nanochannel, see Fig. 3d). The difference could be because:
(i) The charge from the proteins is too large and begins influencing the charge in the background electroosmotic flow.
(ii) The protein concentration reaches a saturation concentration and proteins start sterically interacting with each other. To evaluate the importance of these effects, we (i) compare the amount of charge from the proteins with the space charge density ρe and (ii) investigate the maximum protein concentration based on the protein size and its electric double layer thickness. The surface charge density ranges from −11.3 to −36.8 mC m−2 on the silica nanochannel surface making the average space charge density 643.6 mC m−3 within the nanochannel (if electroneutrality is applied to the nanochannel system). When CE is equal to 500 (np,input = 10−6 M), the charge density from the proteins, 1.03 mC m−3, is still much lower than the average space charge density within the nanochannel. Although the space charge density is not uniform in the nanochannel, the simulation results still show that the charge density from the proteins is too low to affect the electroosmotic flow. So we dismiss reason (i). On the other hand, the Debye lengths are 0.61 and 3.6 nm at the high and low salt concentration ends of the nanochannels, respectively. The radius of a protein cell (protein plus its double layer) at the low salt concentration end is ~7.5 nm (3.9 + 3.6 nm). A critical protein number density (2.96 × 10²³ nm−3) occurs when the distance between two proteins equals two cell radii (15 nm). For protein densities higher than this number, the electric double layers begin to overlap, making trapping unstable. At CE = 500 (np,input = 10−6 M), the protein density (3.01 × 10²³ nm−3) is close to this critical number, most likely causing the CE difference between the experimental and modeling results. We do not see this phenomenon in the simulations as the proteins are assumed to be point charges.
The forces on a R-PE protein particle along the rectangular nanochannel centreline are shown in Fig. 4a. As previously discussed, the electric field is relatively uniform within the channel, except at the low concentration end (from 30 to 0 μm) where it increases almost exponentially towards 0 μm (here 0 and 100 μm denote to the low and high concentration ends of the nanochannel, respectively). Hence, according to eqn (17), the electric force experienced by a protein is approximately constant and quite small from when it enters the channel until ~30 μm, from which point it increases strongly. At all times this force is directed to the right (that is, towards the high concentration end and in the opposite direction to the net electroosmotic flow).
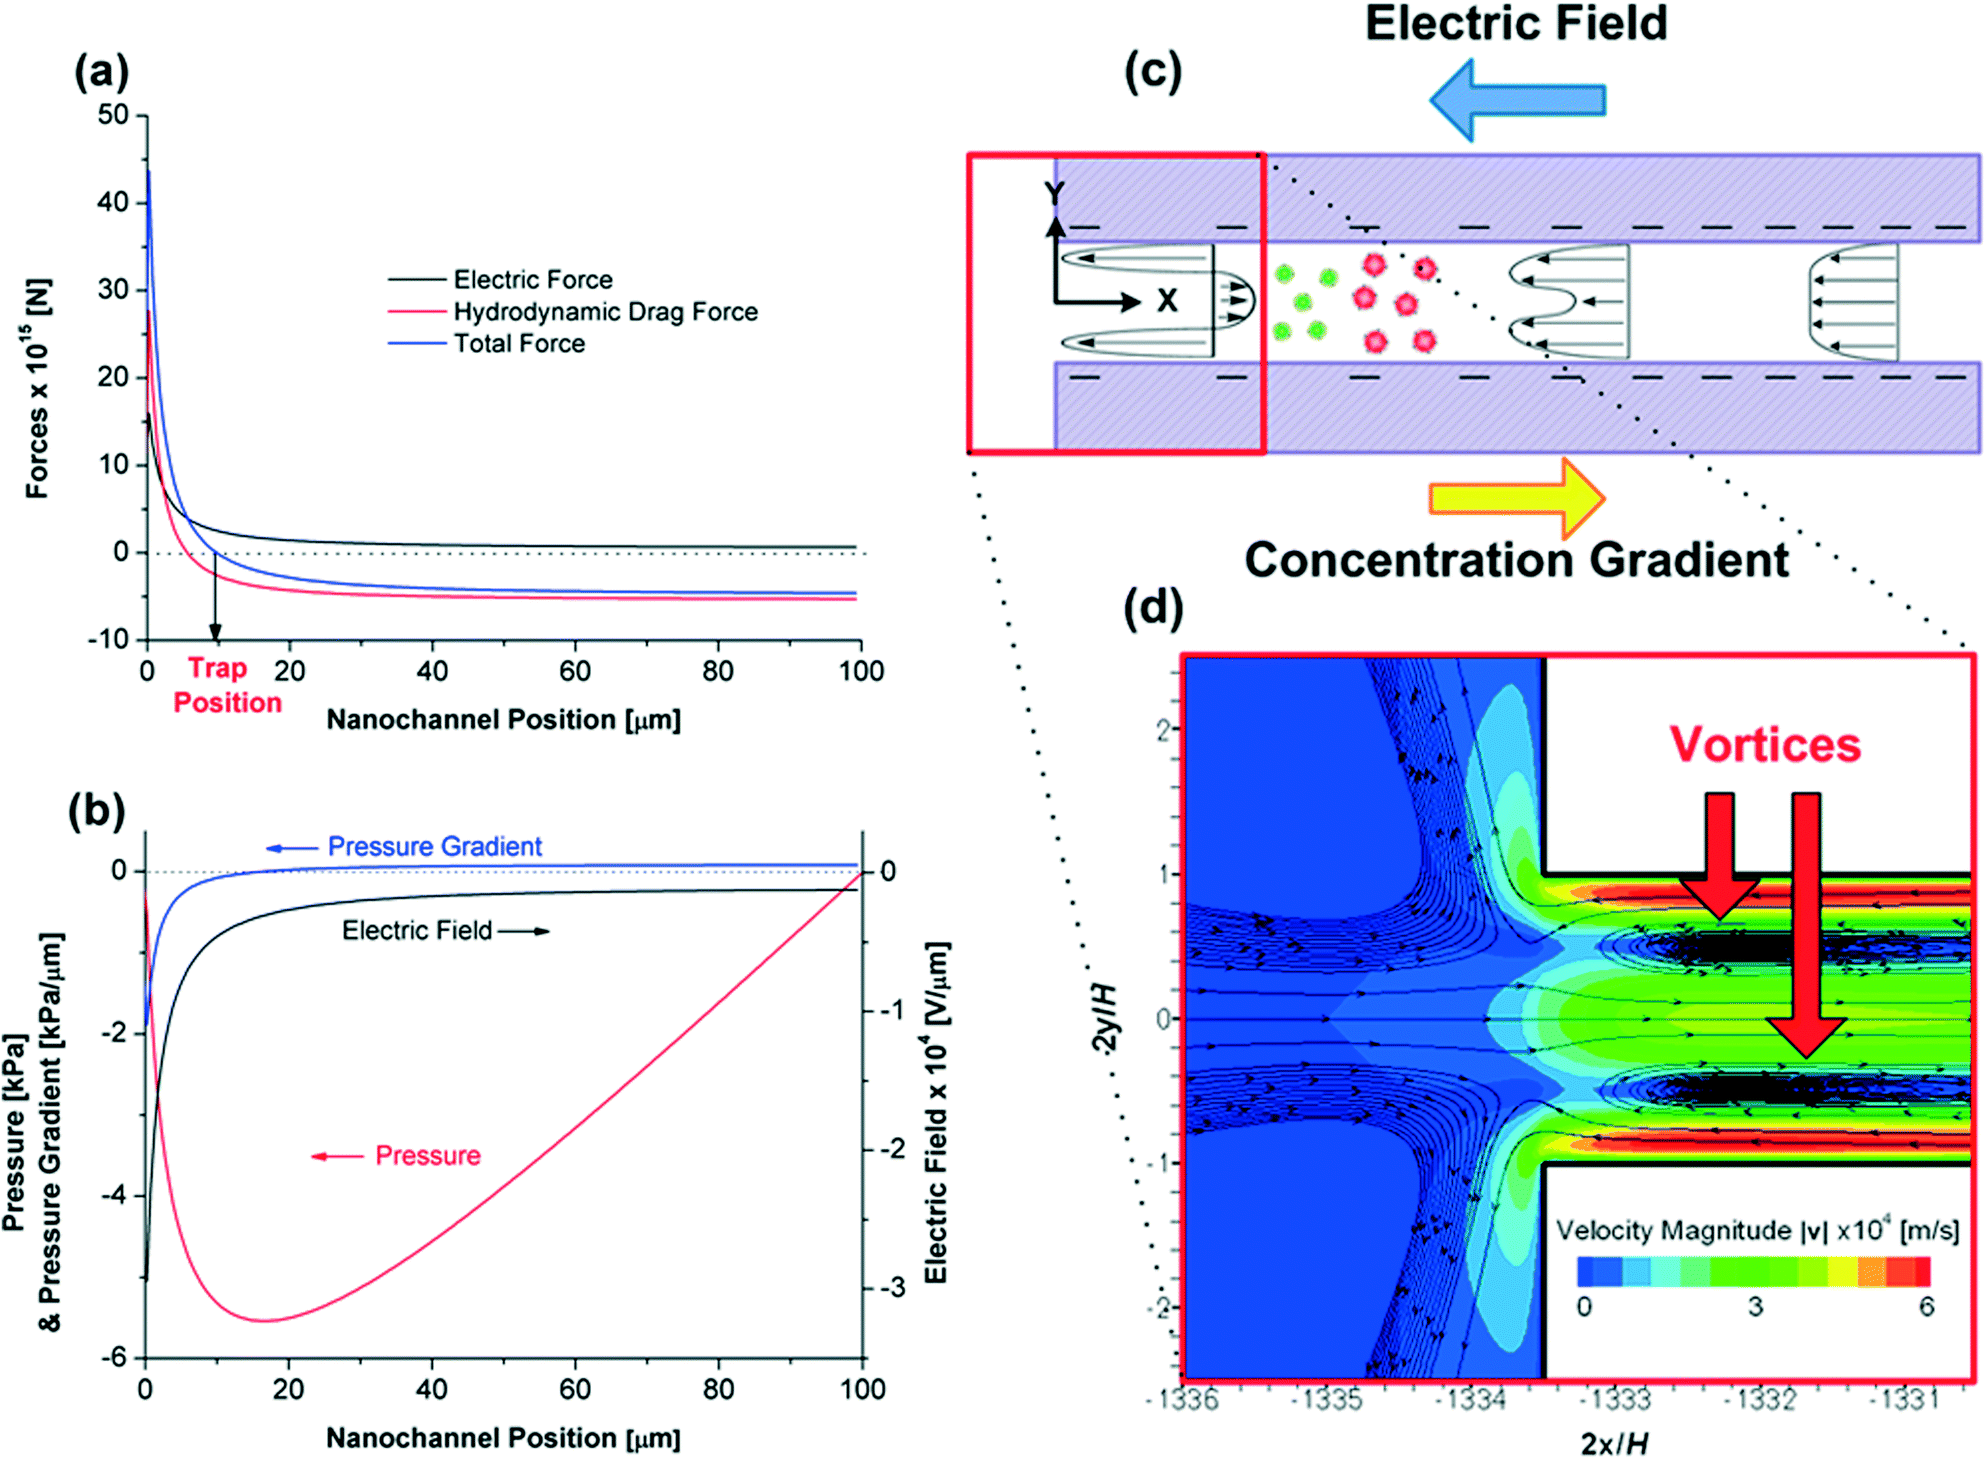 | ||
| Fig. 4 Variations of the (a) forces (electric force, hydrodynamic drag force and total force) on a R-PE protein (b) pressure, pressure gradient and electric field along the centreline as a function of the channel position. The nanochannel position is the position in the nanochannel axial direction where 0 and 100 μm denote to the low and high concentration ends, respectively. (c) A schematic diagram of the electroosmotic flow and (d) a contour of the non-uniform electroosmotic velocity magnitude |v| and the streaming lines near the low salt concentration end (at ΔU = 1 V in the 1:1 rectangular nanochannel). | ||
The hydrodynamic drag force experienced by a protein is not as previously described. Inglis et al.17 assumed that the drag force on each protein was uniform along the channel, being determined by the area-averaged, and hence uniform, electroosmotic velocity within the channel. However, the simulations show that velocity profiles vary greatly along the channel length, and hence so too does the local velocity and drag force on a protein near the channel's centreline. Indeed, the magnitude of the hydrodynamic force along the channel centreline starts decreasing at nanochannel position 30 μm, and changes sign near nanochannel position 7 μm, implying a local reversal of the flow direction (Fig. 4a). Due to the importance of this reversal on trapping behaviour, we examine its formation in more detail.
A schematic of the electroosmotic flow velocity profiles in the nanochannel and contours of the electroosmotic flow velocity magnitude are given in Fig. 4c and d, respectively. The formation of the counter-electroosmotic flow (from the left to right) at 7 μm is influenced by a number of factors, but is primarily due to the (i) variation of the electric field and (ii) non-uniform electric double layer thickness (due to the variation of the salt concentration) along the nanochannel, with both constrained by volume conservation.
As previously discussed, the magnitude of the electric field increases sharply when approaching the low concentration end of the channel (Fig. 4a). The large field exerts a large electroosmotic force on the fluid in the charged double layers, which, in the absence of any pressure gradient, would drive a larger fluid flux through the channel than at the high concentration end of the channel. However, as the channel is constrained by volume conservation, an axial pressure gradient develops along the channel length (Fig. 4b) that ensures that the flow rate along the channel length is uniform. The effect of this gradient is most pronounced near the low concentration end of the channel (the location of the largest electroosmotic force on the fluid) where it opposes the electroosmotic flow, and in so doing drives the fluid at the channel's centreline to the right, creating the local recirculation zones indicated in Fig. 4d.
The effect of the salt concentration on the double layer thickness similarly reinforces the formation of the recirculation zones, as the double layers are thicker at the low concentration end of the channel (κ−1 = 3.6 nm) than at the high concentration end (κ−1 = 0.61 nm). For a given surface charge, the electroosmotic force on a fluid increases as the double layer thickness increases.32 Hence, this effect (in isolation) reinforces the formation of the adverse pressure gradient at the low concentration end of the channel, and so too the local recirculation zones.
Note that in this complex flow situation there are other electrokinetic phenomena which both hinder and reinforce the recirculation zone formation. The charge on the silica surface decreases with decreasing salt concentration. This reduces the electroosmotic force on the fluid at the low concentration end of the channel, hence hindering the recirculation zone formation, but as shown in ESI 1,† not significantly. The viscoelectric effect is also examined in ESI 1.† It aids the formation of the recirculation zones as it decreases the electroosmotic force more significantly at the high concentration end of the channel where the surface charge is larger and double layer thickness smaller.
The two resulting vortices formed near the low concentration end enhance protein trapping: proteins cannot migrate to the low salt concentration microchannel along the centreline of the nanochannel due to the flow reversal. Also, they cannot circumvent these vortices using the passages near the nanochannel surface due to electric repulsive forces (both the nanochannel walls and proteins are negatively charged). The flow reversal revealed by the simulations is key to the efficiency of this device: both experimental and theoretical results show that for moderate Δu, the protein trapping efficiency is almost 100% meaning that all of proteins that enter the nanochannels from the high salt concentration microchannel become trapped.
The induced counter-electroosmotic flow does not hinder the protein separation ability. Simulation results for the separation of two kinds of proteins, R-PE and Dly-Strep, in the 1:5 nanochannel are shown in Fig. 5. The effective charge on a Dyl-Strep protein was calculated as the charge from the Protein Data Bank34 (−4.2 e) divided by the same Manning factor (3.5) as applied on R-PE The radius of Dly-Strep is 2.5 nm.17 The simulation results qualitatively capture previous experimental measurements conducted in a slightly different geometry.17 The separation is not as obvious as that in the previous experiment, however. Most probably this is because the concentration gradient in the channel length's direction is much larger in the simulations than in the experiments resulting in a larger average axial electric field gradient. The channel length in the present system is only 1/5 of the previous one (100 μm:500 μm) but the salt concentration difference across the channels is about 75% larger (234 mM:134 mM) yielding a ~8.75 times difference in average concentration gradient. Although a larger electric field gradient provides a wider electric field range, and hence benefits the focusing of multiple molecule species, it also hinders separation by placing trap locations closer to each other. Therefore, in CGF it is of importance to choose a moderate concentration gradient, over the appropriate range, to achieve simultaneous focusing and separation.
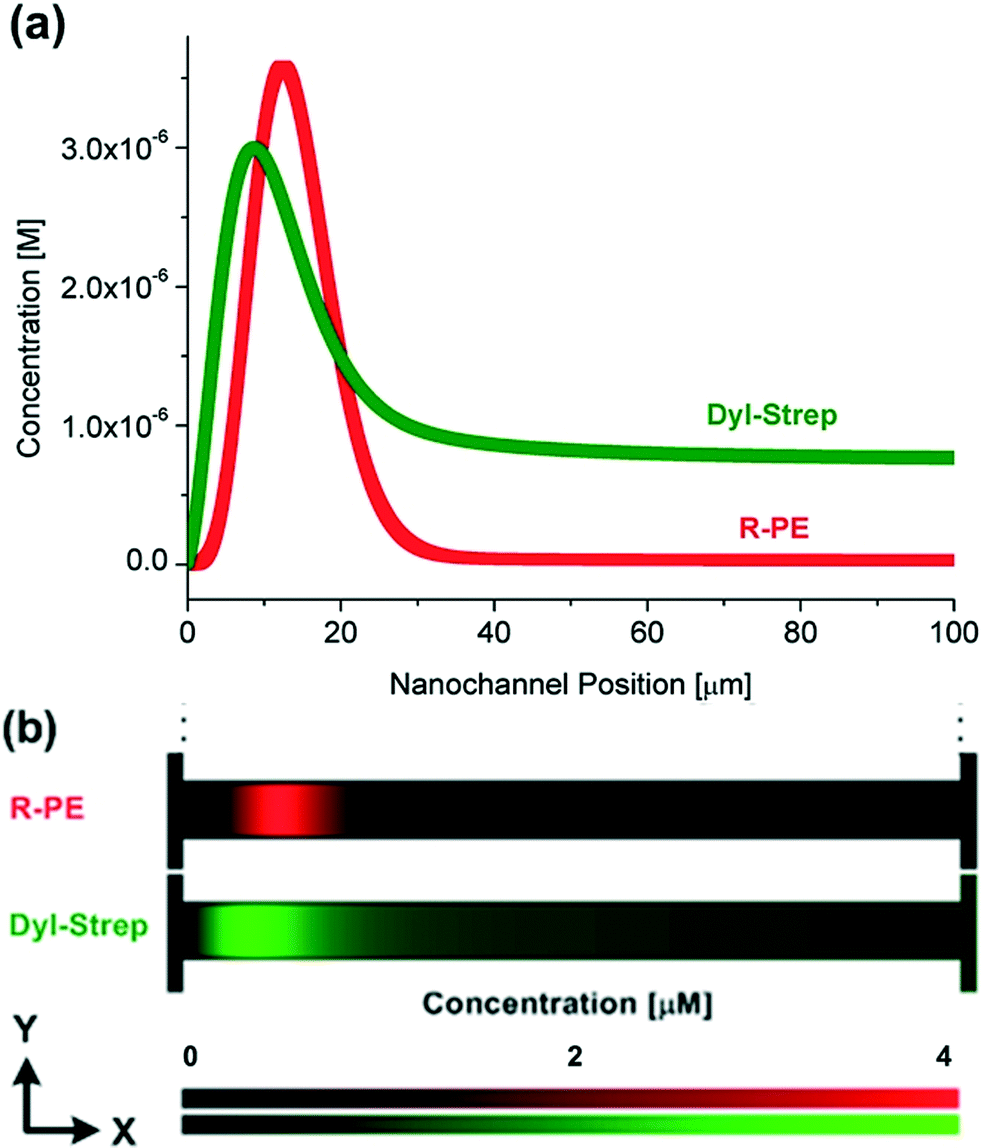 | ||
| Fig. 5 (a) Variations of average protein concentration as a function of the nanochannel position (the nanochannel position is the position in the nanochannel axial direction where 0 and 100 μm denote to the low and high concentration ends, respectively.) and (b) contours (expanded 100 times in the y-direction) of local protein concentration at t = 60 s and ΔU = 1 V in the 1:5 nanochannels for R-PE and Dyl-Strep proteins. The input protein concentrations are the same as the previous experiment (33 nM R-PE and 0.78 μM Dyl-Strep).17 | ||
5. Conclusion
CGF of proteins in a silica nanofluidic channel containing a varying electroosmotic flow is analysed experimentally and theoretically. The trap locations of the proteins depend on their charge to size ratio. The larger sized (lower diffusivity) and lower charged proteins are trapped closer to the low salt concentration end. The simulations quantitatively capture the observed trapping behaviour of a yellow/red fluorescent protein (R-PE).Analysis suggests that protein trapping becomes saturated when the electric double layers on the proteins overlap. Protein trapping conducted in a nanochannel which has a larger channel width at the low salt concentration end has a lower CE, peak located closer to the low concentration end and wider peak width. We find that the electroosmotic behaviour caused by a concentration gradient in a silica nanochannel is different from previously described: the non-uniform electric field and electric double layer along the nanochannel surface (due to the concentration gradient) induces a counter-electroosmotic flow near the nanochannel centreline at the low salt concentration end. This counter flow enhances the protein trapping efficiency while not hindering the separation ability. The separation of yellow/red fluorescent protein (R-PE) from green fluorescent protein (Dyl-Strep) as previously observed in a similar system is qualitatively captured by the simulations.
Acknowledgements
This work was supported by grants from the Australian Research Council (DP110102207).References
- P. G. Righetti, R. Sebastiano and A. Citterio, Proteomics, 2013, 13, 325–340 CrossRef CAS PubMed.
- J. Petr, V. Maier, J. Horakova, J. Sevcik and Z. Stransky, J. Sep. Sci., 2006, 29, 2705–2715 CrossRef CAS.
- J. Quist, K. G. H. Janssen, P. Vulto, T. Hankemeier and H. J. van der Linden, Anal. Chem., 2011, 83, 7910–7915 CrossRef CAS PubMed.
- S. Basak, A. Velayudhan, K. Kohlmann and M. Ladisch, J. Chromatogr. A, 1995, 707, 69–76 CrossRef CAS.
- P. O'Farrell, Science, 1985, 227, 1586–1589 Search PubMed.
- C. Raj and J. Hunter, Bioprocess Eng., 1992, 8, 121–128 CrossRef CAS.
- C. Raj and J. Hunter, J. Biochem. Biophys. Methods, 1994, 28, 161–172 CrossRef CAS.
- W. Koegler and C. Ivory, J. Chromatogr. A, 1996, 726, 229–236 CrossRef CAS.
- P. Humble, R. Kelly, A. Woolley, H. Tolley and M. Lee, Anal. Chem., 2004, 76, 5641–5648 CrossRef CAS PubMed.
- R. Kelly and A. Woolley, J. Sep. Sci., 2005, 28, 1985–1993 CrossRef CAS.
- D. Petsev, G. Lopez, C. Ivory and S. Sibbett, Lab Chip, 2005, 5, 587–597 RSC.
- J. Liu, X. Sun, P. Farnsworth and M. Lee, Anal. Chem., 2006, 78, 4654–4662 CrossRef CAS PubMed.
- D. Ross and L. Locascio, Anal. Chem., 2002, 74, 2556–2564 CrossRef CAS.
- R. Greenlee and C. Ivory, Biotechnol. Prog., 1998, 14, 300–309 CrossRef CAS PubMed.
- Q. Wang, S. Lin, K. Warnick, H. Tolley and M. Lee, J. Chromatogr. A, 2003, 985, 455–462 CrossRef CAS.
- S. Lin, H. Tolley and M. Lee, Chromatographia, 2005, 62, 277–281 CAS.
- D. W. Inglis, E. M. Goldys and N. P. Calander, Angew. Chem., Int. Ed., 2011, 50, 7546–7550 CrossRef CAS PubMed.
- A. Minerick, A. Ostafin and H. Chang, Electrophoresis, 2002, 23, 2165–2173 CrossRef CAS.
- E. Andrade and C. Dodd, Proc. R. Soc. London, Ser. A, 1946, 187, 296–337 CrossRef CAS.
- W.-L. Hsu, D. W. Inglis, H. Jeong, D. E. Dunstan, M. R. Davidson, E. M. Goldys and D. J. E. Harvie, Langmuir, 2014, 30(18), 5337–5348 CrossRef CAS PubMed.
- J. Lyklema and J. Overbeek, J. Colloid Sci., 1961, 16, 501–512 CrossRef CAS.
- R. Hunter and J. Leyendekkers, Journal of the Chemical Society, Faraday Transactions 1: Physical Chemistry in Condensed Phases, 1978, 74, 450–455 RSC.
- M. Z. Bazant, M. S. Kilic, B. D. Storey and A. Ajdari, Adv. Colloid Interface Sci., 2009, 152, 48–88 CrossRef CAS PubMed.
- E. Andrade and C. Dodd, Proc. R. Soc. London, Ser. A, 1951, 204, 449–464 CrossRef.
- M. A. Startsev, D. W. Inglis, M. S. Baker and E. M. Goldys, Anal. Chem., 2013, 85, 7133–7138 CrossRef CAS PubMed.
- S. Behrens and D. Grier, J. Chem. Phys., 2001, 115, 6716–6721 CrossRef CAS PubMed.
- C. D. Lorenz, P. S. Crozier, J. A. Anderson and A. Travesset, J. Phys. Chem. C, 2008, 112, 10222–10232 CAS.
- P. Scales, F. Grieser, T. Healy, L. White and D. Chan, Langmuir, 1992, 8, 965–974 CrossRef CAS.
- S. Ong, X. Zhao and K. Eisenthal, Chem. Phys. Lett., 1992, 191, 327–335 CrossRef CAS.
- F. van der Heyden, D. Stein and C. Dekker, Phys. Rev. Lett., 2005, 95, 116104 CrossRef.
- L. H. Allen, E. Matijevic and L. Meties, J. Inorg. Nucl. Chem., 1971, 33, 1293–1299 CrossRef CAS.
- D. J. E. Harvie, C. J. C. Biscombe and M. R. Davidson, J. Colloid Interface Sci., 2012, 365, 1–15 CrossRef CAS PubMed.
- D. J. E. Harvie, ANZIAM J., 2012, 52, C1126–C1145 Search PubMed.
- Protein Data Bank (PDB), http://www.rcsb.org.
- G. Manning, J. Chem. Phys., 1969, 51, 924–933 CrossRef CAS PubMed.
- L.-H. Yeh, J.-P. Hsu, S. Qian and S. Tseng, Electrochem. Commun., 2012, 19, 97–100 CrossRef CAS PubMed.
- M. Zhang, L.-H. Yeh, S. Qian, J.-P. Hsu and S. W. Joo, J. Phys. Chem. C, 2012, 116, 4793–4801 CAS.
- U. F. Keyser, S. van Dorp and S. G. Lemay, Chem. Soc. Rev., 2010, 39, 939–947 RSC.
Footnote |
| † Electronic supplementary information (ESI) available. See DOI: 10.1039/c4lc00504j |
| This journal is © The Royal Society of Chemistry 2014 |