 Open Access Article
 This Open Access Article is licensed under a Creative Commons Attribution-Non Commercial 3.0 Unported Licence
A paper microfluidic cartridge for automated staining of malaria parasites with an optically transparent microscopy window†
Matthew P.
Horning
a,
Charles B.
Delahunt
ab,
S. Ryan
Singh
a,
Spencer H.
Garing
a and
Kevin P.
Nichols
*a
aIntellectual Ventures Laboratory, 1555 132nd Ave NE, Bellevue, WA 98005, USA. E-mail: knichols@intven.com; Fax: +1 425 247 2108; Tel: +1 425 777 9620
bDepartment of Electrical Engineering, University of Washington, Seattle, WA, USA
First published on 15th April 2014
Abstract
A paper microfluidic cartridge for the automated staining of malaria parasites (Plasmodium) with acridine orange prior to microscopy is presented. The cartridge enables simultaneous, sub-minute generation of both thin and thick smears of acridine orange stained parasites. Parasites are stained in a cellulose matrix, after which the parasites are ejected via capillary forces into an optically transparent chamber. The unique slanted design of the chamber ensures that a high percentage of the stained blood will be of the required thickness for a thin smear, without resorting to spacers or other methods that can increase production cost or require tight quality controls. A hydrophobic snorkel facilitates the removal of air bubbles during filling. The cartridge contains both a thin smear region, where a single layer of cells is presented unobstructed, for ease of species identification, and a thick smear region, containing multiple cell layers, for enhanced limit of detection.
Introduction
Paper microfluidics utilizes the interstitial spaces within cellulose fibers as chemical reaction zones, and capillarity as a pumping mechanism, to enable chemical unit operations in an inexpensive format that is particularly amenable for limited resource settings.1–8 We describe a paper microfluidic cartridge for the automated staining of malaria parasites in a cellulose matrix, followed by ejection of the parasites via capillary forces from a paper substrate into an optically transparent chamber suitable for microscopy. Dead-end filling,9 with air displaced through hydrophobic gaps, prevents leaking, and the novel inclusion of a snorkel removes air bubbles. This system represents a straightforward method to combine recent developments in paper microfluidics for sample preparation with traditional optical microscopy. We demonstrate the utility of such a system for the automated staining of malaria parasites.Malaria is a significant health problem in many parts of the world, with an estimated 207 million cases causing 627![[thin space (1/6-em)]](https://www.rsc.org/images/entities/char_2009.gif) 000 deaths in 2012.10 Malaria is caused by five species of parasites in the genus Plasmodium,11 of which P. falciparum is the most prevalent and deadly.10 Despite an increase in the percentage of suspected malaria cases receiving parasitological testing, up to 64% worldwide in the public sector in 2012, there still exists a shortfall from the World Health Organization (WHO) recommendation to test all suspected cases. As transmission decreases in many regions and elimination strategies are developed, more demanding requirements will be put on diagnostic tools.12
000 deaths in 2012.10 Malaria is caused by five species of parasites in the genus Plasmodium,11 of which P. falciparum is the most prevalent and deadly.10 Despite an increase in the percentage of suspected malaria cases receiving parasitological testing, up to 64% worldwide in the public sector in 2012, there still exists a shortfall from the World Health Organization (WHO) recommendation to test all suspected cases. As transmission decreases in many regions and elimination strategies are developed, more demanding requirements will be put on diagnostic tools.12
While the precise needs of a diagnostic technique vary by use case, the malERA group suggests that case management requires a minimum sensitivity of 95% and specificity of 90% at a 100–200 parasites μl−1 limit of detection, whereas screening will require sensitivity and specificity of 95% at a 20 parasites μl−1 limit of detection. Further, the test should cost less than US $1, take less than 30 minutes, and require minimal training.12 The ability to identify species is important in regions where multiple species are endemic.
Current diagnostic tools
Rapid diagnostic tests (RDTs) for malaria detect Plasmodium specific antigens in a lateral flow assay. RDTs are easy to use and interpret and their use has increased rapidly in case-management settings over the last decade.10 RDTs can detect antigens specific to the Plasmodium genus or to an individual species,13 with P. falciparum-specific RDTs demonstrating the lowest detection limit of 100 parasites μl−1.14 A higher detection threshold for non-falciparum14 reduces RDT effectiveness in case-management of non-falciparum infections. Furthermore, as RDTs detect an antigen, not a parasite, they do not give a quantitative measure of parasitemia.Polymerase chain reaction (PCR) has excellent sensitivity and specificity even at low parasitemia levels and can be used to identify malaria species and mixed infection from multiple species.15 However, PCR is relatively expensive and slow, and requires at least a moderately-equipped laboratory, limiting its use in malaria endemic countries. Loop-mediated isothermal amplification (LAMP) has also been demonstrated for malaria diagnosis with similar performance as PCR, although in current reports it takes approximately 1 hour to perform.16
Giemsa smear microscopy, first demonstrated over a century ago, is still widely used for malaria diagnosis. Typically, Giemsa smear microscopy utilizes both thick and thin blood smears.17 The thick smear contains a larger volume of blood per field of view and thus allows a lower limit of detection or decreased read time. However, parasite morphology in thick smears is typically obscured. The thin smear retains the cell and parasite structure and is utilized for species identification based on parasite morphology. A WHO-accredited level 1 expert microscopist can detect parasitemia of 80–200 parasites μl−1 and identify species with 90% accuracy.18 However, performance of the technique in many settings is poor19–23 owing largely to variations in microscopist skill level and stain quality.24 Stain quality is influenced by both blood smear preparation and chemical staining. Giemsa smear microscopy is also slow, with drying and staining taking 30–90 minutes and reading taking approximately 10 minutes.25,26 Errors due to staining are a frequent cause of worsened limits of detection,24 indicating the need for an automated blood staining platform suitable for limited resource settings.
Acridine orange (AO), a fluorescent stain, has been used as an alternative to Giemsa stain.27–29 AO staining takes only a few minutes, can be performed on a wet sample, and does not require rinsing.30 AO differentially stains DNA and RNA, and it is possible to observe morphological features of the nucleus and cytoplasm of the malaria parasite. AO staining and fluorescence microscopy have similar sensitivity and specificity to expert Giemsa smear microscopy, although the ability to identify species has not been unequivocally demonstrated.30
Several automated scanning and image processing techniques for reading Giemsa smears have been reported.31–35 None have yet matched the performance of expert manual microscopy. While such approaches will likely be able to replace the time-consuming task of microscopy, they typically require a well-prepared Giemsa smear. Vink et al. demonstrated an automated AO Plasmodium staining cartridge coupled to automated microscopy and image analysis.32 They concluded, “a field trial in Chittagong (Bangladesh) indicated that future work should primarily focus on improving the filling process of the cartridge and the focus control part of the scanner”.32
We present a new, automated AO staining cartridge that has the potential to greatly reduce technician error during the staining of blood samples. Compared to previous automated approaches, our system decreases the total filling time, enables potentially enhanced limits of detection via the addition of a thick smear region, and has significant manufacturing advantages, requiring neither a bonding step nor tightly controlled spacing during its assembly.
Methods
Cartridge fabrication
AO dye was prepared in ethanol. A saturated stock solution of dye was prepared by dissolving 0.1 g of AO base (Sigma Aldrich product # 235474) in 20 mL of ethanol at 22 °C. A 0.1 micron filter was utilized to remove undissolved dye and contaminants. The filtered solution was diluted in ethanol to 0.06× stock concentration. Examples of non-optimal concentration greater than 0.06× stock are shown in Fig. S2.†The paper type utilized for red blood cell (RBC) transport and parasite dyeing was chosen to minimize retention of RBC. Al-tamimi et al. measured the elution distance of RBC on various paper types including blotting paper, filter paper, and paper towels. Paper towels had the highest elution distance.36 Kirkland Signature 2-Ply paper towels (Costco, Seattle WA part # 118265) were utilized. Prior to cutting, dyed paper was prepared by dispensing 10 mL of 0.06× stock concentration of AO base in ethanol evenly across an approximately 8 inch by 4 inch area on a paper towel and allowing it to dry, freely suspended, for approximately 30 minutes. The paper towels were cut using an eCraft Electronic Die Cutter (Craftwell, USA). Details of the cutting method and the SVG pattern file are available in ESI.† After cutting undyed paper into the appropriate shape, hydrophobic snorkel paper was created by depositing 1H,1H,2H,2H-perfluorodecyltrichlorosilane (Sigma-Aldrich, USA, part # 729965) under moderate vacuum (10 mTorr) for 30 minutes. Microscope slides and cover slips had a hydrophobic ring patterned on the outside of the cartridge to prevent fluid leakage. Masking was accomplished using adhesive office tape applied prior to deposition. A hydrophobic layer was deposited also using 1H,1H,2H,2H-perfluorodecyltrichlorosilane (Sigma-Aldrich, USA, part # 729965) under moderate vacuum (10 mTorr) for 30 minutes, followed by removal of the adhesive mask, baking at 110 °C for 1 hour, rinsing with ethanol, and drying.
Cartridges with hydrophilic (dye containing) and hydrophobic (snorkel) paper were placed over a hydrophobic patterned microscope slide as the base and a 24 × 60 mm coverslip (Fisher Scientific, USA, part # 22-266-882) as the top, as shown in Fig. 1B–C. Mini binder clips (USSCo part # UNV-10199) held the assembly together, as shown in Fig. 1 and 2.
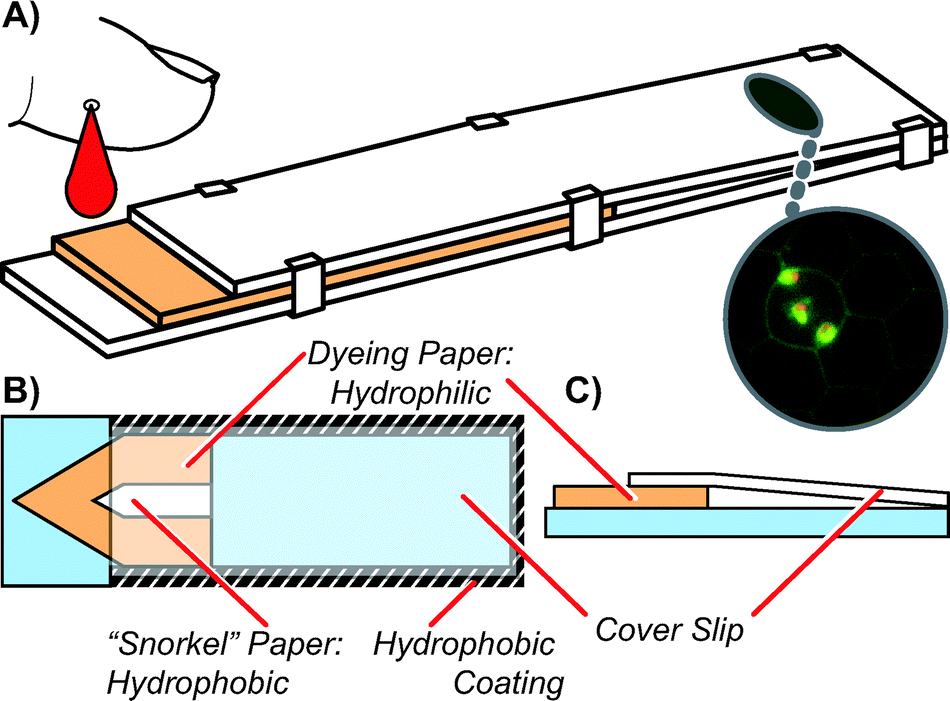 | ||
| Fig. 1 A) A 3D view of cartridge showing blood being dispensed from the left, acridine orange dye filled paper where staining occurs, and the unobstructed, transparent coverslip region where imaging is conducted via microscopy. B) A top-down view of the cartridge showing the dye-filled paper, the snorkel paper, and a hydrophobic ring around the outside of the cartridge. The snorkel allows air bubbles to leave during filling (see Fig. 2). As in dead-end filling,9 the hydrophobic ring prevents blood from leaving the cartridge during and after filling, without requiring a bonding step. C) A cross-section of the cartridge, emphasizing the slanted nature of the coverslip during use, which permits imaging in both thick (many cells) and thin (single cell) regions. | ||
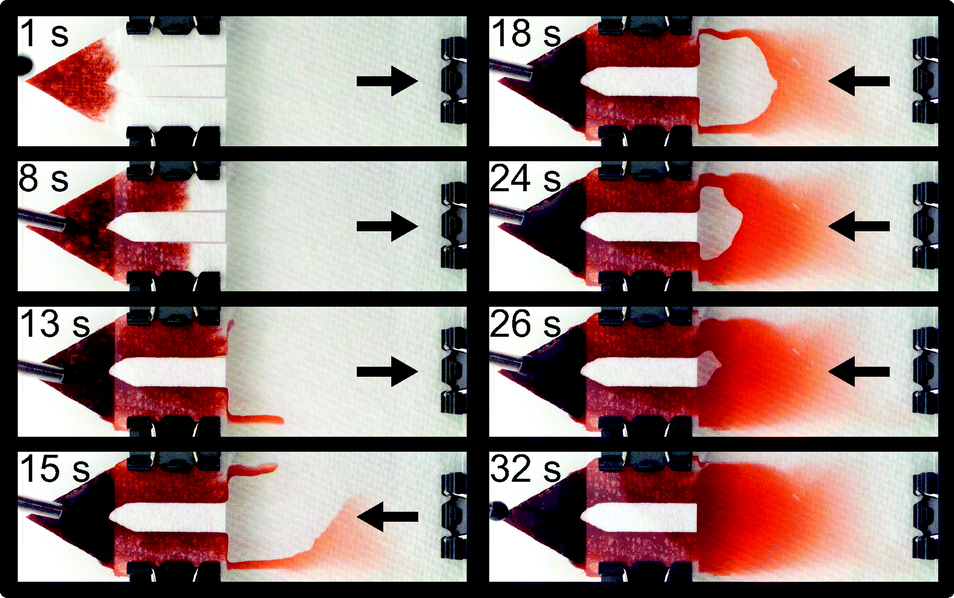 | ||
| Fig. 2 Time series showing filling of an automated blood staining cartridge, demonstrating use of a snorkel to remove a trapped air bubble from the device. The hydrophilic paper is not dyed in this image sequence to enable easier visualization. Liquid fills the side walls of the cartridge first, then travels back towards the paper wick until an air bubble is encased. Normally, this air bubble would be trapped, but a snorkel allows its escape and replacement with additional liquid. Also evident in this image sequence is the slanted nature of the microscopy chamber, which generates both thick and thin regions. An example of a manually prepared thick and thin smear, prepared by an expert microscopist is shown in Fig. S1.† | ||
Microscope adapter
A microscope stage adapter was 3D printed in ABS plastic using a Stratasys Dimension Elite printer (Stratasys, USA) such that a standard microscope stage with clamps could grip the bottom of the cartridge assembly without removing the binder clips. A photograph of this adapter is shown in Fig. S3.† The silver pins were removed from the binder clips before inserting in the stage, though the clips themselves were left in place. The STL file utilized to print the adapters is included in ESI,† and can be duplicated using 3D printing.Cartridge volume measurements
Cartridges were suspended vertically over a Sartorius Analytic (Sartorius, USA) AC 210 S analytical balance and slowly lowered into a dish filled with DI water. A custom LabVIEW script was used to record balance output at 10 Hz. Mass in the transparent, optically accessible region of the cartridge was differentiated from mass in the paper region of the cartridge by fitting the mass during filling as a function of the square root of time, and identifying distinct paper and non-paper regions, based on the Washburn equation.4 The evaporation of water from the dish was assumed to be constant, and subtracted off the mass difference measurement.Culture of plasmodium
P. falciparum culture was obtained from the Seattle Biomedical Research Institute. In vitro parasite cultures were maintained in RPMI 1640 (25 mM HEPES, 2 mM L-glutamine) supplemented with 50 μm hypoxanthine and 10% A+ human serum in an atmosphere of 5% CO2, 5% O2, and 90% N2. Cells were subcultured into O+ erythrocytes. Parasites were synchronized weekly at the ring stage using 5% sorbitol. All procedures are as described in Methods in Malaria Research, 5th edition.37Reference standard
For use as a reference standard, Giemsa stained blood smears were prepared with 2 μl of P. falciparum culture diluted in whole blood for thin smears and 6 μl for thick smears. After drying for 1 hour, thin smears were fixed in absolute methanol for 30 seconds (Sigma-Aldrich, USA part # 322415). A working solution of Giemsa stain was prepared from stock solution (Sigma-Aldrich part # GS500-500ML) using 90 mL of deionized water and 10 mL of Giemsa stock. Slides were loaded into Coplin jars and immersed in the working solution for 12 minutes, after which they were rinsed thoroughly with a gentle stream of DI water. Slides were then left to air dry.Manual microscopy
Microscopy was conducted using a Nikon Microphot-FXL microscope with a 1.25× nosepiece, a 0.95 NA 40× objective with coverslip correction (Nikon, Japan part # 141622) and a Nikon DS-Ri1 color camera (Nikon, Japan). The total field of view was 166 μm × 133 μm as measured on a calibrated Ronchi ruling. The image resolution was 1280 × 1024. A Nikon B-2A fluorescence filter cube was used for fluorescence microscopy, enabling simultaneous imaging of both DNA-bound and RNA-bound acridine orange. Manual counting, when utilized, was performed on AO stained slides by identifying the distinctive ring pattern of the cultured parasites, combined with green and orange segments in close proximity.30 Giemsa stained samples were counted using standard methods.37 In AO stained cartridges we specifically sought out either thin, closely packed regions, or thick, multi-layered areas, for the respective regions. In Giemsa stained slides utilized as reference standards, we sampled randomly across the thin and thick smear regions generated as described in the “reference standard” section.Automated image analysis
Automated image analysis was conducted on micrographs of stained parasites. The image-processing algorithm had two goals: to detect parasites, and to count RBC. The full MATLAB code and an example image are included in ESI.† The targeted parasite signature is a bright orange area (stained DNA) in close proximity to a bright green area (stained RNA). First, a bright orange binary image and a bright green binary image are created by masking the red channel and green channel with adaptive thresholds. Then the orange image is dilated, adding a border to each 1-valued region. Parasite locations are represented by the overlap of the two images, i.e. where orange and green regions are close together. RBC were counted based on the observation that the cell walls of RBC stain pale green, while their interiors are typically dark. The cell walls are captured in a binary image by masking the green channel with a local adaptive threshold. Median filters eliminate scattered pixel noise. The image is then reversed, so that cell walls are black and cell interiors are white. The cell interiors are separated by eroding the image, which removes border areas. The cell interiors are then solidified by dilation so that each cell interior is a single connected region. The number of distinct connected regions is recorded as the number of RBC. This method works due to the tightly spaced monolayer of RBC present in the thin regions imaged in this study.Results and discussion
An automated cartridge to stain blood for malaria parasite detection should have five critical features: ease of use, speed, low cost, good optical properties, and amenability to automated microscopy. The system we present is easy to use: the only user-intervention required is the deposition of a blood sample, after which the system transports the blood through capillary action, stains the parasites with AO, and progresses with dead-end filling9 without leaking. Further, the system is fast: from sample introduction to complete blood staining requires less than a minute. The system has good optical properties: once the blood is expelled from the staining paper it is in contact with only a microscope slide and cover glass, which are standard optical microscopy components. The standard cover glass thickness allows imaging with standard high-NA microscope objectives available in the field. Additionally, the system contains only inexpensive materials, and requires no bonding step in its fabrication. Finally, we demonstrate that the system is amenable to automated microscopy.As can be seen in Fig. 1, the system is a three layer sandwich. The bottom layer is a standard microscope slide, modified such that a hydrophobic ring around the outside of the cartridge prevents fluid from exiting after dead-end filling. Dye filled paper is utilized to stain the malaria parasites. A separate, hydrophobic piece of paper enables the removal of air bubbles from the cartridge, as only air can pass through this snorkel section. The filling of the cartridge is shown in Fig. 2, which illustrates the containment of the sample due to the hydrophobic ring and the removal of air via the hydrophobic paper snorkel.
An obvious gradient in blood thickness can be observed in Fig. 2. In Fig. 3, red blood cells are shown in both fluorescence and bright field modes. Importantly, parasites are distinguishable in all regions of the cartridge, from thick to thin. The fluorescence images show the parasites, with their distinctive orange and green coloration in AO stain. And, the bright field images show the relative packing density of cells in each region.
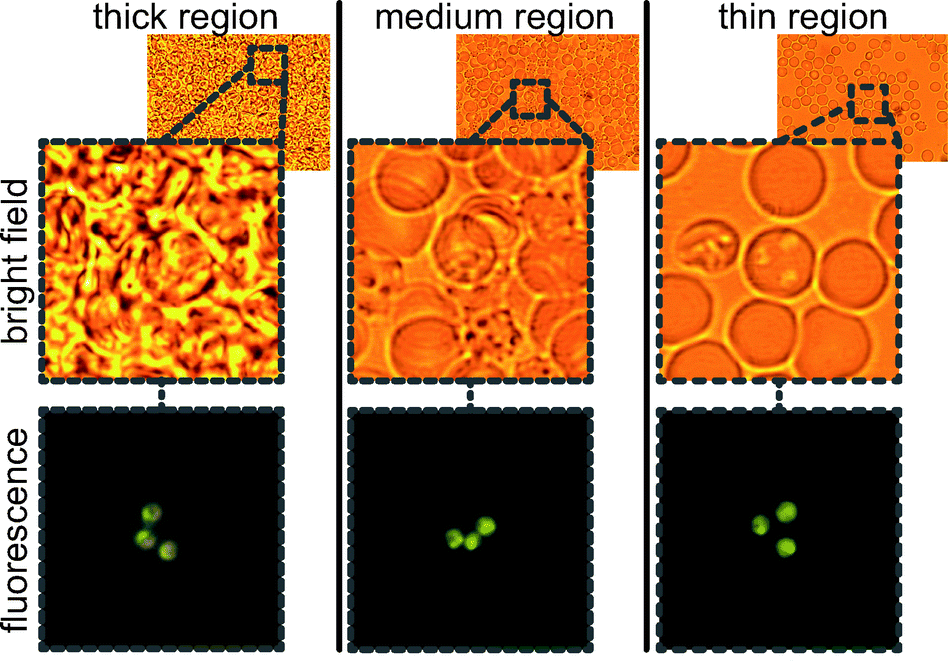 | ||
| Fig. 3 Three regions of a single chip showing Plasmodium falciparum in thick, medium, and thin regions of the cartridge. Bright field and fluorescence images are taken without moving the stage. | ||
Manual comparison with existing reference standards
The limit of detection for any microscopy-based malaria parasite test will be a function of the object-level sensitivity and specificity (i.e., the probability of correctly identifying a parasite infected cell as infected, and the probability of correctly identifying a non-parasite infected cell as healthy) as well as the total volume of blood observed. In manual microscopy, object-level sensitivity and specificity are determined by stain quality, as well as microscopist skill.24 The volume of blood observed is limited by stain thickness and microscopist fatigue. Microscopists are typically advised to observe approximately 100 to 200 fields of view.25Microscopic examination of blood for malaria parasites frequently uses both thick and thin smears of blood. Thick smears facilitate a lower limit of detection (there are more parasites per field of view, and microscopists have a limited number of fields of view they can observe). Thin smears better preserve the structure of the RBC and parasites, permitting easier identification of species. Differentiation between Plasmodium species using AO has been reported,30 although disagreement in the literature warrants further study of the dye's suitability for this task.
The AO staining ability of the cartridge presented herein was compared to manual Giemsa staining, the reference standard for parasite identification.37 As shown in Fig. 4, the thin region of the cartridge performs comparably to manually prepared thin Giemsa smears in terms of parasites per field of view. The thick region of the cartridge performs similarly to the thick Giemsa smear when four focal planes are counted in a z-stack, a process well suited to automated microscopy. The data shown in Fig. 4 should not be utilized to extrapolate a limit of detection. The presence of a co-linear region on the calibration curve, when both methods are analyzed by expert microscopists using conventional techniques, is encouraging. However, since we have only presented a sample preparation tool intended to reduce technician error, a meaningful statement of the system’s limit of detection cannot be made without also analyzing the sample preparation method along with its intended transducer. The transducer in this case is a microscope utilized by a human technician or a computer vision system. Therefore, to obtain a clinically meaningful limit of detection, sensitivity, and specificity, the analysis of low parasitemia samples from actual field samples analyzed by multiple microscopists would be required, which we hope to accomplish in future work.
 | ||
| Fig. 4 Parasites per field of view as a function of parasitemia for the AO cartridge (red lines) vs. the reference standard (manual Giemsa staining). This image indicates agreement between the two methods at high parasitemia. Thick smear data points in the cartridge were obtained by combining a z-stack with four focal planes. Error bars indicate one standard deviation based on counts per field of view from multiple fields of view. | ||
Measurement of cartridge volume
The volume of blood present in the transparent region of the cartridge informs the theoretical limit of detection, and should be at least as great as that contained in a manually prepared smear. The total volume of blood in the cartridge was determined by mass. As shown in Fig. 5, the mass of the cartridge was measured as a function of time as the cartridge was dipped into a DI water filled container. Correlating the transition between the paper region and the non-paper, transparent region via visual observation proved error-prone. However, when the mass was plotted as a function of the square root of time, a clear transition between the paper filled region and the transparent chamber was observed, as would be expected based on the Washburn equation:| L2 = γDt/4μ |
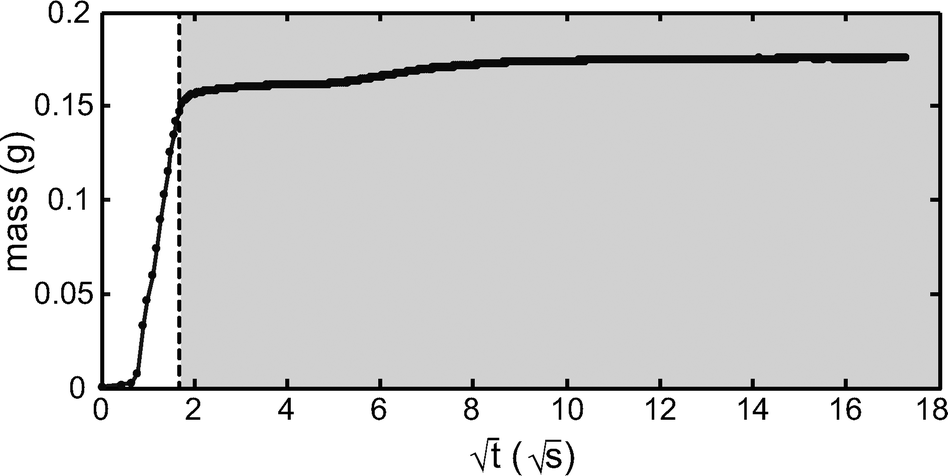 | ||
| Fig. 5 Mass as a function of time during the filling of a cartridge with DI water, which was measured to determine blood volume in the transparent region and to compare that with the volume of blood used in traditional smear preparation techniques. The area to the right of the dotted line indicates the volume outside the paper (the transparent region). Though pore size in the paper was not determined, the fluid behavior inside the paper shows general agreement with the Washburn equation, which is sufficient for differentiating between the paper and non-paper transparent regions. The mass at the far right data point is 0.1755 g, and the mass at the dotted line is 0.1534 g, indicating a transparent region volume of 22.1 microliters. This experiment was repeated 10 times, with a mean volume of 21.3 ± 2.1 μL. | ||
Once the total volume of blood in the cartridge was determined, this value was then further refined to determine the approximate volume of blood in the “thin region” of the cartridge and the “thick region” of the cartridge, and to determine what fraction was only plasma. Qualitatively, the image sequence in Fig. 2 shows a thickness gradient across the cartridge. To quantify the volume present in the thick vs. the thin region, we measured the background fluorescence intensity, which correlates with thickness, as a function of x and y position, and noted the cell thickness in each measured section as one of three types: 1) plasma (no RBC present), 2) thin smear (monolayer/bilayer of RBC) and 3) thick smear (more than two cell layers). The results are shown in Fig. 6, which indicates the relative thickness, and the measured volumes for each region. To determine the volumes of each region: first, the average background fluorescence intensities were measured for each field of view containing a particular thickness region type, for each x and y position shown in Fig. 6A. Then, for each region type, these measured background intensities were summed together. Finally, the fraction of this sum for each region type was normalized by the total transparent region volume (mass) determined utilizing Fig. 5. The thick smear region contained 11.9 μL, the thin smear region contained 4.7 μL, and plasma constituted 4.7 μL. The presence of plasma may be useful in non-microscopy based multiplexed assays, or in a stand-alone system for the filtering of whole blood. For comparison, the WHO standard for manually preparing blood films for malaria microscopy requires 6 μL of blood in the thick smear, and 2 μL of blood in the thin smear.18
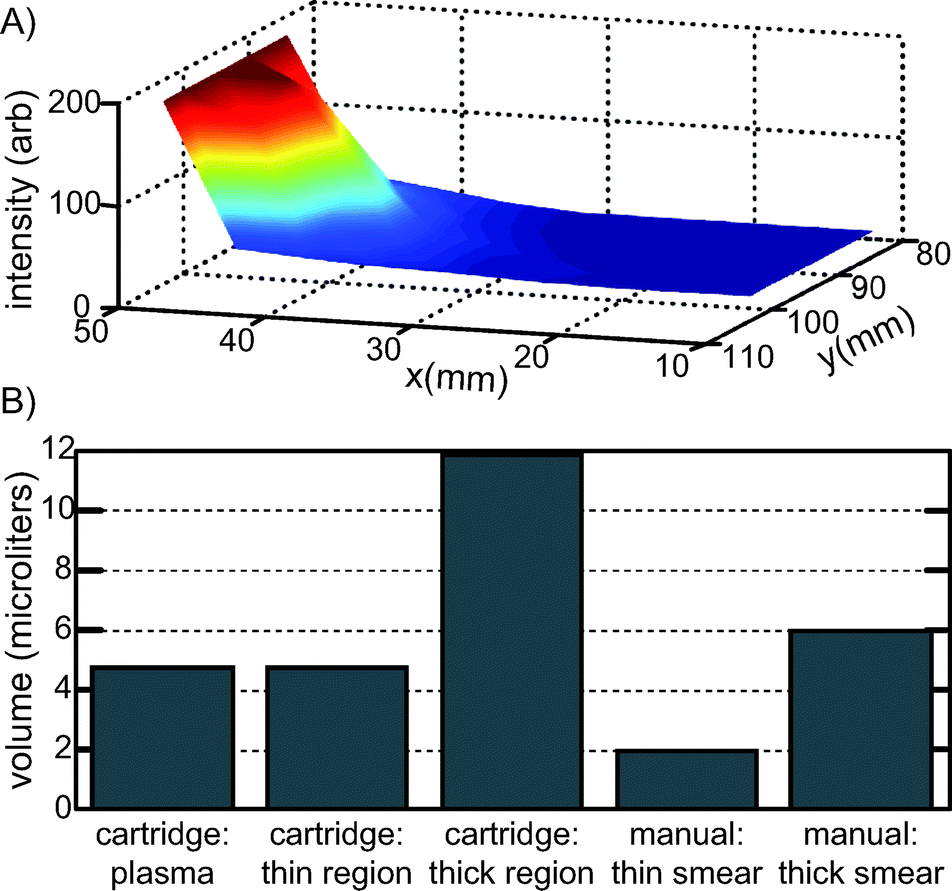 | ||
| Fig. 6 A) Relative thickness of the paper-free, transparent region of the cartridge, as a function of x and y position, determined by background fluorescence intensity for a single cartridge. B) Cell layer volumes in the cartridge, where cell layers are defined as 1) plasma (no RBC present), 2) thin region (monolayer/bilayer of RBC) and 3) thick region (more than two cell layers) and as compared to typical, manually prepared smears.18 For each intensity data point in Fig. 6A, the region type was also identified (plasma, thin, thick) and the summed intensity of for each of the three regions was normalized to the total volume of the transparent region as measured in Fig. 5. | ||
Of additional note is that relatively few stain artifacts were present in the images we analyzed. Vink et al. reported stain artifacts from residual AO, which decrease specificity, as being a significant factor in the ultimate limit of detection of their system.32 We suspect the paper acts as a filter and limits the number of stain artifacts.
Automated image analysis
The limit of detection for a Plasmodium test via microscopy is principally limited by the number of fields of view that a microscopist can examine. For this reason, it is highly desirable to automate the image acquisition and analysis process. We sought to demonstrate that the staining process enabled by the cartridge was amenable to automated microscopy by developing a simple image recognition algorithm and demonstrating that images obtained from our cartridge could be successfully analyzed by such an algorithm.Using the algorithm described in Methods and ESI,† we counted parasites and RBC in 32 images from an undiluted sample of P. falciparum culture. An example image is shown in Fig. 7A, with parasites and RBC indicated. Histograms of parasites per image and RBC per image are shown in Fig. 7B. A Poisson distribution was fit to these histograms, yielding a parasite count per image of λ = 4.97 with a 95% confidence interval of [4.2, 5.7]. The RBC count per image has λ = 123.6, with a 95% confidence interval of [119.7, 127.5]. This indicates a parasitemia level between 3.5% and 4.5%. The blood this sample came from was analyzed by independent scientists at the Seattle Biomedical Research Institute utilizing Giemsa staining, the reference standard in malaria microscopy diagnosis,10 earlier in the same day (after which it was immediately refrigerated) and determined to have a 4% parasitemia.
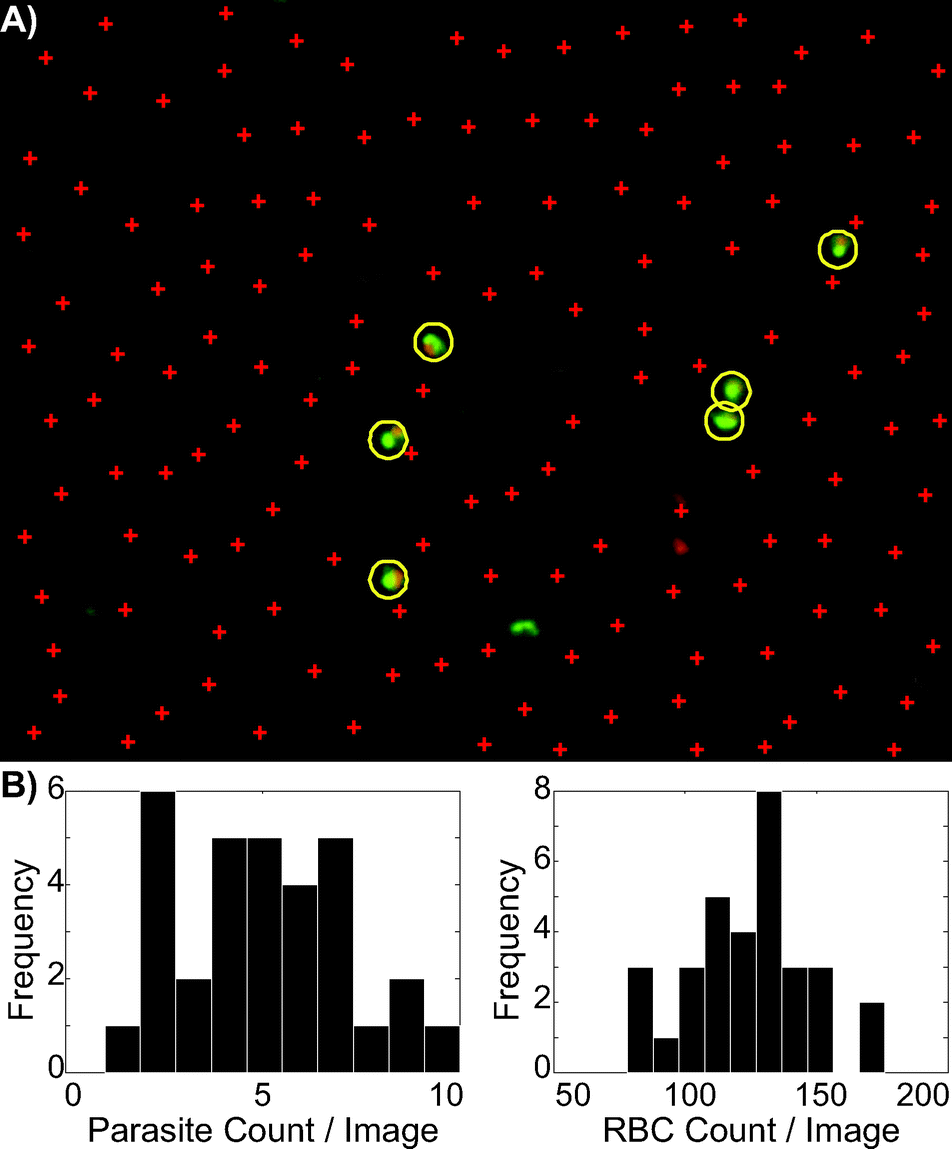 | ||
| Fig. 7 A) Typical results from the image processing algorithm. Circles and plusses in the image were placed by MATLAB over suspected parasites and RBC, respectively. Slight under-counting relative to human inspection of RBC is observed. B) Histograms represent a set of 32 images, showing the parasites counted (left), and the RBC counted (right). The complete code utilized to produce this image, along with a sample image, is provided in ESI. | ||
The simple image analysis script we presented demonstrated feasibility of the system for eventual integration into an automated microscopy platform. As the cartridge performed similarly to existing reference standards in both manual counting and automated counting by image analysis, basic feasibility has been demonstrated, and further research to determine an actual limit of detection for the integrated method in a clinical setting is warranted.
Conclusion
An ideal automated blood staining cartridge for malaria detection via microscopy should be: easy to use, fast, inexpensive, optically transparent, and amenable to automated microscopy. This work demonstrates a device with all of these characteristics for the production of thin and thick smears of AO stained Plasmodium falciparum. Future work will include: utilizing the cartridge in a fully automated microscopy system, improving image processing to work on thick smears, testing on relevant parasitemia down to <100 parasites μl−1, and testing on field samples with additional species of Plasmodium to determine its utility in species identification.Acknowledgements
The authors would like to thank: Bill and Melinda Gates for their sponsorship through Global Good; David Bell of Intellectual Ventures Laboratory, for comments on the manuscript; Jen Hume, Will Betz, and Mark Kennedy at Seattle Biomedical Research Institute for supplying P. falciparum culture and whole blood; and, Jim Roecker, Dan Connors and Katie Miller of Intellectual Ventures Laboratory for design of a microscope adapter ring, LabVIEW programming, and photography, respectively.References
- S. Byrnes, G. Thiessen and E. Fu, Bioanalysis, 2013, 5, 2821–2836 CrossRef CAS PubMed.
- A. K. Yetisen, M. S. Akram and C. R. Lowe, Lab Chip, 2013, 13, 2210–2251 RSC.
- E. Fu, T. Liang, P. Spicar-Mihalic, J. Houghtaling, S. Ramachandran and P. Yager, Anal. Chem., 2012, 84, 4574–4579 CrossRef CAS PubMed.
- E. Fu, S. A. Ramsey, P. Kauffman, B. Lutz and P. Yager, Microfluid. Nanofluid., 2011, 10, 29–35 CrossRef CAS PubMed.
- A. W. Martinez, S. T. Phillips, G. M. Whitesides and E. Carrilho, Anal. Chem., 2009, 82, 3–10 CrossRef PubMed.
- H. Liu and R. M. Crooks, J. Am. Chem. Soc., 2011, 133, 17564–17566 CrossRef CAS PubMed.
- A. V. Govindarajan, S. Ramachandran, G. D. Vigil, P. Yager and K. F. Böhringer, Lab Chip, 2012, 12, 174 RSC.
- X. Mao and T. J. Huang, Lab Chip, 2012, 12, 1412 RSC.
- L. Li, M. A. Karymov, K. P. Nichols and R. F. Ismagilov, Langmuir, 2010, 26, 12465–12471 CrossRef CAS PubMed.
- W. H. Organization, World malaria report: 2013, World Health Organization, 2013 Search PubMed.
- N. J. White, Clin. Infect. Dis., 2008, 46, 172–173 CrossRef CAS PubMed.
- The malERA Consultative Group on Diagnoses and Diagnostics, PLoS Med., 2011, 8, e1000396 Search PubMed.
- World Health Organization, Special Programme for Research and Training in Tropical Diseases, Foundation for Innovative New Diagnostics, and Centers for Disease Control (U.S.), Malaria rapid diagnostic test performance results of WHO product testing of malaria RDTs: Round 4, World Health Organization on behalf of the Special Programme for Research and Training in Tropical Diseases, Geneva, Switzerland, 2012 Search PubMed.
- C. K. Murray, R. A. Gasser, A. J. Magill and R. S. Miller, Clin. Microbiol. Rev., 2008, 21, 97–110 CrossRef PubMed.
- M. Mayxay, S. Pukrittayakamee, P. N. Newton and N. J. White, Trends Parasitol., 2004, 20, 233–240 CrossRef PubMed.
- H. Hopkins, I. J. Gonzalez, S. D. Polley, P. Angutoko, J. Ategeka, C. Asiimwe, B. Agaba, D. J. Kyabayinze, C. J. Sutherland, M. D. Perkins and D. Bell, J. Infect. Dis., 2013, 208, 645–652 CrossRef CAS PubMed.
- A. Moody, Clin. Microbiol. Rev., 2002, 15, 66–78 CrossRef CAS.
- Who Regional Office for the Western Pacific, Malaria Microscopy Quality Assurance Manual: Version 1, World Health Organization, 2009 Search PubMed.
- J. Nankabirwa, D. Zurovac, J. N. Njogu, J. B. Rwakimari, H. Counihan, R. W. Snow and J. K. Tibenderana, Malar. J., 2009, 8, 66 CrossRef PubMed.
- D. N. Durrheim, P. J. Becker, K. Billinghurst and A. Brink, SAMJ, 1997, 87, 609–611 Search PubMed.
- R. E. Coleman, N. Maneechai, N. Rachaphaew, C. Kumpitak, R. S. Miller, V. Soyseng, K. Thimasarn and J. Sattabongkot, Am. J. Trop. Med. Hyg., 2002, 67, 141–144 Search PubMed.
- W. O'Meara, F. McKenzie, A. Magill, J. Forney, B. Permpanich, C. Lucas, R. Gasser Jr and C. Wongsrichanalai, Am. J. Trop. Med. Hyg., 2005, 73, 593 Search PubMed.
- L. Dini and J. Frean, Trans. R. Soc. Trop. Med. Hyg., 2003, 97, 675–677 CrossRef.
- C. Wongsrichanalai, M. J. Barcus, S. Muth, A. Sutamihardja and W. H. Wernsdorfer, Am. J. Trop. Med. Hyg., 2007, 77, 119–127 Search PubMed.
- World Health Organization, Basic malaria microscopy., World Health Organization, Geneva, 2010 Search PubMed.
- D. C. Warhurst and J. E. Williams, J. Clin. Pathol., 1996, 49, 533–538 CrossRef CAS.
- F. Gay, B. Traoré, J. Zanoni, M. Danis and A. Fribourg-Blanc, Trans. R. Soc. Trop. Med. Hyg., 1996, 90, 516–518 CrossRef CAS.
- S. Cho, S. Kim, Y. Kim and Y. Park, Trends Biotechnol., 2012, 30, 71–79 CrossRef CAS PubMed.
- D. Lenz, P. G. Kremsner, B. Lell, B. Biallas, M. Boettcher, B. Mordmüller and A. A. Adegnika, Malar. J., 2011, 10, 194 CrossRef PubMed.
- J. Keiser, J. Utzinger, Z. Premji, Y. Yamagata and B. H. Singer, Ann. Trop. Med. Parasitol., 2002, 96, 643–654 CrossRef CAS PubMed.
- W. R. Prescott, R. G. Jordan, M. P. Grobusch, V. M. Chinchilli, I. Kleinschmidt, J. Borovsky, M. Plaskow, M. Torrez, M. Mico and C. Schwabe, Malar. J., 2012, 11, 155 CrossRef PubMed.
- J. P. Vink, M. Laubscher, R. Vlutters, K. Silamut, R. J. Maude, M. U. Hasan and G. De Haan, J. Microsc., 2013, 250, 166–178 CrossRef CAS PubMed.
- S. Kaewkamnerd, C. Uthaipibull, A. Intarapanich, M. Pannarut, S. Chaotheing and S. Tongsima, BMC Bioinf., 2012, 13, S18 CrossRef PubMed.
- S. W. S. Sio, W. Sun, S. Kumar, W. Z. Bin, S. S. Tan, S. H. Ong, H. Kikuchi, Y. Oshima and K. S. W. Tan, J. Microbiol. Methods, 2007, 68, 11–18 CrossRef CAS PubMed.
- Y. Purwar, S. L. Shah, G. Clarke, A. Almugairi and A. Muehlenbachs, Malar. J., 2011, 10, 364 CrossRef PubMed.
- M. Al-Tamimi, W. Shen, R. Zeineddine, H. Tran and G. Garnier, Anal. Chem., 2012, 84, 1661–1668 CrossRef CAS PubMed.
- I. Ljungström, K. Moll, H. Perlmann, A. Scherf and M. Wahlgren, Methods in malaria research, Malaria Research and Reference Reagent Resource Center, 2008 Search PubMed.
Footnote |
| † Electronic supplementary information (ESI) available. See DOI: 10.1039/c4lc00293h |
| This journal is © The Royal Society of Chemistry 2014 |