 Open Access Article
 This Open Access Article is licensed under a
 Creative Commons Attribution 3.0 Unported Licence
Integrating microfluidic generation, handling and analysis of biomimetic giant unilamellar vesicles†
D. J.
Paterson
,
J.
Reboud
,
R.
Wilson
,
M.
Tassieri
and
J. M.
Cooper
*
Division of Biomedical Engineering, School of Engineering, University of Glasgow, Rankine Building, 78 Oakfield Avenue, Glasgow, G12 8LT, UK. E-mail: Jon.Cooper@glasgow.ac.uk
First published on 4th April 2014
Abstract
The key roles played by phospholipids in many cellular processes, has led to the development of model systems, to explore both lipid–lipid and lipid–peptide interactions. Biomimetic giant unilamellar vesicles represent close facsimiles of in vivo cellular membranes, although currently their widespread use in research is hindered by difficulties involving their integration into high-throughput techniques, for exploring membrane biology intensively in situ. This paper presents an integrated microfluidic device for the production, manipulation and high-throughput analysis of giant unilamellar vesicles. Its utility is demonstrated by exploring the lipid interaction dynamics of the pore-forming antimicrobial peptide melittin, assessed through the release of fluorescent dyes from within biomimetic vesicles, with membrane compositions similar to mammalian plasma membranes.
Introduction
Membrane research has undergone a significant shift in focus, and membranes are now recognised as active mediators of several key cellular processes, including membrane signal transduction;1,2 membrane-protein structure and function3,4 and vesicle trafficking.5,6 Indeed the diverse biological functions assigned to lipids have led to a recent increase of interest in membrane biology, although experimental analysis of lipid–lipid and lipid–peptide interactions remains challenging.7,8 Currently several different lipidic platforms are available for investigation of membrane interactions, including small, large and giant unilamellar vesicles (SUV, LUV, and GUVs respectively) as well as supported lipid bilayers (SLBs).9–11 GUVs are one of the most popular platforms for studying lipid–lipid and lipid–protein interactions,12–14 offering high biological relevance and convenience of use. They are of similar size (10–20 μm) and membrane curvatures to typically studied mammalian cells like erythrocytes, and are composed of single unsupported lipid bilayers.11,15 Moreover, GUV lipid composition can be pre-defined to build close facsimiles of in vivo cellular membranes, creating biomimetic vesicles. Their size allows for the use of conventional fluorescent microscopy techniques, enabling lipid–lipid and lipid–protein interactions to be readily visualised.Conventional GUV experiments require each vesicle to be individually addressed within the experimental system, typically using micromanipulated micropipettes. These methods are known collectively as “single GUV techniques”, and have recently been used to investigate the lipid–peptide interactions occurring during cellular apoptosis16 and pore-formation by antimicrobial peptides.17,18 However these techniques suffer from specific experimental limitations, in that they are intrinsically low-throughput (collecting data from one GUV at a time), and allow only limited control over membrane exposure to substances. In this paper, we build upon established microfluidic technologies to develop a novel platform combining high-throughput fluorescence microscopy analysis with precise control over membrane exposure to solutes. Importantly, this platform allows on-chip production of GUVs, together with their manipulation and analysis at high-throughput, providing the potential to widen the accessibility of GUVs as membrane models for the study of lipid–lipid and lipid–protein interactions. In contrast to existing single GUV techniques, the new method does not require that the operator has technical expertise in GUV handling. On-chip electroformation was used to create mammalian biomimetic vesicles (mGUVs) with a membrane composition representative of typical mammalian membranes, enclosing fluorescently tagged dextrans. The mGUVs are positioned using laminar flow into trap microarrays, which have previously been used for single cell analysis19 (Fig. 1). We demonstrate the efficacy of the proposed platform, by gathering biologically relevant dye-leakage data, triggered by the membrane interactions of the pore-forming antimicrobial peptide (AMP) melittin.20,21
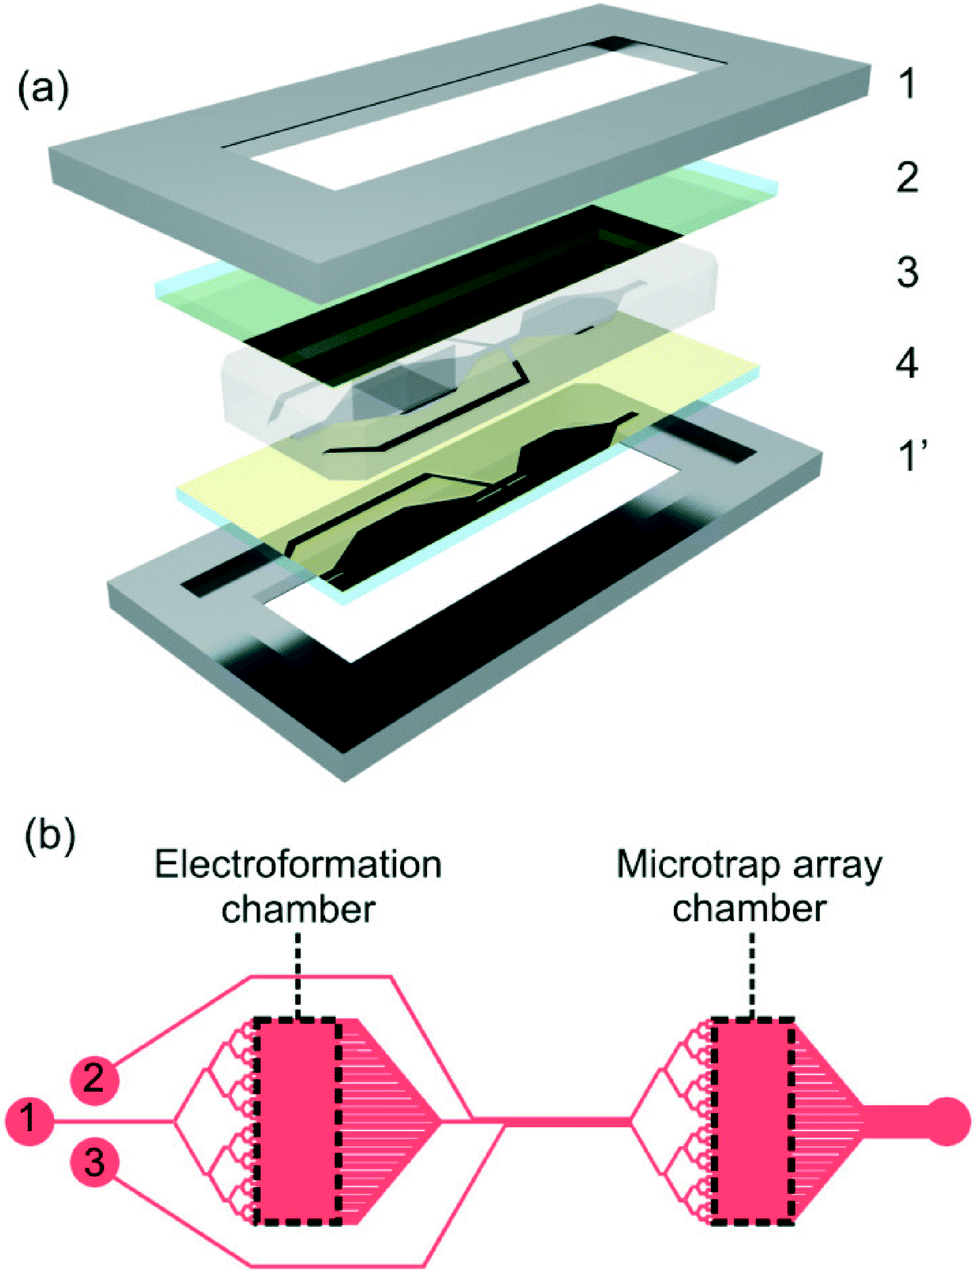 | ||
| Fig. 1 (a) Exploded 3D diagram of the device, showing (1) clamp; (2) lipid-coated ITO-coated slide; (3) PDMS device and (4) ITO-coated slide, arranged into a glass-PDMS-glass sandwich. (b) Plan view of chip design, showing the electroformation and microtrap analysis chambers, connected by microfluidic channels (1), also depicted are the (2) wash and (3) peptide channels, as well as a collective outlet for waste (4). Dashed lines on the electroformation chamber were excised from the PDMS device, in order to carry out the electroformation procedure. | ||
Materials and methods
Device microfabrication
The microfluidic device was manufactured as a 2 mm thick PDMS cast, from a silicon/SU8-3050 master mould, using standard contact photolithographic techniques. Briefly, an MA6 contact aligner system (SUSS Microtech Ltd., Coventry, UK) was used to pattern the inverse device design onto a 50 μm thick layer of SU8-3050, spin-coated onto a silicon wafer. Non-crosslinked photoresist was removed by development in Microposit EC solvent, and the resultant master mould silanised using 1H,1H,2H,2H-perfluorooctyl-trichlorosilane (Sigma-Aldrich). PDMS devices were cast and released from this master mould.Electroformation of GUVs
mGUVs were manufactured on-chip using established electroformation protocols,22,23 implemented within the microfluidic device (see ESI†). The lipid composition DOPC![[thin space (1/6-em)]](https://www.rsc.org/images/entities/char_2009.gif) :DPPC:cholesterol (35:35:30 mol%) was selected to represent a typical mammalian membrane, and the mixture was doped with 0.05 mol% of DPPE-rhodamine lissamine B and 0.1 mol% cholesterol-BODIPY (DPPE-rhodamine is a fluid-phase membrane marker, while cholesterol-BODIPY localises in the gel-phase),24,25 allowing lipid domain visualisation by fluorescent microscopy, Fig. 2.
:DPPC:cholesterol (35:35:30 mol%) was selected to represent a typical mammalian membrane, and the mixture was doped with 0.05 mol% of DPPE-rhodamine lissamine B and 0.1 mol% cholesterol-BODIPY (DPPE-rhodamine is a fluid-phase membrane marker, while cholesterol-BODIPY localises in the gel-phase),24,25 allowing lipid domain visualisation by fluorescent microscopy, Fig. 2.
 | ||
| Fig. 2 (a) Confocal image of mGUV cross-section (dextran-AlexaFluor488 excluded from solution, to facilitate domain visualisation). Distinct lipid domains of liquid-disordered DOPC (1 – red) and liquid-ordered DPPC/cholesterol (2 – green) are visible. The slight mismatch seen in domain diameters is due to differences in mechanical properties between liquid-ordered and -disordered phases. Scale bar represents 5 μm. (b) SEM image of trap microarray region. Scale bar represents 50 μm. (c) mGUVs within the microtrap array, visualised using enclosed dextran-AlexaFluor488. Scale bar represents 50 μm. | ||
Dye leakage experiment
The sugar density gradient between vesicle interior (sucrose) and exterior (glucose) solutions, causes vesicles to settle to the bottom of the electroformation chamber, facilitating visualisation and their loading into the microarray traps. Vesicles were transferred into the microtrap chamber, by flowing an iso-osmotic wash solution consisting of 100 mM glucose, 5.0 mM HEPES (pH adjusted to 7.4 using KOH), through the flow channel (Fig. 1, channel 1). Extraneous dye was removed from the solution by flowing wash solution through the wash channel (Fig. 1, channel 2). This resulted in mGUVs with red/green stained membranes, enclosing fluorescently tagged dextran, gently pinned against the PDMS trap pillars by continuous laminar flow (Fig. 2c). Prior to exposure to AMP, vesicle unilamellarity was assessed using a Zeiss LDM 5 Live confocal microscope (Carl Zeiss Ltd., Cambridge, UK). A wash solution doped with 1.0 or 5.0 μM melittin was then flowed over the entrapped mGUVs (Fig. 1, channel 3). Fluorescent data was captured at 0.25 Hz, using the confocal microscope, with the pinhole set to collect images encompassing the entire channel height. Data was corrected for photo-bleaching, and the fluorescence intensity normalised, to aid comparison between different vesicles.Results
On-chip electroformation of mGUVs
On-chip vesicles were comparable to those manufactured by similar off-chip procedures, i.e. similar in size, unilamellar in nature and displaying lateral lipid heterogeneity.26 The lipid composition chosen resulted in the formation of distinct domains, based on preferential lipid aggregation (Fig. 2), similar to the lipid rafts occurring in vivo;27 DPPC/cholesterol formed liquid-ordered domains, visualised using BODIPY-tagged cholesterol (green), and DOPC formed liquid-disordered domains, visualised using DPPE-rhodamine (red). On-chip electroformation produced higher purity products than off-chip, with noticeably reduced amounts of non-vesicular lipid debris, which can obfuscate experimental analysis. Vesicle yield was reduced to ca. 56% of that seen in off-chip procedures, however it should be noted that the number of GUVs produced was always several orders of magnitude greater than the number of vesicles trapped. A shift in the size distribution profile of trapped vesicles towards larger diameters demonstrates the size exclusion (filter) properties of the device (see ESI†).Dye-leakage
Conventional dye-leakage experiments require the removal of extraneous dye, by either repeated dilution28 and/or size-exclusion chromatography,28,29 reducing GUV yield. By producing vesicles on-chip and containing the dye-filled mGUVs within PDMS microtrap arrays, we were able to exploit the exquisite control over fluid flow enabled by microfluidics, allowing manipulations including washing steps and exposure to small aliquots of ligands, to be easily integrated into experimental protocols. The geometry of the microfluidic channels and microarray traps act as a size-exclusion filter, resulting in a more homogeneous GUV size distribution. The desired size range of vesicles can be selected in the chip design – in this paper we trapped mGUVs ca. 10–40 μm in diameter, comparable to typical mammalian cells. As a result, robust statistical data can be acquired from single experiments, significantly increasing research throughput. Representative dye-leakage data is presented in Fig. 3, where leakage was assessed from entrapped mGUVs, after exposure to 5 (Fig. 3, top) and 1 (Fig. 3, bottom) μM of melittin. The data showed distinct grouping into three clearly separated modes of leakage, which could be seen independently of the flow rate. The dextrans also displayed faster leakage kinetics in response to higher levels of the AMP. | ||
| Fig. 3 Dye-leakage traces recorded from a single experiment, with each trace representing averaged leakage data from at least 4 vesicles, and error bars showing the standard deviation; (top) leakage kinetics for dye-enclosing mGUVs, with an average diameter of 15.97 ± 4.69 μm, exposed to 5 μM melittin. The data show clear grouping of the leakage kinetics into three distinct modes. (Inset) Series of fluorescent pictures, showing the escape of 3 kDa dextran-AlexaFluor488, induced by the AMP melittin. Numbers depict time (s) since onset of leak, and microarray trap outlined in white, for the first picture in series. Scale bar represents 10 μm. (Bottom) Data recorded from entrapped mGUVs, with an average diameter of 19.13 ± 7.61 μm, after exposure to 1 μM AMP. Data shows the same grouping of the data seen in Fig. 3 (top), but shifted to slower leakage kinetics, in response to exposure to lower levels of melittin. | ||
Discussion
The lower GUV yield of on-chip electroformation can be explained by consideration of the fluid flows experienced by the vesicles during electroformation. Removal of GUVs from off-chip electroformation chambers involved bulk flow of the surrounding solution, while on-chip vesicles experienced reduced flow velocities. This resulted in reduced detachment of vesicles from the ITO-slide, but also in lower amounts of unwanted detached non-vesicular lipid debris, producing a purer electroformation product. The lower yield of on-chip electroformation is not significant experimentally, as the procedure produces many orders of magnitude more GUVs than are analysed. However the reduced lipidic debris provides a significant increase in preparation quality. Exposure of mGUVs to AMP induced leakage of fluorescently-tagged dextrans across the lipid membrane for both concentrations of melittin used. The data gathered displayed grouping into distinct kinetic “modes” of leaking. The exact nature of the different mechanisms of leakage, arising as a function of the lipid–peptide interactions, will be the subject of further investigations. It is worthwhile noting that, under the laminar flow conditions used (Re ~ 0.0003), AMP delivery is diffusion limited, and as such, exposure to higher concentrations of melittin produced faster leakage kinetics. Care should be taken when comparing these results to those obtained using classical single GUV methods, due to the differing nature of vesicle exposure to AMP. This method uses continuous exposure to low levels of peptide, whereas most single GUV methods, feature acute exposures to higher levels of peptide.Conclusions
Integrated mGUV manufacture, microfluidic manipulation and analysis within a microfluidic device was demonstrated by the collection of reproducible, high-throughput dye leakage data. The device can easily be adapted for other applications; e.g. investigation of in vitro protein expression in microdroplets30 or lipid dynamic studies.27 Integrated microfluidic GUV analysis possesses several inherent advantages over conventional experimental techniques, including reducing vesicle strain and precise control over vesicle exposure to solutes. The method enables washing steps to be easily incorporated into experimental protocols. Compared to conventional single GUV techniques, integrated microfluidic analysis is of significantly higher throughput, enabling large data sets to be collected efficiently. Other benefits include requiring less specialised operator training and equipment. Typical dye-leakage experiments report data from <10 individual vesicles,31,32 while the application of microfluidic technology allows the simultaneous gathering of data, from over 80 GUVs in one experiment (see ESI†). This ca. ten-fold increase in throughput generates robust data sets, allowing statistical techniques to be applied to membrane interactions, adding an important analytical method to the membrane interaction toolbox. The clearly defined leakage kinetic families indicate the occurrence of different lipid–AMP interactions within the membrane, leading to three distinct “modes” of leaking.Acknowledgements
Research funded by the EPSRC (Doctoral Training Centre: EP/F500424/1, Proxomics: EP/I017887/1 and Frontiers: EP/K038885/1). J.C. acknowledges support from a personal EPSRC fellowship (EP/K027611/1). M.T. acknowledges support from the Royal Academy of Engineering/EPSRC Fellowship, and J.R. acknowledges the Glasgow University Lord Kelvin and Adam Smith Research Fellowship. The authors thank Dr. Alasdair Clarke (University of Glasgow) for SEM images and graphic art production, and the James Watt Nanofabrication Centre (Glasgow, UK) for help with device fabrication.Notes and references
- P. S. Kabouridis, J. Janzen, A. L. Magee and S. C. Ley, Eur. J. Immunol., 2000, 30, 954–963 CrossRef CAS.
- K. Simons and D. Toomre, Nat. Rev. Mol. Cell Biol., 2000, 1, 31–42 CrossRef CAS PubMed.
- W. Dowhan and M. Bogdanov, Biochem. Soc. Trans., 2011, 39, 767–774 CAS.
- E. Perozo, D. M. Cortes, P. Sompornpisut, A. Kloda and B. Martinac, Nature, 2002, 418(6901), 942–948 CrossRef CAS PubMed.
- J. Johansen, V. Ramanathan and C. T. Beh, Cellular Logistics 2, 2012, 2(3), 151–160 CrossRef PubMed.
- J. Rohrbough and K. Broadie, Nat. Rev. Neurosci., 2005, 6, 139–150 CrossRef CAS PubMed.
- S. Galdiero, A. Falanga, M. Cantisani, M. Vitiello, G. Morelli and M. Galdiero, Int. J. Mol. Sci., 2013, 14, 18758–18789 CrossRef CAS PubMed.
- A. M. Seddon, P. Curnow and P. J. Booth, Biochim. Biophys. Acta, Gen. Subj., 2004, 1666, 105–117 CrossRef CAS PubMed.
- F. M. Menger and M. Angelova, Acc. Chem. Res., 1998, 31, 789–797 CrossRef CAS.
- E. T. Catellana and P. S. Cremer, Surf. Sci. Rep., 2009, 61(10), 429–444 CrossRef PubMed.
- Y. H. M. Chan and S. G. Boxer, Curr. Opin. Chem. Biol., 2007, 11(6), 581–587 CrossRef CAS PubMed.
- Y. Tamba and M. Yamazaki, Biochemistry, 2005, 44, 15823–15833 CrossRef CAS PubMed.
- S. A. Sanchez, M. A. Tricerri, G. Ossato and E. Gratton, Biochim. Biophys. Acta, Gen. Subj., 2010, 1798, 1399–1408 CrossRef CAS PubMed.
- G. Van den Bogaart, K. Meyenberg, H. J. Risselada, H. Amin, K. I. Willig, B. E. Hubrich, M. Dier, S. W. Hell and H. Grubmu, Nature, 2011, 79, 552–555 CrossRef PubMed.
- O. Wesolowska, K. Michalak, J. Maniewska and A. B. Hendrich, Acta Biochim. Pol., 2009, 1, 33–39 Search PubMed.
- O. Jalmar, A. J. Garcia-Saez, L. Berland, F. Gonzalvez and P. X. Petit, Cell Death Dis., 2010, 1, 1–9 CrossRef PubMed.
- M. T. Lee, W. C. Hung, F. Y. Chen and H. W. Huang, Proc. Natl. Acad. Sci. U. S. A., 2008, 105(13), 5087–5092 CrossRef CAS PubMed.
- Y. Tamba, S. Ohba, M. Kubota, H. Yoshioka, H. Yoshioka and M. Yamazaki, Biophys. J., 2007, 92, 3178–3194 CrossRef CAS PubMed.
- D. Wlodkowic, S. Faley, M. Zagnoni, J. P. Wikswo and J. M. Cooper, Anal. Chem., 2009, 81(13), 5517–5523 CrossRef CAS PubMed.
- C. E. Dempsey, Biochimica et Biophysica Acta (BBA) – Reviews on Biomembranes, 1990, 1031(2), 143–161 CrossRef CAS.
- H. Raghuraman and A. Chattopadhyay, Biosci. Rep., 2007, 27, 189–223 CrossRef CAS PubMed.
- M. Angelova, S. Soleau, P. Meleard, J. F. Faucon and P. Bothorel, Prog. Colloid Polym. Sci., 1992, 89, 127–131 CAS.
- D. J. Estes and M. Mayer, Colloids Surf., B, 2005, 42(2), 115–123 CrossRef CAS PubMed.
- F. S. Ariola, Z. Li, C. Cornejo, R. Bittman and A. A. Heikal, Biophys. J., 2007, 9(1), 2696–2708 Search PubMed.
- T. Baumgart, S. T. Hess and M. W. Webb, Nature, 2003, 425, 821–824 CrossRef CAS PubMed.
- C. Dietrich, L. A. Bagtolli, Z. N. Volvyk, N. L. Thompson, M. Levi, K. Jacobsen and E. Gratton, Biophys. J., 2001, 80, 1417–1428 CrossRef CAS.
- K. Jacobsen, O. G. Mourtisen and R. G. W. Anderson, Nat. Cell Biol., 2007, 9, 7–14 CrossRef PubMed.
- E. E. Ambroggio, F. Separovic, J. F. Bowie, G. D. Fidelio and L. A. Bagatolli, Biophys. J., 2005, 89(3), 1874–1881 CrossRef CAS PubMed.
- L. Yang, V. D. Gordon, D. R. Trinkle, N. W. Schimdt, M. A. Davis, C. DeVries, A. Som, J. E. Cronan Jr, G. N. Tew and G. C. L. Wong, Proc. Natl. Acad. Sci. U. S. A., 2008, 105(52), 20595–20600 CrossRef CAS PubMed.
- M. Chanasakulnivom, C. Martino, D. Paterson, L. Horsfall, S. Rosser and J. M. Cooper, Analyst, 2012, 137, 2939–2943 RSC.
- T. Robinson, P. Kuhn, K. Eyer and P. S. Dittrich, 16th International Conference on Miniaturised Systems for Chemistry and Life Sciences, 2012 Search PubMed.
- Y. Tamba and M. Yamazaki, Biochemistry, 2005, 44(48), 15823–15833 CrossRef CAS PubMed.
Footnote |
| † Electronic supplementary information (ESI) available. See DOI: 10.1039/c4lc00199k |
| This journal is © The Royal Society of Chemistry 2014 |