 Open Access Article
 This Open Access Article is licensed under a Creative Commons Attribution-Non Commercial 3.0 Unported Licence
Droplet optofluidic imaging for λ-bacteriophage detection via co-culture with host cell Escherichia coli†
J. Q.
Yu
a,
W.
Huang
a,
L. K.
Chin
a,
L.
Lei
a,
Z. P.
Lin
a,
W.
Ser
a,
H.
Chen
b,
T. C.
Ayi
c,
P. H.
Yap
c,
C. H.
Chen
d and
A. Q.
Liu
*a
aSchool of Electrical & Electronic Engineering, Nanyang Technological University, 50 Nanyang Avenue, Singapore 639798. E-mail: eaqliu@ntu.edu.sg
bSchool of Physical & Mathematical Sciences, Nanyang Technological University, 21 Nanyang Link, Singapore 637371
cDefence Medical & Environmental Institute, DSO National Laboratories, 27 Medical Drive, Singapore 117510
dDepartment of Biomedical Engineering, National University of Singapore, 9 Engineering Drive 1, Singapore 117575
First published on 12th June 2014
Abstract
Bacteriophages are considered as attractive indicators for determining drinking water quality since its concentration is strongly correlated with virus concentrations in water samples. Previously, bacteriophage detection was based on a plague assay that required a complicated labelling technique and a time-consuming culture assay. Here, for the first time, a label-free bacteriophage detection is reported by using droplet optofluidic imaging, which uses host-cell-containing microdroplets as reaction carriers for bacteriophage infection due to a higher contact ratio. The optofluidic imaging is based on the effective refractive index changes in the microdroplet correlated with the growth rate of the infected host cells, which is highly sensitive, i.e. can detect one E. coli cell. The droplet optofluidic system is not only used in drinking water quality monitoring, but also has high potential applications for pathogenic bacteria detection in clinical diagnosis and food industry.
Introduction
To reduce human health risks from viral infections, drinking water sources have to be constantly monitored to avoid viral contamination.1 Bacteriophage is a type of virus that infects bacterial cells. They have long been considered as attractive indicators for determining drinking water quality since the concentration of bacteriophages is strongly correlated with virus concentrations in water samples.2,3 Furthermore, the detection of bacteriophage existence in an experimental sample is also important since the infection of bacterial cultures by bacteriophages may lead to the loss of a desired product and the spreading of bacteriophages throughout an entire laboratory.4 The bacteriophage detection methods start with filtration methods, whereby the phage solution and a suitable host solution are mixed, filtered through membrane filters and then incubated.5 Then, a pipette method for counting bacteriophage plague has been developed.6 The plague assay for bacteriophage detection is a widely used approach in determining the quantity of the virus.5 These methods require a long period of processing as well as an accurate pre-estimation of the sample concentration. Molecular biological assay and polymerase chain reaction (PCR) methods, which include long processing time for culture assay and complicated pre-concentration step before target detection, are also achieved.7 Recently, researchers developed DNA chips and surface modified quartz crystal microbalances, which have higher efficiency and sensitivity.8,9 However, these techniques can only detect targeted bacteriophage. It remains a challenge to realize sensitive and low-cost detection techniques for various types of bacteriophages of low concentration in drinking water samples.Optofluidics is a burgeoning technology that employs the synergy of microfluidics and optics to innovate highly versatile devices and integrated systems. Several sophisticated optofluidic systems have been developed, including microlens, gratings, prisms and dye laser etc.10–15 In addition, biosensors and devices that exploit the ease of microfluidic manipulation in a safe enclosed environment, have been developed such as hemodynamic optofluidic system,16,17 single cell poration system,18 single cell characterization systems, including size, shape, refractive index (RI), dry/water mass and Young's modulus.19 By observing the optical signal, fluorescent dye or other indicators is no longer required, which can realize a label-free detection technique. Collecting and analysing an optical signal by a signal processing system is more convenient and has higher sensitivity and accuracy because of the less influence by the other parameter change of the sample.
Previously, these methods for bacteriophage detection were based on a plague assay and PCR that require complicated labelling techniques, time-consuming culture assays and suffer low recovery rate. Here, we report for the first time a label-free bacteriophage detection by using droplet optofluidic imaging, which uses host-cell-containing microdroplets as reaction carriers for bacteriophage infection and detection. Due to the higher contact ratio between bacteriophages and host cells in a microdroplet compared with a large container, the infection efficiency is significantly higher than the conventional plague assay. Optofluidic imaging is purely based on the effective refractive index changes in the microdroplet correlated with the growth rate of the infected host cells. In addition, no pre-treatment of the water sample such as fluorescent labelling is needed, which reduces the detection time. The droplet optofluidic system is not only used in drinking water quality monitoring, but also has high potential for application in pathogenic bacteria detection in clinical diagnosis and food industry.
Materials and methods
Design of optofluidic chip for bacteriophage detection
Fig. 1 illustrates the droplet optofluidic imaging system for bacteriophage detection, whereby the microdroplet is used as a reaction carrier and light scattering is employed for optofluidic imaging. When light is injected on the microdroplet with host cells and bacteriophage, light is scattered distinctively and a scattering pattern is formed at the image plane. Information such as the growth rate of the host cell is efficiently correlated and retrieved from the optofluidic imaging signal.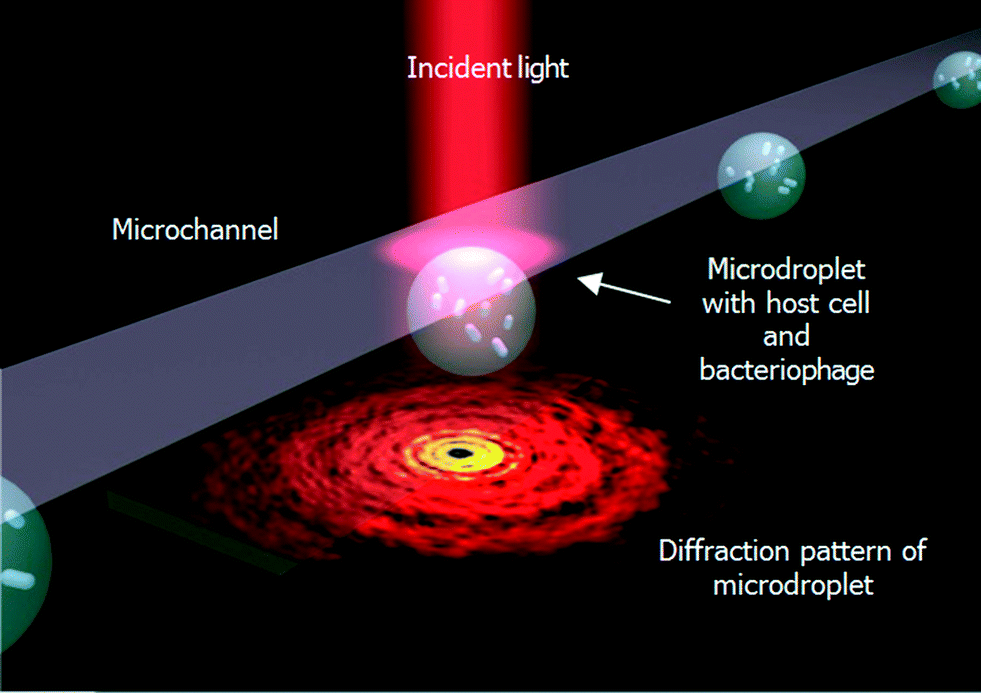 | ||
| Fig. 1 Schematic illustration of the optofluidic imaging of droplets encapsulating co-cultured bacteriophage and host cells, E. coli. | ||
The work flows in the droplet optofluidic imaging system are shown in Fig. 2. To avoid micro-sized contaminant interference, the water sample can be pre-filtered, for example, by using an acoustic microfluidic filter. Bacteria-sized particles or larger can be separated from the water sample using non-contact acoustic force, while retaining nano-sized samples such as phages with ultra-high recovery rate.20–22 In the context of this paper, the water sample to be tested is assumed to be pre-filtered to avoid detection error. The sample is mixed with host cell culture medium and then generated a large number of droplets as shown in Fig. 2(a). Microfluidics allows high generation rates of monodisperse droplets. As the microdroplet flows downstream in the microchannel, the two microdroplets containing different contents merge together and the content in the microdroplet is mixed rapidly so that it facilitates the infection of the host cell with the presence of a bacteriophage as shown in Fig. 2(b). In the bacteriophage-containing microdroplet, the λ-bacteriophage mostly undergoes the lytic cycle. The phage identifies the host cell, E. coli, by binding on its surface. Then, the phage deoxyribonucleic acid (DNA) is ejected from the phage into the cell and duplicated in the E. coli. After an incubation period, the λ-bacteriophage DNA is replicating repeatedly and a multiple of new bacteriophages are assembled in the host cell. Finally, the host cell is lysed, releasing the assembled λ-bacteriophages and other cell contents into the extracellular environment. As a result, the host cell growth rate in the bacteriophage-containing microdroplet is significantly reduced, compared with the one without bacteriophage shown in Fig. 2(c). The final concentration of the host cell affects the scattering pattern of the microdroplet carrier, which is exploited to detect the existence of the bacteriophage as shown in Fig. 2(d).
 | ||
| Fig. 2 Schematic illustration of optofluidic chip for bacteriophage detection that consists of: (a) water sample containing bacteriophage and E. coli in culture medium are split into microdroplets by microfluidic structure, (b) two microdroplets merge together and water sample is mixed with host cell E. coli, (c) host cell growth condition in the microdroplet is affected by the presence of the bacteriophage and (d) host cell growth condition is detected by using optical detection system. | ||
Protocol for culturing host cells and bacteriophages
For the E. coli K12 (Biolabs, USA) and λ-bacteriophage (Biolabs, USA) culture, a small portion of the E. coli powder is transferred to a sterile pipette tip with Luria Broth medium (Sigma, USA) and incubated in a water bath shaker with 200 rpm at 37 °C for 8 hours. A droplet of the liquid culture is spread on a selective agar plate and propagated overnight at 37 °C. After the formation of the E. coli colonies, a single colony of E. coli is selected and transferred to Luria Broth medium to grow overnight. The final cultured E. coli concentration is measured by using OD600 with a spectrometer (PG Instruments T60 visible spectrophotometer). OD600 is an acronym indicating the optical density of a sample measured at a wavelength of 600 nm. The use of OD600 for characterizing the experiment is quite wide in the research area of bacteria and microbial. The bacteriophages are diluted with Tris buffered saline (Sigma, USA) and amplified using E. coli as host cell for preparation. The bacteriophage sample concentration is measured using the plague assay method.Analysis of the light scattering pattern
For the optical setup, the light source is laser (λ = 632.8 nm, 800 mW, Thor Lab, USA). The beam is reflected by a beam splitter and focused on the microdroplets at the detection area in the microfluidic chip. The light scattered from the droplets is collected at a distance of 8 mm with a CCD line-scan camera (Nikon digital sight DS F-11) and passes to the signal processor for further analysis. The scattering patterns of microdroplets with different concentrations of inclusion (E. coli) are recorded and collected with the diameters of the droplets fixed at 60 μm. The average size of the inclusion E. coli is in a rod-shape with a diameter of d = 0.5 μm and length l = 2 μm. For microdroplets without inclusion, the scattered light shows Fraunhaufer diffraction pattern of a round droplet. However, for microdroplets with inclusions, the scattered light from the droplet would be reflected and refracted by the inclusions, showing a complex Mie fringe. The resulting scattering pattern is a coherent superposition of scattered light from the microdroplet and those from the inclusions, resulting in regular Mie fringes decorated by random speckles. When the inclusion concentration increases, the scattering pattern deviates significantly from clear Mie fringes, and there are more contributions from the high frequency speckle signal.20 At the same time, another CCD camera (Nikon digital sight DS F-11) is set at the top of the microfluidic chip, and a dichroic filter is used to collect the microdroplet image at bright field. Then the microdroplet carrier and its diffraction pattern can be observed simultaneously.Results and discussions
Scattering pattern of microdroplets containing E. coli
Scattering pattern analysis with mean power frequency of microdroplets containing different concentrations of E. coli is shown in Fig. 3. The diffraction pattern of the microdroplet with E. coli is a combination of single circular aperture Fraunhofer diffraction by the shape of the droplet and the scattering signal of the content in the droplet. The circular diffraction pattern is determined by the diameter of the single droplet. Based on the experimental results, the standard deviation of the droplet diameter is less than 3%. The tolerance of the droplet diameter, shape and size can be assumed as constant. Therefore, the scattering pattern is significantly influenced by the concentration of the host cells. In the experiment, the incident light wavelength is 632.8 nm, and the inclusion particles in the microdroplet carrier, E. coli cells, have a size that is comparable to the incident wavelength. In this case, the Mie scattering intensity is mainly determined by the concentration of the E. coli cells. The scattering patterns of low and high E. coli concentrations are shown in Fig. 3(a) and (b).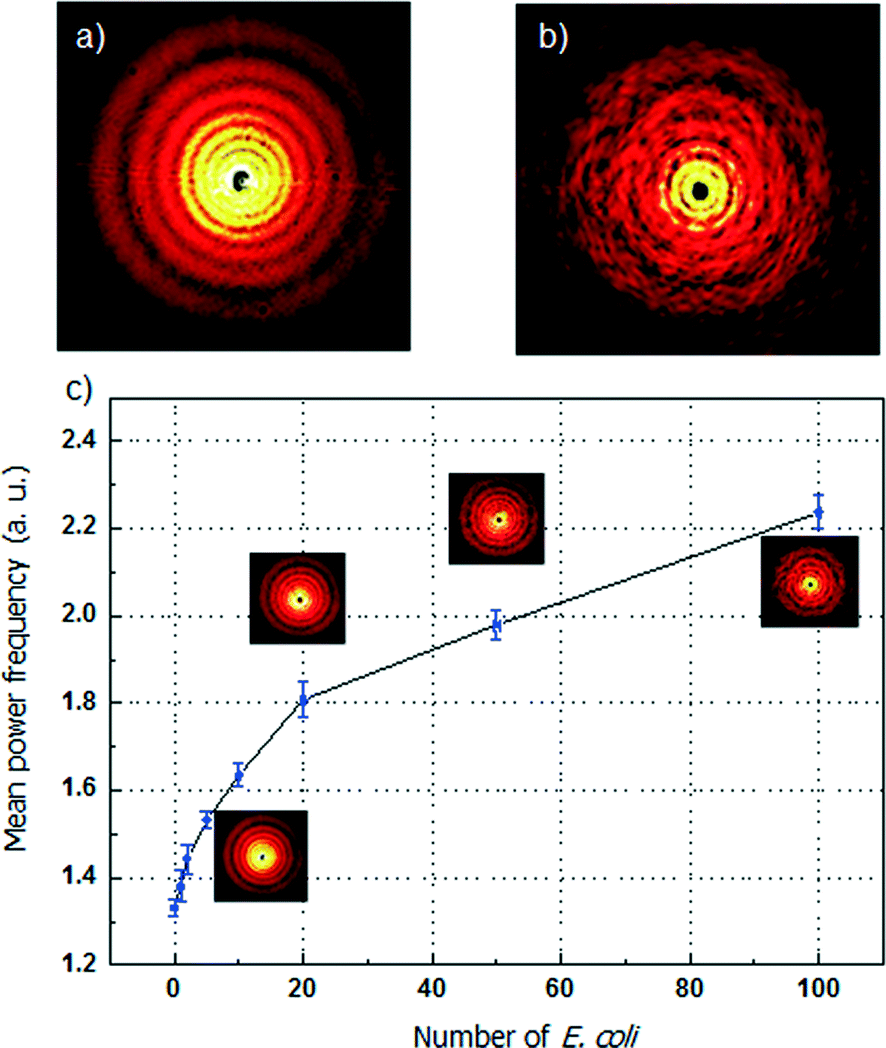 | ||
| Fig. 3 Scattering pattern analysis with mean power frequency of microdroplets containing different concentrations of E. coli. Scattering pattern of (a) 1 × 10⁷ cell ml−1 (0–1 cell per droplet), and (b) 1 × 10⁹ cell ml−1 (100 cell per droplet). (c) Mean power frequency versus E. coli concentration in the microdroplet. | ||
The change of the scattering pattern of the microdroplet carrier with the increment of the concentration of E. coli in the microdroplet is shown in Fig. 3(c). (The numerical method for analysis of the scattering pattern by mean power frequency calculation is shown in the ESI.† The experimental setup is shown in Fig. S1† and the scattering pattern are shown in Fig. S2.†) For the microdroplet carrier with known volume of 10−7 ml, the number of host cell E. coli can be controlled from 0 to 100 cells per microdroplet by varying the initial E. coli concentration from 107 to 109 cell ml−1. When the concentration of E. coli increases, the degree of multiple reflection and refraction in the microdroplet of the incident light is higher. The scattering pattern of the whole microdroplet has a higher level of disorder with more host cells in the microdroplet. The intensity distribution of the same order of the droplet diffraction pattern splits into more individual peaks. The disorder degree can be expressed by using the mean power frequency level. From 0 to 100 cells per microdroplet, the mean power frequency value increases nearly by 2-fold. The increased rate is relatively high and a nearly linear growth from 0 to 20 cells per each droplet can guarantee a high resolution in the measurement. An increment of 2 cells in the droplet can be detected between the ranges of 0 to 100 cells. The detection resolution is mainly limited by the quality of the captured scattering pattern. The performance can be further improved by using a CCD camera with higher speed and sensitivity.
E. coli co-culture with λ-bacteriophage
The variation of E. coli concentration co-cultured with λ-bacteriophage in the droplet, which is measured based on the mean power frequency of the scattering pattern of the microdroplet, is shown in Fig. 4. For convenience of comparison with the culture conditions using a traditional flask, the number of E. coli is expressed by the OD600 value, which is based on the standard curve of the relationship between E. coli concentration and OD600. The growth of E. coli cultured individually in the microdroplet still follows a typical bacterial growth curve. However, due to the confined microenvironment of the closed droplet, the metabolic waste of the E. coli cannot be removed while the nutrition is limited without refreshment.23,24 The growth speed of the E. coli in microdroplet is obviously slower than the one in a traditional flask culture. The growth speed difference is more significant at higher concentrations since the completion of the nutrition is more drastic among a large number of E. coli. When E. coli is co-cultured with λ-bacteriophage in the microdroplet, the initial infection period is shorter than that in a flask. As a result, the population of E. coli starts to decrease at around 2 h, which is earlier than that in a flask (around 3 h). This is mainly due to the limited number of bacteriophage in the first or second hour. In the microdroplet environment, the contact probability between λ-bacteriophage and E. coli is higher than that in a flask environment. During the travelling of the microdroplet in the microchannel, the passive mixing of the content further promotes the infection speed. Both cases agree well with the decreasing E. coli concentration due to the infection of bacteriophage. By using the optofluidic detection system, a label-free measurement of the concentration of the E. coli in the microdroplet is achieved.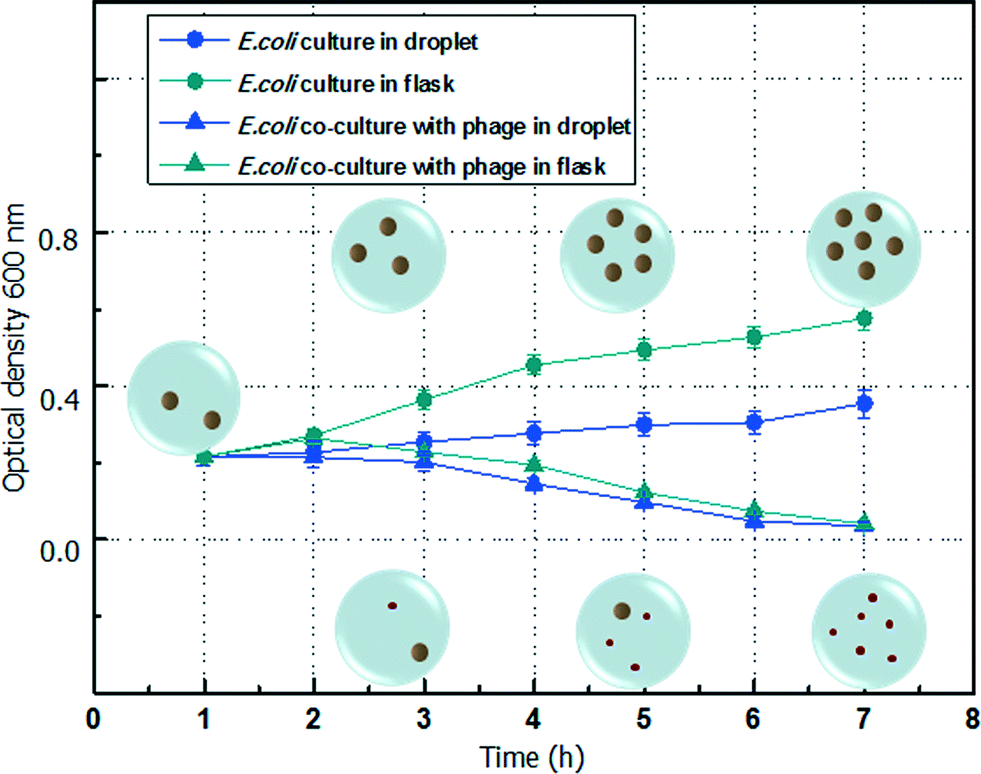 | ||
| Fig. 4 Transmitted optical density of E. coli co-culture with λ-bacteriophage in microdroplet and flask. | ||
λ-Bacteriophage containing water sample analysis
To verify the detection ability of the optofluidic system, water samples containing different concentrations of bacteriophage are measured as shown in Fig. 5. For the fixed diameter microdroplet of d = 60 μm, the volume is approximately 10−7 ml. The water sample with known bacteriophage concentration is injected into the optofluidic system. The water sample with bacteriophage is mixed with E. coli culture medium and divided into a large number of microdroplets. The initial concentration of the cultured E. coli is 5 × 10⁸ cell ml−1 (50 cell per droplet), which is a suitable environment for the λ-bacteriophage infection (Fig. S#†). After 4 hours of storage in the culture chamber, the microdroplets are released and passed through the optical detection area. The scattering pattern of each droplet is recorded and analysed. When the host cell E. coli is infected by the presence of λ-bacteriophage in the microdroplet, the scattering pattern of the microdroplet has mean power frequency value lower than 20 (Fig. S3†), which is chosen as the threshold value. In the experiment, a series of testing groups is measured with each group size of N microdroplets. The number of bacteriophage in each testing group f can be expressed as25| f = Cbacteriophage × V × N | (1) |
 | ||
| Fig. 5 λ-Bacteriophage containing sample analysis of concentration of 103 pfu ml−1 and 104 pfu ml−1. | ||
Fig. 5 shows the statistical results of 10 groups of microdroplets with a group size of 1 × 10⁴ droplets. The water samples have known bacteriophage concentration of Cbacteriophage = 103 pfu ml−1 and Cbacteriophage = 104 pfu ml−1, respectively. The average number of detected bacteriophage for Cbacteriophage = 103 pfu ml−1 and Cbacteriophage = 104 pfu ml−1 is 1 and 10, respectively, which agrees with the theoretical calculations.
As a result, the optofluidic system has realized a fast and reliable detection of the bacteriophage, with the potential to be extended for lower bacteriophage concentration by increasing the number of microdroplets (group size). For example, to detect a bacteriophage concentration of 10 pfu ml−1, the number of microdroplets for each group has to be increased to 106 and 107 in order to have 1 droplet and 10 droplets with the presence of bacteriophage, respectively. Droplet microfluidics is capable of dealing with millions of microdroplets.26
Conclusions
In summary, a droplet optofluidic imaging system for the detection of λ-bacteriophage in drinking water is demonstrated. Microdroplets act as reaction carriers for the infection of host cell E. coli by the bacteriophage, which improve the infection rate and reduce detection time due to higher contact ratio in the droplet carriers. Subsequently, an optical imaging technique based on scattering light is exploited to monitor the growth rate of the host cells in the microdroplet, which is label-free and also highly sensitive, i.e. can detect one E. coli cell. This optofluidic imaging system not only enables label-free detection of bacteriophage in drinking water for water quality monitoring, but also can be exploited for pathogenic bacteria detection in clinical diagnosis and food industry.Acknowledgements
The authors appreciate for Q. H. Song for his contribution in graph design and Dr W. M. Zhu for his useful advice and discussions. The authors would like to acknowledge the financial support from Environmental and Water Industry (EWI) Development Council of Singapore (grant no. 1102-IRIS-05-01, 1102-IRIS-05-02).Notes and references
- M. Kukkula, L. Maunula, E. Silvennoinen and C.-H. von Bonsdorff, J. Infect. Dis., 1999, 180, 1771 CrossRef CAS PubMed.
- J. F. Schijven, P. F. M. Teunis, S. A. Rutjes, M. Bouwknegt and A. M. de Roda Husman, Water Res., 2011, 45, 5564 CrossRef CAS PubMed.
- W. O. Grabow, C. G. Clay, W. Dhaliwal, M. A. Vrey and E. E. Müller, Zentralbl. Hyg. Umweltmed., 1999, 202, 399 CAS.
- L. Ogorzaly and C. Gantzer, J. Virol. Methods, 2006, 138, 131 CrossRef CAS PubMed.
- R. C. Loehr and D. T. Schwegler, Appl. Microbiol., 1965, 13, 1005 CAS.
- R. G. Palmer and F. R. Troeh, Introductory Soil Science, Oxford University Press, USA, 1995 Search PubMed.
- W. Köster, T. Egli, N. Ashbolt, K. Botzenhart, N. Burlion, T. Endo, P. Grimont, E. Guillot, C. Mabilat, L. Newport, M. Niemi, P. Payment, A. Prescott, P. Renaud and A. Rust, Safe Drinking Water: Lessons from Recent Outbreaks in Affluent Nations, IWA publishing, 2003 Search PubMed.
- M. Ciminska, M. Los, A. Holmgren, J. Albers, A. Czyz, R. Hintsche, G. Wegrzyn and S. Enfors, Anal. Biochem., 2004, 324 Search PubMed.
- F. N. Dultsev, R. E. Speight, M. T. Fiorini, J. M. Blackburn, C. Abell, V. P. Ostanin and D. Klenerman, Anal. Chem., 2001, 73, 393 CrossRef.
- Y. Yang, A. Q. Liu, L. K. Chin, X. M. Zhang, D. P. Tsai, C. L. Lin, C. Lu, G. P. Wang and N. I. Zheludev, Nat. Commun., 2012, 3, 651 CrossRef CAS PubMed.
- S. K. Y. Tang, C. A. Stan and G. M. Whitesides, Lab Chip, 2008, 8, 395 RSC.
- L. K. Chin, A. Q. Liu, Y. C. Soh, C. S. Lim and C. L. Lin, Lab Chip, 2010, 10, 1072 RSC.
- J. Q. Yu, Y. Yang, A. Q. Liu, L. K. Chin and X. M. Zhang, Opt. Lett., 2010, 35, 1890 CrossRef CAS PubMed.
- S. Xiong, A. Q. Liu, L. K. Chin and Y. Yang, Lab Chip, 2011, 11, 1864 RSC.
- Y. Yang, A. Q. Liu, L. Lei, L. K. Chin, C. D. Ohl, Q. J. Wang and H. S. Yoon, Lab Chip, 2011, 11, 3182 RSC.
- L. K. Chin, J. Q. Yu, Y. Fu, T. Yu, A. Q. Liu and K. Q. Luo, Lab Chip, 2011, 11, 1856 RSC.
- J. Q. Yu, X. F. Liu, L. K. Chin, A. Q. Liu and K. Q. Luo, Lab Chip, 2013, 13, 2693 RSC.
- Z. G. Li, A. Q. Liu, E. Klaseboer, J. B. Zhang and C. D. Ohl, Lab Chip, 2013, 13, 1144 RSC.
- L. K. Chin, A. Q. Liu, X. M. Zhang, C. S. Lim, J. H. Ng, J. Z. Hao and S. Takahashi, Appl. Phys. Lett., 2007, 91, 243901 CrossRef PubMed.
- J. Messi, Methods Mol. Biol., 1993, 23, 9 Search PubMed.
- Z. C. Wang and J. Zhe, Lab Chip, 2011, 11, 1280 RSC.
- Y. Ai, C. K. Sanders and B. L. Marrone, Anal. Chem., 2013, 85, 9126 CrossRef CAS PubMed.
- D. Riesenberg, V. Schulz, W. A. Knorre, H. D. Pohl, D. Korz, E. A. Sanders, A. Rob and W. D. Deckwer, Biotec., 1991, 20, 17 CAS.
- E. Brouzesa, M. Medkovaa, N. Savenellia, D. Marrana, M. Twardowskia, J. B. Hutchisona, J. M. Rothberga, D. R. Linka, N. Perrimon and M. L. Samuelsa, Proc. Natl. Acad. Sci. U. S. A., 2009, 106, 14195 CrossRef PubMed.
- R. C. Gonzalez and R. E. Woods, Image Analysis and Recognition: 4th International, Wiley-Interscience Publication, USA, 2007 Search PubMed.
- A. C. Hatch, J. S. Fisher, A. Tovar, A. T. H. Hsieh, S. L. Pentoneym, D. L. Yang and A. P. Lee, Lab Chip, 2011, 11, 3838 RSC.
Footnote |
| † Electronic supplementary information (ESI) available. See DOI: 10.1039/c4lc00042k |
| This journal is © The Royal Society of Chemistry 2014 |