Cell culture monitoring for drug screening and cancer research: a transparent, microfluidic, multi-sensor microsystem
Andreas
Weltin
*ab,
Kinga
Slotwinski
a,
Jochen
Kieninger
a,
Isabella
Moser
b,
Gerhard
Jobst
b,
Marcus
Wego
c,
Ralf
Ehret
c and
Gerald A.
Urban
a
aLaboratory for Sensors, Department of Microsystems Engineering (IMTEK), University of Freiburg, Georges-Köhler-Allee 103, 79110 Freiburg, Germany. E-mail: weltin@imtek.de; Fax: +49 761 203 7262; Tel: +49 761 203 7263
bJobst Technologies GmbH, Engesserstr. 4b, 79108 Freiburg, Germany
cBionas GmbH, Friedrich-Barnewitz-Str. 3, 18119 Rostock, Germany
First published on 23rd October 2013
Abstract
We present a novel, multiparametric microphysiometry system for the dynamic online monitoring of human cancer cell metabolism. The optically transparent, modular, hybrid microsystem is based on a glass chip and combines a cell cultivation chamber, microfluidics and metabolic monitoring with fully integrated chemo- and biosensors. pH and oxygen are measured in the cell culture area, and biosensors for lactate and glucose are connected downstream by microfluidics. The wafer-level fabrication features thin-film platinum and iridium oxide microelectrodes on a glass chip, microfluidics in an epoxy resist, a hybrid assembly and an on-chip reference electrode. The reliable analytical performance of the sensors in cell culture medium was demonstrated. The pH sensors exhibit a long-term stable, linear response. The oxygen sensors show a linear behaviour, which is also observed for low oxygen concentrations. Glucose and lactate measurements show a linear, long-term stable, selective and reversible behaviour in the desired range. T98G human brain cancer cells were cultivated and cell culture metabolism was measured on-chip. Stop/flow cycles were applied and extracellular acidification, respiration, glucose consumption and lactate production were quantified. Long-term metabolic rates were determined and all parameters could be measured in the outlet channel. A placement downstream of the cell cultivation area for biosensors was realised. A highly effective medium exchange and undiluted sampling from the cell culture chamber with low flow rates (2 μl min−1) and low volumes (15 μl per cycle) were achieved. The drug screening application was demonstrated by detecting alteration and recovery effects of cellular metabolism induced by the addition of substances to the medium.
1. Introduction
Cell culture monitoring is an important tool in drug screening, cancer cell research or environmental monitoring applications. Microphysiometers are devices able to measure at least one metabolic parameter of living cells on a chip in a noninvasive manner. Most commonly, this parameter is the extracellular acidification caused by the excretion of protons. Other important parameters are cellular adhesion, oxygen consumption due to cellular respiration, or the energy metabolism, primarily glucose uptake and lactate production. In a microphysiometer, cells are cultivated on a chip, and then a stop/flow pump cycle is applied to periodically exchange the cell culture medium. If desired, substances that alter the metabolism can be added. Metabolic products and cellular behaviour are then measured by the sensors. In contrast to end-point analysis, these systems allow dynamic online monitoring, including the study of pharmacodynamics and recovery effects. Optical transparency is a much needed feature in order to observe the cultured cells by phase contrast microscopy. Biosensors allow access to additional metabolic parameters. Microfluidics enable controlled medium exchange and substance exposure to low volumes with low flow rates.Only a few microphysiometers that monitor the metabolism of cultivated cells have been developed and most of them are based on a silicon chip, lacking transparency for inverted phase contrast microscopy. The Cytosensor® was based on a light-addressable potentiometric sensor (LAPS) on a silicon chip to measure extracellular acidification and was commercialised by Molecular Devices.1–3 Modifications of the Cytosensor® included the addition of biosensors for glucose and lactate,4–6 and other LAPS devices have been developed recently.7 Systems for monitoring cellular adhesion and morphology by electric impedance with an interdigitated electrode structure (IDES) were introduced8 and combined with pH and oxygen monitoring by ion selective field effect transistors (ISFET)9,10 or amperometric oxygen monitoring.11,12 The Bionas Discovery™ 2500 system is also based on a silicon chip and features IDES for adhesion and ISFETs for pH monitoring as well as palladium electrodes for amperometric oxygen sensing. It has been applied in numerous pharmacological studies.13–15
In contrast to the above mentioned silicon-based microphysiometers, we present a novel, optically transparent, multiparametric microphysiometer for continuous dynamic measurement of the parameters pH, oxygen, lactate and glucose in human tumour cell cultures. The hybrid, modular microsystem is based on a glass chip, with electrochemical microsensors developed and fabricated in a hybrid of thin-film and laminate technology. It combines the functionalities of adherent cell culture with dynamic medium supply, microfluidics and metabolic monitoring with chemo- and biosensors on a single, transparent chip.
Oxygen and pH are monitored at the cell cultivation area, while dedicated multi-layer microfluidics provide for highly efficient cell culture medium exchange and transport to the fully integrated biosensors in a downstream sampling manner. The sensors were characterised in cell culture environment and the microphysiometer's performance was evaluated in dynamic cell culture measurements with T98G human brain cancer cells. The drug screening application was demonstrated by measuring alterations and recovery of cellular metabolism by adding substances to the cell culture medium.
2. Materials and methods
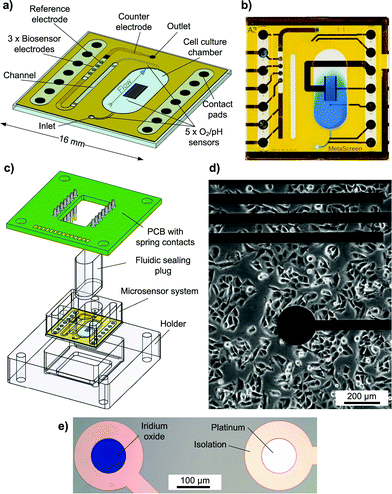
2.1 System concept and design
The transparent system is based on a 16 × 16 mm2 Pyrex® borosilicate glass chip [Fig. 1a]. A preliminary version was introduced earlier.16 The chip size and the size of the cell cultivation area (34 mm2) resemble the dimensions of a single well of a 24-well microtitre plate. Cells growing adherently on the chip surface can be cultivated in the cell culture area for several days like in a microtitre plate [Fig. 1d]. For measurement, the scalable, formerly 500 μl chamber is sealed to allow pressure-driven fluidics and to miniaturise the volume above the cell layer to a conveniently small measurement cell with about 5 μl volume and 150 μm height. Integrated microfluidics allow an efficient medium exchange in the cell cultivation area with a low flow rate of 2 μl min−1 and undiluted transport of the medium to the downstream sensors [Fig. 1b]. The total volume of the system's fluidics is less than 10 μl. Instead of supplying or sucking the medium from the top of the cell cultivation area creating a radial flow to the sides or a flow perpendicular to the cell surface as described in the literature,3,4,12,14 in the developed system, the entire cell culture chamber volume goes through a single outlet channel on the side with a flow parallel to the cell layer. In this way, sensors can be placed away from the cells in the outlet channel. The entire chamber volume not only can be exchanged efficiently but also is entirely available for undiluted analysis. The flow velocity in the chamber is low and evenly distributed, reducing the shear stress on cells. The exposure of cells to added substances can be tightly controlled, and low volumes are used.In total, five oxygen or pH sensors, based on thin-film platinum (O2) or iridium oxide electrodes (pH), are placed upstream in the inlet channel, inside the cell cultivation area and downstream in the outlet channel. These circular electrodes have a diameter of 100 μm. Depending on a design variation, either two electrodes are in the inlet and one is in the cell culture chamber or vice versa. In the outlet channel, there are always two electrodes. The placement in the outlet channel aims to investigate if pH and oxygen can be monitored in the microfluidics outside the cell cultivation area. The electrodes in the inlet can serve as a control.
In total, three biosensor electrodes for the measurement of glucose and lactate, including a blank electrode, are placed downstream in the outlet channel, together with the silver/silver chloride (Ag/AgCl) reference electrode and the platinum counter electrode. The biosensor and reference electrodes are circular with a diameter of 400 μm.
At the biosensor electrodes, oxygen and the analyte (glucose or lactate) are consumed by the enzyme (glucose oxidase or lactate oxidase), which is immobilised in a membrane, and hydrogen peroxide is produced as an intermediary product [eqn (1), (2)]. The produced hydrogen peroxide is then oxidised at the platinum electrode in the amperometric measurement [eqn (3)].
| Glucose + O2 → Gluconolactone + H2O2 | (1) |
| Lactate + O2 → Pyruvate + H2O2 | (2) |
| H2O2 → 2 H+ + O2 + 2 e− | (3) |
Therefore, the biosensors are best separated from the cell culture area in order to protect the cells from hydrogen peroxide exposure and from oxygen depletion during cultivation as well as to avoid general biocompatibility issues of biosensors (material and surface).
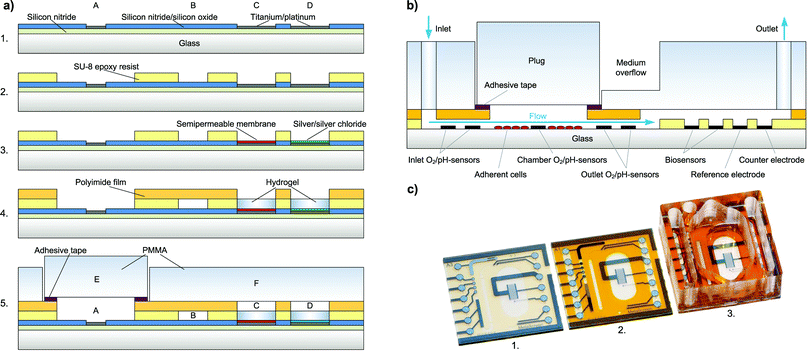
The fluidic channels and electrode wells for the biosensors and reference electrodes are formed by a permanent epoxy resist and are partly covered with a laminated polyimide film. At the biosensor electrodes, the fluidic channel changes from the epoxy layer to the polyimide film, as the epoxy here forms the electrode wells for the biosensors. A 6 mm thick polymer cover piece is added to form the well around the cell cultivation area, providing room for enough medium to culture cells over several days. Biocompatibility of the fully assembled system was tested with C2C12 mouse myoblast cells. No negative effect on cell growth and differentiation was found. The surface material for cell growth was investigated and optimised in another context.17 For measurement, the system is sealed with a gas-tight polymer plug to allow pressure-driven fluidics.
To connect to the instrumentation, the chip is placed in a holder and a PCB with spring contact probes for electrical contact is attached [Fig. 1c]. In this way, the sensor chip can be separated at any time from the electrical instrumentation, e.g. for incubation and inverted phase contrast microscopy.
2.2 Thin-film processing
Chip fabrication [Fig. 2a] begins with the wafer-level thin-film processing of a 100 mm diameter Pyrex® borosilicate glass wafer in a cleanroom process. A first insulation layer of 500 nm silicon nitride is deposited by plasma-enhanced chemical vapour deposition (PECVD).For metal structuring, AZ 5214E (Clariant) negative photoresist is patterned by lithography with a MA6B (Süss MicroTec) mask-aligner. Then, 50 nm titanium as an adhesion promoting layer, 100 nm platinum as the electrode material and 20 nm titanium as a protection layer are deposited by physical vapour deposition (PVD). Final structuring of the metal is achieved by a lift-off process. The following insulating layer consists of 800 nm silicon nitride and 200 nm silicon oxide, again deposited by PECVD.
Electrode and contact pad opening is achieved by using a reactive ion etching (RIE) step masked by a patterned AZ 1518 (Clariant) negative photoresist. The platinum acts as the stop layer for etching. The fluidic channel and electrode wells are formed by spin-coating and photolithographic structuring of a 40 μm thick negative permanent epoxy resist, SU-8 3025 (Microchem).
2.3 Electrode modification
A Ag/AgCl pseudo-reference electrode is integrated on-chip by wafer-level electrodeposition. Silver is cathodically electrodeposited from an Arguna S (Umicore) solution by applying a constant current density. The silver is then partially converted to silver chloride by anodic oxidation in 0.1 M KCl solution.As a semipermeable membrane on the biosensor electrodes, which prevents interfering molecules from being oxidised at the electrode, a layer of 1,3-diaminobenzene is deposited by electropolymerisation during cyclic voltammetry. One wafer is then diced into 16 chips.
pH sensor electrodes are formed by the anodic electrodeposition of iridium oxide thin films (AEIROF) as described by Yamanaka.18 Electrodes are deposited in parallel from iridium tetrachloride solution as introduced earlier19 in a combination of cyclic voltammetry and potentiostatic deposition using a three-electrode setup.
Bare platinum electrodes are used as oxygen sensors applying a chronoamperometric protocol.
The biosensors are formed by immobilisation of a UV-curable poly(2-hydroxyethyl methacrylate)-based (pHEMA) enzyme membrane containing glucose oxidase or lactate oxidase on the respective electrode as reported earlier.20 Therefore, the enzymes lactate oxidase (Genzyme) and glucose oxidase (BBI Enzymes) are mixed into the liquid precursor solution of this hydrogel, which is then dispensed by a CNC dispenser. On each electrode, a volume of ~5 nl is dispensed. Crosslinking by UV light forms a stable hydrogel membrane. If necessary, the dispensing step can be repeated to form another diffusion-limiting membrane on top of the existing one. A blank membrane without the enzyme is deposited on the blank electrode and on the reference electrode.
2.4 Assembly
A cross-section of the fully assembled system is shown in Fig. 2b. As a cover layer for the fluidic channel, a laser-structured polyimide coverlay film, Pyralux® LF1510 (DuPont), is laminated to the epoxy layer leaving only the contact pads, biosensor electrodes and cell cultivation chamber open [Fig. 2c]. The adhesive of the coverlay is then cured for 3 h at 150 °C. After curing, the biosensor electrodes remain accessible, so that the temperature-sensitive enzymes can be integrated after the thermal curing step.The poly(methyl methacrylate) (PMMA) cover to seal the system's fluidics and to form the well for cell cultivation is manufactured by computer numerical control (CNC) milling. It is then permanently attached to the chip using Loctite® 3201 (Henkel) UV-curable adhesive. The plug for fluidic sealing is also milled from PMMA and a structured pressure-sensitive adhesive tape, tesa® 4965, is laminated to one side. This pressure-sensitive adhesive tape, tesa® 4965, allows reversible attachment of the sealing plug, while sealing the fluidics tightly.
2.5 Cell culture
Human glioblastoma multiforme T98G brain cancer cells21 were used to perform cell culture experiments. The cell culture medium was CO2 Independent Medium (Gibco), allowing experiments without the permanent need of an incubator with CO2 supply or RPMI-1640 (Sigma-Aldrich) for pH measurements. Both media were supplied with 10% ultra-low IgG fetal bovine serum (FBS) (Gibco), 1% of 200 mM L-glutamine (Gibco) and 1% pen strep (Gibco) antibiotic with 10![[thin space (1/6-em)]](https://www.rsc.org/images/entities/char_2009.gif) 000 units ml−1 penicillin and 10 mg ml−1 streptomycin. Triton X-100 was from Fluka and cytochalasin B was from Sigma-Aldrich.
000 units ml−1 penicillin and 10 mg ml−1 streptomycin. Triton X-100 was from Fluka and cytochalasin B was from Sigma-Aldrich.
The system was operated inside a ventilated, heated cabinet (Heraeus) with temperature control (37 °C ± 0.2 °C) and logging. Cells were sub-cultured in a 25 cm2 cell culture flask under normoxic conditions at 37 °C. For measurement, they were trypsinised and passaged to the cell culture well of the microphysiometer system by pipetting the cell suspension into the open cell culture well of the system, seeding the cells at a density of around 50![[thin space (1/6-em)]](https://www.rsc.org/images/entities/char_2009.gif) 000 cells cm−2. For cultivation of cells in the system, the culture well was permanently filled with 500 μl of the cell culture medium. Cells were cultivated on the chip for 48 hours prior to measurement and formed an adherent, confluent layer. The transparent chip allowed monitoring and verification of cell growth by inverted phase contrast microscopy at any given phase of cultivation.
000 cells cm−2. For cultivation of cells in the system, the culture well was permanently filled with 500 μl of the cell culture medium. Cells were cultivated on the chip for 48 hours prior to measurement and formed an adherent, confluent layer. The transparent chip allowed monitoring and verification of cell growth by inverted phase contrast microscopy at any given phase of cultivation.
3. Results and discussion
3.1 Sensor characterisation
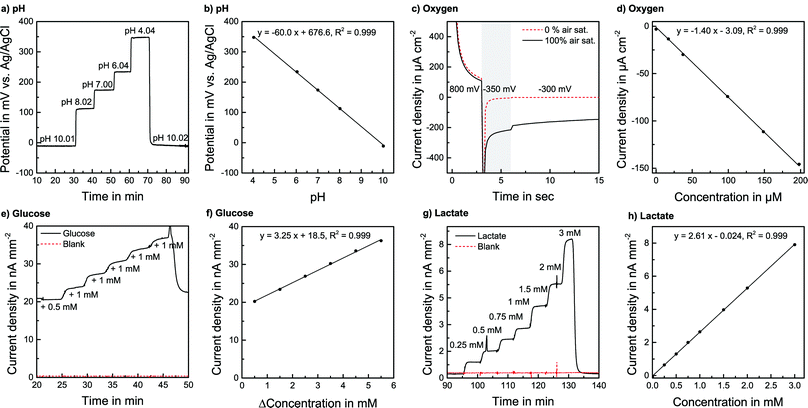
pH sensors were calibrated in PBS over a wide range, far exceeding the cell culture application demand. PBS was adjusted to the desired pH by the addition of acetic acid or NaOH and was pumped through the system. The pH-sensitivity showed a linear, reversible and flow rate independent behaviour between pH 4 and pH 10 with a sensitivity corresponding to one electron transfer in the Nernst equation of −60.3 mV pH−1 (±1.7 mV pH−1, n = 9) at room temperature. The response time to the change of one pH unit was within seconds. The absolute potential was at +197.2 mV (±47 mV) vs. the on-chip reference electrode, but the variation did not have any influence on sensitivity or stability. Sensors were also calibrated in RPMI-1640 cell culture medium, where the pH was adjusted by adding NaOH or acetic acid [Fig. 3a] under flow conditions at a flow rate of 2 μl min−1. The sensitivity was −61.4 mV pH−1 (±2.3 mV pH−1) at 37 °C for a batch of five electrodes, confirming the sensitivity found in PBS [Fig. 3b]. Furthermore, the sensors were calibrated after the actual cell culture experiments. No detectable change in sensitivity was found even after the sensors had been exposed to cell cultures for days.
Drift rates in medium at 37 °C were less than ±0.02 pH units per hour, better than that required for this application. In any case, to compensate for any occurring drift, running fresh medium with a constant pH could always be monitored by the electrode in the inlet channel and then referenced to the sensors in the cell chamber and outlet channel.
For the oxygen sensor calibration, the system was operated in a gas-tight box. A gas mixing station was used to adjust various oxygen levels in PBS and cell culture medium. The flow rate was 2 μl min−1. A calibration with various dissolved oxygen concentrations was performed [Fig. 3d]. The sensitivity in CO2 Independent Medium at 37 °C was found to be −0.735 μA μM−1 cm−2 (±0.013 μA μM−1 cm−2) for a batch of five electrodes. The rise time was within the 15 s interval of the measurement protocol. Also, for low oxygen concentrations, a linear signal was observed, allowing a 1-point calibration due to the defined zero point. That means in every experiment, the signal for regular air saturation can be measured and a linear behaviour for lower levels can be justifiably assumed. The sensors have a defined zero point, where the linearity error is less than 3% of the measurement range compared to a 3-point calibration.
The oxygen sensors exhibit a small (ca. 10%) decrease in sensitivity when first entering the cell culture medium within around 10 min, possibly due to the adsorption of proteins to the electrode. In our application, this effect already occurs during the 48 hours of cell cultivation. Once the chrono-amperometric protocol is operated, the sensitivity is only dependent on the electrochemical reaction and the electrochemical state of the platinum electrode, which does not seem to change during the presented experimental time, as no significant change in sensitivity was observed. By determining the known oxygen content of the air-saturated running medium and due to sufficient linearity, a calibration of the sensors during measurement is possible to compensate for any occurring change in sensitivity.
We did not observe a significant drift during the experiments. A detailed study of the biosensors’ long-term behaviour can be found elsewhere.20 As for the oxygen sensors, a slight decrease in sensitivity due to exposure to the medium is possible but happens during cell cultivation. Additionally, by measuring the known concentrations of glucose and lactate in the running medium, the sensors can be calibrated within a measurement run to compensate for changes in sensitivity.
3.2 Cell culture experiments
To validate the system performance in the measurement of cellular metabolism, the system was operated by applying a stop/flow protocol. Fresh medium is periodically supplied to the cell culture chamber via microfluidics. During the stop phase, the cells consume the supplied oxygen and glucose, extracellular acidification occurs and lactate is produced. After several minutes, the used medium is flushed through the outlet channel and fresh medium is supplied to the cells again. Acidification and oxygen consumption are monitored directly in the cell culture chamber and in the outlet channel. Biosensors for lactate and glucose are placed in the outlet channel.
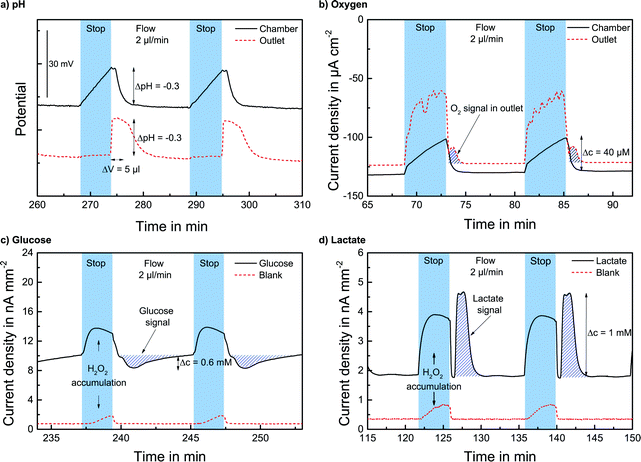
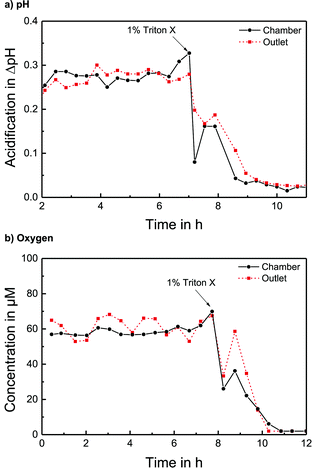
The pH sensors inside the cell culture chamber show an immediate drop in pH during the stop phase and an immediate return once the fresh medium arrives [Fig. 4a]. Extracellular acidification occurs and the pH in the medium surrounding the cells drops about 0.3 pH units. The pH sensors in the outlet channel show a sharp pH drop once the acidified medium from the chamber passes by. The change in pH determined by the sensors inside the cell culture chamber and in the outlet channel is nearly the same [Fig. 5a]. At the end of the experiment, the cells were killed by the addition of the detergent Triton X-100, and a zero baseline was achieved. No effect of Triton X on the sensors was observed. It was demonstrated that it is possible to measure pH outside and downstream of the cell culture chamber by measuring in the outlet channel during the flow phase. The efficiency of the medium exchange in the cell culture chamber can be seen in the immediate drop in pH and the return to the baseline after approx. three times the entire chamber volume has passed. The pH sensors in the inlet remain unaffected and can serve as a control.
The oxygen sensors inside the cell culture chamber show a drop in reduction current (negative values) during the stop phase due to the oxygen consumption of the cells [Fig. 4b]. During the flow phase, the oxygen levels return to the regular air saturation of the medium. The oxygen consumption of the electrode itself is negligible compared to that of the cells (<3%). The oxygen sensors in the outlet show a decrease in reduction current during the stop phase due to the consumption of the sensor and oxygen depletion in the small channel volume. Once the flow starts again, the signal increases quickly; however, a distinct peak (drop in reduction current) can be seen as the oxygen-depleted medium from the cell culture chamber passes the outlet electrode. After this peak, the oxygen signal returns to its higher baseline value for air saturation. The oxygen consumption can be determined by the slope or peak height of the chamber electrode or by the peak height of the outlet electrode. For both electrodes, constant respiration rates can be determined [Fig. 5b] both in the chamber and in the outlet channel. The oxygen concentration difference in the medium caused by cellular respiration is measured. At the end of the experiment, the cells were killed by the addition of the detergent Triton X-100, and a zero baseline was achieved. It was shown that oxygen consumption can be measured outside the cell cultivation area. The sensors in the inlet can serve as a control.
The lactate and glucose biosensors are placed in the outlet channel to protect the cells from the produced hydrogen peroxide. The cell culture medium with glucose and fetal bovine serum has a background level of both analytes. With the analytes glucose and lactate always present, during the stop phase, an increase in the signal occurs due to the accumulation of produced hydrogen peroxide at the electrode. Once the flow starts and the hydrogen peroxide is flushed away, the signal quickly returns to its baseline. Once the medium from the cell culture area passes the electrode, the lactate signal increases due to the lactate produced by the cells during the stop phase. For glucose, the signal drops in the flow phase as the consumed medium passes the electrode due to the glucose consumption of the cells in the stop phase. This behaviour can be observed in Fig. 4c and d. The rise/drop of the lactate and glucose peaks is a distinct characteristic signal, and the lactate production and glucose consumption during the stop phase can be determined by the peak height in the flow phase.
The efficient medium exchange by microfluidics and the integration of the biosensor array in the downstream channel on-chip demonstrate the spatial separation of biosensors and cell culture area. The sampling and transport of undiluted medium are possible, and the biosensor measurement from low volumes can be performed during the flow phase of a regular stop/flow protocol. The availability of undiluted medium from the cell chamber gives the possibility to determine the absolute metabolic rates of the cultured cells. The total flow volume in one cycle can be as low as 15 μl with a low flow rate of 2 μl min−1 and the analytes are quantified from ~5 μl chamber volume. Stop times of 3–5 min and flow times of 5–15 min were used for evaluation. The signal from cellular metabolism is determined by the stop time and can be selected according to the desired effect. The minimum flow time has to be enough to completely flush the chamber. For evaluation, longer flow phases were sometimes used. The minimum cycle times to acquire the desired metabolic signal can be determined from the transient sensor signals and could be much shorter than the cycle times shown here.
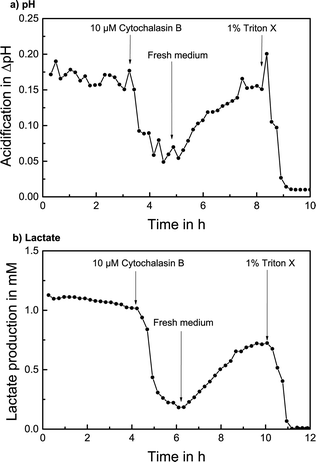
Cytochalasin B (CB) is a commonly used compound which blocks glucose transport into the cell by binding to the transporter proteins in the cell membrane and thus inhibits glucose metabolism inside the cell.22 The reversibility of the mechanism makes it suitable for measuring recovery effects. No effect of CB on the sensor performance was observed.
The measurement of extracellular acidification of T98G cells with the addition of CB is shown in Fig. 6a. A stable acidification rate with no significant change with respect to the noise and over 0.15 pH units acidification per cycle was determined over 3 hours in stop/flow cycles with regular cell culture medium. 10 μM CB was added to the medium; consequently, the extracellular acidification decreased quickly. Once regular medium is used again, a recovery process sets in and extracellular acidification rises to almost the initial value within 3 hours. The addition of 1% of the detergent Triton X-100 destroys the cells and a stable baseline is reached.
A stop flow measurement of lactate production with the addition of CB is shown in Fig. 6b. After determining a lactate production of over 1 mM per cycle for 4 hours, 10 μM CB was added and the lactate production decreased immediately to around 25%. After regular medium is supplied, the lactate production noticeably increased again to around 75% of the original value within 4 hours. The termination with Triton X again verifies the signal.
The alteration of cellular metabolism by the addition of the compound CB and the subsequent recovery effect with a corresponding quantifiable increase in extracellular acidification and lactate production rate upon addition of regular medium could be successfully measured, demonstrating the drug screening application and investigation of pharmacodynamics effects.
4. Conclusion
We have developed a novel multiparametric microphysiometry system for the dynamic online monitoring of cellular metabolism of cultured human cancer cells. The optically transparent, gas-tight, hybrid, modular microsystem is based on a glass chip and features cell cultivation and microfluidics. pH and oxygen can be measured in the cell culture area and downstream; biosensors are connected downstream by microfluidics. Optical transparency allows inverted phase contrast microscopy of culture and measurement at all times.The wafer-level fabrication features thin-film platinum and electrodeposited iridium oxide microelectrodes on a glass chip, microfluidics in an epoxy resist and a hybrid assembly. A reference electrode and biosensors for lactate and glucose are included on-chip.
The reliable analytical performance of the sensors was demonstrated in cell culture medium. The pH sensors exhibit a long-term stable response. The oxygen sensors show a long-term stable, linear behaviour, which was also observed for low dissolved oxygen concentrations. Biosensor functionality was demonstrated in glucose and lactate measurements showing linear, long-term stable, selective and reversible behaviour in the desired measurement range.
T98G human brain cancer cells were successfully cultivated, and cell culture metabolism was successfully measured on-chip. Medium with metabolite levels altered by cellular metabolism could be measured inside the chamber as well as transported and measured outside the chamber with the help of microfluidics. Stop/flow pump cycles were applied and extracellular acidification, respiration, glucose consumption and lactate production could be quantified. It was demonstrated that all parameters can be successfully measured outside the cell cultivation chamber by measuring downstream during the flow phase. A spatial separation of biosensors from the cell cultivation area was hereby realised. A highly effective medium change in the cell culture chamber with low flow rates (2 μl min−1) and low volumes (15 μl per cycle) could be achieved. Sampling the entire undiluted volume of the cell culture chamber and transporting it to the sensors via microfluidics open new possibilities for highly sensitive biosensing. Measurements using fully integrated biosensors promise insight into new biological questions.
Long-term metabolic rates and alterations in cellular metabolism, induced by the addition of substances to the medium, could be successfully detected. The system's performance in the drug screening application was demonstrated: especially in this application, the low volume and the tightly controlled exposure of the cells to the substance are advantageous, because there are often only small amounts of the screened drugs available. In conclusion, a new low-volume tool with optical access for highly sensitive, dynamic, multiparametric, online metabolic monitoring of cell cultures is presented.
Acknowledgements
Funding by the Federal Ministry of Education and Research (BMBF) within the project “Biosens-MetaScreen” (FKZ 16SV2369) is gratefully acknowledged. The authors thank Erik O. Pettersen and Joe A. Sandvik, University of Oslo, for providing cells and support.Notes and references
- D. G. Hafeman, J. W. Parce and H. M. McConnell, Science, 1988, 240, 1182–1185 CAS.
- J. C. Owicki and J. W. Parce, Biosens. Bioelectron., 1992, 7, 255–272 CrossRef CAS PubMed.
- F. Hafner, Biosens. Bioelectron., 2000, 15, 149–158 CrossRef CAS PubMed.
- S. E. Eklund, D. Taylor, E. Kozlov, A. Prokop and D. E. Cliffel, Anal. Chem., 2004, 76, 519–527 CrossRef CAS PubMed.
- S. E. Eklund, R. M. Snider, J. Wikswo, F. Baudenbacher, A. Prokop and D. E. Cliffel, J. Electroanal. Chem., 2006, 587, 333–339 CrossRef CAS.
- S. E. Eklund, R. G. Thompson, R. M. Snider, C. K. Carney, D. W. Wright, J. Wikswo and D. E. Cliffel, Sensors, 2009, 9, 2117–2133 CrossRef CAS PubMed.
- N. Hu, C. Wu, D. Ha, T. Wang, Q. Liu and P. Wang, Biosens. Bioelectron., 2013, 40, 167–173 CrossRef CAS PubMed.
- R. Ehret, W. Baumann, M. Brischwein, A. Schwinde, K. Stegbauer and B. Wolf, Biosens. Bioelectron., 1997, 12(1), 29–41 CrossRef CAS PubMed.
- M. Lehmann, W. Baumann, M. Brischwein, R. Ehret, M. Kraus, A. Schwinde, M. Bitzenhofer, I. Freund and B. Wolf, Biosens. Bioelectron., 2000, 15, 117–124 CrossRef CAS PubMed.
- M. Lehmann, W. Baumann, M. Brischwein, H. Gahle, I. Freund, R. Ehret, S. Drechsler, H. Palzer, M. Kleintges, U. Sieben and B. Wolf, Biosens. Bioelectron., 2001, 16, 195–203 CrossRef CAS PubMed.
- B. Wolf, M. Brischwein, W. Baumann, R. Ehret and M. Kraus, Biosens. Bioelectron., 1998, 13, 501–509 CrossRef CAS PubMed.
- M. Brischwein, E. R. Motrescu, E. Cabala, A. M. Otto, H. Grothe and B. Wolf, Lab Chip, 2003, 3, 234–240 RSC.
- E. Thedinga, A. Kob, H. Holst, A. Keuer, S. Drechsler, R. Niendorf, W. Baumann, I. Freund, M. Lehmann and R. Ehret, Toxicol. Appl. Pharmacol., 2007, 220, 33–44 CrossRef CAS PubMed.
- P. Mestres and A. Morguet, Expert Opin. Drug Discovery, 2009, 4(7), 785–797 CrossRef CAS PubMed.
- H. Alborzinia, S. Can, P. Holenya, C. Scholl, E. Lederer, I. Kitanovic and S. Wölfl, PLoS One, 2011, 6(5), e19714 CAS.
- A. Weltin, J. Kieninger, I. Moser, G. Jobst, M. Wego, R. Ehret and G. A. Urban, Proceedings of IEEE Sensors, 2010, 2113–2116 Search PubMed.
- P. Ebbesen, E. O. Pettersen, T. A. Gorr, G. Jobst, K. J. Williams, J. Kieninger, R. H. Wenger, S. Pastorekova, L. Dubois, P. Lambin, B. G. Wouters, T. van den Beucken, C. T. Supuran, L. Poellinger, P. J. Ratcliffe, A. Kanopka, A. Görlach, M. Gassmann, A. L. Harris, P. H. Maxwell and A. Scozzafava, J. Enzyme Inhib. Med. Chem., 2009, 24(s1), 1–39 CrossRef CAS PubMed.
- K. Yamanaka, Jpn. J. Appl. Phys., Part 1, 1989, 28(4), 632–637 CrossRef CAS.
- J. Kieninger, A. Marx, F. Spies, A. Weltin, G. A. Urban and G. Jobst, Proceedings of IEEE Sensors, 2009, 2009–2011 Search PubMed.
- I. Moser, G. Jobst and G. A. Urban, Biosens. Bioelectron., 2002, 17, 297–302 CrossRef CAS PubMed.
- G. H. Stein, J. Cell. Physiol., 1979, 99, 43–52 CrossRef CAS PubMed.
- R. Ehret, W. Baumann, M. Brischwein, M. Lehmann, T. Henning, I. Freund, S. Drechsler, U. Friedrich, M.-L. Hubert, E. Motrescu, A. Kob, H. Palzer, H. Grothe and B. Wolf, Fresenius' J. Anal. Chem., 2001, 369, 30–35 CrossRef CAS PubMed.
| This journal is © The Royal Society of Chemistry 2014 |

