Application of microchip assay system for the measurement of C-reactive protein in human saliva
Nicolaos
Christodoulides
a,
Sanghamitra
Mohanty
a,
Craig S.
Miller
d,
M. Chris
Langub
e,
Pierre N.
Floriano
a,
Priya
Dharshan
a,
Mehnaaz F.
Ali
a,
Bruce
Bernard
a,
Dwight
Romanovicz
a,
Eric
Anslyn
a,
Philip C.
Fox
f and
John T.
McDevitt
*abc
aDepartment of Chemistry & Biochemistry, The University of Texas at Austin, Austin, TX 78712, USA. E-mail: mcdevitt@mail.utexas.edu; Fax: 512-232-7052; Tel: 512-471-0046
bCenter for Nano and Molecular Science and Technology, The University of Texas at Austin, Austin, TX 78712, USA
cTexas Materials Institute, The University of Texas at Austin, Austin, TX 78712, USA
dCollege of Dentistry, University of Kentucky, Lexington, KY 40536, USA
eDepartment of Internal Medicine, Division of Nephrology, The University of Kentucky General Clinical Research Center, Lexington, KY 40935-0298, USA
fDepartment of Oral Medicine, Carolinas Medical Center, Charlotte, NC 28232, USA
First published on 13th January 2005
Abstract
In the last decade, saliva has been advocated as a non-invasive alternative to blood as a diagnostic fluid. However, use of saliva has been hindered by the inadequate sensitivity of current methods to detect the lower salivary concentrations of many constituents compared to serum. Furthermore, developments in the areas related to lab-on-a-chip systems for saliva-based point of care diagnostics are complicated by the high viscocity and heterogeneous properties associated with this diagnostic fluid. The biomarker C-reactive protein (CRP) is an acute phase reactant and a well-accepted indicator of inflammation. Numerous clinical studies have established elevated serum CRP as a strong, independent risk factor for the development of cardiovascular disease (CVD). CVD has also been associated with oral infections (i.e. periodontal diseases) and there is evidence that systemic CRP may be a link between the two. Clinical measurements of CRP in serum are currently performed with “high sensitivity” CRP (hsCRP) enzyme-linked immunosorbent assay (ELISA) tests that lack the sensitivity for the detection of this important biomarker in saliva. Because measurement of salivary CRP may represent a novel approach for diagnosing and monitoring chronic inflammatory disease, including CVD and periodontal diseases, the objective of this study was to apply an ultra-sensitive microchip assay system for the measurement of CRP in human saliva. Here, we describe this novel lab-on-a-chip system in its first application for the measurement of CRP in saliva and demonstrate its advantages over the traditional ELISA method. The increased sensitivity of the microchip system (10 pg ml−1 of CRP with 1000-fold dilution of saliva sample) is attributed to its inherent increased signal to noise ratio, resulting from the higher bead surface area available for antigen/antibody interactions and the high stringency washes associated with this approach. Finally, the microchip assay system was utilized in this study to provide direct experimental evidence that chronic periodontal disease may be associated with higher levels of salivary CRP.
Introduction
The development of analytical devices utilizing microfluidic structures and lab-on-a-chip platforms has shown breakthrough advancements over the last decade, both for chemical as well as biological applications.1–10 Microfluidic lab-on-a-chip systems target clinically relevant biomarkers in physiological fluids with reduced sample, reagent, and assay time requirements, and therefore promise to have a significant impact on clinical diagnostics, especially at the near-patient or point-of-care setting. Miniaturized devices and non-invasive sampling procedures that reduce iatrogenic blood loss and pain, present an ideal combination for point-of-care-testing, especially for geriatric and pediatric patients and for certain intensive care situations.10Interest in saliva as a diagnostic medium has increased dramatically during the last decade, as saliva and other oral fluids have been shown to reflect tissue fluid levels of therapeutic, hormonal, immunological and toxicological molecules. Oral fluids have also been shown to contain bio-markers associated with infectious and neoplastic diseases.11–15 Similarly, the analysis of salivary fluids, like blood-based assays, yields useful diagnostic information for the assessment and monitoring of systemic health and disease states, exposure to environmental, occupational, and abusive substances, as well as for the early identification of harmful agents dispersed by bio-terrorist activities.16
The major advantages for using saliva in diagnosis relative to blood-based assays have been described in some detail previously.13,17–21 Most importantly, collection of saliva may be done by procedures that are considered to be non-invasive, painless and convenient. Consequently, these methods may be performed several times a day under circumstances where it may be difficult to collect whole blood specimens.
Clearly, major advances related to salivary diagnostics depend strongly on the availability of high quality diagnostic procedures that provide practical solutions for measurement of numerous analytes at physiological concentrations within this ultra-complex biomatrix. Likewise, before a salivary protein becomes associated with a particular disease, it is imperative to first have a suitable method for its detection and measurement. From this perspective, the present lack of practical detection methodologies represents a major limiting factor, because most current assay systems do not provide the necessary sensitivity for the detection of biomarkers present at the low, but still patho-physiologically relevant, concentrations in saliva.
One such biomarker whose measurement in saliva could potentially contribute in a significant manner to the understanding and diagnosis of disease is C-reactive protein (CRP). This important inflammation marker is a non-glycosylated 118 KD ubiquitous protein found in both vertebrates and invertebrates.22 The protein belongs to the family of pentraxins, and is a calcium-binding protein consisting of five non-covalently bound, identical, spherical subunits, each with a molecular weight of 20–28 KD. In humans, CRP is derived from the liver and its production is regulated by cytokines, such as tumor necrosis factor (TNF)-α, interleukin (IL)-1β and IL-6.23–29 The CRP biomarker was originally defined as a substance observed in the plasma of patients with acute infections that reacted with the pneumococcal C-polysaccharide. It is now classified as a characteristic acute phase reactant in human serum and a classic marker of inflammation.23
Recent clinical and epidemiological studies have demonstrated the association between inflammation and cardiovascular disease (CVD).30–33 Likewise, serum CRP has been defined as a strong, independent risk factor for heart disease. More specifically, it has been shown that chronic, minor elevations of CRP are predictive of both CVD in apparently healthy individuals and of future cardiovascular events in patients with coronary heart disease.34 In fact, CRP has been found to be a stronger predictor of cardiovascular events than has high-density lipoprotein cholesterol (HDL) level.30 Evidence suggests that CRP may be directly involved in atherosclerosis by amplifying the anti-inflammatory response through complement activation, tissue damage, and activation of endothelial cells.35
Several groups have reported elevated serum CRP levels in periodontal disease patients.36,37 The extent of increase in serum CRP levels in periodontitis patients correlates significantly with the severity of the disease, even with adjustments for smoking habits, body mass index, triglycerides, and cholesterol levels. Interestingly, there seems to be an indirect association between the occurrence of periodontal conditions and an increased risk for CVD.38,39 The positive correlation between serum CRP with both periodontal disease and CVD may indicate that circulating inflammatory molecules contribute to the pathogenesis of both conditions.
Unfortunately, to date few studies have been completed to explore in a systematic way the level of CRP in the fluids of the oral cavity. Studies of this type are therefore needed to further explore the relationship of these two important inflammatory diseases. Commercially available “high sensitivity” CRP (hsCRP) kits, based on the Enzyme-Linked ImmunoSorbent Assay (ELISA) method, with a limit of detection at 1.0 ng ml−1, have facilitated serum studies of CRP levels. However, no method has yet been reported to measure CRP effectively in saliva specimens.
We have previously reported the development of a novel microchip-based detection system for measuring analytes such as acids, bases, electrolytes and proteins in solution phase. This lab-on-a-chip system is based on the electronic taste chip (ETC) approach. The sensor array platform performs chemical and immunological reactions on and within the interior regions of microspheres positioned in the inverted pyramidal microchamber wells of a silicon or plastic microchip.40–48 Microfluidic structures deliver a series of small-volume reagents and washes to the chip and to each of the microspheres. Optical signals generated by the reactions on the microspheres are visualized at, and captured by, a charge-coupled device (CCD) video chip along with the use of transfer optics. Using the ETC system, complex immunological assays can be performed with small sample volumes, short analysis times, and markedly reduced reagent costs. This integrated and automated system has been adapted previously for the measurement of CRP and other markers of inflammation in the context of serum measurements.43 Herein, we report the extension of this lab-on-a-chip system for the initial measurements of CRP levels in saliva. This newly fashioned ultra-sensitive method extends the saliva-based diagnostics to significantly lower CRP levels, as needed for measurement of patients with healthy oral conditions, therefore allowing for the first comparison of CRP levels between healthy, periodontitis and edentulous patients. This work represents the initial lab-on-a-chip study of inflammatory markers in salivary fluids.
Methods and materials
Saliva and serum sample collection
Unstimulated whole saliva was collected at the College of Dentistry, University of Kentucky as described previously.49 Briefly, after a rinse of the mouth with water, saliva was allowed to accumulate in the floor of the mouth for approximately 2 min and repeatedly expectorated into a test tube to collect ∼5 mL. Following collection, the samples were aliquoted and immediately stored at −70 °C until their transport over dry ice to The University of Texas at Austin for further testing. The duration of transportation and storage was no more than 2 days and 3 weeks, respectively.In selected cases, whole blood was collected via venipuncture from study participants. Blood was centrifuged to separate the clotted pellet from the supernatant serum, and the serum was stored frozen at −80 °C until testing for CRP using the ELISA method (at The University of Kentucky) and ETC methodology (at The University of Texas at Austin).
Subject population and study design
This study was approved by the Institutional Review Boards of The University of Texas at Austin and The University of Kentucky. Three groups of adult patients matched by race and age participated. The first group consisted of 15 normal healthy volunteers without any clinically detectable periodontal lesions. Specifically, this group of patients had at least 20 teeth with less than 10% of periodontal sites with bleeding on probing, less than 2% probing depths greater than or equal to 5 mm, less than 1% of interproximal sites with clinical attachment loss of greater than 2 mm, no evidence of radiographic bone loss as determined by posterior vertical bitewings films, and no pocket depth sites greater than 5 mm. The second group was derived from 15 patients with periodontal disease. This class of patients had noticeable loss of connective tissue attachment and bone around the teeth in conjunction with the formation of periodontal pockets due to the apical migration of the junctional epithelium. Specifically, the second group was comprised of individuals with at least 20 teeth with greater than 30% of periodontal sites with bleeding on probing, greater than 20% probing depths greater than or equal to 4 mm, and greater than 5% of interproximal sites with clinical attachment loss of greater than 2 mm, and evidence of radiographic bone loss as determined by posterior vertical bitewings films. The third group consisted of 6 edentulous subjects who had been without teeth for at least 6 weeks.ELISA testing
Serum and saliva samples were tested for CRP using a clinically validated hsCRP ELISA kit as obtained from ALPCO (Windham, NH). The CRP standards provided in the kit were also tested against standards used in the ETC method (Cortex Biochemical, San Leandro, CA), and a correction factor derived from that comparison was applied in the validation studies of the ETC method.ETC testing
Agarose microbeads used in The University of Texas at Austin lab-on-a-chip studies were obtained from Agarose Bead Technologies (Lowell, MA). The CRP-specific antibodies were purchased from Accurate Chemical, Scientific Corporation (Westbury, NY) and Biogenesis (Kingston, NH). Alexafluor-488 was conjugated to the detecting antibody using a commercially available kit from Molecular Probes (Eugene, Oregon). The CRP standards were obtained from Cortex Biochemical (San Leandro, CA). The CRP-depleted serum was obtained from International Enzymes (Fallbrook, CA). Anti-Helicobacter pylori antibody was obtained from Accurate Chemical and Scientific Corporation (Westbury, NY).Bead sieving and deritivization
The diameter of the commercial beads varied between 180–450 µm. As the precision of the ETC assay is highly dependent on the size homogeneity of its component sensor beads, beads were first exposed to a sieving process that produced a consistent population of micro-spheres 280 ± 10 µm. The CRP-specific and control (rabbit anti-H. pylori) antibodies were then coupled to the beads by reductive amination, as described previously.43Assay conditions
All assays on the ETC system were performed at room temperature under continuous fluid flow conditions. Prior to each assay, beads and the inner walls of the capillary tubing used to introduce reagents to the flow cell were blocked with 3% bovine serum albumin (BSA) in phosphate buffered saline (PBS). For saliva testing, CRP standards were serially diluted in PBS, and saliva samples were tested following a 1000-fold dilution with PBS. For serum testing, CRP standards were prepared in a diluent consisting of CRP-depleted serum and a 1% BSA/PBS (1∶9 ratio). Serum samples were tested after they were diluted 100-fold in the same diluent. Standards and samples were delivered to the flow cell for 5 minutes, followed by a PBS wash, delivery of Alexafluor488-conjugated detecting antibody for another 5 min, and a final PBS wash. In colorimetric assays, utilizing horseradish peroxidase (HRP)-conjugated visualization antibodies, the presence of captured analyte was detected following injection of the chromogenic and precipitable HRP substrate, 3-amino-9-ethylcarbazole (AEC). The immunological components of the beads were regenerated with solution phase exposure to 0.1 M glycine-HCL buffer (pH 2.5) and then re-equilibrated with PBS.Confocal microscopy
Confocal images of beads utilized in ETC assays were captured with a Leica TCS 4D (Bannockburn, IL) confocal microscope equipped with a Kr/Ar mixed gas laser and DIC optics.Automated data acquisition methods
To acquire the optical data, a software-controlled utility was applied to a selected area of interest (AOI) around each bead in the array as described previously.32–40 The average signal intensity of each AOI was exported to a data spread sheet. Statistical procedures were applied to calculate the average signal from 9 redundant CRP-sensitized beads generated in response to the sample. This value was compared to the standard curve to determine the unknown CRP concentration using standard curve fitting protocols.Results and discussion
ETC assay system
In the microchip assay system described herein, immunoassays are performed on porous beads, positioned in a micro-etched array of wells on a silicon wafer/chip platform (Fig. 1a). Each bead within the array serves as its own independent self-contained micro-reactor structure, with its selectivity determined by the specificity of the antibody that it hosts. The bead-loaded chip is sandwiched between two optically transparent polymethylmethacrylate (PMMA) inserts, packaged within a metal casing described here as the “flow cell” (Fig. 1b). This flow cell allows for delivery of sample and reagents to the microchip and the associated beads. Fluids are delivered via the top inlet, evenly soaking the beads located therein. The unspent reagents are directed to a waste reservoir through the bottom drain element. Images of fluorescent (via epi-illumination) or colorogenic (via transmission mode) beads are captured with a digital video chip (Fig. 1c) and analyzed to facilitate detection and, ultimately, quantitation of analytes in complex fluids.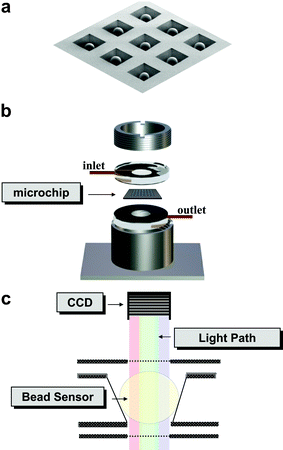 | ||
| Fig. 1 A scanning electron microscopy (SEM) micrograph of a 3 × 3 array of agarose beads positioned in wells micro-etched into a silicon microchip is shown in (a). The bead-loaded microchip is positioned between two transparent PMMA inserts and packaged into a metal casing (b). Signals generated on the beads are captured with a charge-coupled device (CCD) (c). | ||
CRP immunoassay on ETC system
A sandwich-type immunoassay used for the measurement of CRP on the ETC lab-on-a-chip system is shown in Fig. 2a. Here, a polyclonal rabbit CRP-specific antibody coupled to an agarose bead sequesters CRP within and around the bead. A detecting antibody is used to visualize the bead-captured analyte. For fluorescent-based detection, an Alexafluor-488-conjugated antibody is employed. For colorimetric detection, a horseradish-peroxidase-conjugated antibody is used in conjunction with its colorimetric substrate, AEC, which produces a red–brown precipitate that penetrates into the bead interior. The observation methods for the colorimetric and fluorescence detection modalities in the microchip system are virtually the same. In both cases, signals generated on the beads are visualized and captured by a CCD camera positioned above the array. Different between the two detection modalities is the direction from which the bead array is illuminated. This, in turn, affects the portion of the bead that is visualized and eventually analyzed. More specifically, in the fluorescence mode, light is directed to the beads from above (i.e. in the epi-fluorescence mode), while in the colorimetric modality, the array is illuminated from below (i.e. with transmitted light). Consequently, in contrast to fluorescence, whereby the whole bead is visualized, the colorimetric approach produces an image of a square portion of the bead, whose size is defined by the size of the bottom opening of the micro-etched well on the silicon chip.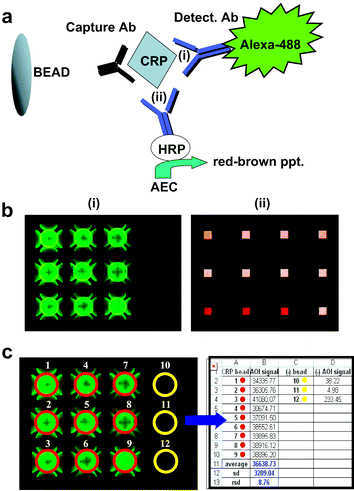 | ||
| Fig. 2 The relevant immunocomplexes of the bead-based CRP assay are shown in schematic form in (a). Detection of the captured analyte is achieved either in fluorescence (i) or colorimetric (ii) modes. A typical result for each approach is shown in (b). An image showing a population of ∼280 μm bead micro-reactor elements is captured digitally and analyzed in an automated fashion with a macro that measures the signal intensity of an area of interest (AOI) around each bead in the array (c). The average signal intensity of each AOI is exported to a data spread sheet. | ||
Typical results for each of the detection modalities are shown in Fig. 2b. In both cases, the background signal on negative control beads coupled to irrelevant rabbit immunoglobulin is minimal. From these two modes of detection, the fluorescent-based approach is chosen as the preferred method here for the CRP assay for a number of reasons. First, it requires no substrate and thus requires fewer steps than its colorimetric counterpart, thereby yielding more rapid assay times. Second, the method based on fluorescence provides for a more sensitive assay. Third, it allows for more cycles of bead regeneration (data not shown). For the latter feature, an elution buffer is used to efficiently remove the CRP analyte and detecting antibody from the beads without affecting the quantity or quality of the capturing antibody. This feature allows for successive assay cycles to be carried out without loss of specificity or sensitivity for CRP.43 This unique assay characteristic facilitates the development of an automated system, whereby one set of beads may be recycled and used sequentially for multiple assays, including those necessary for the generation of the standard curve and testing of unknowns. After each trial, the final image of the bead array is captured with the CCD, digitally processed and analyzed (Fig. 2c), and the signal intensity converted for each bead into a quantitative CRP measurement using the generated standard curve.
Measurement of salivary CRP by ETC and ELISA
One particularly interesting characteristic of the ETC-based assay system is that the dose response to CRP varies with the choice of solvent matrix, as shown in Fig. 3. Interestingly, the ELISA system when tested in a similar capacity shows only a modest influence of running buffer (data not shown), while the ETC system reveals a strong dependence on buffer composition. Thus, the choice of buffer can been used to tailor the analysis range as needed for various application settings. In the case of saliva measurement of CRP in healthy patients, PBS is selected because of the ultra-low detection capabilities provided by this matrix (vide infra).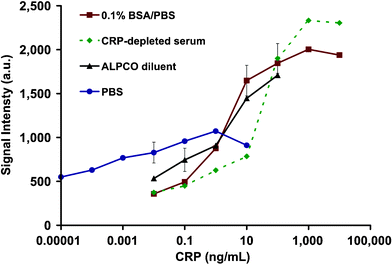 | ||
| Fig. 3 The average green fluorescence intensities (in arbitrary units, a.u.) of agarose beads exposed to various concentrations of CRP in either PBS, 0.1% BSA/PBS, diluent of the commercially available (ALPCO) hsCRP ELISA kit and CRP-depleted human serum are shown. The assay performed in the PBS matrix yields the lowest limit of detection. | ||
Fig. 4 shows typical CRP dose response curves obtained with the ETC lab-on-a-chip system (in PBS matrix) along with the data derived from the traditional hsCRP ELISA system. From a comparison of the two methods, it is clear that the ETC approach yields a much lower (by at least 5 orders of magnitude) limit of detection than that exhibited by the standard ELISA procedure. Indeed, the limit of detection exhibited by the ETC approach is lower than all other CRP assays reported in the literature to date. Likewise, with this 12 minute assay procedure (with a detection limit at 5 fg mL−1 and a useful range between 10 fg mL−1 to 10 pg mL−1), it is possible to dilute each saliva sample 1000-fold. This dilution step serves to eliminate problems associated with the high viscosity of the saliva matrix, while still maintaining the capacity to detect and accurately measure CRP concentrations between 10–10,000 pg mL−1. In contrast, the hsCRP ELISA method yields a detection limit of 1 ng mL−1 and a useful detection range of between 2–100 ng mL−1 CRP. Therefore, ELISA does not allow for measurement of CRP in diluted samples. Furthermore, when the hsCRP ELISA assay kit is employed for the measurement of salivary CRP in the 36 subjects participating in this study, CRP is detectable in only 2 of the subjects (5.55%) tested. In contrast, the ETC method measured CRP in 100% of the individuals tested (vide infra).
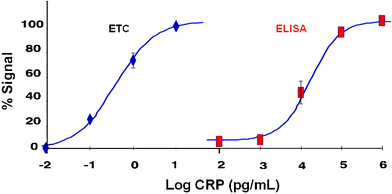 | ||
| Fig. 4 Dose-dependent curves obtained for CRP are shown for both the ETC lab-on-a-chip method as well as hsCRP ELISA method expressed as percent of maximum signal. The ETC lab-on-a-chip approach yields a much lower limit of detection than that exhibited by the standard ELISA procedure. | ||
As the majority of saliva CRP levels are undetectable with ELISA, validation studies of the ETC lab-on-a-chip approach are first performed using serum samples (Fig. 5). Data shown here represent CRP values from 9 serum donors evaluated in parallel by ELISA and the ETC method. With such serum measurements there is excellent agreement between the two methods. Further, the ETC approach is validated in recovery studies. Saliva samples are spiked with known amounts of CRP (10 and 100 pg mL−1) and measured results are compared with the expected value based on the amount added to the sample. Recovery of salivary CRP by ETC is determined to be between 94–100%, while that of ELISA, presumably because of its lack in sensitivity in that CRP concentration range, is much lower at ∼70%. In this set of experiments the precision of the microchip-based CRP assay was also evaluated. Bead to bead signal variation and inter-assay (run to run) variance for the majority of samples tested were both significantly reduced from >30 to <8%, when beads used in the assay were first exposed to a sieving process that produced a consistent population of micro-spheres 280 ± 10 µm.
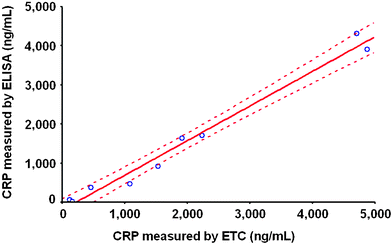 | ||
| Fig. 5 The CRP concentrations from 9 serum samples are measured in parallel with ETC and hsCRP ELISA. The CRP values measured by the two methods are compared and plotted in the provided correlation graph. The two methods are in agreement with correlation coefficient (r) at 0.995 (95% confidence level). | ||
We next took advantage of the low detection threshold for the ETC lab-on-a-chip system as obtained in the PBS matrix to test saliva samples of healthy individuals, edentulous subjects and periodontal disease patients for CRP. As shown in Fig. 6, the healthy and edentulous groups demonstrate significantly lower mean salivary CRP levels (92 and 65 pg mL−1, respectively) compared to the periodontal disease counterpart (mean CRP levels at 2,001 pg mL−1). Furthermore, the ETC lab-on-a-chip system efficiently detects differences in CRP levels between and within each of the groups tested. The CRP values below 225 pg mL−1 define the majority (93.3%) of healthy individuals, whereas CRP levels above this concentration discriminate 86% of periodontal disease subjects (Fig. 7). Statistical analysis of these data reveals that the CRP levels of the patients with high CRP levels (over 225 pg mL−1) are associated with an odds ratio (OR) of 91 for periodontitis (95% confidence interval, 7.35 to 1110.0, P < 0.0001). In contrast, when the same samples are analyzed with hsCRP ELISA, with a detection limit of 1.0 ng mL−1, CRP is detected in only two of the 30 samples tested, both of which are from the periodontal disease group.
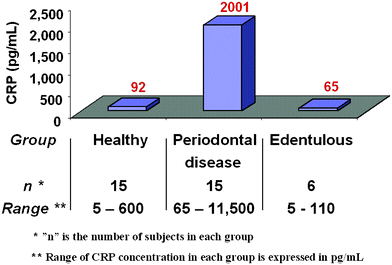 | ||
| Fig. 6 Salivary CRP levels in 15 healthy, 15 periodontal disease and 6 edentulous subjects as measured by the ETC lab-on-a-chip method are shown in the bar graphs. The value above each bar represents the average CRP concentration for each group. The range of CRP concentrations for each group are also shown. | ||
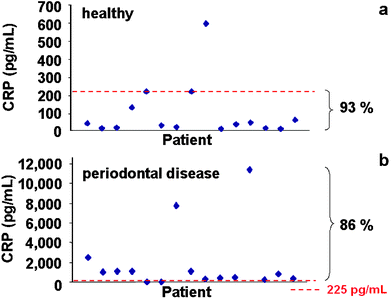 | ||
| Fig. 7 The ETC lab-on-a-chip method is applied for the measurement of CRP in 15 healthy (a) and 15 periodontal disease (b) subjects. Each point on the graph represents the salivary CRP concentration of a subject within each group. The CRP values below 225 pg mL−1 define the majority (93.3%) of healthy individuals, whereas CRP levels above this concentration discriminate 86% of periodontal disease subjects. | ||
A number of key factors contribute to the low detection threshold capabilities of the microchip system. First, with the standard ELISA method slow transport and ineffective rinsing of reagents and analytes occur due to the poor transport properties of these species to the planar surface of the ELISA plate. However, within the ETC lab-on-a-chip system, the integrated microfluidic structures are used to actively transport reagents to the microporous bead elements. While ELISA typically requires 2 or 3 manual washes to reduce nonspecific background binding effectively, by contrast, in the ETC lab-on-a-chip system low bead internal volumes (∼20–30 nL per bead) along with high effective flow rates (1–5 mL min−1) allow for the completion of highly stringent washes (>5000 effective washes per minute).40,41,43–48 These washes contribute to further reduction in background signal. Moreover, the use of a porous bead allows for the creation of a long effective path length. Here the entire bead diameter may, in principle, be used for this purpose. On the other hand, a planar surface with modest roughness is typically used as the capture element for ELISA. Likewise, the lack of an effective transport mechanism to drive reagents and analytes to the active region in ELISA, the small sample thickness and ineffective rinse procedures ultimately contribute to the poorer relative performance capabilities for this now standard methodology.
Capture dynamics of CRP analyte on bead micro-reactors
To explore the effectiveness of the bead micro-reactor for capture of the CRP, confocal microscopy measurements are completed using a number of different sampling media. The goal of these studies is to achieve a more complete understanding of the transport, signaling, and capture dynamics of the protein analytes at the surface and within the interior regions of the bead micro-reactors. Quite interestingly, we note large differences between the apparent radial penetration of CRP into the bead interior depending on the choice of running buffer. For example, in PBS it is noted that signals are generated within the center and around the periphery of the bead (Fig. 8a and c). In contrast, in serum the signal appears to be restricted mainly to the periphery of the bead (Fig. 8b and d). These differences in the apparent location and efficiency of immunocomplex formation within the bead matrix may provide some insight into the large differences noted in the buffer dose dependence response data shown in Fig. 3.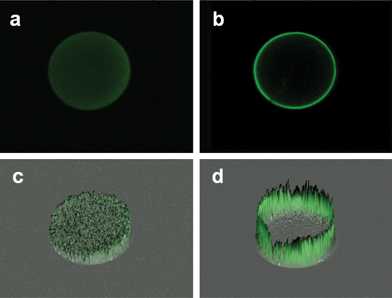 | ||
| Fig. 8 A series of confocal images are obtained for ∼280 μm agarose beads following a typical ETC-based assay for CRP completed in PBS or serum. Shown here are the median slices of each bead (a and b) and their corresponding fluorescence intensity topomaps (c and d, respectively) demonstrating the capture dynamics of the CRP analyte on the bead when the assay is performed in PBS (a and c) and serum (b and d) matrices. | ||
The use of porous beads thus may provide information not only with respect to the raw signal derived from the aggregate of the bead, but also may yield information on the radial distribution of captured analyte. Indeed, prior literature reports have indicated that CRP in serum exists predominantly as a pentamer and that this structural element is stable as long as sufficient calcium is present in the solution.50,51 In the absence of this calcium content, the pentamer dissociates into monomers in an irreversible fashion.51 It is therefore not surprising that in serum pentameric CRP (∼108 KD) could form an immunocomplex with the capturing antibody (150 KD) and the detecting antibody (150 KD) that may be too large to penetrate effectively into the bead interior region during the time scale of the assay sequence. Further, the combination of high avidity effects along with the use of polyclonal capture antibodies may lead to multi-dentate interactions for the pentamer that are absent or reduced in number relative to those which occur for monomeric systems. These factors may contribute to the capture of CRP at the periphery of the bead in pentameric form. In contrast, in PBS and in the absence of calcium, CRP is expected to be present in its monomeric form and therefore, it is expected to be captured in and around the bead, creating conditions that favor an assay with an extremely low detection limit. This potential capacity to distinguish between the two structural states of CRP is a unique characteristic of the microchip bead-based approach that is not possible with the standard ELISA methodology. Further studies are required to resolve more completely these intriguing phenomena but, none the less, the use of the radial component as here described provides new insight into the immunocomplex formation processes that occur within the confines of microfluidic structures. The present studies here reported yield information suggestive of interesting new imaging characteristics that can be used with a combination of microfluidic elements to yield interesting assay characteristics as well as useful scientific insight into protein associations that occur within complex fluids.
Conclusions
A multi-disciplinary effort merging chemistry, dentistry, and immunology with engineering, physics and computer sciences, has contributed to development of a versatile lab-on-a-chip assay system that has been applied successfully in this study for the measurement of CRP in saliva. Unlike ELISA, where slow steps are associated with diffusion of reagents, the superior assay characteristics of the ETC lab-on-a-chip system may be attributed to the active transport of its reagents and small size of its components. These features allow for a more efficient delivery of reagents and more stringent washes. Signals generated in the confined volume of the bead are thus significantly larger and the non-specific background signal lower. In contrast to ELISA, in which antigen–antibody interactions are generated on a single layer on the bottom surface of the well, the ETC system benefits from the use of porous beads, that allow for a greater number of antibody molecules to capture, and thus detect, CRP at extremely low concentrations.In addition, unlike ELISA, this ETC lab-on-a-chip system is amenable to full automation and allows multiplexing of theme-specific groups of analytes, thus promoting a more comprehensive approach to disease risk assessment. The successful implementation and integration of microbead arrays along with microfluidic structures has led to a flexible miniaturized total analysis system. We envision the development of portable devices to be used at the point-of-care setting, such as the dentist's, or physician's office, in the near future. Significant effort at The University of Texas at Austin is currently being directed toward the development of portable instrumentation suitable for point-of-care measurements.
The ETC lab-on-a-chip system has benefited the advancement of saliva as a diagnostic fluid by providing an ultra-sensitive test for the measurement of an important inflammatory marker, CRP, in this biological fluid matrix. We have successfully demonstrated the presence of CRP in saliva and detected significant differences in concentrations between periodontally-healthy individuals and those with chronic gingival inflammation and alveolar bone loss (periodontitis). Further, it has been established here that this lab-on-a-chip methodology has sufficient sensitivity and selectivity to detect CRP levels across the entire pathophysiological range for this protein in saliva samples. These findings, along with prior indirect associations between periodontal disease occurrence and heart disease, suggest that this new methodology may in the future facilitate further studies on the association between oral inflammatory biomarkers and systemic conditions. Larger scale studies are now in progress to further evaluate these initial findings that suggest salivary CRP is associated with periodontal disease. The expansion of the ETC lab-on-a-chip sensor methodologies to other important inflammatory markers, as well as the evaluation of the partitioning of these protein biomarkers in various bodily fluids is currently in progress.
Acknowledgements
Funding for this project was provided by the National Institute of Health, the Welch Foundation, and the Philip Morris Research Corporation. Special thanks to Dr. Richard J. Kryscio for his help with the statistical analysis of data. The contribution of the General Clinical Research Core of the University of Kentucky to this study is also acknowledged.References
- D. R. Reyes, D. Iossifidis, P.-A. Auroux and A. Manz, Micro total analysis systems.1. Introduction, theory, and technology, Anal. Chem., 2002, 74, 2623–2636 CrossRef CAS.
- T. Vilkner, D. Janasek and A. Manz, Micro total analysis systems. Recent developments, Anal. Chem., 2004, 76, 3373–3385 CrossRef CAS.
- L. J. Kricka and P. Wilding, Microchip PCR, Anal. Bioanal. Chem., 2003, 377, 820–825 CrossRef CAS.
- A. J. de Mello and N. Beard, Dealing with ‘real’ samples: sample pre-treatment in microfluidic systems, Lab Chip, 2003, 3, 11N–19N RSC.
- E. T. Lagally, C. A. Emrich and R. A. Mathies, Fully integrated PCR-capillary electrophoresis microsystem for DNA analysis, Lab Chip, 2001, 1, 102–107 RSC.
- J. P. Landers, Molecular diagnostics on electrophoretic microchips, Anal. Chem., 2003, 75, 2919–2927 CrossRef CAS.
- N. Pamme, R. Koyama and A. Manz, Counting and sizing of particles and particle agglomerates in a microfluidic device using laser light scattering: application to a particle-enhanced immunoassay, Lab Chip, 2003, 3, 187–192 RSC.
- A. J. Tudos, G. A. J. Besselink and R. B. M. Schasfoort, Trends in miniaturized total analysis systems for point-of-care testing in clinical chemistry, Lab Chip, 2001, 1, 83–95 RSC.
- E. Verpoorte, Beads and chips: new recipes for analysis, Lab Chip, 2003, 3, 60N–68N RSC.
- V. Srinivasan, V. K. Pamula and R.B. Fair, An integrated digital microfluidic lab-on-a-chip for clinical diagnostics on human physiological fluids, Lab Chip, 2004, 4, 310–315 RSC.
- R. L. Hodinka, T. Nagashunmugam and D. Malamud, Detection of human immunodeficiency virus antibodies in oral fluids, Clin. Diagn. Lab. Immunol., 1998, 5, 419–426 CAS.
- R. Haeckel, Interpretation of salivary drug concentrations, J. Clin. Chem. Clin. Biochem., 1989, 27, 223–226 Search PubMed.
- I. D. Mandel, The Diagnostic Uses of Saliva, J. Oral Pathol. Med., 1990, 19, 119–125 CAS.
- I. D. Mandel, Salivary Diagnosis—Promises, Promises, Ann. N. Y. Acad. Sci., 1993, 694, 1–10 CAS.
- W. Schramm, R. H. Smith, P. A. Craig and D. A. Kidwell, Drugs of Abuse in Saliva—a Review, J. Anal. Toxicol., 1992, 16, 1–9 CAS.
- A. Aguirre, L. A. Testaweintraub, J. A. Banderas, G. G. Haraszthy, M. S. Reddy and M. J. Levine, Sialochemistry—a Diagnostic Tool, Crit. Rev. Oral Biol. Med., 1993, 4, 343–350 Search PubMed.
- D. B. Ferguson, Current Diagnostic Uses of Saliva, J. Dent. Res., 1987, 66, 420–424 CAS.
- I. D. Mandel, Salivary Diagnosis – More Than a Lick and a Promise, J. Am. Dent. Assoc., 1993, 124, 85–87 Search PubMed.
- I. D. Mandel, A Contemporary View of Salivary Research, Crit. Rev. Oral Biol. Med., 1993, 4, 599–604 Search PubMed.
- D. Malamud, Saliva as a Diagnostic Fluid, Br. Med. J., 1992, 305, 207–208 CrossRef CAS.
- H. C. Slavkin, Toward molecularly based diagnostics for the oral cavity, J. Am. Dent. Assoc., 1998, 129, 1138–1143 Search PubMed.
- H. Gewurz, Biology of C-reactive protein and the acute phase response, Hosp. Pract., 1982, 17, 67–81 Search PubMed.
- I. Kushner and D. L. Rzewnicki, The Acute-Phase Response—General-Aspects, Baillieres Clin. Rheumatol., 1994, 8, 513–530 Search PubMed.
- H. Baumann, G. P. Jahreis and K. K. Morella, Interaction of Cytokine-Response and Glucocorticoid-Response Elements of Acute-Phase Plasma-Protein Genes – Importance of Glucocorticoid Receptor Level and Cell Type for Regulation of the Elements from Rat Alpha-1-Acid Glycoprotein and Beta-Fibrinogen Genes, J. Biol. Chem., 1990, 265, 22275–22281 CAS.
- H. Baumann and J. Gauldie, Regulation of Hepatic Acute Phase Plasma-Protein Genes by Hepatocyte Stimulating Factors and Other Mediators of Inflammation, Mol. Biol. Med., 1990, 7, 147–159 Search PubMed.
- U. Ganter, R. Arcone, C. Toniatti, G. Morrone and G. Ciliberto, Dual Control of C-Reactive Protein Gene-Expression by Interleukin-1 and Interleukin-6, EMBO J., 1989, 8, 3773–3779 CAS.
- S. Depraetere, J. Willems and M. Joniau, Stimulation of Crp Secretion in Hepg2 Cells—Cooperative Effect of Dexamethasone and Interleukin-6, Agents Actions, 1991, 34, 369–375 Search PubMed.
- C. Toniatti, R. Arcone, B. Majello, U. Ganter, G. Arpaia and G. Ciliberto, Regulation of the Human C-Reactive Protein Gene, a Major Marker of Inflammation and Cancer, Mol. Biol. Med., 1990, 7, 199–212 Search PubMed.
- M. K. Ganapathi, D. Rzewnicki, D. Samols, S. L. Jiang and I. Kushner, Effect of Combinations of Cytokines and Hormones on Synthesis of Serum Amyloid-a and C-Reactive Protein in Hep 3b-Cells, J. Immunol., 1991, 147, 1261–1265 CAS.
- P. M. Ridker, High-sensitivity C-reactive protein, inflammation, and cardiovascular risk: from concept to clinical practice to clinical benefit, Am. Heart J., 2004, 148, S19–S26 CrossRef.
- M. B. Pepys and G. M. Hirschfield, C-reactive protein and atherothrombosis, Ital. Heart J., 2001, 2, 196–199 Search PubMed.
- L. M. Biasucci, G. Liuzzo, C. Colizzi and V. Rizzello, Clinical use of C-reactive protein for the prognostic stratification of patients with ischemic heart disease, Ital. Heart J., 2001, 2, 164–167 Search PubMed.
- W. Koenig, C-reactive protein: risk assessment in the primary prevention of atherosclerotic disease. Has the time come for including it in the risk profile?, Ital. Heart J., 2001, 2, 157–163 Search PubMed.
- P. M. Ridker and D. A. Morrow, C-reactive protein, inflammation, and coronary risk., Cardiol. Clin., 2003, 21, 315–325 Search PubMed.
- S. Bhakdi, M. Torzewski, K. Paprotka, S. Schmitt, H. Barsoom, P. Suriyaphol, S. R. Han, K. J. Lackner and M. Husmann, Possible protective role for c-reactive protein in atherogenesis—Complement activation by modified lipoproteins halts before detrimental terminal sequence, Circulation, 2004, 109, 1870–1876 CrossRef CAS.
- S. Ajwani, K. J. Mattila, T. O. Narhi, R. S. Tilvis and A. Ainamo, Oral health status, C-reactive protein and mortality—a 10 year follow-up study, Gerodontology, 2003, 20, 32–40 Search PubMed.
- B. Noack, R. J. Genco, M. Trevisan, S. Grossi, J. J. Zambon and E. De Nardin, Periodontal infections contribute to elevated systemic C-reactive protein level, J. Periodontol., 2001, 72, 1221–1227 Search PubMed.
- J. H. Meurman, S. J. Janket, M. Qvarnstrom and P. Nuutinen, Dental infections and serum inflammatory markers in patients with and without severe heart disease, Oral Surg. Oral Med. Oral Pathol. Oral Radiol. Endod., 2003, 96, 695–700 CrossRef.
- W. H. Wehrmacher, Periodontal disease predicts and possibly contributes to acute myocardial infarction, Dent. Today, 2001, 20, 80–81 Search PubMed.
- J. J. Lavigne, S. Savoy, M. B. Clevenger, J. E. Ritchie, B. McDoniel, S. J. Yoo, E. V. Anslyn, J. T. McDevitt, J. B. Shear and D. Neikirk, Solution-based analysis of multiple analytes by a sensor array: Toward the development of an “electronic tongue”, J. Am. Chem. Soc., 1998, 120, 6429–6430 CrossRef CAS.
- A. Goodey, J. J. Lavigne and S. M. Savoy et al., Development of multianalyte sensor arrays composed of chemically derivatized polymeric microspheres localized in micromachined cavities, J. Am. Chem. Soc., 2001, 123, 2559–2570 CrossRef CAS.
- T. E. Curey, A. Goodey, A. Tsao, J. J. Lavigne, Y. Sohn, J. T. McDevitt, E. V. Anslyn, D. Neikirk and J. B. Shear, Characterization of multicomponent monosaccharide solutions using an enzyme-based sensor array, Anal. Biochem., 2001, 293, 178–184 CrossRef CAS.
- N. Christodoulides, M. Tran, P. N. Floriano, M. Rodriguez, A. Goodey, M. Ali, D. Neikirk and J. T. McDevitt, A microchip-based multianalyte assay system for the assessment of cardiac risk, Anal. Chem., 2002, 74, 3030–3036 CrossRef CAS.
- M. F. Ali, R. Kirby, A. P. Goodey, M. D. Rodriguez, A. D. Ellington, D. P. Neikirk and J. T. McDevitt, DNA hybridization and discrimination of single-nucleotide mismatches using chip-based microbead arrays, Anal. Chem., 2003, 75, 4732–4739 CrossRef CAS.
- S. C. McCleskey, M. J. Griffin, S. E. Schneider, J. T. McDevitt and E. V. Anslyn, Differential receptors create patterns diagnostic for ATP and GTP, J. Am. Chem. Soc., 2003, 125, 1114–1115 CrossRef CAS.
- A. P. Goodey and J. T. McDevitt, Multishell microspheres with integrated chromatographic and detection layers for use in array sensors, J. Am. Chem. Soc., 2003, 125, 2870–2871 CrossRef CAS.
- S. L. Wiskur, P. N. Floriano, E. V. Anslyn and J. T. McDevitt, A multicomponent sensing ensemble in solution: Differentiation between structurally similar analytes, Angew. Chem., Int. Ed. Engl., 2003, 42, 2070–2072 CrossRef CAS.
- S. C. McCleskey, P. N. Floriano, S. L. Wiskur, E. V. Anslyn and J. T. McDevitt, Citrate and calcium determination in flavored vodkas using artificial neural networks, Tetrahedron, 2003, 59, 10089–10092 CrossRef CAS.
- M. Navazesh, Methods for collecting saliva, Ann. N. Y. Acad. Sci., 1993, 694, 72–77 CAS.
- J. E. Volanakis, Human C-reactive protein: expression, structure, and function, Mol. Immunol., 2001, 38, 189–197 CrossRef CAS.
- H. W. Wang, Y. Wu, Y. Chen and S. F. Sui, Polymorphism of structural forms of C-reactive protein, Int. J. Mol. Med., 2002, 9, 665–671 Search PubMed.
| This journal is © The Royal Society of Chemistry 2005 |
