
 Open Access Article
 This Open Access Article is licensed under a
 Creative Commons Attribution 3.0 Unported Licence
A pulse-synchronized microplasma atomic emission spectroscopy system for ultrasmall sample analysis
Takahiro
Iwai
*,
Kensuke
Okumura
,
Ken
Kakegawa
,
Hidekazu
Miyahara
and
Akitoshi
Okino
Department of Energy Sciences, Tokyo Institute of Technology, 4259 Nagatsuta, Midori-ku, Yokohama, Kanagawa 226-8502, Japan. E-mail: t-iwai@plasma.es.titech.ac.jp; Fax: +81 45 924 5689; Tel: +81 45 924 5689
First published on 5th August 2014
Abstract
Regenerative medicine and environmental science require the analysis of ultrasmall samples such as cells and nanoparticles. Therefore, a microplasma atomic emission spectroscopy (AES) system was developed in this study. This system combined microdroplet injection, which can introduce a small droplet of a few tens of picoliters into a plasma excitation/ionization source, with a microhollow cathode plasma source exhibiting a volume of a few microliters. When a 14 pL droplet of 100 mg L−1 sodium solution was introduced into an 8 W DC microplasma, no emission was observed possibly because of an insufficient excitation of the sample at low plasma gas temperature. Therefore, a pulsed discharge, producing high-intensity electric input power, was implemented to give a pulse-synchronized microplasma AES system. A 15 μs pulsed power reaching a maximum value of 100 kW was obtained using a laboratory-built high-intensity pulsed power supply and was applied to generate the plasma. This system achieved an excitation temperature of 7000 K, exceeding that of the common inductively coupled plasma. Pulsed plasma generation and sample droplet introduction into the plasma were synchronized to provide a high-sensitivity AES analysis. To this end, the time interval before the end of the generation and the beginning of the pulsed plasma generation was adjusted using a delay circuit. The optimal delay amounted to 40 ms. A droplet comprising Na, Ca, Mg, and K at 100 mg L−1 was analyzed using this system and the limits of detection equaled 300, 50, 30, and 640 fg for these analytes, respectively.
Introduction
Metallomics was proposed by Haraguchi in 2004 to integrate research areas related to trace metals in living tissue.1 Inorganic trace elements present in living cells, such as metals, are important for expressing physiological function, prompting increasing interest in their qualitative and quantitative analysis. Argon inductively coupled plasma (Ar-ICP) has widely served as an excellent excitation and ionization source in inorganic trace elemental analysis because it facilitates multielemental analysis with high-sensitivity. Lavilla et al. measured the concentration of inorganic elements contained in normal human cells and cancer cells by ICP-mass spectrometry and ICP-atomic emission spectroscopy (ICP-AES) and discussed differences in metal element accumulation in the cells.2 However, conventional sample introduction systems consisting of a spray chamber and pneumatic nebulizer exhibit low efficiency (1–2%) because only small-size droplets are selected and introduced into the plasma, demanding a large sample volume exceeding 100 μL min−1.3 Therefore, these conventional systems can only provide average information on a considerable amount of cells. In contrast, a high-sensitivity analytical system for trace elements in ultralow volume samples, such as specific living cells, is expected to provide insight into cancer generation mechanisms and differentiation processes of pluripotent cells.Direct injection nebulizers (DINs)4–6 and direct injection high-efficiency nebulizers (DIHENs)7–11 have been developed to reduce sample consumption. These nebulizers reduce the memory effect and enhance the sample introduction efficiency. However, large-size droplets introduced into the plasma tend to destabilize it. Moreover, the conical diffusion of large solvent quantities in the plasma diminishes its excitation capacity, reducing its resistance to matrix effects. This causes various problems such as an increase in the oxide ratio and a decrease in sensitivity. Electrothermal vaporization (ETV) is suitable for a small amount of sample introduction and the sensitivity is normally higher than DINs and DIHENs.12 However, this technique needs careful optimization of the working condition and in most cases more difficult to use than nebulizers.
Monodisperse droplet sample introduction systems have been designed to circumvent these issues. In these systems, the sample solution is injected into the plasma as a single droplet instead of being nebulized.13,14 In our research group, microdroplet injection was also developed to introduce single cells into an ICP.15–17 In this system, the sample introduction efficiency equals 100%; in principle and the sample does not tend to diffuse in the plasma. The peak value of the signal increases because the sample is temporally and spatially compressed, producing a high signal-to-noise ratio. Moreover, the inclusion of a sample, such as a single cell in a droplet, enables the analysis of individual ultrasmall samples. A previous study achieved the limit of detection of Ag by applying microdroplet injection to ICP-sector field mass spectrometry,16 suggesting the considerable usefulness of this system as a sample introduction system for ultrasmall sample analysis. A desolvation system for the droplet sample has also been generated to further enhance the sensitivity.17
Although sample introduction methods have improved for ultrasmall sample analysis, few studies have focused on the optimization of the plasma excitation/ionization source. ICPs are too large for ultrasmall sample analysis. When introduced into an ICP by microdroplet injection, a droplet passes through the center axis of plasma and undergoes sequential desolvation, vaporization, atomization, excitation and ionization by the surrounding plasma. The sample volume passing through the ICP is very small, and most of the ICP does not contribute to the sample excitation/ionization process. Moreover, the ICP consumes disproportionately large amounts of power and gas compared with the sample size. In addition, halogens, such as chlorine, bromine, and iodine, are difficult to analyze using an ICP because only argon can be used as plasma gas. Helium ICP has been studied because helium plasma, which shows the highest ionization (24.58 eV) and metastable (19.82, 20.62 eV) energies, is expected to effectively ionize and excite all elements, including halogen elements. However its temperature and plasma density are lower than Ar-ICP and the analytical sensitivity of all elements except halogens is not sufficient, limiting its use.18–23 To improve the analytical performance, the excitation/ionization source should be optimized for microdroplet injection.
In recent years, microplasma, which exhibits a micrometer-scale characteristic length, has attracted remarkable attention from many research fields. Its potential applications, such as material surface hydrophilization,24 gas chromatography detection,25 sterilization,26 and ambient desorption/ionization mass spectrometry,27,28 have been studied. Here, microplasma was utilized as an excitation source for droplet sample analysis. The microhollow cathode discharge, which was employed in this study, is very small, and the scale of the plasma is close to the droplet sample size, facilitating a power density increase. Most of the plasma can be involved in the analysis, and the input power can contribute to sample excitation efficiently. Moreover, helium can be used as plasma gas and halogen elements can be effectively excited and ionized as stated above.
First, a small droplet sample is introduced into a stable plasma generated using a DC power supply, resulting in emission from the plasma. Next, this plasma is generated by a pulsed high-power supply to create the pulse-synchronized microplasma AES system. The pulsed high-power supply immediately provides a significant power to the plasma, making high density and high temperature plasma achievable. Therefore, the synchronization of transient sample introduction by microdroplet injection and transient plasma generation may result in an efficient excitation of ultrasmall samples. The analytical performance of the pulse-synchronized microplasma AES system was evaluated for droplet samples.
Experimental
Chemicals and reagents
A multielement solution prepared from standard solutions (100 μg mL−1 Na, Ca, Mg, K, Kanto Chemical Co., Inc., Japan) was used to evaluate the analytical performance of the microplasma AES system. This standard solution was diluted using ultrapure water (>18.4 MW cm−1) purified using a Milli-Q apparatus (Direct-Q UV 3, Millipore, Bedford, MA).Microdroplet generator
A commercial μDG system was used as a microdroplet generator, similar to that reported by Kaburaki et al.17 This system consisted of a dispenser head (MD-K-167, Microdrop Technologies GmbH, Norderstedt, Germany) and a pulse generator (Multi-Controller MC6, Hantec Ltd., Tsukuba, Japan). The dispenser head consisted of a glass capillary and nozzle tip surrounded by a piezo actuator. Short voltage pulses were applied to the piezo actuator using the driver, pushing droplet samples out of the nozzle tip. The droplet size depended on the capillary inner diameter and a capillary with a 30 μm inner diameter was used in this study to generate a 14 pL droplet. The generation frequency was set at 1–10 Hz.Microplasma excitation source
A cylinder-type microhollow cathode discharge was employed as a microplasma excitation source.28 Molybdenum was used as an electrode material because of its high melting point (2896 K) and high chemical stability. A 1 mm thick insulating glass plate was sandwiched between two 800 μm thick molybdenum electrodes, and a small hole (500 μm in diameter) was punched at the electrode center. Each plate was fixed using a silicone rubber type bond. Helium was flowed into the small hole at a rate of 300 mL min−1 using a mass flow controller (MC-200CCM-D, Alicat Scientific, Inc., Tucson, AZ, USA), and voltage was applied to the electrodes to generate the plasma. A DC power supply (LS7-85R1, Knight Power Inc., Yauco, Puerto Rico) and laboratory-built pulsed high-power supply were used. The DC power supply voltage was set at 1 kV. Under this condition, the voltage between the electrodes, discharge current, and power consumption amounted to 250 V, 32 mA, and 8 W, respectively. The pulsed high-power power supply has been described in detail by Iwai et al.28 In this power supply, the capacitor releases the main discharge pulse into the discharge region via a short-duration high-voltage ignition pulse immediately after breakdown, generating the pulsed plasma. The discharge repetition frequency can be controlled by changing the frequency of the voltage applied to the thyristor, which is serially connected to the capacitor for the ignition pulse. Ignition pulse and main discharge pulse peak intensities can easily be adjusted by changing the DC charging voltage of the capacitors. In this study, the capacitance of the main discharge capacitor and the charging voltage were set at 12 μF and 300 V, respectively.Microplasma atomic emission spectroscopy system
The emission from a droplet sample was analyzed by joining the microdroplet generation system to the microplasma excitation source. Fig. 1 shows a schematic of the analytical system. The nozzle tip of the microdroplet generation system and the discharge region of the microhollow cathode electrode were connected by a glass tube. This 3 mm inner diameter and 120 mm long glass tube presented one tapered tip that matched the diameter of the discharge region. The droplet sample was injected by microdroplet generation and introduced into the discharge region through the glass tube using helium as a carrier and plasma gas at 300 mL min−1. The plasma emission was guided by an optical fiber placed 10 mm from the discharge region and measured using a multichannel spectrometer (HR4000, Ocean Optics. Inc., Dunedin, FL, USA). The spectrometer integration time was set at 100 ms. Plasma generation and droplet sample arrival needed to be synchronized because the duration of the plasma was transient. As shown in Fig. 2, this synchronization was achieved by inputting the synchronous signal accompanying droplet generation generated by the pulse generator into the external trigger input terminal of a function generator (WF1974, NF Corporation, Yokohama, Japan) first. Next, using a delay circuit in the function generator, the delayed signal corresponding to the time between droplet generation and arrival at the electrode was input into the switching circuit of pulsed high-power supply to adjust the plasma generation timing.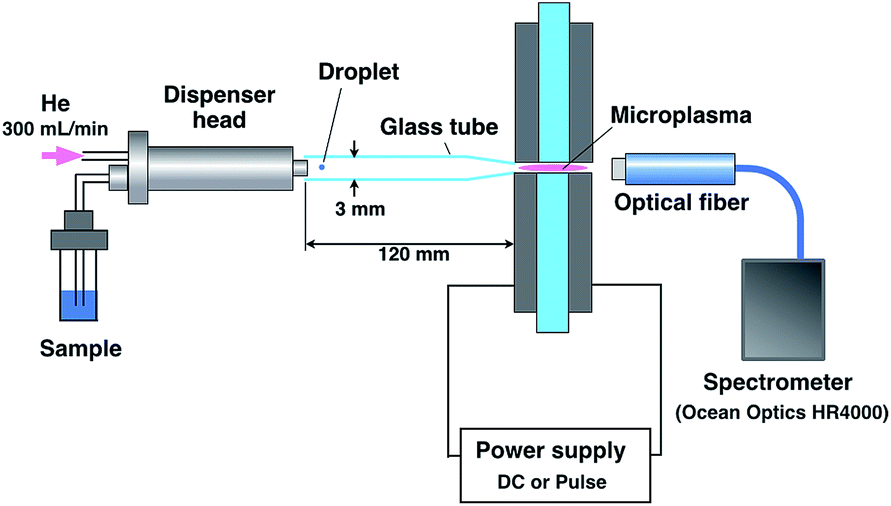 | ||
| Fig. 1 Analytical system for droplet samples using a microplasma. | ||
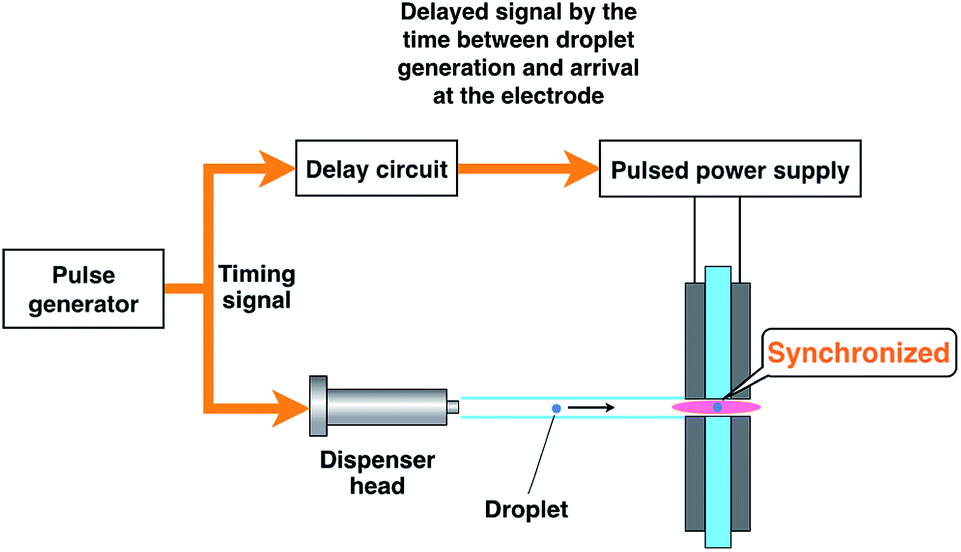 | ||
| Fig. 2 Synchronization of plasma generation and droplet sample introduction. | ||
Results and discussion
Atomic emission spectroscopy using a DC microplasma
A droplet sample of 100 mg L−1 standard solution containing Na, Ca, Mg, and K was analyzed using a DC microplasma. In this analysis, the steady DC plasma facilitates droplet sample introduction. To induce emission from only one droplet, the droplet generation frequency was set at 10 Hz. An analytical result is shown in Fig. 3. Upon droplet sample introduction, the helium emission intensity decreased, whereas the emission intensity of the hydrogen atomic line and OH rotational spectra increased. However, no emission was observed from the sample under these conditions possibly because of the lower excitation temperature of the DC plasma compared with that of Ar-ICP (microplasma: 2300 K, Ar-ICP: 4500–5100 K (ref. 29)), which reduces the excitation energy.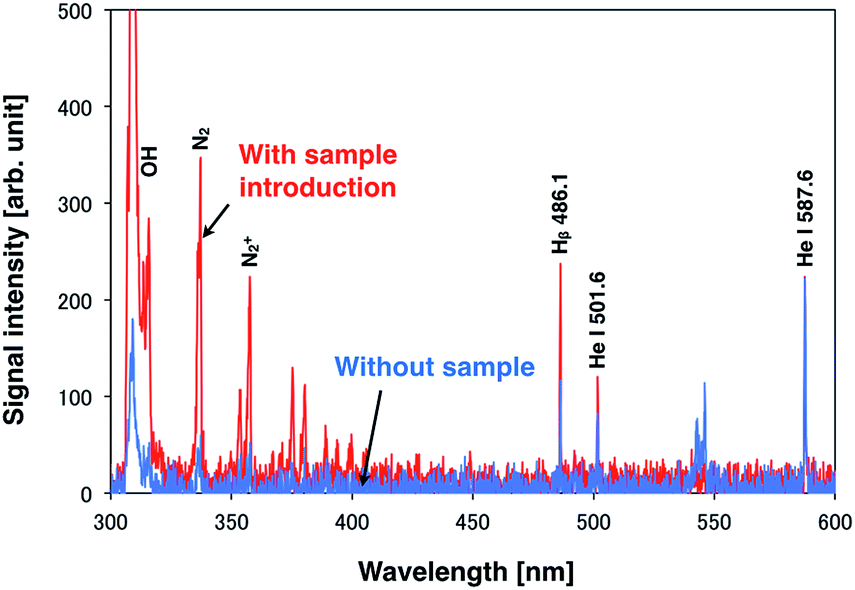 | ||
| Fig. 3 Spectroscopic analysis of a 14 pL single droplet sample of a 100 mg L−1 solution containing Na, Ca, Mg, and K by using a DC microplasma. | ||
Optimization of the pulse-synchronized microplasma AES system
A high-power plasma is needed to sufficiently excite the sample species. However, plasma tends to be thermalized under high DC applied power, often causing electrode melting and breakage. Therefore, a pulse-synchronized microplasma AES system was developed using a pulse-driven plasma as the excitation source. Using the pulsed high-power supply created by Iwai et al., a short pulse power (maximum power: 100 kW, pulse width: 15 μs) was input into the plasma, which reached a maximum excitation temperature of 7000 K.28 The electron number density of the helium plasma amounted to 3.7 × 1015 cm−3, approximating as that of Ar-ICP (5.1 × 1015 cm−3).30 To analyze the droplet sample by pulse-driven plasma, plasma generation and sample introduction were synchronized because of their transient nature. The time between droplet generation and arrival at the electrode was measured to determine optimal synchronization conditions. The voltage between electrodes was known to drop upon introduction of the droplet sample into the DC microplasma. Therefore, the time interval between voltage application to the piezo actuator in the microdroplet generation system and voltage depression of the electrodes was measured. The synchronous signal accompanying droplet generation generated by the pulse generator and the waveform of the voltage between the electrodes are shown in Fig. 4. The time difference between the voltage peaks provided a delay of about 40 ms between droplet generation and arrival at the electrode. Next, the relationship between the emission intensity of Na I 588.99 nm and the delay between the droplet sample and plasma generation was determined by varying this delay. The droplet sample contained 100 mg L−1 Na solution. Droplet sample generation and discharge repetition frequencies were set at 1 Hz. As shown in Fig. 5, the emission intensity of Na reached a maximum when pulsed plasma generation occurred 40 ms after droplet generation, suggesting that plasma generation and droplet sample introduction were synchronized at a delay of 40 ms. This result is consistent with the time measured between droplet generation and arrival at the electrode.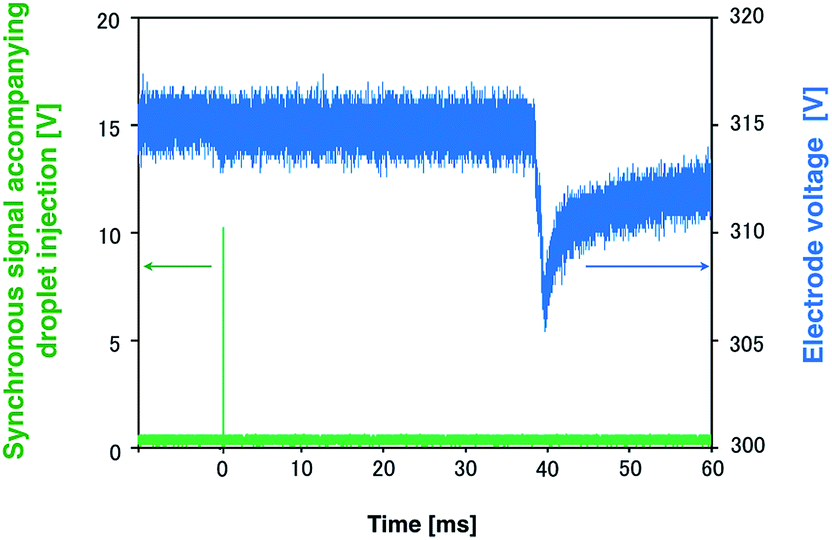 | ||
| Fig. 4 Synchronous signal accompanying the droplet generation and waveform of the voltage between the electrodes. | ||
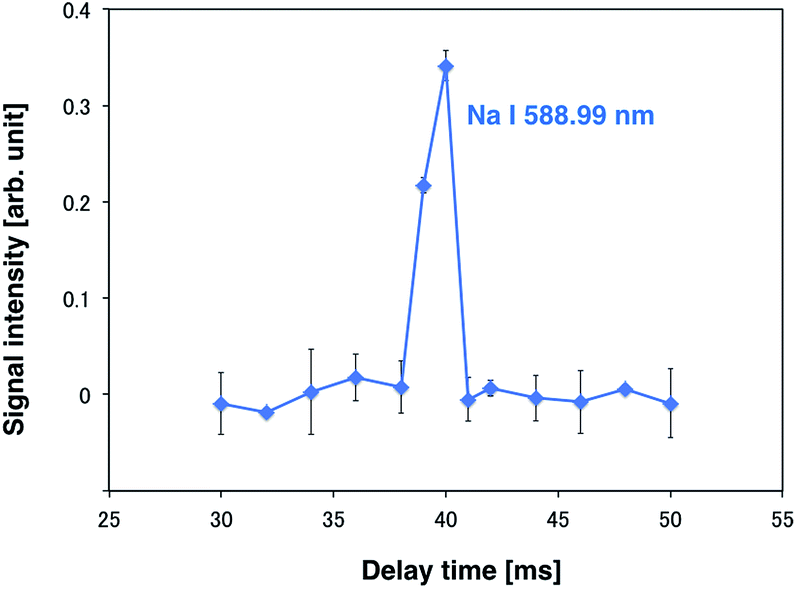 | ||
| Fig. 5 Relationship between the emission intensity of Na I 588.99 nm and the delay. | ||
Atomic emission spectroscopy by pulse-synchronized microplasma
Once plasma generation and droplet sample introduction were synchronized, the analytical performance of the pulse-synchronized microplasma AES system was evaluated. A 100 mg L−1 standard solution containing Na, Ca, Mg, and K was used as a droplet sample, similar to the DC microplasma analysis. The emission spectrum recorded during the sample introduction is shown in Fig. 6. Emissions from sodium (Na I 588.9 nm, Na I 589.5 nm), calcium (Ca II 315.9 nm, Ca II 317.9 nm, Ca II 370.6 nm, Ca II 373.7 nm, Ca II 393.4 nm, Ca II 396.3 nm, Ca II 422.7 nm), magnesium (Mg II 279.6 nm, Mg II 280.3 nm), and potassium (K I 766.5 nm, K I 769.9 nm) were observed, indicating that the species contained in the droplet were successfully analyzed. Emissions from molybdenum (Mo I 378.9 nm) derived from the electrode and silicone (Si II 505.6 nm) present in the insulating glass plate were also observed. The signal after blank signal subtraction from the spectrum obtained during sample introduction was magnified around the emission line (Fig. 7) and showed that the emission lines from each element increased upon sample introduction.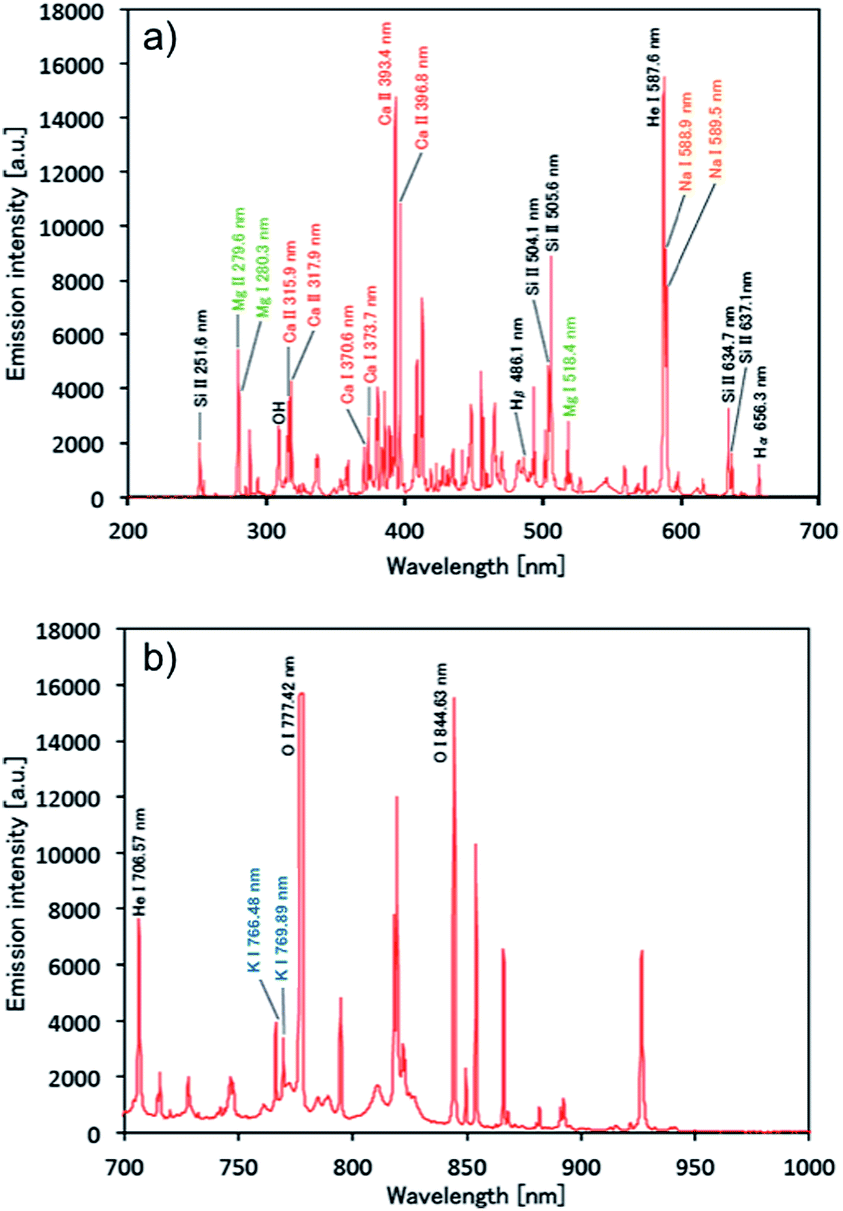 | ||
| Fig. 6 Spectroscopic analysis of a 14 pL single-droplet sample of a 100 mg L−1 solution containing Na, Ca, Mg, and K by using the pulse-synchronized microplasma AES system. (a) At 200–700 nm and (b) 700–1000 nm. | ||
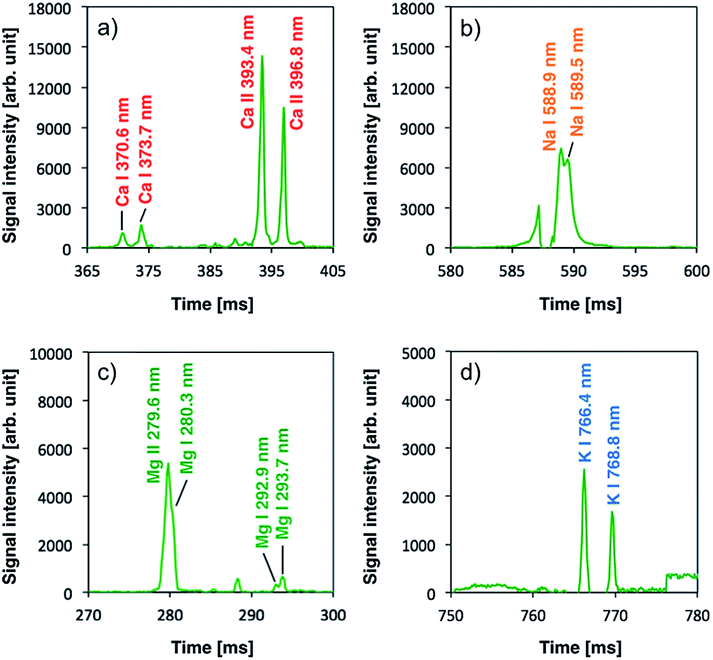 | ||
| Fig. 7 Signals after blank signal subtraction from a spectrum during sample introduction. The signal was magnified around the emission line of (a) calcium, (b) sodium, (c) magnesium, and (d) potassium. | ||
Limits of detection (LODs) were determined from the sample signal. Blank signals were recorded three times as noise and LODs were calculated using a signal-to-noise (S/N) ratio of 3. The resulting LODs equalled 300, 50, 30, and 640 fg for Na I 588.9 nm, Ca II 317.9 nm, Mg I 279.6 nm, and K I 766.4 nm emission lines, respectively. This demonstrates that the newly developed system achieved similar LODs compared with ICP-AES using microdroplet injection (Na: 22 fg, Mg: 16 fg).31 The pulse-synchronized microplasma AES system did not achieve lower LODs compared with ICP-AES because the integration time of the multichannel spectrometer could not be sufficiently shortened. The light-emitting time of the microplasma pulse ranged between 10 and 15 μs (ref. 28) while the integration time amounted to 100 ms. This means that the sample signal was obtained only during the light-emitting time of the plasma and background noise was obtained in all the other time. Therefore, the advantage of hyphenating transient sample introduction and transient plasma generation becomes impaired, reducing the S/N ratio. An enhancement of the signal detection method is necessary to achieve lower LODs by pulse-synchronized microplasma. The ICP relies on large volumes, and the interaction time between plasma and the droplet sample is relatively long (ca. 1.5 ms). Therefore, the total energy given to the sample increases even when the energy given to the sample per unit time is small. This enables the ICP to promote droplet sample desolvation, vaporization, atomization and excitation. On the other hand, high-power pulsed microplasma can provide a large amount of energy to the sample per unit time but the interaction time is relatively short, preventing the sample from reaching its excitation phase as efficiently as by using the ICP. Therefore, sample droplets should be desolvated before introduction into the plasma.17
Conclusions
In this study, microdroplet injection, which can introduce individual small samples, such as single cells and nanoparticles, into an analytical device, was connected to a high excitation ability, high density microhollow cathode plasma to produce an emission spectroscopic system for ultrasmall samples. A droplet sample was introduced into a 32 mA, 8 W DC helium microhollow cathode plasma, and the emission from the plasma was measured by spectrometry. No emission was observed from the analytes because of the insufficient excitation ability of the plasma. Therefore, a high-power pulsed microplasma that can instantaneously input high power reaching 100 kW was used as an excitation source. Because of the transient nature of sample introduction and plasma generation, droplet sample arrival at the electrodes and pulse plasma generation were synchronized using a function generator. The delay between droplet generation and plasma generation was optimized by examining the sodium emission line, resulting in synchronization at a delay of 40 ms. Under this condition, Na, Ca, Mg, and K emissions were successfully measured in a 14 pL droplet sample, and their LODs amounted to 300, 50, 30, and 640 fg, respectively. The analytical performance of this newly developed system may be enhanced by improving the pulse signal detection and utilizing desolvation. Because the sample and the plasma excitation source are very small, matrix effects such as the effect of easy ionizable element (EIE) should be evaluated in a future study. Development of mobile AES systems for ultrasmall samples and on-tip analytical devices is expected to emerge in the future from the combination of a pulse-synchronized microplasma AES system and a microspectrometer.Notes and references
- H. Haraguchi, J. Anal. At. Spectrom., 2004, 19, 5–14 RSC.
- I. Lavilla, M. Costas, P. S. Miguel, J. Millos and C. Bendicho, BioMetals, 2009, 22, 863–875 CrossRef CAS PubMed.
- Inductively Coupled Plasma Mass Spectrometry, ed. A. Montaser, Wiley-VCH, New York, 1998 Search PubMed.
- K. E. Lawrence, G. W. Rice and V. A. Fassel, Anal. Chem., 1984, 56, 289–292 CrossRef CAS.
- D. R. Wiederin, F. G. Smith and R. S. Houk, Anal. Chem., 1991, 63, 219–225 CrossRef CAS.
- S. C. K. Shum, S. K. Johnson, H. M. Pang and R. S. Houk, Appl. Spectrosc., 1993, 47, 575–583 CrossRef CAS.
- J. A. McLean, H. Zhang and A. Montaser, Anal. Chem., 1998, 70, 1012–1020 CrossRef CAS.
- B. W. Acon, J. A. McLean and A. Montaser, Anal. Chem., 2000, 72, 1885–1893 CrossRef CAS.
- J. L. Todolí and J. M. Mermet, J. Anal. At. Spectrom., 2001, 16, 514–520 RSC.
- M. G. Minnich, J. A. McLean and A. Montaser, Spectrochim. Acta, Part B, 2001, 56, 1113–1126 CrossRef.
- K. Kahen, A. Strubinger, J. R. Chirinos and A. Montaser, Spectrochim. Acta, Part B, 2003, 58, 397–413 CrossRef.
- M. Aramendía, M. Resano and F. Vanhaecke, Anal. Chim. Acta, 2009, 648, 23–44 CrossRef PubMed.
- S. Gschwind, L. Flamigni, J. Koch, O. Borovinskaya, S. Groh, K. Niemax and D. Gunther, J. Anal. At. Spectrom., 2011, 26, 1166–1174 RSC.
- J. Koch, L. Flamigni, S. Gschwind, S. Allner, H. Longerich and D. Gunther, J. Anal. At. Spectrom., 2013, 28, 1707–1717 RSC.
- K. Shigeta, G. Köllensperger, E. Rampler, H. Traub, L. Rottmann, U. Panne, A. Okino and N. Jakubowski, J. Anal. At. Spectrom., 2013, 28, 637–645 RSC.
- K. Shigeta, G. Köllensperger, E. Rampler, H. Traub, L. Rottmann, U. Panne, A. Okino and N. Jakubowski, J. Anal. At. Spectrom., 2013, 28, 646–656 RSC.
- Y. Kaburaki, A. Nomura, Y. Ishihara, T. Iwai, H. Miyahara and A. Okino, Anal. Sci., 2013, 29, 1147–1151 CrossRef CAS.
- S. K. Chan and A. Montaser, Spectrochim. Acta, Part B, 1985, 40, 1467–1472 CrossRef.
- S. K. Chan, R. L. Van Hoven and A. Montaser, Anal. Chem., 1986, 58, 2342–2343 CrossRef CAS.
- S. K. Chan and A. Montaser, Spectrochim. Acta, Part B, 1987, 42, 591–597 CrossRef.
- D. W. Koppenaal and L. F. Quinton, J. Anal. At. Spectrom., 1988, 3, 667–672 RSC.
- S. H. Nam, W. R. L. Masamba and A. Montaser, Anal. Chem., 1993, 65, 2784–2790 CrossRef CAS.
- H. Miyahara, T. Iwai, Y. Kaburaki, T. Kozuma, K. Shigeta and A. Okino, Anal. Sci., 2014, 30, 231–236 CrossRef CAS.
- T. Takamatsu, H. Hirai, R. Sasaki, H. Miyahara and A. Okino, IEEE Trans. Plasma Sci., 2013, 41, 119–125 CrossRef CAS.
- H. Miyahara, T. Iwai, Y. Nagata, Y. Takahashi, O. Fujita, Y. Toyoura and A. Okino, J. Anal. At. Spectrom., 2014, 29, 105–110 RSC.
- T. Takamatsu, A. Kawate, K. Uehara, T. Oshita, H. Miyahara, D. Dobrynin, G. Fridman, A. Fridman and A. Okino, Plasma Med, 2014 DOI:10.1615/PlasmaMed.2014010792.
- T. Iwai, A. Albert, K. Okumura, H. Miyahara, A. Okino and C. Engelhard, J. Anal. At. Spectrom., 2014, 29, 464–470 RSC.
- T. Iwai, K. Kakegawa, K. Okumura, M. Kanamori-Kataoka, H. Miyahara, Y. Seto and A. Okino, J. Mass Spectrom., 2014, 49, 522–528 CrossRef CAS PubMed.
- A. Batal, J. Jarosz and J. M. Mermet, Spectrochim. Acta, Part B, 1981, 36, 983–992 CrossRef.
- D. J. Kalnicky, V. A. Fassel and R. N. Kniseley, Appl. Spectrosc., 1977, 31, 137–150 CrossRef CAS.
- K. Shigeta, Ph.D. Thesis, Tokyo Institute of Technology, 2010.
| This journal is © The Royal Society of Chemistry 2014 |