 Open Access Article
Creative Commons Attribution 3.0 Unported Licence
Old traces, read anew – ‘The Reading Hermit’ painting in the light of X-ray fluorescence
C.
Seim
*a,
C.
Laurenze-Landsberg
b,
B.
Schröder-Smeibidl
c,
I.
Mantouvalou
a,
C.
de Boer
d and
B.
Kanngießer
a
aTechnische Universität Berlin, IOAP, Hardenbergstr. 36, 10623 Berlin, Germany. E-mail: christian.seim@tu-berlin.de; Fax: +49 30 314 23018; Tel: +49 30 314 23089
bGemäldegalerie Berlin, Matthäikirchplatz 8, 10785 Berlin, Germany
cHelmholtz-Zentrum Berlin für Materialien und Energie, Hahn-Meitner-Platz 1, 14109 Berlin, Germany
dAuthor/research, Putten, The Netherlands
First published on 28th April 2014
Abstract
There exist several very similar looking versions of the painting ‘The Reading Hermit’, all allegedly painted by Rembrandt Harmenszoon van Rijn (approx. in ∼1630 A.D., Leiden). The classification of Rembrandt's paintings, which were produced by Rembrandt himself, in his academy by his students and the ones being mere copies is a crucial and difficult task. We gathered background evidence and performed elemental analyses by non-destructive micro-X-ray fluorescence (micro-XRF) in order to elucidate the painting's provenance. Elemental distributions of Ca, Mn, Fe and Cu show that the painting was presumably changed during the painting process, which indicates, together with neutron autoradiography (NAR) investigations, that this version of ‘The Reading Hermit’ is not a copy.
Introduction
“Is every ‘Rembrandt’ a Rembrandt?” asks Van De Wetering in his preface of his book ‘Rembrandt – The Painter At Work’.1Since Rembrandt led an atelier/workshop and, thus, was working together with students, attributing a painting to only Rembrandt himself is a difficult task, since paintings maybe collaborations between Rembrandt and his students. This is aggravated by the fact that Rembrandt's workshop also produced variants and copies of paintings – there exist e.g. ten versions of ‘Judas Repentant’, which cannot be assigned to a certain artist.
In the search for the painting's provenance, time of creation and the originator there are a great number of attributes that can be investigated. Apart from analysing their painting style, paintings whose creator is unknown or uncertain go through multiple scientific, preferably non-destructive, investigations.2 Nevertheless as Bomford and Rüger depict in their introduction3 (p. 9) “[…] we cannot rely solely on a judgement based analysis or use of materials, nor even just on old-style connoisseurship of images and surfaces – but have to take on a balanced view of all the evidence”.
Like ‘Judas Repentant’, ‘The Reading Hermit’ exists in several similar looking versions. One is part of a private Dutch collection and earlier used to be in the collection of Captain Eric C. Palmer.
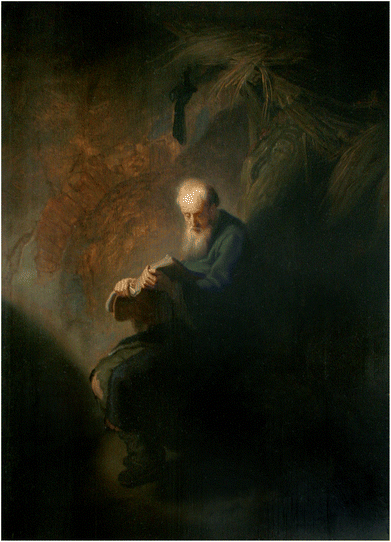
‘The Reading Hermit’ is an oil painting on a three-part oak panel, with the dimensions of 63.2 cm × 45.5 cm. The painting shows an old white-bearded Hermit reading a book clutching it with both hands. The Hermit is sitting, and, since the area behind and under him is partly obscure, it is not clearly discernible what object he is sitting on. The painting's scene's lighting (strong chiaroscuro) accentuates the Hermits face and his hands holding the book (Fig. 1). The Hermit sits in a primitive stone-vault painted – in strong contrast to the Hermit's face, hands and the book – with a ‘rough’ brushstroke.
If the painting at hand is an original produced by Rembrandt and/or his students, a copy produced in Rembrandt's studio or maybe even a forgery is the issue to be investigated. Up until now the painting at hand has gone through several archaeometric investigation methods, all of which connect it to Rembrandt's inner circle and time in Leiden at the time of about 1630. These preceding investigations will be presented in section Background evidence before discussing, comparing and combining micro-XRF plots with NAR images. It is clear, that for an analysis of a painting, all evidence has to be gathered that is typical for the period in which the alleged artist was active. Features that are typical for the oeuvre of only this artist or clues, which would completely exclude an alleged artist, are even more valuable.
Methods
Neutron autoradiography (NAR) investigations
Schröder-Smeibidl4 of the Helmholtz-Zentrum Berlin (HZB) in a close collaboration with Claudia Laurenze-Landsberg of the Gemäldegalerie Berlin carried out neutron autoradiography (NAR) investigations at the research reactor BER II in Berlin on the painting to reveal different paint layers superimposed during the painting process. Neutrons are not charged and are able to penetrate several centimetres into materials. For NAR, the painting is exposed to a flux (109 neutrons per cm2 per s) of cold neutrons (5 × 10⁻⁵ eV to 0.025 eV) (here: effective exposure of the painting: 2.6 h), which induce radioactivity in the exposed material; an atomic nucleus may capture a neutron hereby entering an excited state. The capture of a neutron often results in a radioactive isotope that decays by emitting beta- or gamma-rays, depending on the respective isotope with different half-lives. It is important to mention the (near) non-destructive character of NAR, only 4 of 1012 atomic nuclei become radioactive.While in neutron activation analysis the emitted gamma rays are analysed and assigned to their respective element, in NAR a series of photographic films is positioned directly onto the radioactive painting and the emitted β-rays sensitise the film. In this series of autoradiographs multiple consecutive first short (minutes) and later longer (hours, days, weeks) exposures are carried out to capture the half-life dependent β-particle contribution of all elements. The contribution of β-particles to the darkening of the film is roughly proportional to the β-emission rate for a specific element at all times. The β-particle penetration depth is about 500 μm, thus revealing the spatial distribution of the elements used in the painting. These elemental distributions, as a rule, correlate with the distribution of the pigments used by the artist. It is obvious, considering the above, that the identification of the elements by means of the exposed films/image plates only is not unambiguous.
The films or imaging plates are digitalised with a laser scanner, thus limiting the resolution to the size of the laser spot. A limitation of NAR is if a neutron capture produces a stable isotope (H, C, N, O, Mg, Si, S, Ti and Fe), or if a radioactive isotope has a very long half-life and does not emit enough β-radiation (Ca and Ni), or if an isotope has a very short half-life (Li, B and F) that makes the exposure process difficult to handle. It is possible, though, to identify all these elements except Li, O and F with prompt gamma neutron activation analysis. Elements detected most easily by NAR are sodium, aluminium, manganese, cobalt, copper, arsenic, antimony, gold and mercury. Elements that do not cause distinct images are lead, iron, carbon and calcium, and confine distinct measurements of the pigments chalk, lead red and white, lead-tin yellow and the iron in ochre.5,6
The elements detected using NAR, especially Mn and Cu, on ‘The Reading Hermit’ stand in no contradiction to paintings created in the closest environment of Rembrandt. The NAR images show only a limited number of pigments in a given passage – a limited palette – which is a characteristic for a painting from Rembrandt's active period of time, and also for himself (‘autoradiography of Rembrandt's […] paintings resulted in surprisingly “clean” images’; p. 150 (ref. 1)). Furthermore, the NAR shows conceptual changes (pentimenti) not only in the position of the hands, but also clearly in the lower part of the robe, the whole area where the boots of the ‘Hermit’ are positioned and also the diverse tinge of the background. Both, Van De Wetering and Bomford, clearly state that it was typical for Rembrandt to work out his compositions directly on the panel or the canvas, which inevitably led to pentimenti and revisions (p. 27/28 (ref. 1); p. 34 (ref. 3)). Additionally, Schröder-Smeibidl et al. observed that the majority of these pentimenti for the most part are conducted with umber, which is well known for early sketches and background paintings by Rembrandt.
The NAR images will be discussed in more detail in the comparison with the micro-XRF plots obtained at the BLiX laboratories at the TU Berlin (Fig. 7 and 9).
We carried out micro-XRF investigations in the dark area below the ‘Hermit’ in order to find structural changes made by the artist, which would be atypical for a copy, and would further strengthen and back up the results that were already obtained by NAR. Furthermore we intend to use the elemental plots obtained with micro-XRF to emphasise that there was indeed only a limited palette used to paint ‘The Reading Hermit’. Additionally, performing 3D micro-XRF measurements7,8 to resolve different paint layers is of great interest, since Rembrandt developed his paintings from the background to the front in different layers3 (p. 32).
Background evidence
Furthermore, a seal on the back of the wooden panel was assigned to be Nicolas Cromhout's (1561–1641), a close friend of Rembrandt's first supporters from the Leiden period.
3D micro-X-ray fluorescence spectrometer
Micro-XRF is a non-destructive way to quantitatively/qualitatively measure elemental distributions in samples in the micrometre regime.10 A microfocus X-ray tube is used to excite the atoms in the sample. A polycapillary (full-) lens concentrates the X-ray tube's polychromatic radiation onto the sample. This radiation ionizes atoms of the sample's material, yielding fluorescence photons characteristic for the respective atomic number. An energy dispersive silicon drift detector (SDD) is utilised to collect the fluorescence photons. By moving the sample laterally, and gathering spectra, spatially resolved plots of the fluorescence intensities of the different elements in the sample are obtained.For 3D micro-XRF a second polycapillary (here: half-) lens is positioned in front of the detector. The foci of the first and the second lens form a probing volume which enables three-dimensionally resolved fluorescence measurements at 30–50 μm energy-dependent depth resolution for a tube voltage of 50 kV.11 The difference in spatial resolution results from the working principle of polycapillary lenses. Polycapillary lenses use total external reflection to transport X-rays and since the total external reflection angle is energy dependent, radiation with different energies is concentrated to different spot sizes. A higher energy leads to a smaller spot size and a better spatial resolution (Fig. 2).
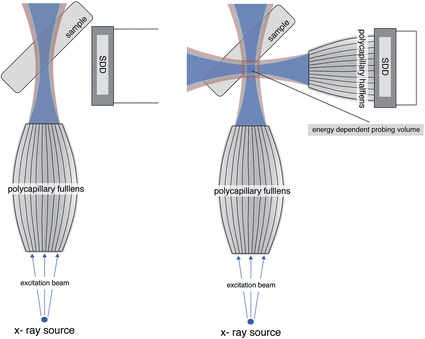 | ||
| Fig. 2 Schematic illustration of the working principle of micro-XRF (left) and 3D micro-XRF (right). | ||
The (3D) micro-XRF investigations on the painting ‘The Reading Hermit’ were carried out in the Arts & Culture Laboratory of the BLiX (Berlin Laboratory for innovative X-ray Technologies) at the TU Berlin with a compact 3D micro X-ray fluorescence spectrometer described in ref. 11. The spectrometer including the sample retainer and the motor stages is spaciously encapsulated, thereby offering enough space (approximately a cubic metre) for samples, e.g. paintings, while simultaneously providing radiation protection during the measuring process (Fig. 3).
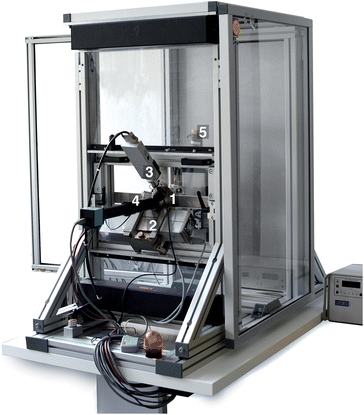 | ||
| Fig. 3 Compact (3D) micro-XRF spectrometer. (1) gauge head; (2) X-ray tube; (3) silicon drift detector; (4) microscope with camera; and (5) encapsulated positioning stage. | ||
The laboratory is fully air-conditioned to keep the temperature and humidity constant throughout the measurements, which is crucial when investigating a painting on a wooden panel since it strongly reacts to the change of environmental conditions. Earlier measurements showed that the thermal extension of wood is in the region of a hundred μm for a temperature difference of about 8 °C.
The compact laboratory spectrometer has a microscope integrated whose focus is set to the distance of the probing volume, thus enabling the user to position the sample's surface in the correct distance to the polycapillary lenses, and also to laterally position the sample in the desired area. This is especially important when investigating surface structures in the micrometre regime. The spectrometer has two detector-slots (Fig. 4) in order to quickly change from 3D micro-XRF to micro-XRF mode. We used imageJ, Adobe Photoshop and self-developed software for the analysis of the (3D) micro-XRF data.
We carried out micro-XRF area-scans and 3D micro-XRF depth scans on the painting ‘The Reading Hermit’. Micro-XRF area-scans are a fast, non-destructive, way to examine the elemental (hence also the pigment) distribution of the respective specimen. Without the need for a full quantification, underlying structures can be made visible, if the artist used different pigments for the covering and the underlying paint layer12,13 and if the upper layer is not absorbing the characteristic radiation of the underlying layer.
Using 3D micro-XRF different paint layers can be resolved three-dimensionally. If the layer's thickness is approximately half the width (or bigger) of the probing volume normal to the sample, the layers differ in their elemental composition or at least have different elemental concentrations, buried layers of paint that were overpainted during the painting process can be detected.14 (3D) micro-XRF is non-destructive, and no sample preparation, e.g. staining or slicing, is needed.
3D micro-XRF investigations
Since Schröder-Smeibidl et al.4 already depicted, that the position of the ‘Hermit's’ hand was changed during the painting process, we investigated if our compact 3D micro X-ray fluorescence spectrometer was able to resolve the thin paint layers at this position. All 3D micro-XRF measurements were carried out with a depth step width of 5 μm and a measuring time of 15 s for each step.2D Micro-XRF investigation
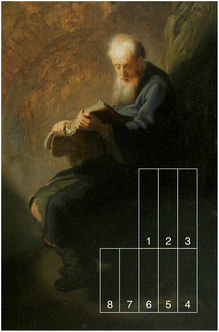
The designated measuring area of the micro-XRF plots below the ‘Hermit’ was divided into eight parts (Fig. 4). The measuring time was 1 s for each step. Each of the measuring areas 1–3 were 99 mm × 24 mm in size, while 4–8 were 79.5 mm × 24 mm with a step width of 1.5 mm. The measuring areas are named chronologically in the order they were measured. The measuring distance was set to 1 mm away from the focus of the lens in the opposite direction of the gauge head to irradiate a bigger area, yielding approximately 150 μm lateral resolution (determined by knife-edge measurements @Cu Kα) for each step.Results and discussion
3D Micro-XRF investigations
All depth scans showed the same results – it was not possible to resolve paint layers, the pentimenti, which were made visible with the NAR. This is due to the fact that the spectrometer has a limited spatial resolution in the 10 μm regime, as mentioned above. Nevertheless, we can say qualitatively that the thickness of the paint layers must be below 10 μm, a rather thin paint application. That being said, if we indeed had been able to resolve the paint layers, we would have had evidence at hand that would be atypical for Rembrandt, since thin paint application is expected from a painting allegedly attributed to Rembrandt.2D Micro-XRF investigations
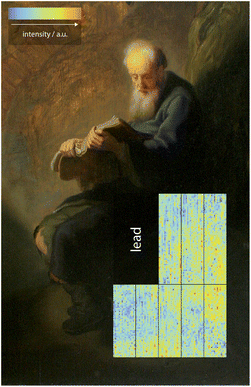
In all spectra that were collected by the use of 2D Micro-XRF, we detected the elements calcium, manganese, iron, copper and lead. In the following the elemental distributions of these elements are demonstrated and discussed. Even though quantitative analysis is possible, the analysis of the fluorescence plots is only qualitative, since we are interested in visualising hidden structures. Concerning the visualisation of the fluorescence intensity of a single element, blue colouring signifies low fluorescence intensity, while a higher intensity is shown in a more reddish colour (Fig. 5).Lead
Fig. 5 shows the elemental distribution of lead, which reveals no painted structures. The elemental plot visualises the vertical wood grain with lines of higher intensity alternating with lines of lower intensity. This is especially obvious in measuring areas 1, 7 and 8 and it seems as if a pigment containing lead, most likely lead-white, was used to fill the cavities in the wood or at least was used for the grounding of the oak panel. The use of lead white, instead of a ground based on chalk and glue is characteristic for a painting that origins in Rembrandt's active time. Both, Van De Wetering (p. 17 (ref. 1)) and Bomford (p. 28 (ref. 3)) state that almost all paintings from Leiden on oak panels attributed to Rembrandt contained lead-white in variants with chalk, ochre and glue as a grounding. More specifically said, Hermann Kühn, in the most extensive study of the grounds on Rembrandt's panels, discovered four main types of groundings: chalk, lead white, ochre and quartz without a single ground in each group that has the same composition as one of the others.15 Van De Wetering contrarily states in more detail that the real grounding or primuersel/imprimatura was done with a very thin layer of a mix of glue and chalk while a second grounding layer containing the other ingredients such as oil and pigments like lead white was applied later. Van De Wetering admits though, that because of the absorbance and fineness of the chalk–glue layer, the two groundings can easily be mistaken for one layer only. And of course it cannot be ruled out that Rembrandt experimented with grounds1 (p. 21).When taking the background evidence into account that leads to this painting being from the 16–17th century it is highly probable that the measured lead distribution indeed is lead white, most probably grounding the painting.
Like for the improved radiographic methods presented by O. Schalm et al.16 the presence of a lead-white grounding does seem to blur neither the XRF-plots nor the NAR images as it would in conventional X-ray radiography.
Iron/manganese
In Fig. 6 the fluorescence intensity distribution of iron and manganese is depicted. Both intensity distributions do not only strongly correlate with each other but also with the NAR images of ref. 4. In contrast to the lead distribution where no clear structure is visible (see Fig. 5) a distinct border between the Hermit's garment and the darker area (on the painting) behind and under the Hermit is visible. This border in measuring areas 1 and 2 has the appearance of a ‘sitting edge’ that is not visible on the painting itself. In the upper region of measuring areas 6–8 (highlighted in the iron XRF plot) the fluorescence intensity distribution resembles the lower end of a robe with a shoe- or boot-like structure below it, despite the actual boots of the ‘Hermit’ being further to the left. If this were confirmed, it would constitute a strong proof for a compositional change of the painting at hand. A compositional change always hints to an artist who is creating, revising and improving his painting as opposed to someone who is only duplicating an existing piece of art. As stated above Rembrandt indeed worked out his compositions directly on the panel (p. 27/28 (ref. 1); p. 34 (ref. 3)) which led to revisions and pentimenti.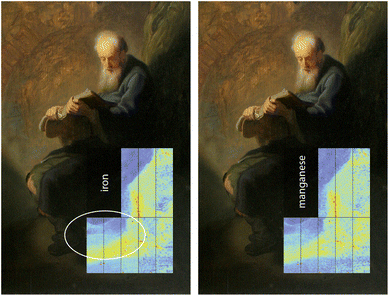 | ||
| Fig. 6 Spatial distribution of the fluorescence intensity of iron (left) and manganese (right) in arbitrary units. | ||
Comparing the manganese micro-XRF plot with the first film from the NAR measurements (Fig. 7), the film in which the grey colouring is mainly induced by the radioactive manganese isotopes, one can see that not only the strong darker grey of the ‘sitting edge’ shows a perfect resemblance to the micro-XRF intensity distribution of manganese, but also the boot-like structure matches the one from the micro-XRF measurement very well. However the brush-strokes visible in the NAR film cannot be clearly seen in the micro-XRF due to the lower lateral resolution. Finally, the revisions mentioned above were often carried out with umber, a pigment containing iron and manganese oxides. A revision like this is atypical for a copy.
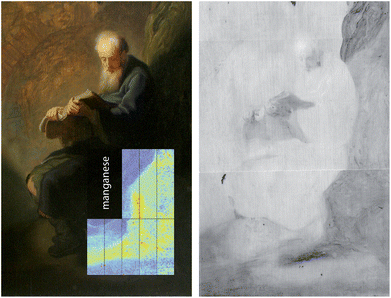 | ||
| Fig. 7 Comparison of the micro-XRF plot of the spatial distribution of manganese (left) and the first NAR film/4 h exposure from t = 0 (right). | ||
Below these alleged pentimenti a narrow horizontal stripe of higher intensity can be seen in the micro-XRF plots of iron and manganese and also in the first NAR film.
Copper/calcium
Fig. 8 illustrates the fluorescence intensity of copper, most probably as a component of azurite or malachite, and calcium, in chalk or bone black, as a function of position. In measuring areas 1 and 2 the copper distribution, like the distributions of iron and manganese, has the complexion of an edge. In areas 6–8 a narrow horizontal stripe of higher intensity also very similar to the one mentioned in the last passage is visible. When analysing the second film of the NAR measurements, in which the radioactive copper isotopes darken the film the most, and comparing it with the spatial distribution that was measured with micro-XRF, a very strong conformity is obvious (Fig. 9). Just like the manganese distribution, the edge and the lower horizontal stripe appear coincident. Again, taking the results of the manganese and iron distribution into account, we seem to have another proof for the painter of the ‘Hermit’ having used a limited palette – a typical evidence for a genuine 16–17th century painting.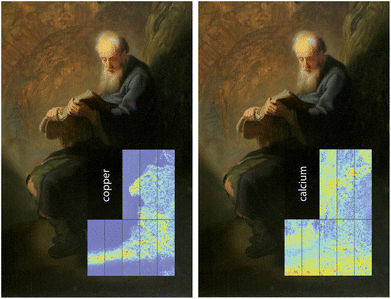 | ||
| Fig. 8 Spatial distribution of the fluorescence intensity of copper (left) and calcium (right) in arbitrary units. | ||
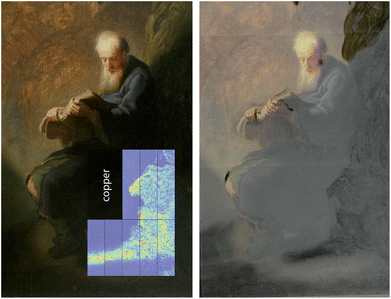 | ||
| Fig. 9 Comparison of the micro-XRF plot of the spatial distribution of manganese (left) and the first NAR film superimposed over the painting/25.5 h exposure from t = 24 h (right). | ||
The calcium distribution on the other hand differs significantly from the previously discussed elemental distributions. The highest intensity is detected at the bottom of measuring areas 4–8 (all five lower areas), contrary to the distributions of iron, manganese and copper. Calcium, as a component of brighter pigments, as for instance chalk, appears in the illuminated area around the Hermit, whilst iron, manganese and copper are found in the shady areas.
It is explainable that the calcium distribution does not fit to the brighter areas around the reading Hermit entirely. The detection of calcium in bright areas is mainly a result of pigments, such as chalk, while mixing chalk with the linseed oil and other pigments was used to add translucency17 where needed without changing the color of the respective pigments. Calcium appearing in the darker areas, to the contrary, is part of bone black (calcium phosphate and carbon) and results in higher intensity of the dark parts in the investigated areas.
The overall presentation of the painting, therefore, represents a fascinating diverse combination of bright/brighter and dark/darker areas and adds in detail even more clearness, transparency and intensity.
The upper region of measuring fields 7 and 8 (lower areas on the left) is also striking. This section has a higher intensity and seems to have the shape of a shoe or boot, which backs up the proposition of compositional changes made by the artist, stated in the previous paragraph.4
The third NAR film should have shown the arsenic distribution, if existent, most distinctively, but could also still show the copper distribution. As in the micro-XRF plots, both, arsenic and cobalt were not detected, thus ruling out the use of smalts for the painting. This fits to the production of the painting in Rembrandt's circle and early years, since smalts were first introduced and mixed in other colours after 1640. The second and the third NAR film have a close resemblance, presumably because the neutron-activated copper still emits β-rays and also because arsenic is absent.
Conclusions
The possibility of the ‘Reading Hermit’ being a forgery can be readily negated, since none of the evidence at hand would support the argument. Also a 18–19th century copy seems unlikely, as all indications lead to an earlier production date.When weighing in on all gathered background evidence, it becomes highly probable, that the ‘Reading Hermit’ is indeed connected to Rembrandt. The age and the size of the wooden panel fit to Rembrandt's Leiden period. The seal furthermore connects the painting to Rembrandt's closer circle and also the area where Rembrandt lived and worked. The model used, the composition and the lighting of the scene reinforce the statement.
Using two different spectroscopic methods, like in our case micro-XRF (information gathered from the atomic shell) and NAR (information from the atomic nucleus), should generally be considered in archaeometry to gain complementary information. While the NAR images contain more detail, such as the painter's brushstroke for example, the energy-dispersive micro-XRF measurements yield the more accurate information about the elements, and thus the pigments, used in the painting.
The agreement of the micro-XRF with the NAR investigations provides a strong argument that the painter of ‘The Reading Hermit’ has used only a limited palette. As stated above, this is characteristic for a genuine painting from the 16–17th century and for Rembrandt. The elements detected with micro-XRF (Ca, Mn, Fe, Cu and Pb) all fit to pigments used in Rembrandt's productive period. The use of lead-white ground could be confirmed.
The structural changes, which were shown with the micro-XRF measurements and the NAR images, additionally strengthen the hypothesis that the version of ‘The Reading Hermit’ at hand can neither be a forgery, nor a copy, but more likely painted either by Rembrandt himself or Rembrandt and a student/students. If ‘The Reading Hermit’ is the original, must be finally decided by art historians, but all background evidence in combination with our NAR and XRF investigations point towards this version of ‘The Reading Hermit’ being the original.
Notes and references
- E. v. d. Wetering, Rembrandt – The Painter at Work, University of California Press Berkeley and Los Angeles, 2nd revised edn, 2009 Search PubMed.
- K. Janssens, G. Vittiglio, I. Deraedt, A. Aerts, B. Vekemans, L. Vincze, F. Wei, I. De Ryck, O. Schalm and F. Adams, X-Ray Spectrom., 2000, 29, 73–91 CrossRef CAS.
- D. Bomford, J. Kirby, A. Roy, A. Rüger and R. White, Art in the Making – Rembrandt, Yale University Press/Kate Bell, London, 2006 Search PubMed.
- B. Schröder-Smeibidl, C. Laurenze-Landsberg, C. Schmidt and L. A. Mertens, Non-destructive testing and analysis of museum objects, COST-G8, 2006 Search PubMed.
- W. S. Taft, J. W. Mayer, R. Newman, D. Stulik and P. I. Kuniholm, The science of paintings, Springer, New York, 2000 Search PubMed.
- E. V. Sayre and H. N. Lechtman, Stud. Conserv., 1968, 161–185 CrossRef CAS PubMed.
- B. Kanngießer, W. Malzer, A. F. Rodriguez and I. Reiche, Spectrochim. Acta, Part B, 2005, 60, 41–47 CrossRef PubMed.
- B. Beckhoff, N. Langhoff, B. Kanngiefer, R. Wedell and H. Wolff, Handbook of practical X-ray fluorescence analysis, Springer Verlag, 2006 Search PubMed.
- P. Klein, D. Eckstein, T. Wazny, J. Bauch and K. Grimstad, ICOM Committee for Conservation, 1987, pp. 51–54 Search PubMed.
- K. Tsuji, K. Nakano, Y. Takahashi, K. Hayashi and C. U. Ro, Anal. Chem., 2012, 84, 636–668 CrossRef CAS PubMed.
- I. Mantouvalou, K. Lange, T. Wolff, D. Grötzsch, L. Lühl, M. Haschke, O. Hahn and B. Kanngießer, J. Anal. At. Spectrom., 2010, 25, 554 RSC.
- M. Alfeld, D. P. Siddons, K. Janssens, J. Dik, A. Woll, R. Kirkham and E. van de Wetering, Appl. Phys. A: Mater. Sci. Process., 2013, 1–8 Search PubMed.
- J. Dik, K. Janssens, G. Van Der Snickt, L. van der Loeff, K. Rickers and M. Cotte, Anal. Chem., 2008, 80, 6436–6442 CrossRef CAS PubMed.
- I. Mantouvalou, Doctoral Dissertation, TU Berlin, 2009.
- H. Kühn, in Maltechnik/Restauro Vol. 83, 1977, vol. 83, pp. 223–233 Search PubMed.
- O. Schalm, A. Cabal, P. Van Espen, N. Laquiere and P. Storme, J. Anal. At. Spectrom., 2011, 26, 1068–1077 RSC.
- R. White and J. Kirby, The National Gallery Technical Bulletin, Volume 15, Number 1, January 1994, 1994, vol. 15, pp. 64–78 Search PubMed.
| This journal is © The Royal Society of Chemistry 2014 |

