 Open Access Article
Creative Commons Attribution 3.0 Unported Licence
Collective motion of cells: from experiments to models
Előd
Méhes
a and
Tamás
Vicsek
*ab
aDepartment of Biological Physics, Eötvös University, Budapest, Hungary. E-mail: emehes@angel.elte.hu; Fax: +36 13722757; Tel: +36 13722795
bMTA-ELTE Statistical and Biological Physics Research Group of the Hungarian Academy of Sciences, Budapest, Hungary. E-mail: vicsek@hal.elte.hu; Fax: +36 13722757; Tel: +36 13722795
First published on 8th July 2014
Abstract
Swarming or collective motion of living entities is one of the most common and spectacular manifestations of living systems that have been extensively studied in recent years. A number of general principles have been established. The interactions at the level of cells are quite different from those among individual animals, therefore the study of collective motion of cells is likely to reveal some specific important features which we plan to overview in this paper. In addition to presenting the most appealing results from the quickly growing related literature we also deliver a critical discussion of the emerging picture and summarize our present understanding of collective motion at the cellular level. Collective motion of cells plays an essential role in a number of experimental and real-life situations. In most cases the coordinated motion is a helpful aspect of the given phenomenon and results in making a related process more efficient (e.g., embryogenesis or wound healing), while in the case of tumor cell invasion it appears to speed up the progression of the disease. In these mechanisms cells both have to be motile and adhere to one another, the adherence feature being the most specific to this sort of collective behavior. One of the central aims of this review is to present the related experimental observations and treat them in light of a few basic computational models so as to make an interpretation of the phenomena at a quantitative level as well.
Insight, innovation, integrationCollective motion or swarming of living entities is one of the most common and spectacular manifestations of living systems. The interactions between two cells are quite different from those among individual animals and, correspondingly, some interesting features of swarming specific to the cellular level have been observed. In most cases the coordinated cellular motion is a helpful aspect of the given phenomenon and results in making a related process more efficient (e.g. embryogenesis or wound healing), while in the case of tumor cell invasion it appears to speed up the progression of the disease. This review is aimed at both presenting the experimental observations and treating them in light of a few basic computational models to provide a quantitative interpretation as well. |
Introduction
In this introductory section and in the section titled “Need for a quantitative description” we provide the basic definitions of the notions used throughout the manuscript. Many of these were originally introduced for the level of organisms. Flocks of birds, herds or fish schools are perhaps the best known examples of large groups exhibiting fascinating patterns of motion by coordinating their motion in various ways (for an extensive review, see ref. 1). Interestingly enough, some of the approaches developed for organisms can also be applied to the description of collective motion of cells as well. Although in some cases we make use of the terminology commonly accepted by the community studying the migration of cells, yet due to our focus on the quantitative interpretation of the related processes, we find that providing an introduction to the quantities and the basic models used throughout this review should be useful for the reader.Defining collective cell motion
Collective motion is a form of collective behavior: individual units (cells) interact in a simple (attraction/repulsion) or complex way (through a combination of simple interactions). The main feature of collective behavior is that the individual cell's action is dominated by the influence of other cells so that it behaves very differently from how it would behave if it was alone. The pattern of behavior is determined by the collective effects due to the other cells of the system.For purposes of this review we emphasize two major characteristics of collective cell motion (migration). (1) Cells are physically and functionally connected with each other and connection is maintained during collective motion; (2) these multicellular structures exhibit polarity and the supracellular organization of individual cytoskeletal structures generates traction and protrusion forces for migration.
Although it is tempting to see the migration of loosely associated groups, e.g. germ cells, as a collective migration, they are essentially solitary cells following the same (e.g. chemotactic) cues and tracks while occasionally contacting each other. Therefore we will not consider the migration of these groups as real collective migration because there is an apparent lack of collective effects.
Collective cell motion can occur in the form of 2-dimensional migration on a tissue surface or as 3-dimensional migration of a multicellular group (also termed: cohort) through a tissue scaffold. In the following we will provide a naturally incomplete list of selected examples for the observed subtypes collective migration from among higher eukaryotes in the context where they are experimentally studied: in embryonic development, wound-healing, vascular and tracheal network formation and in vitro conditions. Next we will collect, where available, some computational models trying to reproduce and explain the experimentally observed phenomena. Again, their list is rather exemplary and incomplete. Additionally, we will guide readers through the field of pattern formation by segregation of collectively moving cells where numerous computational models have been developed and tested.
Main types of collective cell motion
Collective cell migration in two dimensions is perhaps best exemplified by the sheet migration of fish keratocytes (skin cells) isolated from scales,2 the density-dependent sheet migration of isolated human endothelial cells (lining the inner surface of blood vessels) in culture during wound-healing3 and the streaming behavior of endothelial cells in dense, confluent monolayers.4There are several experimentally observed forms of 3-dimensional collective migration, mostly in morphogenic events. During the gastrulation process in the zebrafish embryo leading to the formation of the mesendodermal (germ line) layer, cells exhibit concerted 3D laminar migration.5 The primordium of the lateral line organ migrates as one cohesive group with front and rear polarity in a later stage of zebrafish embryonic development giving rise to the chain of mechanosensory organs.6 Similarly, polarized multicellular strands move collectively during branching morphogenesis of the mammary gland or the fruit fly's tracheal network.7 The branching morphogenesis of the vascular network of a wide range of species from birds to mammals is also a known example of collective migration of polarized multicellular strands that are forming a tubular network.8
A somewhat special form of 3-dimensional collective migration is the migration of the completely isolated group of border cells towards the oocyte through the tissue stroma made up of nurse cells in the developing egg chamber of the fruit fly.9
During collective invasion observed in several human cancer types, such as epithelial cancers and melanomas, detached cell groups with front/rear polarity can migrate across tissues after tissue remodeling by the secretion of metalloprotease enzymes, cleaving the extracellular matrix. In some cancer types, the groups can switch among states ranging from collective migration through partial to complete individual migration in processes termed epithelial-mesenchymal transition (EMT) or mesenchymal-epithelial transition (MET). Their motion is reminiscent of morphogenic events but in a rather dysregulated way with the mechanisms yet to be understood making collective cancer invasion a field of great medical importance but more difficult to study compared to morphogenesis. Excellent reviews have been published on various aspects of collective cancer migration.10–13
Another interesting domain of life where collective motion is observed and modeled is the world of bacteria. Autonomously moving bacteria rely on motility organelles such as flagella or cilia making their motion very different from the collective motion of adherent tissue cells from higher animals that this Review is focusing on. Although the collective motion of bacteria falls outside the scope of this Review, a very detailed recent review on collective motion emerging at various organizational levels of life offers a good opportunity for comparison.1
Need for a quantitative description
So far the collective motion of cells was mainly investigated by experimentalists and the corresponding reviews were concentrating on the phenomenological aspects of the related processes. In the second part of this Review we bring into the picture a number of computational models that can be successfully used to quantitatively interpret the observations. The quantitative treatment can be useful from the point of the understanding of the basics, but it has potential relevance for designing further experiments or even treatments in the case of cancer therapies.Throughout this Review we use the terms collective motion, swarming, flocking or cohort migration as synonyms of coherent or ordered motion of units. In various models, collective motion is an emergent phenomenon arising from disordered, random motion through a transition as a function of relevant parameters of the system. Units of a system where collective motion emerges are (i) rather similar, (ii) moving with similar velocities and capable of changing their direction, (iii) interacting with each other causing effective alignment of motion and (iv) subject to perturbations from their environment.
The extent to which the motion of a population is collective is best indicated by a suitably chosen order parameter. The order parameter in this case is φ, the moving units' averaged velocity normalized between 0 and 1 as:
 | (1) |
![[v with combining right harpoon above (vector)]](https://www.rsc.org/images/entities/i_char_0076_20d1.gif) i is the actual velocity of unit i.
i is the actual velocity of unit i.
If motion is disordered, the order parameter will be close to 0, whereas in case of ordered motion it will be close to 1. In experimental work, the actual velocity of individual cells can be measured using various methods ranging from manual tracking to automatic tracking based on e.g. object recognition or particle image velocimetry (PIV).
Observations
Collective cell motion in vitro
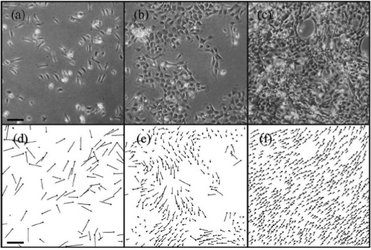
As a very characteristic form of 2-dimensional collective motion, the collective migration of keratocytes isolated from goldfish scales was studied by Szabó et al.2 Based on the experimentally observed phenomenon of density-dependent ordering transition from individual random migration to ordered collective migration they determined this phase transition event as a function of cell density (Fig. 1). This was found to be continuous (second order) transition occurring as cell density exceeded a relatively well-defined critical value (also see Reference video 1).
Endothelial and epithelial cells are other cell types that have been used for studying in vitro 2-dimensional collective migration both within an intact cell monolayer and in response to the cell density gradient such as in an experimental scratch-wound model, where cell-free space is created e.g. by removing cells by making a scratch in the monolayer. These studies have considerably advanced our understanding of how such collective migration is organized, e.g. in terms of leadership.
In experiments with mosaic cultures of wild type vs. specific gene-silenced human endothelial (HUVEC) cells Vitorino et al.3 have found that the sheet migration evoked by scratch-wound and eventually closing of the wound by directed immigration of marginal cells in the cell-free space followed by directed migration of cells localized farther from the boundary is a process regulated in a hypothesized modular way. A functional polarization of cells into leader/pioneer or follower cells occurs at the boundary. Leader cells orient their lamellipodia toward the free space and their motion becomes directed, a process which depends on fibroblast growth factor (FGF) signaling through FGF receptor (FGFR) in the FGFR-RAS-PI3K pathway, but it does not require a concentration gradient of FGF. Migration of the followers several rows behind becomes directed through cell–cell coordination, which depends on the presence of cell surface adhesion molecule VE-cadherin but does not require FGF signaling. Mechanosensing is hypothesized to orient the followers toward the leaders.
The traction forces driving collective migration are generally thought to be exerted by leader cells. However it has been shown18 that in groups of cultured kidney epithelial (MDCK) cells the traction forces are not exclusively generated by leader cells at the edge but also by cells several rows behind, using cryptic lamellipodia.19
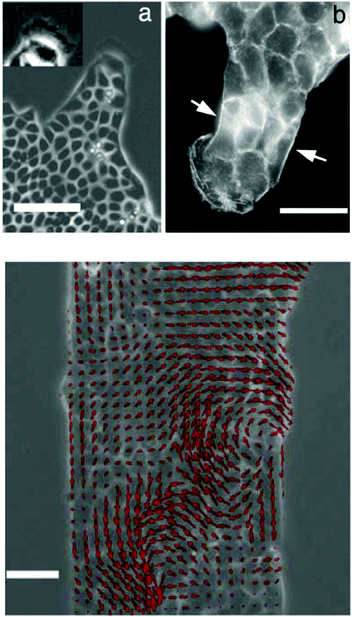
Motivated by wound-healing experiments Poujade et al. studied the collective motion of MDCK cell layers triggered by experimental opening up of cell-free surface using a microfabrication-based technique (stencil) without cell damage.20 This setting with undamaged cells suggests no release of chemical signaling factors at the wound site. In the process of invading the new surface, involving the coordination of many cells distant from the border, they also identified leader cells with directionally persistent motion, active protrusions and focal adhesions at the border. These leaders form fingering instabilities that destabilize the border. Leaders and followers are hypothesized to be coupled by mechanical signaling through the observed cadherin cell–cell contacts among leaders and followers as well as by the multicellular actin cytoskeletal belt at the sides of these fingers. Cell–cell adhesion keeps the monolayer cohesive, which produces long-range correlation in the cell velocity field (Fig. 3). Leader cells also originate within the monolayer and are brought to the border by streaming flow.
Epithelial cells confined on narrow strips of width comparable to cell size exhibit a contraction–elongation type of motion with increased migration speed. As a contrast, the same cells on a magnitude wider strips move as sheet under tensile state while exhibiting larger coordination and forming vortices of size comparable to tens of cell size.22 The role of force transmission through intercellular adhesion contacts has a crucial role in collective migration as coherence is fully abolished by even transient disruption of cell–cell adhesions resulting in cells exhibiting random walk.23
Collective cell motion in vivo
One of the spectacular processes of early avian development is vasculogenesis: endothelial cell precursors continuously differentiated in a spatially scattered way in the lateral mesoderm or aggregated in the extraembryonic mesoderm self-assemble into tubes, eventually forming the primary vascular plexus, a polygonal tubular network.14,24–26 Initially scattered precursors divide and locally assemble into vessels or migrate to developing vessels and subsequently move towards the embryonic midline and participate in the formation of large vessels and the heart.
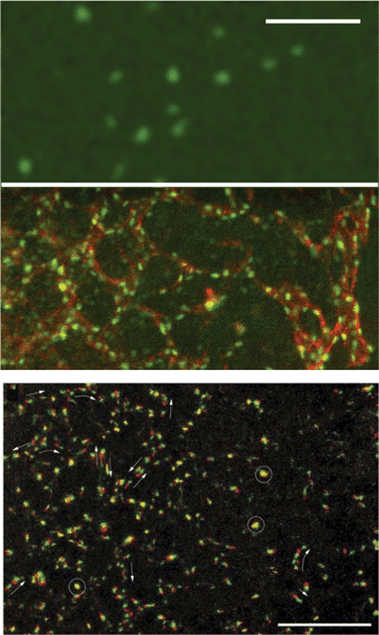
Using transgenic quail embryos (Tg(tie1:H2B-eYFP)+) in which all endothelial precursors specifically express a fluorescent marker (YFP) Sato et al.14 have provided detailed imaging and analysis of endothelial cells' motion in vivo. On the one hand, these cells move passively with gastrulating tissues towards the midline and, on the other hand, they actively move relative to their environment. By the advanced imaging technique, passive motion can be subtracted from overall motion yielding the active motion of endothelial cells. Their active motion does not seem to follow prepatterns in the environment and it is characterized by switching directionality and an apparent attraction to elongated cells and cell chains (also see Reference videos 2 and 3). Endothelial cells eventually assemble into chains of 3–10 cells, giving rise to polygonal tubes (Fig. 4).
One of the most extensively studied gastrulations is that of the zebrafish, where a crucial phase of the process is the ingression of mesendoderm progenitors from the surface at the mid-phase of epiboly, their ingression followed by coherent migration parallel to the surface toward the forming embryonic body axis (Fig. 5).
Performing cell transplantation experiments with various genetically modified embryos and cells Arboleda-Estudillo et al.5 studied the directionality and movement coordination of mesendoderm progenitors. They have found that directional migration of these cells is not a new collective property but already the property of individual cells moving alone.
Nevertheless the collective migration of mesendoderm cells is impaired and becomes less directed if cell–cell adhesion is defective, as shown by modulating cell–cell adhesion strength through the modulation of E-cadherin expression, the key adhesion molecule in mesendoderm cells (also see Reference videos 4 and 5). To analyze the contribution of cell–cell adhesion to collective mesendoderm migration they used a numerical simulation.
Other aspects of the collective migration of mesendoderm cells in gastrulating zebrafish embryos were studied recently.27 Single mesendoderm cells or small groups were transplanted ahead of the advancing prechordal plate (the front part of the ingressing mesendoderm), an area most likely permissive for their directional migration. These single motile cells or small groups, however, failed to migrate in the right direction toward the animal pole but stayed in position or migrated backward until joining the advancing prechordal plate where they were quickly re-oriented taking the direction of the prechordal plate through active motion, i.e. they were not dragged or pushed passively. Cell–cell interactions and contact with the endogenous prechordal plate are required to orient the motion of these cells in which the major components are E-cadherin-based adhesion, cell polarity defined by the Wnt-Planar Cell Polarity signaling pathway and directed cell protrusion activity regulated by Rac1 GTP-ase.
Mechanosensing the tension gradient developing within the advancing prechordal plate by an intrinsic mechanism without extrinsic cues is hypothesized to account for this self-organization, a mechanism yet to be explored experimentally.
Various aspects of force generation and regulation in morphogenesis are discussed in an excellent recent review.28
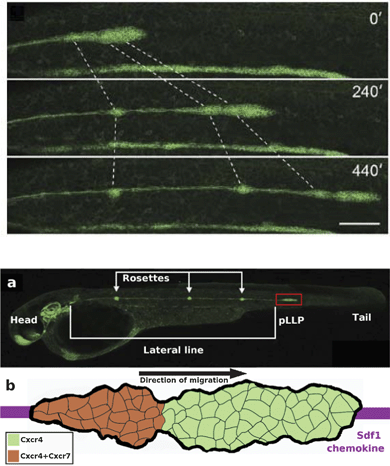 | ||
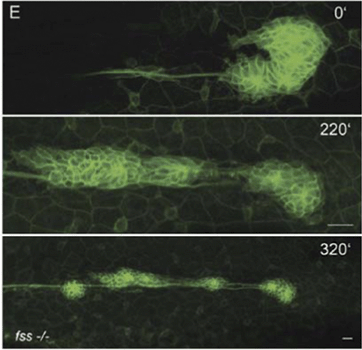
| Fig. 6 The posterior lateral line primordium couples collective migration to differentiation. Upper panel: an overview of a time-lapse movie showing 10 h of lateral line morphogenesis with Claudin B-GFP. The lateral line primordium migrates at a speed of ∼66 μm h−1 at 25 °C. Forming neuromasts at the trailing edge (dotted lines) decelerate, causing the tissue to stretch, before being deposited. The scale bar is 100 μm. Also see Reference video 6. From Haas and Gilmour (2006)6 with permission of Dev Cell. Lower panel, (a) Microscopic image of the zebrafish embryo at 42 hpf. The posterior lateral line primordium (pLLP, red box) and rosettes are visible due to Claudin B-GFP marker. Modified from Haas and Gilmour (2006)6 with permission of Dev. Cell. (b) Schematic image of the pLLP corresponding to the area highlighted in red box in (a). The primordium migrates along the Sdf1 chemokine prepattern (purple stripe), detected by CxCr4 receptor (green). The trailing region of the primordium also express Cxcr7 receptor (overlap of the two receptors is seen in orange). | ||
During organogenesis, the primordium of the lateral line organ, a series of mechanosensory hair cell organs, differentiates from neurogenic placodes on both sides of the embryo's head region. The posterior lateral line primordium (pLLP), which is a cohesive mass of more than 100 cells, then migrates as one cohort along a defined path at the side of the embryo while depositing clusters of neuromast cells transforming into sensory epithelial cells forming a series of connected groups, termed rosettes, constituting the lateral line organ. The migration of the primordium is completed in less than 12 hours (see Reference video 6).
The path followed by the primordium is defined by chemokine, stromal-derived factor 1 (Sdf1a, also termed Cxcl12a), expressed by the surrounding myogenic tissue in a stripe pattern, detected by the primordium through expression of the receptor CxCr4b. Although most cells of the primordium express Cxcr4b, only few cells at the leading tip activate the receptor to direct the polarity of the whole group, hence acting as leader cells. Genetic mosaic experiments have revealed that cells with mutant receptor are specifically excluded from the leading edge implying that adequately functioning CxCr4b receptor is required for becoming a leader cell, whereas it is not required for being a follower cell. Here, mechanical force exerted by leaders on followers through the N-cadherin cell–cell contacts is hypothesized to guide followers.
In the absence of either of the receptors, Cxcr7 or Cxcr4b, or their ligand, Sdf1a, the migration of the primordium is seriously defective. Cxcr7 is thought to be required at the rear to ensure persistent forward migration of the whole primordium while regulating the halting and deposition of rosettes through an intracellular signaling differing from that of Cxcr4b6,29 (a detailed review is also available: ref. 11).
As the primordium advances, a fibroblast growth factor, FGF10, expressed in discrete spots by the adjacent tissue induces follower cells to adopt an epithelial cell fate and generate the rosette-like structure. Simultaneously, the trailing region of the primordium slows down and halts causing elongation of the primordium followed by seceding of the rosette. This process correlates with the presence of another receptor of Sdf1a, Cxcr7, expressed only by follower cells mainly at the trailing region of the primordium while there is a large overlap with Cxcr4b expression.
Experimental truncation of the Sdf1a stripe can cause a 180 degree turn of the entire migrating primordium followed by migration in the reverse direction and normal depositing of neuromasts (see Reference video 7). This suggests that there is no polarized distribution or long-range concentration gradient of the chemokine guidance cue, but polarization rather lies in the organization of the migrating primordium itself6 (Fig. 7).
By establishing a novel readout of chemokine ligand activity based on visualizing and measuring the turnover of the ligand binding receptor, using a tandem fluorescent protein timer (lifetime tFT) method, Gilmour and coworkers have recently provided direct evidence for the self-generation of the chemokine gradient by the migrating collective itself.30
The Sdf1a ligand concentration-decreasing activity of the Cxcr7 receptor, expressed at the rear of the primordium, is sufficient to generate a gradient of chemokine activity across the primordium's whole length, dispensing the necessity for pre-existing long-range gradients that may have spatial limitations.
The tracheal system of the fruit fly, D. melanogaster, and the vascular system of birds and mammals are two exemplary areas where branching morphogenesis leading to the formation of a tubular system is studied. A common theme to all these tubular systems is their branched and hierarchical nature. The morphological similarity among various tubular systems is related to similarities between the signaling pathways and biophysical characteristics controlling their branching and growth (for a detailed review, see ref. 35).
Experimental work with embryonic model systems led to the identification of ligand–receptor pairs involved in the persistent directional migration and guidance of cell groups forming these structures. They have also improved our understanding how the leader–follower organization of groups is determined by initial symmetry breaking events mediated by other ligand–receptor pairs.
The development of the tracheal system in the fruit fly Drosophila melanogaster takes place without cell proliferation and eventually the collective migration of 10 groups each consisting of ∼80 ectodermal cells is responsible for its formation. Tip cells differentiate as leader cells of the group and produce dynamic cytoskeletal protrusions, and then form the primary branches by migrating toward a fibroblast growth factor (FGF) source produced in defined patches by cells surrounding the group. The tip cell prevents its neighbors from becoming leaders in a process called lateral inhibition. The molecular mechanism of adopting a tip cell fate was studied by Ghabrial and Krasnow7 and reviewed by Schottenfeld et al.36 The initial slight differences in FGF receptor signaling are amplified by positive and negative feedback loops and eventually lead to increase in the expression of Notch receptor ligand Delta in the leader tip cell. Delta activates Notch in the neighboring cell which eventually downregulates the FGF receptor pathway and Delta expression in the neighboring cell thus making it less responsive to the FGF signal and becoming a follower stalk cell.
The dynamics of cell fate segregation through lateral inhibition by the Delta/Notch system was studied using mathematical models.37,38 Analysis of a model of a lateral inhibitory system along with a spatial gradient of its input stimulus has revealed that such a system mainly contributes to the robustness of tip-cell selection when the input signal includes random noises, which is frequently the case in complex developmental processes. It has also been shown that lateral inhibitory regulation works more robustly in tip-cell selection than self-inhibition, an alternative means of inhibitory regulation.
During embryonic development of warm-blooded animals the first phase of vascular network formation is termed primary vasculogenesis in which endothelial precursors randomly differentiated in the lateral mesoderm self-assembly by active motion into a polygonal network, yet void of fluid. The second phase is termed angiogenesis when this initial vascular network already carries blood and it is further reshaped by vessel sprouting, fusion or withdrawal on demand by surrounding tissues and hemodynamic forces. Angiogenesis, essentially the outgrowth of new vessels from existing vessels, then occurs throughout life as endothelial cells are capable of developing networks in several modes in various biological conditions and tissue environments.
Candidate mechanisms for vascular patterning include: guidance by pre-pattern, contact guidance by extracellular matrix (ECM) and mechanosensing, guidance by interactions modifying the ECM (referred to as ‘ECM memory’) and guidance by chemotactic gradients. A very detailed review of vascular patterning mechanisms has been published recently.16
In vascular sprouts, the endothelial cells are guided by a single tip cell protruding actin-rich filopodia, followed by a multicellular stalk of endothelial cells, connected by vascular endothelial cadherin (VE-cadherin) at cell–cell junctions successively forming the inner lumen of the new vessel.
As the initial step of vascular sprouting a differentiation step to become leader tip cell vs. follower stalk cell occurs similarly as in tracheal morphogenesis. In endothelial cells the vascular endothelial growth factor (VEGF) and the subsequent Delta–Notch signaling axis determine leader and follower cell fate by lateral inhibition.
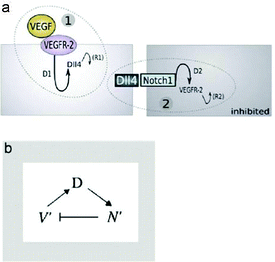
Jakobsson et al. studied the molecular mechanism of tip cell selection in angiogenesis in the retina and in embryoid bodies.8 They have found that endothelial cells dynamically compete for the tip cell position through relative levels of VEGF receptor (VEGFR) subtypes 1 and 2. Dynamic position shuffling of tip cells and stalk cells has been observed in experimental sprouting assays (Fig. 8).
Differential VEGFR levels modulate the expression of the Notch ligand Delta (DII4) activating Notch in the neighboring cell, which in turn influences the expression level of VEGFR subtypes. Cells with lower VEGFR1 and higher VEGFR2 levels are more likely to take and maintain the leading position.
Based on data from in vitro and in vivo sprouting experiments with genetic chimaeras Bentley et al.40 developed a hierarchical agent-based computational model for the simulation of sprouting in uniform and gradient distribution of VEGF. Simulation results show that Notch-dependent regulation of VEGFR2 can function to limit tip cell formation from the stalk in a competitive way (Fig. 9).
An in vitro model system where primary vasculogenesis can be studied experimentally is the allantois formed by the lateral extraembryonic mesoderm in both birds and mammals.41 Within the allantois, vasculogenic cell aggregates, termed blood islands, give rise to sprouts eventually forming a vascular network. Endothelial cells are also capable of forming networks in various in vitro systems, such as 3D collagen hydrogels, where environmental or genetic pre-patterns are obviously missing.42,43 After dynamic competition for tip cell position, angiogenetic sprouts are led by very motile tip cells while similarly motile stalk cells are recruited from aggregates and follow the tip cell while occasionally overtaking it.
It is tempting to think that stalk cells are passively dragged by the tip cell but if so the elongation of the sprout would be limited because the cadherin-mediated cell–cell adhesions, shown to be analogous to surface tension of liquid droplets, would not be able to stabilize the structure beyond a critical length. Due to the Plateau–Rayleigh instability a surface-tension stabilized structure, such as a liquid jet, will break up into drops when its length exceeds its circumference. Sprouts grow beyond this length indicating that stalk cells actively move within an expanding sprout following some sort of a guidance mechanism. To search for a potential guidance mechanism to recruit stalk cells in the expanding sprout Szabo et al. studied sprouting in a simplified in vitro system without chemokines.44 They have demonstrated that various non-endothelial cell types can also exhibit the sprouting behavior on 2-dimensional surfaces, suggesting a generic mechanism.
In avian embryonic vasculogenesis, however, the chemoattractant VEGF165, which likely fits in the model, is produced throughout the embryo and overweighs the low autocrine production, if any, by endothelial cells. The same applies to in vitro 3D collagen invasion assays where endothelial cells readily form sprouts and network in the presence of high concentration of exogenous VEGF in the medium.
These contradictions can be overcome if it is assumed that VEGF binds to the extracellular matrix (ECM) while endothelial cells secrete a proteolytic agent releasing the ECM-bound VEGF creating a local gradient of the “bioavailable” VEGF in the microenvironment of endothelial cell aggregates, pointing towards the aggregates. Such a mechanism has not yet been validated experimentally mainly owing to difficulties in visualizing or measuring morphogen gradients.
A recently emerging hypothesis based on the effect of a diffusible inhibitor also attempts to solve the above contradictions.16 Experiments with diffusible VEGF receptor (VEGFR1) secreted by endothelial cells show that lack of this secreted receptor severely compromises vascular sprouting, whereas exogenous soluble VEGFR1 production by endothelial cells in the vicinity of emerging sprouts can rescue sprout formation and elongation.48,49 Based on these findings it can be hypothesized that diffusible VEGFR1 secreted by endothelial cells binds and sequesters the otherwise abundant VEGF in the vicinity endothelial cells, creating a VEGF gradient pointing away from these cells.
Pattern formation by collective segregation of cells
An interesting field where collective cell motion is involved is the spatial pattern formation by different cell types through the process termed segregation (or sorting). Patterns can form as a response of cells to external guidance cues such as morphogens or chemotactic substances or as a process where instead of external cues the local cell–cell interactions and inherently different mechanical or motility characteristics of cell types give rise to various multicellular patterns by physical segregation of the cell types.These segregation events bear much significance in the embryonic development of higher animals where differentiation, pattern formation and cell motion take place simultaneously. A recent review summarizes several cell segregation phenomena and corresponding computational models.50
Pattern formation in cell monolayers in vitro
Basic drives and mechanisms of pattern formation events taking place e.g. during embryonic development can be studied in simplified experimental systems where complexity is reduced and the events are more accessible for quantitative analysis.In 2-dimensional co-cultures of adherent cells on a rigid substrate Mehes et al. studied the dynamics of segregation of two initially mixed cell populations into distinct clusters by cell migration in an environment lacking pre-defined external cues.51 They have found that segregation into large multicellular clusters is facilitated by collective effects in cell motion such as an increase in the directional persistence of constituent cells. The growth of such multicellular clusters by consecutive fusion of smaller clusters follows algebraic scaling law with characteristic exponents depending on the collective effects (Fig. 10, also see Reference video 8).
The growth exponent values measured in this cell culture system with self-propelled collective motion exceed the exponent values resulting from computer simulations with diffusively moving segregating units detailed in a report by Nakajima and Ishihara.52
Pattern formation by segregation in vivo: gastrulation and tissue organization
Three-dimensional segregation of cell populations is most prominent during gastrulation, the early phase of embryonic development resulting in the formation of main germ layers that later on give rise to all tissues. Gastrulation is a spectacular event under the microscope involving collective motion of large number of cells, but although gastrulation events have been known since early embryonic studies at the beginning of the 20th century, the basic mechanisms that provide for both its accuracy and robustness are just being uncovered. Segregation of cell populations with different cell fates into distinct domains is governed by their mechanical properties and active motion, and it is an important driving mechanism of gastrulation and tissue organization. Segregation is also important in other embryonic processes ranging from blastocyst formation to somitogenesis in vertebrates.Cell segregation was first demonstrated by the experiments of Townes and Holtfreter in which presumptive neural and epidermal cells were isolated from amphibian gastrulae;, subsequently they were mixed and they autonomously sorted into separate tissues.53 In similar early experiments, mixed cells isolated from the adult Hydra were shown to segregate and form separate tissues.54
Segregation of various cell types in 3-dimensions was studied in several studies55–59 aiming to explain the observed configurations of segregated domains, typically the envelopment of one cell type by the other, evolving from an initial mixture of cells. These in vitro segregating systems are considered to be analogous to non-mixing liquids and their segregation is shown to be driven by differences in tissue surface tension (TST) of the constituent cell types.55 Several reports tested the contribution of cell–cell adhesion57,59 and cell cortex tension58,60 to TST.
Three-dimensional segregation experiments
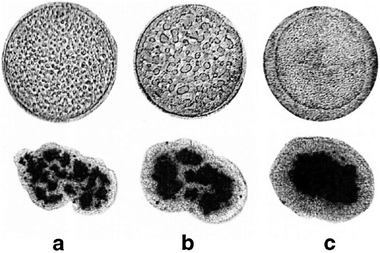
The dynamics of growth of segregated domain size in 3-dimensions was studied by Foty et al.55 using mixed cultures of embryonic pigmented epithelial and neural retinal cells, which segregated and formed enveloped structures over time in a configuration determined by surface tensions of the cell types. As a comparison, the segregation of gas and liquid phases was studied under microgravity resulting in similar segregated configuration determined by surface tension (Fig. 11).The authors have found that both the size of segregated cell domains and segregated gas/liquid domains increase linearly with time.
In a study quantifying the adhesive and mechanical properties of zebrafish germ line progenitor cell types Heisenberg and coworkers investigated the role of tensile forces in cell segregation.57 Using single-cell force spectroscopy they have measured the cell-cortex tension of these cell types (ectoderm, mesoderm and endoderm) while specifically interfering with actomyosin-dependent cell-cortex tension.
Performing segregation experiments using cell types with altered myosin activity they have demonstrated that differential actomyosin-dependent cell-cortex tension is required and sufficient to direct the segregation of cell types and determines the final configuration of the segregated domains.
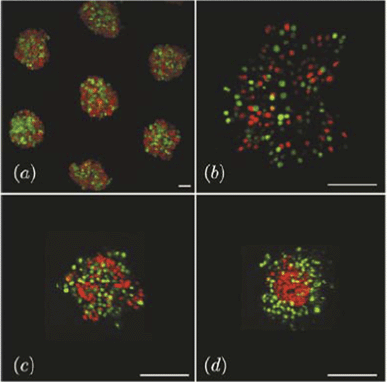
The dynamics of 3-dimensional segregation of mixed germ line progenitors of the zebrafish was studied by Klopper et al.61 As segregation proceeds in this system, the domain consisting of mesoderm cells gradually engulfs the ectoderm domain, which eventually takes the inner position (Fig. 12). The authors have monitored the dependence of the local segregation order parameter on system size and found algebraic scaling and different characteristic exponent values for enveloping and engulfed cells.
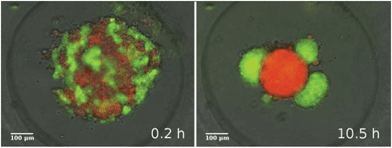
In a similar in vitro system composed of two mixed epithelial cell types suspended in micro-molds, Vicsek and coworkers have recently studied the dynamics of 3-dimensional segregation49 (see Reference video 9). In their experiments the forming domains are adjacent and unlike zebrafish germline progenitors there is no engulfment of one domain by the other.
It was also found that the growth of segregated domain size follows algebraic scaling law and it is fast, typically completed within 6 hours (Fig. 13). These observations are in harmony with simulations of Mones et al.62 but in contrast to earlier simulations of Chaté and coworkers63 that suggest a much slower process (see Fig. 25).
Pattern formation by segregation is a process that is not confined to embryonic development. In a recent publication Inaba et al.64 studied the formation of skin pigment patterns in the adult zebrafish. They have demonstrated that segregation of the two pigment cell types eventually forming the stripe pattern is governed by their short-range repulsive electric interactions that spatially orient their migration.
Emerging hypotheses
Two opposing hypotheses have been developed for explaining the origin of tissue surface tension, TST, the main drive of collective cell segregation. One is the differential adhesion hypothesis (DAH), developed by M. Steinberg65–68 postulating that tissue surface tension is proportional to the intensity of adhesive energy between point object cells. This hypothesis was elaborated in extensive modeling approaches by J. Glazier.69 Experimental studies showed that TST is proportional to cadherin levels.57The other hypothesis is the differential interfacial tension hypothesis (DITH), developed by Harris,70 Brodland71,72 and Graner,73 postulating that tissue surface tension arises from cortical tension of individual cells generated by actomyosin contractility, while a cell's mechanical energy changes with the cell shape. This model was also supported by experimental data on cell cortex tension and TST.58
A model integrating cell–cell adhesion and contractility of cell interfaces in the generation of tissue surface tension, the driving force of cell segregation and tissue spreading, was provided by Manning et al.74 This model specifies an explicit relationship between surface tension and the ratio of adhesion (γ) to cortical tension (β). Surface tension exhibits a crossover at γ/β ∼ 2 from adhesion-dominated behavior (DAH) in the regime of γ/β < 2 to a dependence on cortical tension and other mechanical effects in the regime of γ/β > 2.
Experimental proof of the relative weights of adhesion and cell cortex tension in controlling cell–cell contact formation in zebrafish germ layer progenitors and determining the experimentally measurable separation force between cell pairs was provided by Maître et al.75 Cells are described as fluid objects with viscoelastic cortex under tension and adhesive bonds maintaining cell–cell contacts. Contact expansion is controlled by cell cortex tension at the contact, generated by myosin activity, while adhesion by cadherin molecules (membrane-spanning adhesion molecules) mechanically couple the adhering cells, and such coupling is limited by cadherin anchorage to the sub-membrane cortex. Contact formation is the result of active reduction of cell cortex tension at cell–cell interface, which leads to decrease in cell–cell interface tension, while cell cortex tension at the cell–medium interface will not decrease, accounting for maintained TST. Adhesion is shown to have little direct function in contact expansion. Considering the typical cadherin density, the adhesion energy per unit area of the cell surface (∼1 × 10⁻⁷ N m−1) is several orders of magnitude lower than typical TST measured in cell aggregates (being on the order of 1 × 10⁻³ N m−1).76–94 The main drive of cell contact formation and segregation is actomyosin-dependent cortex tension rather than adhesion energy.
A recent review emphasizes the role of boundary cells in TST as they can actively change their mechanical properties generating different cortical tensions along their internal and external interfaces. Such ‘mechanical polarization’ is suggested to exert the same net mechanical effect on the tissue as if extra adhesion was introduced among all cells and it is hypothesized to dominate TST instead of the mechanical energy of adhesive bonds.75 Strong apical-basal actin polarization was shown in surface cells in zebrafish embryonic explants.77 Considering the low adhesion energy of cadherins, the findings that TST is proportional to the number of surface cadherins56 can also be interpreted in a way that it is actually signaling through more cadherins leading to increased actomyosin contractility and resultant cell cortex tension which generates higher TST.
Conceptual interpretations
When attempting to put the relatively new topic of collective cell migration into a wider perspective we shall consider three major aspects of these phenomena. (i) Collective motion can be looked at as one of the simplest manifestations of collective behavior. (ii) Although a general theoretical framework for such emergent processes as the coherent motion of cells is still lacking, a classification of the collective motion patterns can be a helpful tool for interpreting the various related phenomena. (iii) By using a system of equations the description is, on one hand, elevated to a quantitative level and on the other hand since the same equations can be applied to rather different systems, this also indicates the universal emergent features of the collective motion of cells.Emergence and collective behavior
Collective behavior applies to a great many processes in nature, which makes it an extremely useful concept in many contexts. Examples include collectively migrating bacteria, insects or birds, simultaneous stopping of an activity (e.g., landing of a flock of pigeons) or phenomena where groups of organisms or non-living objects synchronize their signals or motion, e.g. think of fireflies flashing in unison or people clapping in phase during rhythmic applause. The main features of collective behavior are that an individual unit's action is dominated by the influence of its neighbors, the unit behaves differently from the way it would behave on its own; and that such systems show interesting ordering phenomena as the units simultaneously change their behavior to a common pattern.Over the past decades, one of the major successes of statistical physics has been the explanation of how certain patterns can arise through the interaction of a large number of similar units. Interestingly, the units themselves can be very complex entities too, and their internal structure has little influence on the patterns they produce. It is much more the way they interact that determines the large-scale behavior of the system. Extremely complex units (e.g. cells, cars, and people) can produce relatively simpler patterns of collective behavior because their interactions (or behavior from the point of view of the outside world) can have a form that is much simpler than the structure of a unit itself.
Classes of collective migration of cells
From a general viewpoint, collectively moving entities may exhibit only a few characteristic motion patterns. Some of these are listed with particular examples in the section on the main types of collective cell motion. Modeling and simulational approaches use the notion of self-propelled particles in order to interpret the various collective motion patterns occurring in a wide range of systems containing units that tend to move with an approximately constant velocity and interact through relatively simple forces (repulsion, alignment, etc.). The studies have shown that there are only a few possible states of such systems. The list includes the following relevant cases: (i) disordered motion (the direction of motion of the units is not correlated), ordered motion (even distant units move in an approximately same direction), (iii) “turbulent motion” (there is local order but it is lost on a scale much larger than the size of the units), (iv) “steams” of units flowing opposite to each other and finally, (v) “jamming” when the restricted volume and mutual “pushing” of the units results in a highly strained, locally fluctuating but globally not moving groups of particles.Most of the observations presented above can be looked at as either analogous to one of the above general classes or being a combination of two of them.
Interpreting collective motion of cells in terms of models/equations
In the next section of this Review we shall discuss two types of models both involving equations for the positions and the velocities of the cells. First we shall consider the simplest or “minimal” models, which possess simple rules required for the emergence of collective motion. The second type of models takes into account a few further interactions, already somewhat specific to the particular experimental situation. We shall not discuss the third approach, which comprises systems of partial differential equations (continuum approach) because this framework is very theoretical.However, all three approaches lead to collective motion patterns similar to many of those observed in experiments. We shall show that indeed, equations can be used to interpret phenomena like, for example, the faster segregation of cells as a result of collective effects. Since the above mentioned equations contain only a couple of terms they cannot account for the large number of potential factors that may influence the detailed, actual motion of a cell. This can be done because details “average out” when the behavior of the whole is considered. As a consequence, it is expected that the collective motion of units has characteristic features typical for many different systems. From the point of statistical physics these could be considered as “universality classes” or major types of behavioral patterns. Observing and interpreting these patterns and their relationship to the systems which exhibit them is likely to lead to a unified picture or, in an ideal case, to the discovery of a number of basic relations or “laws” for the collective motion of cells in various biological processes.
Quantitative models
Interactions of various moving cells with their heterogeneous environment, such as in wound healing, embryonic morphogenesis, immune reactions and tumor invasion have been investigated using mathematical models (for a review, see ref. 78). As an example, a lattice-gas cellular automaton model has been used for modeling in vitro glioma cell invasion and it allows for direct comparison with morphologies and mechanisms of invading collectives.79 Computational cell biology, an emerging interdisciplinary field, attempts to mediate among several scientific communities investigating various aspects of cell motion (for a review, see ref. 80).Simplest models
In this section we first quickly review the basic computational models for the swarming behavior in general and for the collective motion of cells as well. In the subsequent sections the more detailed models that are used for explaining specific cellular phenomena will be introduced as well.In order to establish a quantitative interpretation of the behavior of large flocks, or cell populations in this particular field, in the presence of perturbations, a statistical physics type of approach was introduced by Vicsek and co-workers.81 In this cellular-automaton-like approach of self-propelled particles (SPPs), the point-like units move with a fixed absolute velocity, v0, and assume the average direction of others within a given distance R, characterized by its angle θi.:
 | (2) |
![[v with combining right harpoon above (vector)]](https://www.rsc.org/images/entities/i_char_0076_20d1.gif) ti is the velocity vector of magnitude v0 along direction θi and ξti is a delta-correlated white noise representing perturbations, while η is the noise strength. Due to its simplicity this model lacks some realistic details but it was stimulating from the point of developing it further to obtain increasingly realistic simulational models.
ti is the velocity vector of magnitude v0 along direction θi and ξti is a delta-correlated white noise representing perturbations, while η is the noise strength. Due to its simplicity this model lacks some realistic details but it was stimulating from the point of developing it further to obtain increasingly realistic simulational models.
As an extension of the above model Chaté and coworkers82,83 added adhesive interactions in the form two-body repulsive-attractive forces and endowed the particles with size.
Thus the angle of direction of motion of particle i is:
 | (3) |
 | (4) |
![[e with combining right harpoon above (vector)]](https://www.rsc.org/images/entities/i_char_0065_20d1.gif) ij is the unit vector along the segment going from i to j.
ij is the unit vector along the segment going from i to j.
The third basic model we describe here was proposed already to describe how adhesive cells, having a finite size and a reorientation mechanism, move together.2 In this model short-range attractive and repulsive intercellular forces are suggested to account for the organization of motile cells into coherent groups. Instead of applying an explicit averaging rule the model cells (self-propelled particles, SSP) adjust their direction toward the direction of the net force acting on them [eqn (4)]. In this 2-dimensional flocking model, N SSPs move with a constant velocity v0 in the direction of the unit vector ![[n with combining right harpoon above (vector)]](https://www.rsc.org/images/entities/i_char_006e_20d1.gif) i(t). In addition, independent of this active motion, cell pairs i and j also experience an intercellular force
i(t). In addition, independent of this active motion, cell pairs i and j also experience an intercellular force ![[F with combining right harpoon above (vector)]](https://www.rsc.org/images/entities/i_char_0046_20d1.gif) (
(![[r with combining right harpoon above (vector)]](https://www.rsc.org/images/entities/i_char_0072_20d1.gif) i,
i, ![[r with combining right harpoon above (vector)]](https://www.rsc.org/images/entities/i_char_0072_20d1.gif) j) which moves the cells' positions
j) which moves the cells' positions ![[r with combining right harpoon above (vector)]](https://www.rsc.org/images/entities/i_char_0072_20d1.gif) i(t) with a mobility μ. Thus the motion of cell i is described by the following equation:
i(t) with a mobility μ. Thus the motion of cell i is described by the following equation:
 | (5) |
![[n with combining right harpoon above (vector)]](https://www.rsc.org/images/entities/i_char_006e_20d1.gif) i(t) is θni(t), which is assumed to align with the physical total displacement
i(t) is θni(t), which is assumed to align with the physical total displacement ![[v with combining right harpoon above (vector)]](https://www.rsc.org/images/entities/i_char_0076_20d1.gif) i(t) = d
i(t) = d![[r with combining right harpoon above (vector)]](https://www.rsc.org/images/entities/i_char_0072_20d1.gif) i(t)/dt with a relaxation time t, given by the following equation:
i(t)/dt with a relaxation time t, given by the following equation: | (6) |
![[n with combining right harpoon above (vector)]](https://www.rsc.org/images/entities/i_char_006e_20d1.gif) i(t) and velocity vector
i(t) and velocity vector ![[v with combining right harpoon above (vector)]](https://www.rsc.org/images/entities/i_char_0076_20d1.gif) i(t) is denoted by δ and imperfect alignment is represented by a noise term ξ.
i(t) is denoted by δ and imperfect alignment is represented by a noise term ξ.
Although the above models are formulated for the two-dimensional case (sheet migration) it is possible to extend them to three-dimensional cases.
The typical simulation results obtained by solving eqn (5) and (6) with periodic boundary conditions, and shown in Fig. 14, are in agreement with observations on sheet migration (Fig. 1), exhibiting a continuous (second order) phase transition from disordered to ordered phase as a function of increasing cell density used as control parameter.
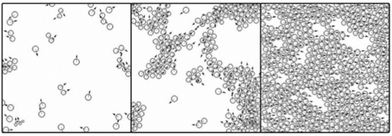 | ||
| Fig. 14 Computer simulations obtained by solving eqn (5) and (6) for different particle densities. In agreement with the observations, the model exhibits a continuous phase transition from disordered to ordered phase. Also see Reference video 1. From Szabó et al., (2006) with permission of Phys. Rev. E: Stat., Nonlinear, Soft Matter Phys. | ||
Modeling of streaming in cell monolayers
Streaming in monolayers was modeled by Czirok and coworkers4,16 using Cellular Potts Model (CPM, also called Glazier–Grainer–Hogweg Model), a widely used representation of individual cells and their adhesion. In the CPM approach, a goal function (‘energy’) is assigned to each configuration of cells. The goal function guides the cell behavior by distinguishing between favorable (low u) and unfavorable (high u) configurations as: | (7) |
 | (8) |
 | (9) |
| Δpk = −rpk + ΔXk | (10) |
The cell polarity rule [eqn (9)] and the memory rule [eqn (10)] together constitute a positive feedback loop. The simulations have been performed applying periodic boundary conditions.
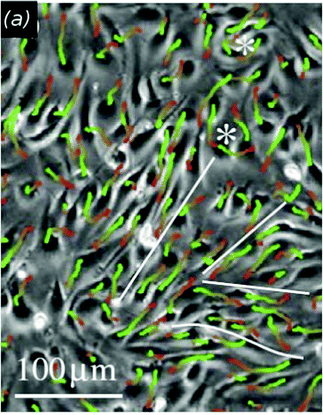
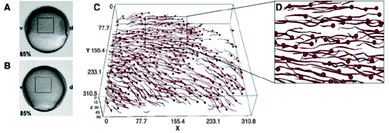
Results from simulations fit well with experimentally observed streaming patterns in endothelial monolayers: streaming motion, shear lines and vortices are seen, as shown in Fig. 15 (also see Reference videos 10 and 11).
Modeling of the role of leadership
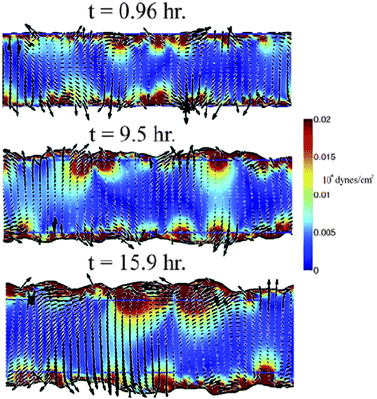
Based on experimental data from wound-healing assays with MDCK cell layers and measurable parameters of cell motion Lee et al.84 developed a mathematical model incorporating the bulk features of single migrating cells and cell–cell adhesions.The principal driving force in their model comes from the polarization of crawling cells: single crawling cells exert a dipole-distributed force distribution on the substrate. At the edge of the wound this force distribution acts like a pressure pulling the cells out into the cell-free region. Within the cell-filled region the force distribution causes instabilities leading to the experimentally observed flow fields including vortices, jets and fingering-like appearance of the moving boundary (Fig. 16).
In this model the cells are equivalent without differentiation into leaders and followers and as a result the boundary fingering is not as pronounced as what is observed experimentally. Cell–cell adhesions cause the monolayer to act like a viscoelastic fluid that is rigid on short timescales and flows on longer timescales.
This model's behavior such as the dynamics of the boundary advance matches well the data from experiments by Poujade et al. (Fig. 3).20 In various model simulations they have shown that wound healing may not require substantial biochemical signaling but the process may result only from the typical dynamics of motile cells while intercellular signaling only modifies the force production in cells at different distances from the boundary.
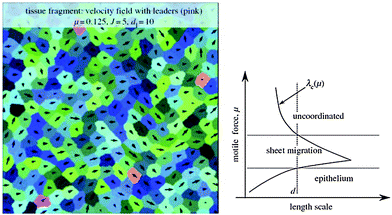
Using computer simulations Kabla85 studied collective migration and its dependence on the number, motile force and cohesion energy of constituent cells. In these simulations, the degree of global coordination is quantified as mean velocity across the whole population normalized by the mean cell speed (〈v〉/〈|v|〉) corresponding to an order parameter taking values from 0 (no order) to 1 (full coordination or sheet migration). This order parameter depends on motile force (μ), cohesion energy (J) and system size. Typical length scales, λg (μ, J) can be identified corresponding to the largest system size where global coordination can arise spontaneously. For small populations of 10–100 uncoordinated cells it is shown that increase of motile force, μ, or decrease of cohesion energy, J, could trigger sheet migration without the need for specific signaling cues (Fig. 17).
The impact of leader cells and the integration of external directionality cues are also discussed. It is assumed here that leader cells are not concentrated at boundaries but scattered throughout the cell population. The susceptibility of the cell population to steering by ‘informed’ leader cells whose directional preference is based on e.g. sensing external cues depends on the distance between leader cells, dl (also manifested as leader cell density) and the collective effects in the bulk of the population.
Small relative number of leader cells (∼1%) are sufficient to coordinate the whole cell population if dl < λl (μ, J) ≈ λc (μ, J) where λc is the correlation length of the average velocity field in the direction of local velocity, measured in the absence of leader cells.
As each leader cell influences the dynamics of the cells present within a domain of diameter λc around it, global coordination can be achieved if the density of leader cells is larger than 1 for every domain λc2. This way, large-scale coordination does not require explicit communication between leader and non-leader cells or long-range mechanical coupling through the substrate. Different regimes can be defined for a given correlation length scale as motile force is increased: (non-moving) epithelium, sheet migration and uncoordinated migration (Fig. 17).
Modeling of embryonic vascular network formation
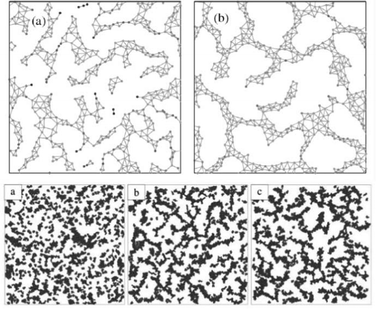
Early vascular network formation is a self-organizing process apparently lacking external prepatterns that vascular precursor cells could follow to get organized into a polygonal network, observed during in vivo development. Based on the simple assumption that endothelial cells preferentially attract to elongated cell structures, Czirok and coworkers performed computer simulations with both an agent-based model86 and a modified Cellular Potts Model43 and were able to create polygonal cell structures forming with a dynamism resembling the early vascular network of bird embryos (Fig. 18, also see Reference video 12). In the agent-based model, the simulated network of cells evolve into a quasistationary state in which the formation of new branches by preferential attraction mechanism is counterbalanced by coarsening of the network through merger of branches driven by surface tension. The characteristic size of the polygonal network depends on cell density.An alternative mathematical model is based on the assumption that endodermal signaling exerting a paracrine effect on endothelial precursors is mediated by binding to the extracellular matrix deposited by the endothelial precursors.87
Modeling of gastrulation in the zebrafish embryo
Gastrulation of the zebrafish embryo was studied with the help of a numerical simulation by Arboleda-Estudillo et al.5 In their simulation the migration of cells is mediated by 4 different force types: (1) a short-range repulsive, mid-range attractive spring force (fs) representing cell adhesion; (2) a chemotactic force (fc) modeling polarized migration; (3) a “Vicsek et al. type” force, fv, modeling collective migration as each cell attempts to align its direction with its neighbors; (4) noise force (fn) modeling random migration.For a system of N cells, labeled by ri, the system of N coupled Langevin equations are numerically integrated:
 | (11) |
Modeling of collective migration of the posterior lateral line primordium of the zebrafish
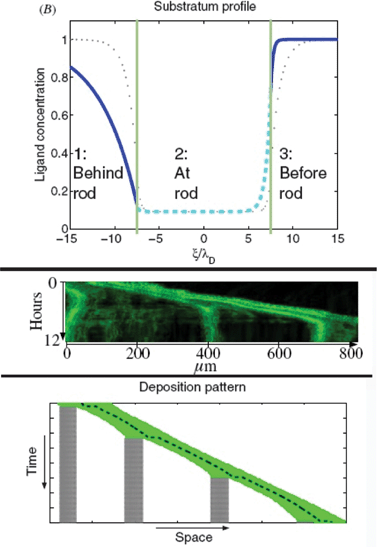
Based on experimental data from lateral line development in the zebrafish Streichan et al.88 have devised a model integrating numerous known factors of the process (Fig. 19). They propose a dynamically established and maintained mechanism in which there is no need for an already established chemokine ligand gradient to direct the migration of a cell collective. In their model the cell collective actively modulates the isotropically expressed chemokine. The ligand is degraded and co-internalized with receptor, which reduces ligand concentration in the vicinity of the tissue. As the tissue moves it shapes the ligand distribution to an asymmetric profile resulting in a new mean gradient in ligand concentration in the direction of migration. Hence collective migration creates a length- and velocity-dependent polar gradient. Cells encode an initial symmetry breaking in their velocity to shape the chemokine ligand, initiate the traveling wave and maintain the preferred direction of motion.The model makes predictions on the length-dependent dynamics of the lateral line primordium and the spatio-temporal dynamics of receptor–ligand interaction. Authors identify competition between the front and the rear arising from tissue extensions above a critical length and leading to deposition of cells as the collective migrates along.
Modeling of neural crest cell migration and collective chemotaxis
Collective chemotactic migration of groups of neural crest cells has been subjected to various modelling approaches. An agent-based model has been elaborated by Mayor and coworkers on the basis of the cellular and molecular mechanisms reported so far to underlie neural crest cell migration.Importantly, this model does not assume neural crest cells to functionally differentiate into leaders or followers. The (i) short-range repulsive interactions corresponding to contact inhibition of locomotion and (ii) longer-range mutual attractive interactions among cells and (iii) migration biased towards a chemotactic gradient have been implemented in the model.
Corresponding simulations have shown that these three are sufficient to reproduce the group migration dynamics of NC cells observed experimentally.32 An alternative agent-based model of the chain migration of neural crest cells is based on the assumption that leaders and followers differentiate from a homogeneous population NC cells. Leaders are directionally biased towards a target and followers move towards the least resistance in the extracellular matrix opened up by leaders while contact guidance by filopodial interactions among cells further helps them follow the leaders.89
Modeling of vasculogenesis by a biophysical mechanism
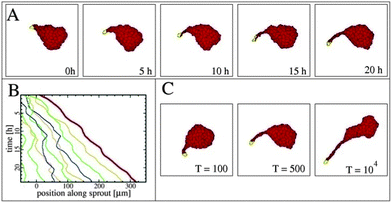
The basic process of vascular network formation is the initiation and development of multicellular sprouts maturated into blood vessels later on. Szabo et al. studied sprouting in a simplified in vitro system without chemokines.43 Motivated by experimental findings they have developed a model based on the assumption of preferential adhesion to elongated cells (Fig. 20).90 In their modified Cellular Potts Model cells prefer to be adjacent to other stalk cells rather than staying in the aggregate (see Reference video 13). The presence of persistently moving tip cells and the preferential adhesion assumption are together sufficient to generate expanding sprouts in computer simulations with this model (reviewed in ref. 16, 91 and 92).Another approach of modeling angiogenic network formation based on purely local mechanisms was elaborated by Deutsch and coworkers.93
In their lattice-gas cellular automaton model the increased movement coordination and cell–cell adhesion of simulated cells in response to homogeneous growth factor (VEGF) stimulation is sufficient to result in angiogenic sprouts resembling the image data from in vitro experiments with endothelial cells.94 In particular, this model does not assume changes in contact guidance or extracellular matrix remodeling or spatial gradient of growth factor.
Modeling of vasculogenesis by chemotaxis
Vascular sprouting can be approached as a process in which cells secrete a diffusible chemoattractant morphogen thereby inducing autocrine chemotactic signaling.44–46 Glazier and coworkers investigated this mechanism using a computer model.95,96In their Cellular Potts Model they assume finite compressibility of cells and as a result effective pressure is developed within the aggregate formed by cells migrating toward the chemoattractant produced by the cells while the steepest gradient is at the surface. Chemotaxis and pseudopod formation by a cell is assumed to be inhibited by surrounding cells through a mechanism called ‘contact inhibition’. If random motility fluctuations move a cell away from the cluster it will sense a weaker chemoattractant gradient and the pressure of the compressed cells continues to push the same cell outward, while pseudopod formation of the cell is released from contact inhibition.
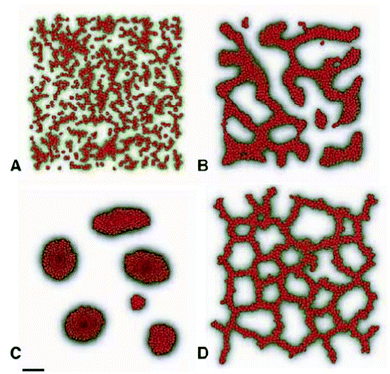
Simulations with this model yield sprouts and network formation (Fig. 21) and show that the sprouting process is facilitated by cells' finite cell size, the presence of elongated cells and increased chemotactic sensitivity.
The model also assumes that the main source of the chemoattractant ligand is the endothelial cells themselves. This assumption, however, conflicts with experimental data on the production and abundance of VEGF, the candidate chemoattractant morphogen. This contradiction can be overcome by assuming a secondary mechanism creating a gradient from even distribution of VEGF by sequestration.
A recent computational study97 has demonstrated that if production of soluble VEGFR1 is proportional to endothelial cell density while VEGF production is uniform and high, a gradient of VEGF-induced signaling through VEGFR2 receptor is established along the sprout surface with highest signaling activity at the sprout tip. Experimental data on a secreted diffusible VEGF receptor support the existence of such a mechanism.47,48
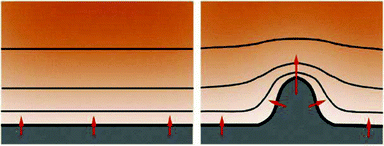
The patterning process based on extension of a structure up the gradient of an external diffusible factor has an established theory. If the concentration of the diffusible factor is kept low at the interface of the cell aggregate while it is uniformly high far from it, and if concentration is proportional to the local curvature of the interface, such a setting results in classic Mullins–Sekerka instability, shown to be responsible for the formation of dense branching patterns in various physical systems. The Mullins–Sekerka instability makes the smooth surface unstable: a spontaneous outgrowth with higher curvature will sense a steeper gradient, which accelerates its growth, provided that adaptation of the gradient is slower than such growth (Fig. 22). This way the instability triggers a spontaneous tip-splitting process creating structures with characteristic branching morphology.
The branching process is balanced by the fact that very thin sprout with very large curvature at its tip cannot reduce the diffusible factor concentration so efficiently due to its small size and thus the gradient will become shallower, resulting in slower growth. Eventually, optimal branch width can develop with thicker branches splitting and thinner branches slowing down and growing laterally. While experimental verification is yet to be established, the patterning mechanism based on diffusible secreted inhibitor is a promising approach to understand vascular sprouting.
Modeling of cellular segregation
Several computational models exist that attempt to explain and reproduce the experimentally observed segregation processes in various systems. A widely accepted model based on the Potts model and the idea of differential cell adhesion was developed by J Glazier and co-workers, later termed as the Glazier–Graner–Hogeweg model or the Cellular Potts model.68 Variants of this model have been successfully employed in simulation studies up to the present day.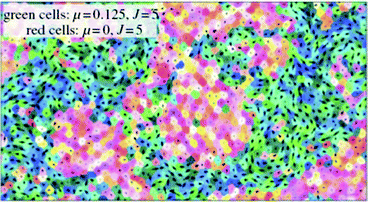 | ||
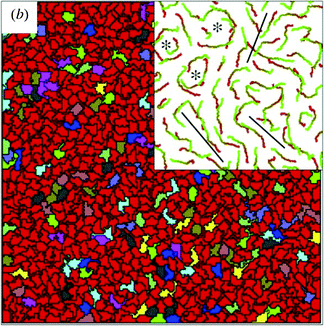
| Fig. 23 Simulated segregation of motile and non-motile cells. A snapshot of the simulated segregating tissue of motile and non-motile cells at t = 106 MCS (Monte-Carlo steps). Membrane tension, J, and motile force, μ, of cells are indicated. From Kabla (2012)25 with permission of J. R. Soc Interface. | ||
Recently, Nakajima and Ishihara used Cellular Potts model simulations to study the dynamics of the segregation of mixtures of non-self-propelled cell types with diffusive motion.51 They have found that the increase in the size of segregated domains follows the power law and the growth exponent is n = 1/3 for mixtures with 1![[thin space (1/6-em)]](https://www.rsc.org/images/entities/char_2009.gif) :
:![[thin space (1/6-em)]](https://www.rsc.org/images/entities/char_2009.gif) 1 initial ratio of cell types where segregation proceeds via smoothing of the domain boundary. This is in contrast to previous studies with CPM on smaller simulated systems displaying slower logarithmic growth for domain size.69,98 CPM simulations with self-propelled cell types characterized by identical adhesive interactions as for the simulations by Nakajima and Ishihara51 also yield domain growth exponent n = 1/3 (A. Czirók, personal communication).
1 initial ratio of cell types where segregation proceeds via smoothing of the domain boundary. This is in contrast to previous studies with CPM on smaller simulated systems displaying slower logarithmic growth for domain size.69,98 CPM simulations with self-propelled cell types characterized by identical adhesive interactions as for the simulations by Nakajima and Ishihara51 also yield domain growth exponent n = 1/3 (A. Czirók, personal communication).
Using Brownian dynamics simulations McCandlish et al. studied dense mixtures of self-propelled and passive rod-like particles in 2-dimensions where only excluded volume interactions can occur.99 Adhesion properties do not play a role here, particles only differ in motility. Spontaneous segregation of the two particle species generates a rich array of dynamical domain structures with properties depending on the particle shape and propulsion velocity or the combination of these two in the form of the particles' Péclet number, a measure similar to the directional persistence of live cells.
Qualitative description of the dynamical features and the geometry of cell segregation depending on intercellular adhesion parameters was provided by Voss-Böhme and Deutsch using a stochastic interacting particle model.101 In this model the hierarchy of segregation is determined by the strengths of adhesive interactions between cells and the boundary.
In a unique paper combining experimental data and modeling Krieg et al.58 studied the role of cell-cortex tension and adhesion in the segregation of germ line progenitors of the zebrafish. Carrying out simulations using Cellular Potts Model with cell adhesion and cell-cortex tension data derived from experiments they could reproduce the experimentally observed final configurations of segregating germ line progenitor cell types.
 | (12) |
![[e with combining right harpoon above (vector)]](https://www.rsc.org/images/entities/i_char_0065_20d1.gif) tnm is the force exerted by particle m on particle n along the direction
tnm is the force exerted by particle m on particle n along the direction ![[e with combining right harpoon above (vector)]](https://www.rsc.org/images/entities/i_char_0065_20d1.gif) tnm pointing from particle m to n.
tnm pointing from particle m to n.
Noise is taken into account by ![[u with combining right harpoon above (vector)]](https://www.rsc.org/images/entities/i_char_0075_20d1.gif) tn is a unit vector with random, uniformly distributed orientation.
tn is a unit vector with random, uniformly distributed orientation.
Here, αnm and βnm are control parameters: α controls the relative weight of the alignment interaction and β shows the strength of the radial two-body forces fnm, defined as:
 | (13) |
Having the classic experiments with hydra cells in mind, authors defined two kinds of particles, “endodermic” and “ectodermic”, denoted by 1 and 2, respectively. Accordingly, β11 and β22 stand for adhesion within the given cell type, whereas β12 = β21 account for symmetric inter-cell-type interactions. Differential adhesion is described by different beta values for symmetric interactions between different cell types. The simulations were performed with cells on a square domain with linear size several magnitudes larger than cell size. Fig. 25 shows snapshots from the evolution of the segregation process. Simulation results are in agreement with experiments of Rieu et al. with dissociated ectodermal and endodermal cells of Hydra viridissima.102
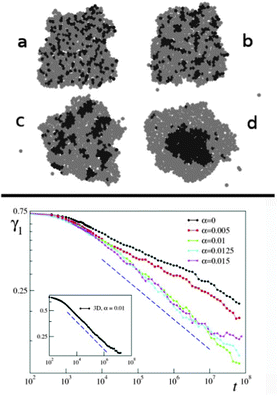 | ||
Fig. 25 Segregation dynamics of simulated ectoderm and endoderm cells. Upper panel: cell sorting of 800 cells. The endodermal and ectodermal cells are represented by black and gray circles, respectively. (a) The initial cluster with mixed cell types. (b) The cluster after 3000 time steps and (c) is taken at t = 3 × 10⁵. Clusters of endodermal cells form and grow as time passes by. (d) At t = 2 × 10⁶ a single endodermal cluster is formed, but isolated cells remain within the ectoderm tissue, in agreement with experiments of Rieu et al., 1998.102 Lower panel: cell sorting in two dimensions from a random, roughly circular initial aggregate of N = 6400 cells in a proportion of 1![[thin space (1/6-em)]](https://www.rsc.org/images/entities/char_2009.gif) : :![[thin space (1/6-em)]](https://www.rsc.org/images/entities/char_2009.gif) 3 endodermic to ectodermic cells. Evolution of the segregation index, γ, for different α values. The dashed line has a slope −λ = −0.18. Inset: same in three dimensions but with α = 0.01 and β11 = 8.3. The dashed line has a slope −0.16. From Belmonte et al. (2008)63 with permission of Phys. Rev. Lett. 3 endodermic to ectodermic cells. Evolution of the segregation index, γ, for different α values. The dashed line has a slope −λ = −0.18. Inset: same in three dimensions but with α = 0.01 and β11 = 8.3. The dashed line has a slope −0.16. From Belmonte et al. (2008)63 with permission of Phys. Rev. Lett. | ||
In this model, segregation is characterized by an index, γ, showing the average ratio of dissimilar cells around a cell, for either cell types. This index is decreasing as segregation proceeds and it is expected to approach zero in large systems.
Authors have found that segregation is characterized by algebraic scaling laws and introducing even a moderate amount of local coherent motion will considerably speed up the segregation process (Fig. 25).
A variant of this computational model has been published by Beatrici and Brunnet investigating the segregation of self-propelled particles in 2 dimensions, driven by differences only in motility but not in adhesion.103 In this model, the faster cells envelope the slower cells forming islands as segregation proceeds.
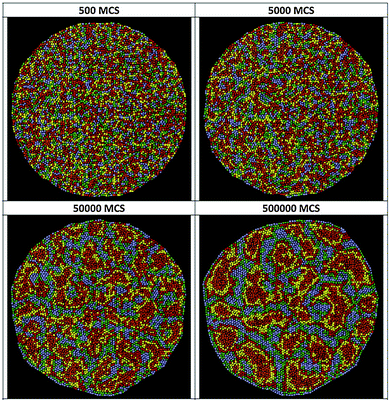
Further developing the model collective motion of Vicsek and coworkers2 Mones et al. have recently carried out simulations of the segregation behavior of ‘self-propelled’ particle types compared with that of ‘noise-driven’ particle types.62 To represent interactions with neighbors, particle types were assigned characteristically different two-body attraction/repulsion forces based on experimental data with live cells. Noise-driven particle types, endowed with inherent random motion and no ability to have information from neighbors, segregate with similar dynamism as particles in Potts model simulations by Nakajima and Ishihara,52i.e. exponent values ∼1/3 characterize the growth of segregated domains. As a contrast, self-propelled particles with persistent motion and the ability to align their motion to neighbors in response to impact by neighbors segregate much faster, with growth exponents ∼1, and their dynamism resembles earlier observations of two-dimensional and three-dimensional segregation of cells in culture.51,56
Although three-dimensional simulations and models have been deployed in other fields of cell motion,79 approaching the phenomenon of three-dimensional segregation with such models remains an area yet to be explored by computational modelers.
Conclusions
The way we approach and understand the events of developmental biology such as collective cell motion and pattern formation by multicellular segregation is gradually shifting from a descriptive view towards a causative understanding of the mechanisms. To facilitate this understanding, integrative biological attempts have been successfully employing various approaches ranging from experimental embryology to statistical physics. The introduction of computational models simulating the behavior of complex developmental systems can also effectively facilitate the way we interpret them. Combination of multi-disciplinary approaches with experimental data can help us design more focused experimental tests or predict yet unseen outcomes. This way they can even further extend our understanding of the dynamic organization of multicellular biological systems.Video references
Reference video 1
Time-lapse sequences of phase contrast images showing the motility of fish epidermal keratocyte cells at three different densities. Each video is 4 hours long. Robust collective behavior can be observed as the density of cells reaches a critical value around 5 × 10⁻⁴ cell per square microns. This spectacular ordering phenomenon resembles the well-known flocking of fish or birds.B. Szabó, G. J. Szöllösi, B. Gönci, Z. Jurányi, D. Selmeczi, T. Vicsek, Phase transition in the collective migration of tissue cells: experiment and model, Phys. Rev. E: Stat., Nonlinear, Soft Matter Phys., 2006, 74, 061908. http://angel.elte.hu/%E2%88%BCbszabo/collectivecells/
Reference video 2
Low magnification dynamic imaging of Tg(tie1:H2B-eYFPct2) quail embryo. Dynamic imaging of Tg(tie1:H2B-eYFPct2) quail embryo using Leica DMR upright microscope in DIC and epifluorescence modes with a 5× objective for ∼36 hours every 13 minutes. Scale bar = 600 μm.Y. Sato, G. Poynter, D. Huss, M. B. Filla, A. Czirok, B. J. Rongish, C. D. Little, S. E. Fraser, R. Lansford, Dynamic analysis of vascular morphogenesis using transgenic quail embryos, PLoS One, 2010, 5, e12674. http://www.plosone.org/article/fetchSingleRepresentation.action?uri=info:doi/10.1371/journal.pone.<?ccdc_no 0012674?>0012674<?ccdc END?>.s001
Reference video 3
Time-lapse movie showing Tg(tie1:H2B-eYFP) cell nuclei (green) surrounded by QH1 + plasma membrane (red) in endothelial cells. Tg(tie1:H2B-eYFP) quail embryos were injected with QH1-A647 at stages 7 and 8 and time-lapse captured every 13 minutes for 8.5 hours until 15 somites (stage 11). The images were acquired on the upright microscope with the dorsal side against the EC Agar culture using the 10× objective and 2 × 2 binning. 2 × 5 × 9 Mosaic. Scale bar = 100 μm.Y. Sato, G. Poynter, D. Huss, M. B. Filla, A. Czirok, B. J. Rongish, C. D. Little, S. E. Fraser, R Lansford, Dynamic analysis of vascular morphogenesis using transgenic quail embryos, PLoS One, 2010, 5, e12674. http://www.plosone.org/article/fetchSingleRepresentation.action?uri=info:doi/10.1371/journal.pone.<?ccdc_no 0012674?>0012674<?ccdc END?>.s002
Reference video 4
DIC movie of paraxial mesendoderm cells in a wild-type zebrafish embryo between 6 and 8 hours postfertilization. Two exemplary cell couplets were tracked using Fiji software. Yellow arrows indicate transient separation of the tracked cell couplet. Dorsal is to the right and animal to the top. Scale bar represents 14 μm.Y. Arboleda-Estudillo, M. Krieg, J. Stühmer, N. A. Licata, D. J. Muller, C. P. Heisenberg: Movement directionality in collective migration of germ layer progenitors, Curr. Biol., 2010, 20, 161–169. http://www.sciencedirect.com/science/MiamiMultiMediaURL/1-s2.0-S096098220902051X/1-s2.0-S096098220902051X-mmc3.mov/272099/FULL/S096098220902051X/10517fa3273d2ccb74fcd03f973bc28f/mmc3.mov
Reference video 5
DIC Movie of Paraxial Mesendoderm Cells in an e-cadherin Morphant Embryo (4 ng MO per embryo) between 6 and 8 hours postfertilization. Two exemplary cell couplets were tracked using Fiji software. Yellow arrows indicate transient separation of the tracked cell couplet. Dorsal is to the right and animal to the top. Scale bar represents 14 μm.Y. Arboleda-Estudillo, M. Krieg, J. Stühmer, N. A. Licata, D. J. Muller, C. P. Heisenberg, Movement directionality in collective migration of germ layer progenitors, Curr. Biol., 2010, 20, 161–169. http://www.sciencedirect.com/science/MiamiMultiMediaURL/1-s2.0-S096098220902051X/1-s2.0-S096098220902051X-mmc4.mov/272099/FULL/S096098220902051X/83eb5d172ca7a5670a948d4b64a57abf/mmc4.mov
Reference video 6
Low-power overview of lateral line morphogenesis. Imaging allows us to follow the planar path from 28 hpf to 38 hpf. Cells at the trailing edge of the migrating posterior lateral line primordium slow down and eventually stop moving by forming a round proneuromast. Deposited proneuromasts stay interconnected by a chain of cells. The developing pronephros is also labelled by the CldnB::GFP line. Images captured every 4 min using a LSM510 Meta 10×/0.3NA objective.P. Haas, D. Gilmour, Chemokine signaling mediates self-organizing tissue migration in the zebrafish lateral line, Dev. Cell, 2006, 10, 673–680. http://www.sciencedirect.com/science/MiamiMultiMediaURL/1-s2.0-S1534580706001195/1-s2.0-S1534580706001195-mmc2.mov/272236/FULL/S1534580706001195/03510571f498e5d3d555136e75519d12/mmc2.mov
Reference video 7
Time-lapse movie shows![[left double angle bracket]](https://www.rsc.org/images/entities/char_27ea.gif) u-turn
u-turn![[right double angle bracket]](https://www.rsc.org/images/entities/char_27eb.gif) manoeuvre of the posterior lateral line primordium in an fss mutant embryo at 30 hpf. Note that once the back-flip is complete, the tip of the primordium migrates efficiently in the reverse direction and also deposits pro-neuromasts from the trailing edge. Frames were captured every 2 min using a 20×/0.5NA objective. Movie length: 320 min.
manoeuvre of the posterior lateral line primordium in an fss mutant embryo at 30 hpf. Note that once the back-flip is complete, the tip of the primordium migrates efficiently in the reverse direction and also deposits pro-neuromasts from the trailing edge. Frames were captured every 2 min using a 20×/0.5NA objective. Movie length: 320 min.
P. Haas, D. Gilmour, Chemokine signaling mediates self-organizing tissue migration in the zebrafish lateral line, Dev. Cell, 2006, 10, 673–680. http://www.sciencedirect.com/science/MiamiMultiMediaURL/1-s2.0-S1534580706001195/1-s2.0-S1534580706001195-mmc7.mov/272236/FULL/S1534580706001195/9d6b4b912e34b2a07cd1de28afe244bd/mmc7.mov
Reference video 8
Spontaneously segregating primary fish keratocytes and EPC keratocytes in mixed co-culture. Merged double fluorescent + phase contrast time-lapse video showing a segregating co-culture of primary goldfish keratocytes (PFK, red) + EPC keratocytes (green). Note the fast growth of homotypic cell clusters.E. Méhes, E. Mones, V. Németh, T. Vicsek, Collective motion of cells mediates segregation and pattern formation in co-cultures, PLoS One, 2012, 7, e31711. http://www.plosone.org/article/fetchSingleRepresentation.action?uri=info:doi/10.1371/journal.pone.<?ccdc_no 0031711?>0031711<?ccdc END?>.s005
Reference video 9
Merged phase-contrast + fluorescent time-lapse movie of 3-dimensional segregation of mixed tissue cells. Segregation in a mixed co-culture of primary goldfish keratocytes (PFK, red) and EPC fish keratocytes (EPC, green) suspended in agarose micromold is imaged by videomicroscopy. Segregated domains quickly form without engulfment. Fluorescent cell labels: red: cell tracker CMPTX, green: cell tracker CMFDA. Videomicroscopy duration: 20 hours, images were acquired every 10 minutes by a Zeiss Axio Observer system.E. Méhes, T. Vicsek, Segregation mechanisms of tissue cells: from experimental data to models, Complex Adaptive Syst. Model, 2013, 1, 4. http://www.casmodeling.com/content/supplementary/2194-3206-1-4-s2.mov
Reference video 10
Phase contrast time-lapse movie of bovine aortic endothelial cells in monolayer. Cells form streams: 5–20 cells move together in narrow, chain-like groups. Trajectories of individual cells are shown in changing colors. Duration: 150 minutes.A. Szabó, R. Unnep, E. Méhes, W. O. Twal, W. S. Argraves, Y. Cao, A. Czirók, Collective cell motion in endothelial monolayers, Phys. Biol., 2010, 7, 046007. http://www.ncbi.nlm.nih.gov/pmc/articles/PMC3044241/bin/NIHMS265367-supplement-Movie_1.mov
Reference video 11
Movie of the streaming motion of cells simulated using a self-propelled Cellular Potts model. The feedback between cell polarity and cell displacements yield shear lines and vortices, similar to those seen in endothelial cell monolayers.A. Szabó, R. Unnep, E. Móhes, W. O. Twal, W. S. Argraves, Y. Cao, A. Czirók, Collective cell motion in endothelial monolayers, Phys. Biol., 2010, 7, 046007. http://www.ncbi.nlm.nih.gov/pmc/articles/PMC3044241/bin/NIHMS265367-supplement-Movie_3.mpeg
Reference video 12
Simulation movie of network formation of endothelial cells generated by Cellular Potts Model simulation. Preferred adhesion to elongated cells stabilizes and promotes the formation of multicellular sprouts.A. Szabo, E. Mehes, E. Kosa, A. Czirok, Multicellular sprouting in vitro, Biophys. J., 2008, 95, 2702–2710. http://www.sciencedirect.com/science/MiamiMultiMediaURL/1-s2.0-S0006349508784157/1-s2.0-S0006349508784157-mmc4.avi/277708/FULL/S0006349508784157/e2f08f3884c8f08c0bce1b5f732d381e/mmc4.avi
Reference video 13
Cellular Potts Model simulation movie of multicellular sprout elongation. A leader cell (yellow) is assumed to move randomly with a persistent polarity while remaining cells (red) are assumed to prefer adhesion to elongated rather than well-spread cells. This preference helps cells leave the initial aggregate and enter the sprout.A. Szabó, A. Czirók, The Role of Cell-Cell Adhesion in the Formation of Multicellular Sprouts, Math. Modell. Nat. Phenom., 2010, 5, 106. http://pearl.elte.hu/andras/sprout_model.avi
Acknowledgements
We acknowledge support from the EU FP7 ERC COLLMOT GRANT No: 227878. We thank A. Czirok (Eötvös University, Dept. Biological Physics) for useful consultations.References
- T. Vicsek and A. Zafeiris, Phys. Rep., 2012, 517, 71 CrossRef PubMed.
- B. Szabó, G. J. Szöllösi, B. Gönci, Z. Jurányi, D. Selmeczi and T. Vicsek, Phys. Rev. E: Stat., Nonlinear, Soft Matter Phys., 2006, 74, 061908 CrossRef.
- P. Vitorino and T. Meyer, Genes Dev., 2008, 22, 3268 CrossRef CAS PubMed.
- A. Szabó, R. Unnep, E. Méhes, W. O. Twal, W. S. Argraves, Y. Cao and A. Czirók, Phys. Biol., 2010, 7, 046007 CrossRef PubMed.
- Y. Arboleda-Estudillo, M. Krieg, J. Stühmer, N. A. Licata, D. J. Muller and C. P. Heisenberg, Curr. Biol., 2010, 20, 161 CrossRef CAS PubMed.
- P. Haas and D. Gilmour, Dev. Cell, 2006, 10, 673 CrossRef CAS PubMed.
- A. S. Ghabrial and M. A. Krasnow, Nature, 2006, 441, 746 CrossRef CAS PubMed.
- L. Jakobsson, C. A. Franco, K. Bentley, R. T. Collins, B. Ponsioen, I. M. Aspalter, I. Rosewell, M. Busse, G. Thurston, A. Medvinsky, S. Schulte-Merker and H. Gerhardt, Nat. Cell Biol., 2010, 12, 943 CrossRef CAS PubMed.
- D. J. Montell, W. H. Yoon and M. Starz-Gaiano, Nat. Rev. Mol. Cell Biol., 2012, 13, 631 CrossRef CAS PubMed.
- P. Friedl, Y. Hegerfeldt and M. Tusch, Int. J. Dev. Biol., 2004, 48, 441 CrossRef CAS.
- P. Friedl and D. Gilmour, Nat. Rev. Mol. Cell Biol., 2009, 10, 445 CrossRef CAS PubMed.
- P. Friedl, J. Locker, E. Sahai and J. E. Segall, Nat. Cell Biol., 2012, 14, 777 CrossRef PubMed.
- O. Ilina and P. Friedl, J. Cell Sci., 2009, 122, 3203 CrossRef CAS PubMed.
- Y. Sato, G. Poynter, D. Huss, M. B. Filla, A. Czirok, B. J. Rongish, C. D. Little, S. E. Fraser and R. Lansford, PLoS One, 2010, 5, e12674 Search PubMed.
- J. B. Beltman, A. F. Marée, J. N. Lynch, M. J. Miller and R. J. de Boer, J. Exp. Med., 2007, 204, 771 CrossRef CAS PubMed.
- A. Czirok, Wiley Interdiscip. Rev.: Syst. Biol. Med., 2013, 5, 587 CrossRef CAS PubMed.
- A. A. Khalil and P. Friedl, Integr. Biol., 2010, 2, 568 RSC.
- X. Trepat, M. R. Wasserman, T. E. Angelini, E. Millet, D. A. Weitz, J. P. Butler and J. J. Fredberg, Nat. Phys., 2009, 5, 426 CrossRef CAS.
- D. T. Tambe, C. C. Hardin, T. E. Angelini, K. Rajendran, C. Y. Park, X. Serra-Picamal, E. H. Zhou, M. H. Zaman, J. P. Butler, D. A. Weitz, J. J. Fredberg and X. Trepat, Nat. Mater., 2011, 10, 469 CrossRef CAS PubMed.
- M. Poujade, E. Grasland-Mongrain, A. Hertzog, J. Jouanneau, P. Chavrier, B. Ladoux, A. Buguin and P. Silberzan, Proc. Natl. Acad. Sci. U. S. A., 2007, 104, 15988 CrossRef CAS PubMed.
- K. Doxzen, S. R. Vedula, M. C. Leong, H. Hirata, N. S. Gov, A. J. Kabla, B. Ladoux and C. T. Lim, Integr. Biol., 2013, 5, 1026 RSC.
- S. R. Vedula, M. C. Leong, T. L. Lai, P. Hersen, A. J. Kabla, C. T. Lim and B. Ladoux, Proc. Natl. Acad. Sci. U. S. A., 2012, 109, 12974 CrossRef CAS PubMed.
- A. Czirók, K. Varga, E. Méhes and A. Szabó, New J. Phys., 2013, 15, 075006 CrossRef PubMed.
- W. Risau and I. Flamme, Annu. Rev. Cell Dev. Biol., 1995, 11, 73 CrossRef CAS PubMed.
- C. J. Drake, S. J. Brandt, T. C. Trusk and C. D. Little, Dev. Biol., 1997, 192, 17 CrossRef CAS PubMed.
- P. A. Rupp, A. Czirók and C. D. Little, Development, 2004, 131, 2887 CrossRef CAS PubMed.
- J. G. Dumortier, S. Martin, D. Meyer, F. M. Rosa and N. B. David, Proc. Natl. Acad. Sci. U. S. A., 2012, 109, 16945 CrossRef CAS PubMed.
- C. P. Heisenberg and Y. Bellaïche, Cell, 2013, 153, 948 CrossRef CAS PubMed.
- G. Valentin, P. Haas and D. Gilmour, Curr. Biol., 2007, 17, 1026 CrossRef CAS PubMed.
- E. Donà, J. D. Barry, G. Valentin, C. Quirin, A. Khmelinskii, A. Kunze, S. Durdu, L. R. Newton, A. Fernandez-Minan, W. Huber, M. Knop and D. Gilmour, Nature, 2013, 503, 285 Search PubMed.
- C. Carmona-Fontaine, H. K. Matthews, S. Kuriyama, M. Moreno, G. A. Dunn, M. Parsons, C. D. Stern and R. Mayor, Nature, 2008, 456, 957 CrossRef CAS PubMed.
- C. Carmona-Fontaine, E. Theveneau, A. Tzekou, M. Tada, M. Woods, K. M. Page, M. Parsons, J. D. Lambris and R. Mayor, Dev. Cell, 2011, 21, 1026 CrossRef CAS PubMed.
- E. Theveneau, L. Marchant, S. Kuriyama, M. Gull, B. Moepps, M. Parsons and R. Mayor, Dev. Cell, 2010, 19, 39 CrossRef CAS PubMed.
- E. Theveneau and R. Mayor, Wiley Interdiscip. Rev.: Dev. Biol., 2012, 1, 435 CrossRef CAS PubMed.
- C. R. Horowitz, M. Robinson and S. Seifer, Circulation, 2009, 119, 2633 CrossRef PubMed.
- J. Schottenfeld, Y. Song and A. S. Ghabrial, Curr. Opin. Cell Biol., 2010, 22, 633 CrossRef CAS PubMed.
- C. A. Giurumescu, P. W. Sternberg and A. R. Asthagiri, Proc. Natl. Acad. Sci. U. S. A., 2006, 103, 1331 CrossRef CAS PubMed.
- Y. Koizumi, Y. Iwasa and T. Hirashima, Biophys. J., 2012, 103, 2549 CrossRef CAS PubMed.
- C. J. Drake and P. A. Fleming, Blood, 2000, 95, 1671 CAS.
- K. Bentley, H. Gerhardt and P. A. Bates, J. Theor. Biol., 2008, 250, 25 CrossRef CAS PubMed.
- A. C. LaRue, V. A. Mironov, W. S. Argraves, A. Czirók, P. A. Fleming and C. J. Drake, Dev. Dyn., 2003, 228, 21 CrossRef PubMed.
- R. Montesano and L. Orci, Cell, 1985, 42, 469 CrossRef CAS.
- G. E. Davis, S. M. Black and K. J. Bayless, In Vitro Cell. Dev. Biol.: Anim., 2000, 36, 513 CrossRef CAS.
- A. Szabo, E. Mehes, E. Kosa and A. Czirok, Biophys. J., 2008, 95, 2702 CrossRef CAS PubMed.
- A. Gamba, D. Ambrosi, A. Coniglio, A. de Candia, S. Di Talia, E. Giraudo, G. Serini, L. Preziosi and F. Bussolino, Phys. Rev. Lett., 2003, 90, 118101 CrossRef CAS.
- G. Serini, D. Ambrosi, E. Giraudo, A. Gamba, L. Preziosi and F. Bussolino, EMBO J., 2003, 22, 1771 CrossRef CAS PubMed.
- D. Ambrosi, F. Bussolino and L. Preziosi, J. Theor. Med., 2005, 6, 1 CrossRef.
- N. C. Kappas, G. Zeng, J. C. Chappell, J. B. Kearney, S. Hazarika, K. G. Kallianos, C. Patterson, B. H. Annex and V. L. Bautch, J. Cell Biol., 2008, 181, 847 CrossRef CAS PubMed.
- J. C. Chappell, S. M. Taylor, N. Ferrara and V. L. Bautch, Dev. Cell, 2009, 17, 377 CrossRef CAS PubMed.
- E. Méhes and T. Vicsek, Complex Adap. Syst. Model, 2013, 1, 4 Search PubMed.
- E. Méhes, E. Mones, V. Németh and T. Vicsek, PLoS One, 2012, 7, e31711 Search PubMed.
- A. Nakajima and S. Ishihara, New J. Phys., 2011, 13, 033035 CrossRef.
- P. L. Townes and J. Holtfreter, J. Exp. Zool., 1955, 128, 53 CrossRef.
- A. Gierer, S. Berking, H. Bode, C. N. David, K. Flick, G. Hansmann, H. Schaller and E. Trenkner, Nature (London), New. Biol., 1972, 239, 98 CrossRef CAS.
- R. Foty, C. M. Pfleger, G. Forgacs and M. S. Steinberg, Development, 1996, 122, 1611 CAS.
- D. A. Beysens, G. Forgacs and J. A. Glazier, Proc. Natl. Acad. Sci. U. S. A., 2000, 97, 9467 CrossRef CAS.
- R. A. Foty and M. S. Steinberg, Dev. Biol., 2005, 278, 255 CrossRef CAS PubMed.
- M. Krieg, Y. Arboleda-Estudillo, P. H. Puech, J. Käfer, F. Graner, D. J. Müller and C. P. Heisenberg, Nat. Cell Biol., 2008, 10, 429 CrossRef CAS PubMed.
- E. Schötz, R. D. Burdine, F. Jülicher, M. S. Steinberg, C. P. Heisenberg and R. A. Foty, HFSP J., 2008, 2, 42 CrossRef PubMed.
- J. L. Maître and C. P. Heisenberg, Curr. Opin. Cell Biol., 2011, 23, 508 CrossRef PubMed.
- A. V. Klopper, G. Krens, S. W. Grill and C. P. Heisenberg, Eur. Phys. J. E: Soft Matter Biol. Phys., 2010, 33, 99 CrossRef CAS PubMed.
- E. Mones, A. Czirók and T. Vicsek, 2014, arXiv:cond-mat.soft/1401.0951.
- J. M. Belmonte, G. L. Thomas, L. G. Brunnet, R. M. de Almeida and H. Chaté, Phys. Rev. Lett., 2008, 100, 248702 CrossRef.
- M. Inaba, H. Yamanaka and S. Kondo, Science, 2012, 335, 677 CrossRef CAS PubMed.
- M. S. Steinberg, Proc. Natl. Acad. Sci. U. S. A., 1962, 48, 1577 CrossRef CAS.
- M. S. Steinberg, Science, 1962, 137, 762 CAS.
- M. S. Steinberg, Science, 1963, 141, 401 CAS.
- M. S. Steinberg, Dev. Biol., 1996, 180, 377 CrossRef CAS PubMed.
- F. Graner and J. A. Glazier, Phys. Rev. Lett., 1992, 69, 2013 CrossRef CAS.
- A. K. Harris, J. Theor. Biol., 1976, 61, 267 CrossRef CAS.
- G. W. Brodland, J. Biomech. Eng., 2002, 124, 188 CrossRef.
- G. W. Brodland, Biorheology, 2003, 40, 273 Search PubMed.
- F. Graner, J. Theor. Biol., 1993, 164, 455 CrossRef.
- M. L. Manning, R. A. Foty, M. S. Steinberg and E. M. Schoetz, Proc. Natl. Acad. Sci. U. S. A., 2010, 107, 12517 CrossRef CAS PubMed.
- J. L. Maître, H. Berthoumieux, S. F. Krens, G. Salbreux, F. Jülicher, E. Paluch and C. P. Heisenberg, Science, 2012, 338, 253 CrossRef PubMed.
- J. D. Amack and M. L. Manning, Science, 2012, 338, 212 CrossRef CAS PubMed.
- S. F. Krens, S. Möllmert and C. P. Heisenberg, Proc. Natl. Acad. Sci. U. S. A., 2011, 108, E9 CrossRef PubMed.
- H. Hatzikirou and A. Deutsch, Curr. Top. Dev. Biol., 2008, 81, 401 Search PubMed.
- M. Tektonidis, H. Hatzikirou, A. Chauvière, M. Simon, K. Schaller and A. Deutsch, J. Theor. Biol., 2011, 287, 131 CrossRef PubMed.
- W. Alt, A. Deutsch and L. Preziosi, J. Math. Biol., 2009, 58, 1 CrossRef PubMed.
- T. Vicsek, A. Czirók, E. Ben-Jacob, I. I. Cohen and O. Shochet, Phys. Rev. Lett., 1995, 75, 1226 CrossRef CAS.
- G. Grégoire, H. Chaté and Y. Tu, Phys. D, 2003, 181, 157 CrossRef.
- G. Grégoire and H. Chaté, Phys. Rev. Lett., 2004, 92, 025702 CrossRef.
- P. Lee and C. W. Wolgemuth, PLoS Comput. Biol., 2011, 7, e1002007 CAS.
- A. J. Kabla, J. R. Soc. Interface, 2012, 9, 3268 CrossRef PubMed.
- A. Szabo, E. Mehes, E. Kosa and A. Czirok, Phys. Rev. Lett., 2007, 98, 038102 CrossRef.
- A. Köhn-Luque, W. de Back, J. Starruss, A. Mattiotti, A. Deutsch, J. M. Pérez-Pomares and M. A. Herrero, PLoS One, 2011, 6, e24175 Search PubMed.
- S. J. Streichan, G. Valentin, D. Gilmour and L. Hufnagel, Phys. Biol., 2011, 8, 045004 CrossRef PubMed.
- M. L. Wynn, P. M. Kulesa and S. S. Schnell, J. R. Soc. Interface, 2012, 9, 1576 CrossRef PubMed.
- A. Szabó and A. Czirók, Math. Modell. Nat. Phenom., 2010, 5, 106 CrossRef PubMed.
- A. Czirok, B. J. Rongish and C. D. Little, Genes Cancer, 2011, 2, 1072 CrossRef CAS PubMed.
- A. Czirok and C. D. Little, Birth Defects Res., Part C, 2012, 96, 153 CrossRef CAS PubMed.
- C. Mente, I. Prade, L. Brusch, G. Breier and A. Deutsch, Acta Phys. Pol., B, 2012, 5, 99 CrossRef CAS.
- C. Mente, I. Prade, L. Brusch, G. Breier and A. Deutsch, J. Math. Biol., 2011, 63, 173 CrossRef PubMed.
- R. M. Merks, S. V. Brodsky, M. S. Goligorksy, S. A. Newman and J. A. Glazier, Dev. Biol., 2006, 289, 44 CrossRef CAS PubMed.
- R. M. Merks, E. D. Perryn, A. Shirinifard and J. A. Glazier, PLoS Comput. Biol., 2008, 4, e1000163 Search PubMed.
- Y. L. Hashambhoy, J. C. Chappell, S. M. Peirce, V. L. Bautch and F. Mac Gabhann, Front. Physiol., 2011, 2, 62 Search PubMed.
- J. C. Mombach, J. A. Glazier, R. C. Raphael and M. Zajac, Phys. Rev. Lett., 1995, 75, 2244 CrossRef CAS.
- S. R. McCandlish, A. Baskaran and M. F. Hagan, Soft Matter, 2011, 8, 2527 RSC.
- Y. Zhang, G. L. Thomas, M. Swat, A. Shirinifard and J. A. Glazier, PLoS One, 2011, 6, e24999 CAS.
- A. Voss-Böhme and A. Deutsch, J. Theor. Biol., 2010, 263, 419 CrossRef PubMed.
- J. P. Rieu, N. Kataoka and Y. Sawada, Phys. Rev. E: Stat., Nonlinear, Soft Matter Phys., 1998, 57, 924 CrossRef CAS.
- C. P. Beatrici and L. G. Brunnet, Phys. Rev. E: Stat., Nonlinear, Soft Matter Phys., 2011, 84, 031927 CrossRef.
| This journal is © The Royal Society of Chemistry 2014 |

