
 Open Access Article
 This Open Access Article is licensed under a
 Creative Commons Attribution 3.0 Unported Licence
Binding free energy based structural dynamics analysis of HIV-1 RT RNase H–inhibitor complexes†
Vasanthanathan
Poongavanam
 *,
Jógvan Magnus Haugaard
Olsen
and
Jacob
Kongsted
*,
Jógvan Magnus Haugaard
Olsen
and
Jacob
Kongsted
Department of Physics, Chemistry and Pharmacy, University of Southern Denmark, Campusvej 55, DK-5230 Odense M, Denmark. E-mail: nathan@sdu.dk
First published on 5th August 2014
Abstract
Accurate prediction of binding free energies associated with small molecules binding to a receptor is a major challenge in drug design processes. To achieve this goal many computational methods have been developed ranging from highly efficient empirical based docking schemes to high accuracy methods based on e.g. free energy calculations. In this study, binding affinity predictions for a set of HIV-1 RNase H inhibitors have been performed using MM-PB(GB)/SA methods. The current study describes in detail how the choice of initial ligand structures, e.g. protonation states, impacts the predicted ranking of the compounds. In addition we study the structural dynamics of the RNase H complexes using molecular dynamics. The role of each residue contribution to the overall binding free energy is also explored and used to explain the variations in the inhibition potency. The results reported here can be useful for design of small molecules against RNase H activity in the development of effective drugs for HIV treatment.
Insight, innovation, integrationTo unveil structural dynamical aspects of HIV-1 RT RNase H (RNH) we have examined the importance of ligand protonation states in order to achieve accurate prediction of binding affinities using the MM-PB(GB)/SA methods. From the free energy calculation and structural dynamics investigations, we find that the protonation states of the ligands greatly impact the protein–ligand binding process. In addition, we observe that the inter-magnesium ion distances as well as the magnesium ion–residue and magnesium ion–ligand interactions are strongly dependent on both the protonation states and the number of oxygen atoms in the ligands. Altogether these factors strongly influence chelation formation, which impacts the overall ligand affinity. Furthermore, the interaction energy contributions due to Glu478 and Thr497 are found to be highly correlated with the binding affinity. The findings of this study are important for further RNH inhibitor design for better therapeutics. |
1. Introduction
Human immunodeficiency virus type 1 (HIV-1) reverse transcriptase associated ribonuclease H (RNase H or RNH) is an attractive chemo-target for development of anti-HIV agents.1,2 It is one of the two essential domains of HIV-1 reverse transcriptase (RT, p66 subunit), which plays a key role in viral replication. During the viral replication process, the genomic single stranded RNA (viral) is transformed into a RNA:DNA hybrid duplex by the polymerase domain with the help of a cellular RNA primer (specifically tRNAlys3). Subsequently, the RNH domain removes the RNA strand from the hybrid and facilitates the first strand transfer which leads to formation of purine rich sequences of HIV RNA (also called “polypurine tract” (PPT)). Here, PPT serves as a primer for the synthesis of viral (+) DNA strands and subsequently RNase H removes the PPT portion after priming of (+) DNA synthesis. The RNase H catalytic site consists of a conserved DDDE motif (Asp443, Asp498, Asp549 and Glu478), which is coordinated with two catalytically active magnesium ions (Mg2+). In the catalytic process, the magnesium ions initiate the formation of a nucleophile (OH−) (from the active site water molecules), which attacks the RNH substrate (RNA:DNA hybrid) in order to execute the digestion process.3,4The majority of the currently marketed antiviral drugs that have been approved by the FDA for the treatment of HIV infections are RT inhibitors that particularly inhibit at the polymerase domain.5,6 However, there is a large number of RNH inhibitors reported and some of these have entered into clinical trial,7,8 but none of these inhibitors have yet reached the market. The catalytic role of RNH can be diminished through two inhibitory mechanisms: (1) compounds that block the magnesium ions availability to the catalytic process (also called active site binders) and (2) compounds that bind at the allosteric site (located near to the p51 thumb) and change the conformation of RNH which disables the substrate binding (RNA:DNA hybrid) at the catalytic site. Compounds such as NSC727447 (a vinylogous urea) and acylhydrazones bind at the allosteric site.9–11 Compared to the inhibition of RNH through active site binding, an allosteric inhibition provides an attractive drug target for HIV-1 RNH inhibition since compounds that bind at this site will not interfere with human RNase H112 due to different locations of the RNH allosteric site in humans and virus. However, only a small number of allosteric inhibition compounds have been reported. On the other hand, a large number of active site binders have been reported and some even entered into the clinical phase.7 The reason for such a large number of studies in this class is due to a well defined “pharmacophore” pattern among these compounds, e.g. pyrimidinone, diketo, tropolone, N-hydroxyimide, diones etc.8 Another possible reason is that many of these compounds also exhibit HIV-1 integrase activity (so-called dual inhibition).13 Dual inhibition also represents a way to achieve HAART (highly active anti-retroviral therapy).14
The topology of the HIV-1 RNH active site is well characterized as being small, slightly hydrophobic and containing a highly electrostatic negative potential surface, which is primarily formed by the DDDE motif coordinated with two catalytically active magnesium ions (Fig. 1).4,12,15–17 Very recently, molecular modeling methods have been used to study and predict RNase H inhibition using virtual screening models for the active site18,19 and the allosteric site.11,20 However, there exists only a very limited number of studies that explore the structural dynamics of the RNH domain.21 Investigation of the structural dynamics of RNH will provide highly valuable information for inhibitor design, e.g., mode of ligand recognition by the protein, structural changes upon ligand binding, all factors that influence the ligand binding affinity. In a previous study we have developed efficient virtual screening models18 (e.g. structure and ligand based). Such models are very useful when identifying inhibitors from non-inhibitors based on compounds extracted from large databases, however, none of the previously developed models are suitable to accurately rank the binders according to their binding affinity. The aim of the present study is to rank a set of known RNH inhibitors according to their activities using the MM-PB(GB)/SA method and to use these binding affinities as initial structural validations to further study and analyze the dynamics of RNH–inhibitor complexes. Therefore, this work is divided into two parts. The first part discusses how the protonation states of the ligands influence the binding affinity ranking through MM-PB(GB)/SA calculations and the second part investigates the structural dynamics of RNase H–inhibitor complexes. Especially we investigate in detail the magnesium ions, bound water and residue dynamics and interactions with the inhibitors.
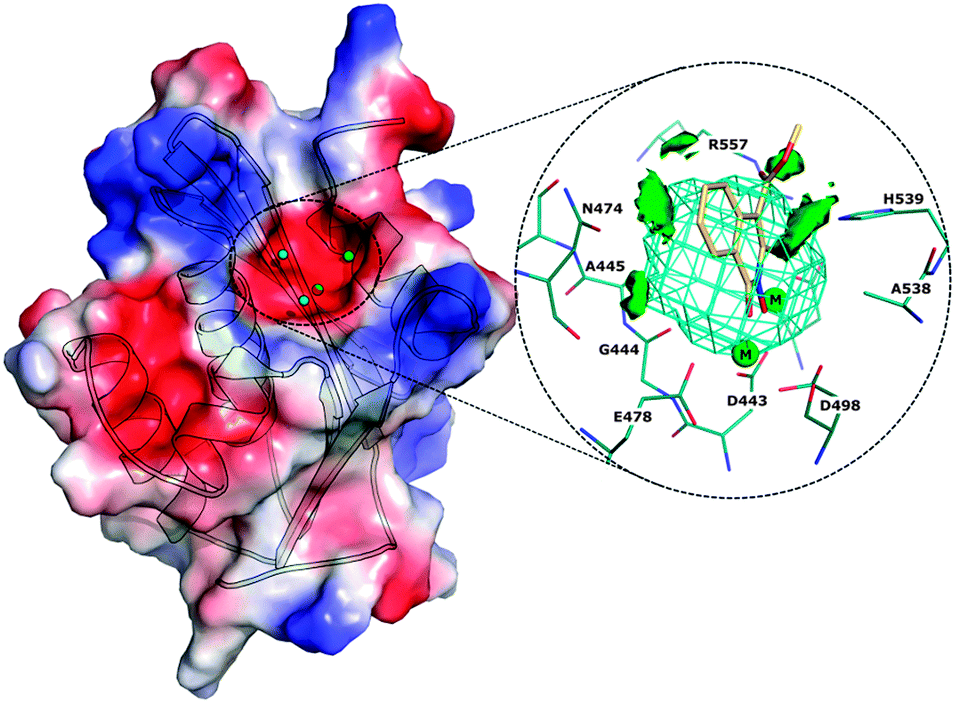 | ||
| Fig. 1 Electrostatic potential surface of the HIV-RT associated RNase H domain model. The active site of RNH characterized with molecular interaction fields is shown in the circle including the cavity (cyan mesh), hydrophobic regions (green surface), inhibitors (yellow) and magnesium ions (green sphere). | ||
2. Computational methods and materials
2.1. Preparation of protein–ligand complexes
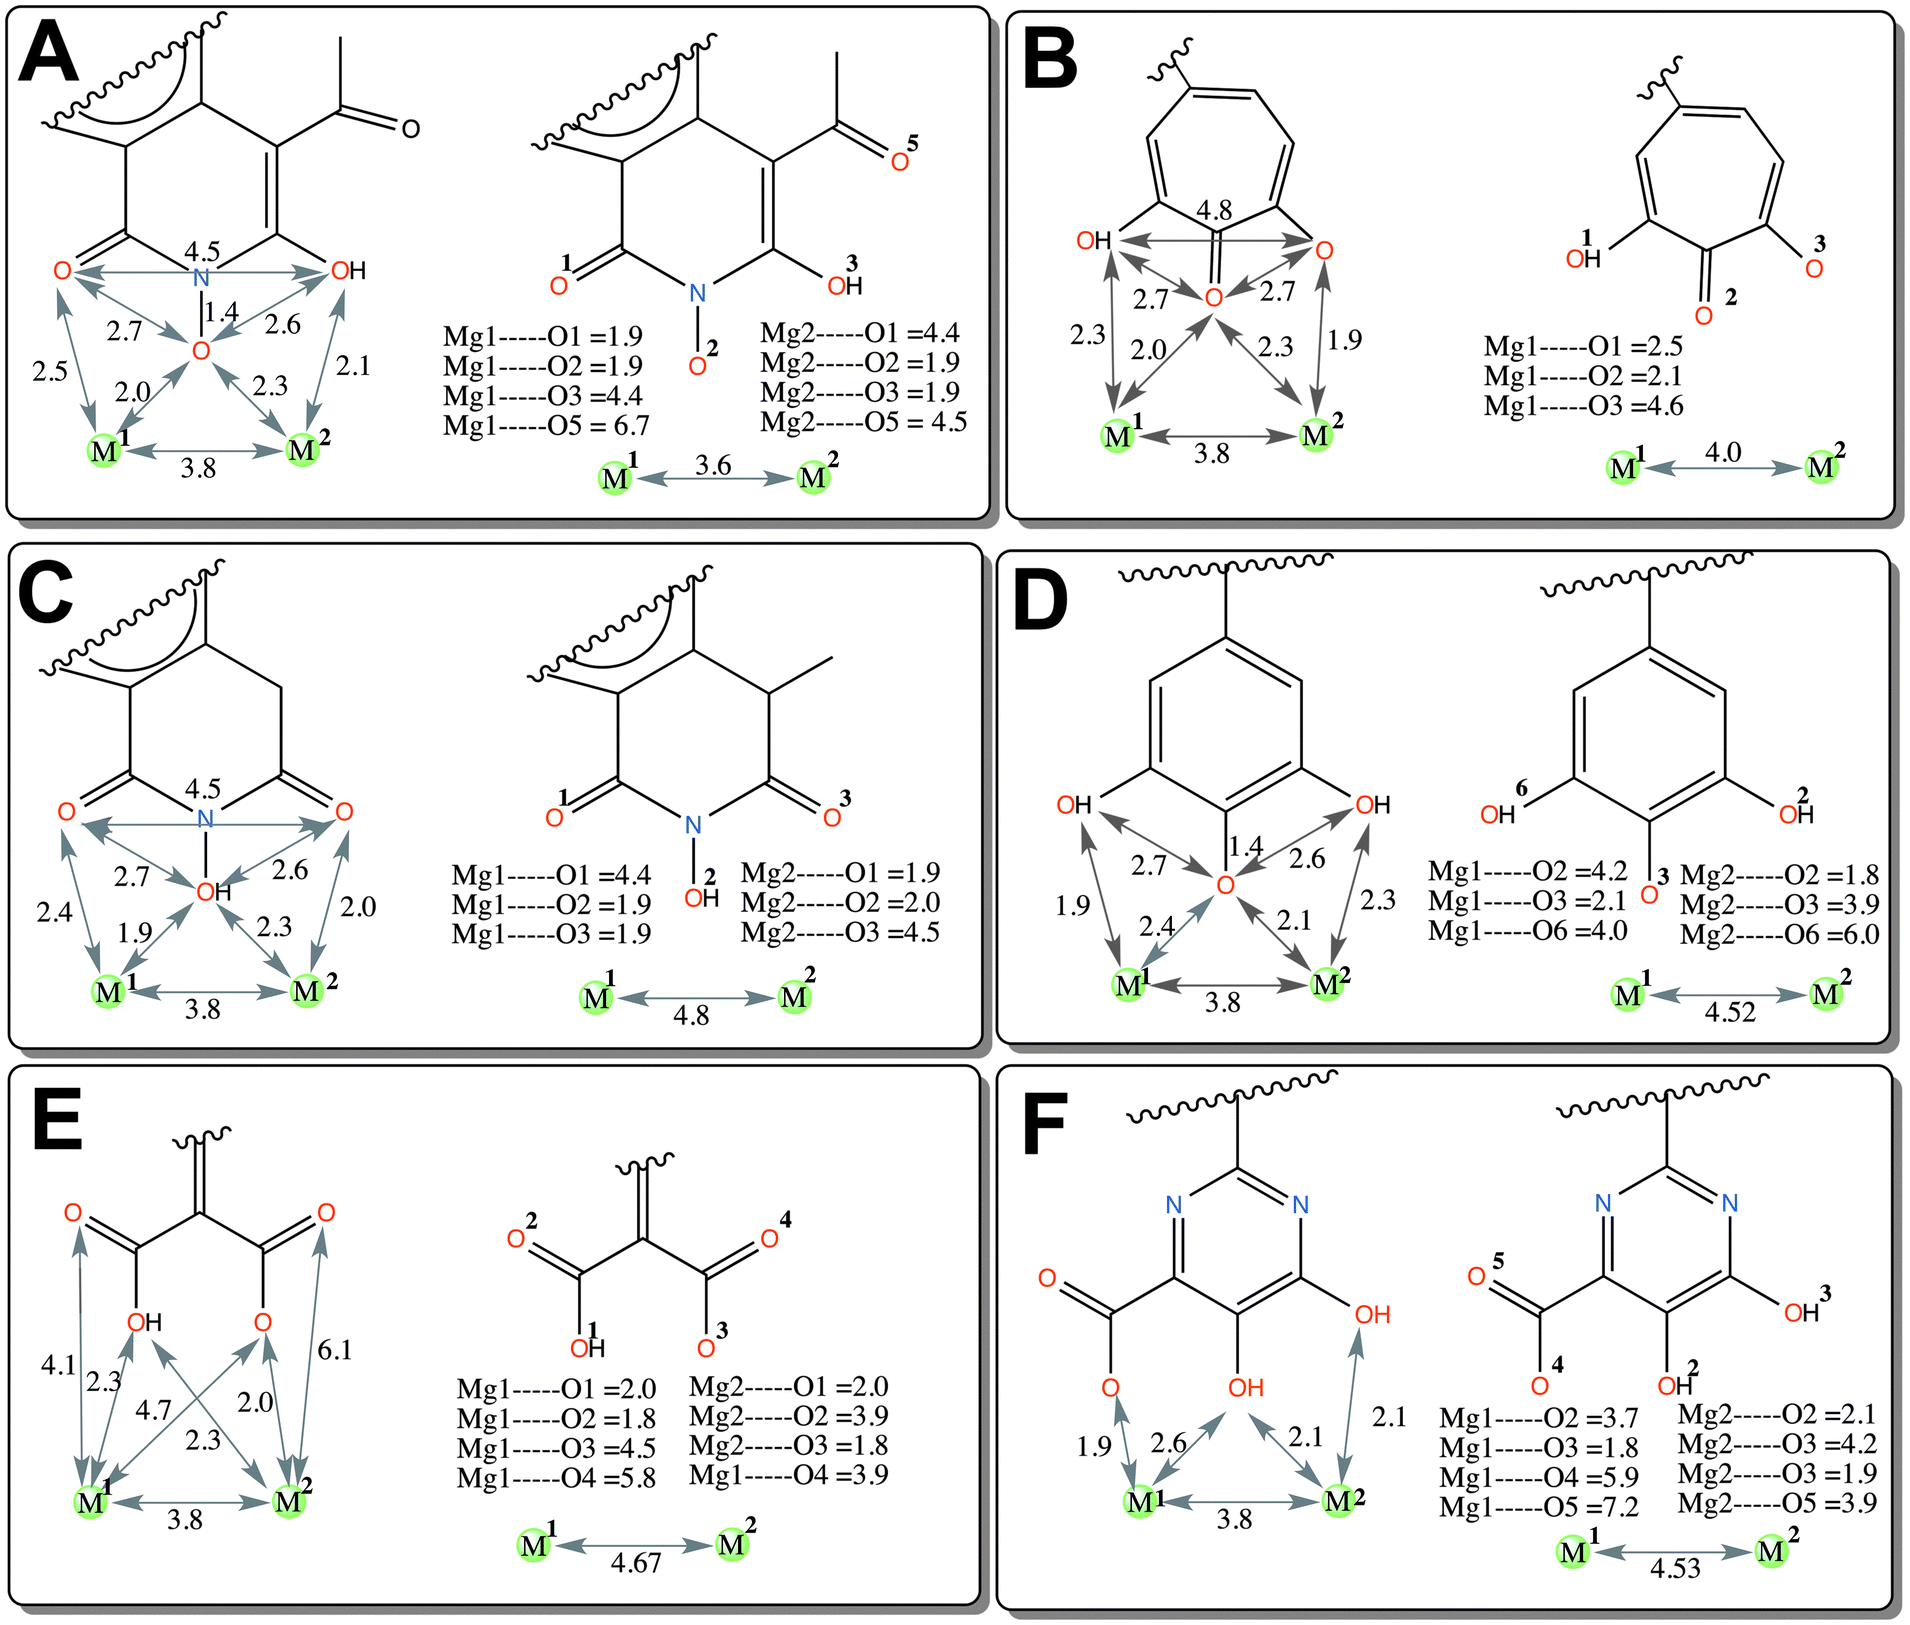
The computational model of the HIV-1 RT associated RNase H domain was constructed from an X-ray crystal structure (resolution of 1.4 Å) from the Protein Data Bank (PDB ID: 3QIO).15 In the deposited crystal structure of the RNase H domain with N-hydroxy quinazolinediones (bound active site inhibitor), 12 residues were missing and the structure was determined with manganese (Mn2+) ions instead of the two catalytically active magnesium ions (Mg2+). Therefore, the structure of the RNase H domain was reconstructed by adding the missing residues using the Swiss-Model.22 The obtained protein model was then imported into the Maestro module available in the Schrödinger suite23 and the structure was further optimized using the Protein Preparation Wizard.24 This optimization includes adding hydrogen atoms, assigning bond orders and building di-sulfide bonds and replacing the Mn2+ ions with Mg2+ ions. The protonation states of all of the ionizable residues were predicted by PROPKA25 provided in the Protein Preparation Wizard in the presence of the Mg2+ ions at the active site. An optimized structure model was finally found by energy minimization (only hydrogen atoms) using the OPLS2005 force field.A set of six chemically diverse RNase H inhibitors with known activity (IC50) was collected from the literature (Fig. 2). All compounds belong to active site direct inhibitors, except BHMP07 which is an allosteric RNH inhibitor. Due to the long side chain of BHMP07 this molecule interacts with residues that also interact with the active site binders (Fig. S1, ESI†). The binding pose of BHMP07 used in this study is very similar to a previously predicted binding pose26 and is characterized by interactions with residues such as Asn474 (H-bonding), Gln500 (H-bonding), Tyr501 (π–π stacking), Asp498 (H-bonding), Gly444 (H-bonding) and Asp443 (H-bonding). The 3D structure of all molecules was built in the Maestro module and pre-processed using the LigPrep tool in the Schrödinger suite. The pKa for each ionizable group in the molecules was predicted using either Epik (an empirical based tool)27 or quantum mechanics (QM) based pKa prediction tools implemented in the Jaguar program28 (see Results section for more detail).
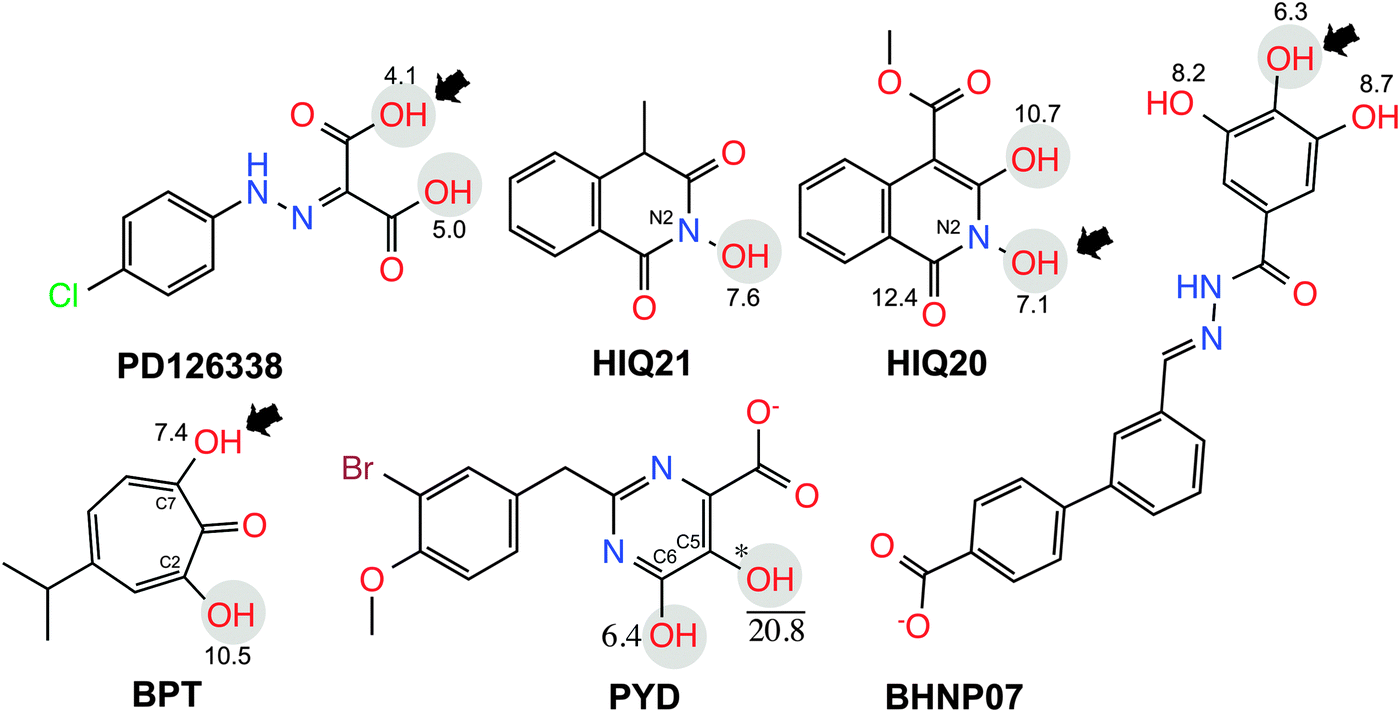 | ||
| Fig. 2 2D structure of RNase H inhibitors used in the present investigation. Ionization states used for the free energy calculations are highlighted. The pKa prediction for the enolic sites is shown (see text for details). Deprotonation states used in scenario ONE and scenario TWO are shown in gray circles and black arrow, respectively. The position indicated with * could not be determined due to convergence issues. | ||
Glide29 (a grid-based exhaustive search algorithm), from the Schrödinger suite, was used to obtain initial conformations of the ligands in the active site of RNase H. Before the ligands were docked into the RNase H binding site, the active site is defined by the receptor grid generation procedure implemented in the Glide module. The bound ligand (3-hydroxy 6-(phenylsulfonyl)-quinazoline-2,4-(1H,3H)-dione) was set as the centroid of the grid box and water molecules <3 Å from the bound ligand in the active site were kept for the docking experiments. The Glidescore (Standard Precision mode) was used to rank the docking poses.
2.2. Molecular dynamics simulation setup
All molecular dynamics simulations were performed and analyzed using the Amber 12 software.30 Before the system setup for MD, all six ligands shown in Fig. 2 were geometry optimized with HF/6-31G** using Gaussian 0931 and the atomic charges used for the molecular dynamics were calculated from the ESP (electrostatic potential) using B3LYP-IEFPCM/cc-pVTZ. These atomic charges were fitted using the RESP procedure as implemented in the Antechamber module of the Amber 12 software. The tleap tool in the Amber suite was used to build coordinate and parameter (Amber ff03 force field) input files. Subsequently, TIP3P water (solvent) molecules were added with a 10 Å buffering distance between the edges of the truncated octahedron box. In order to avoid edge effects, periodic boundary conditions were applied during the molecular dynamics simulations. Energy minimization was carried out in two steps: first, the system was minimized using a steepest descent minimization with all heavy atoms restrained. The maximum number of minimization cycles was set to 1000. In the second stage of the minimization, the entire system was energy minimized and no positional restraints were applied at this stage.In the process of thermalization, initial velocities were generated from a Maxwell–Boltzmann distribution at 100 K and gradually increased to 300 K at constant volume over a 200 ps MD simulation. After the thermalization process, the system was equilibrated at constant temperature (300 K) and pressure (1 bar) using the Berendsen coupling algorithm32 for another 500 ps MD simulation. After the equilibration step, the MD production run was started for 20 ns (10![[thin space (1/6-em)]](https://www.rsc.org/images/entities/char_2009.gif) 000000 MD steps with 0.002 time steps). The SHAKE algorithm was used to constrain the lengths of all bonds involving hydrogen atoms. Coordinates were saved every 10 ps from the 20 ns simulation for the analysis; in total 2000 snapshots were used for binding free energy calculations and investigations.
000000 MD steps with 0.002 time steps). The SHAKE algorithm was used to constrain the lengths of all bonds involving hydrogen atoms. Coordinates were saved every 10 ps from the 20 ns simulation for the analysis; in total 2000 snapshots were used for binding free energy calculations and investigations.
2.3. MM-PB(GB)/SA based affinity prediction
MM-PB(GB)/SA is a force-field based method which employs molecular mechanics, the Generalized Born (GB)/Poisson Boltzmann (PB) solvation models and a solvent accessibility method to approximate the free energies of binding based on snapshots extracted from MD simulations.33–35 The binding free energy (ΔGBind) of the protein–ligand complex is calculated based on eqn (1)| ΔGBind = ΔGBind,Vacuum + (ΔGSolv,PL − ΔGSolv,L − ΔGSolv,P) | (1) |
| G = 〈EMM〉 + 〈GSolv(polar+nonpolar)〉 − T〈SMM〉 | (2) |
| EMM = EInt + Eel + EvdW | (3) |
The binding free energies (ΔGBind) for all protein–ligand complexes were calculated according to eqn (2) and (3) using the MMPBSA.py script in Amber 12 based on the use of 2000 snapshots extracted from the 20 ns MD simulation. The implementation of MMPBSA.py in Amber 12 is well described in the original publication.36 All MM-PB(GB)/SA calculations are based on the “single-trajectory MD simulation”, meaning that no separate MD simulations were run for the free ligands, however, for the structural investigation, an MD simulation for the receptor (the so-called Apo form) was additionally performed.
3. Results and discussion
3.1. Part 1: optimization of binding free energy models
The obtained free energies of binding from various stages of refinement of the ligands are here discussed together with the ligand preparation steps. Initially, in order to get a good correlation between observed and calculated activities, the reported biological activity (IC50) data were converted into pIC50 values. For clarity, the obtained results are discussed in three scenarios as follows.| Compound | MM-GBSA | MM-PBSA | |||||||||||
|---|---|---|---|---|---|---|---|---|---|---|---|---|---|
| PYD | BPT | BHNP07 | PD | HIQ20 | HIQ21 | PYD | BPT | BHNP07 | PD | HIQ20 | HIQ21 | ||
| Note: all energy components are extracted from the differences (average) of ΔGComplex − ΔGReceptor − ΔGLigand. The results refer to averages over 2000 frames and all units are reported in kcal mol−1. Abbreviation: EvdW = van der Waals energy, Eele = electrostatic energy, ΔGgas = sum of van der Waals energy + electrostatic energy + internal energy, ΔGSolv = solvation energy (polar and non-polar), ΔS = entropy, T = 298.15 K.a Could not be calculated due to energy convergence issues. | |||||||||||||
| Scenario ONE | IC50 (μM) | 0.9 | 0.21 | 0.20 | 6.1 | 0.061 | 38.8 | 0.9 | 0.21 | 0.20 | 6.1 | 0.061 | 38.8 |
| pIC50 (μM) | 6.05 | 6.68 | 6.70 | 5.21 | 7.21 | 4.41 | 6.05 | 6.68 | 6.70 | 5.21 | 7.21 | 4.41 | |
| E vdW | 0.64 | −3.31 | −6.15 | 4.21 | 1.90 | −4.42 | 0.64 | −3.31 | −6.15 | 4.21 | 1.90 | −4.42 | |
| E Ele | −531.76 | −302.46 | −303.09 | −530.90 | −615.87 | −360.99 | −531.76 | −302.46 | −303.09 | −530.90 | −615.87 | −360.99 | |
| ΔGSolv | 459.52 | 268.45 | 277.76 | 443.27 | 512.84 | 301.44 | 474.61 | 278.11 | 300.95 | 450.96 | 520.66 | 308.23 | |
| ΔGgas | −531.11 | −305.78 | −309.23 | −526.69 | −613.97 | −365.41 | −531.11 | −305.77 | −309.24 | −526.69 | −613.97 | −365.41 | |
| ΔG | −71.60 | −37.32 | −31.48 | −83.42 | −101.13 | −63.97 | −56.51 | −27.66 | −8.28 | −75.73 | −93.31 | −57.18 | |
| T*ΔS | −27.07 | −19.09 | −22.22 | −27.25 | −28.78 | −24.05 | −27.07 | −19.09 | −22.22 | −27.25 | −28.78 | −24.05 | |
| Scenario TWO | E vdW | −0.29 | −1.57 | — | −5.41 | −7.36 | −12.10 | −0.29 | −1.57 | — | −5.41 | −7.36 | −12.10 |
| E Ele | −21.91 | −295.80 | — | −248.79 | −315.49 | −44.85 | −21.91 | −295.80 | — | −248.79 | −315.49 | −44.85 | |
| ΔGgas | −22.19 | −297.37 | — | −254.20 | −322.84 | −56.95 | −22.19 | −297.37 | — | −254.20 | −322.84 | −56.95 | |
| ΔGSolv | 22.18 | 259.47 | — | 207.43 | 274.38 | 53.54 | 23.24 | 274.29 | — | 233.19 | 286.12 | 64.05 | |
| ΔG | −0.02 | −37.90 | — | −46.77 | −48.46 | −3.41 | 1.05 | −23.08 | — | −21.00 | −36.73 | 7.10 | |
| T*ΔS | −11.35 | −18.98 | −21.86 | −23.82 | −17.77 | ||||||||
| Scenario THREE | E vdW | −5.42 | — | — | −5.70 | — | — | −5.42 | — | — | −5.70 | — | — |
| E Ele | −271.62 | — | — | −249.79 | — | — | −271.62 | — | — | −249.79 | — | — | |
| ΔGgas | −277.04 | — | — | −255.49 | — | — | −277.04 | — | — | −255.49 | — | — | |
| ΔGSolv | 234.61 | — | — | 244.74 | — | — | 247.59 | — | — | 244.50 | — | — | |
| ΔG | −42.43 | — | — | −10.75 | — | — | −29.45 | — | — | −10.98 | — | — | |
| T*ΔS | −21.98 | ||||||||||||
Similar predictions were observed for compounds PD and PYD, which show moderate inhibition, but according to the predicted binding energies, both compounds are found as highly active compounds. This overestimation might be due to the presence of carboxylic acid and hydroxyl groups in these molecules, which bind strongly with the magnesium ions in the RNase H catalytic site. However, this was not reflected in the experimental activity (i.e. IC50). This observation raises the question whether the correct protonation states for the ligands have been used in the docking and MD simulations. As shown in Fig. 3A, the overall result of this potentially incorrect ionization greatly influences the ranking by having a poor correlation (R2 = 0.006 for MMGBSA and R2 = 0.0221 for MMPBSA) between the binding free energies and experimental activities.
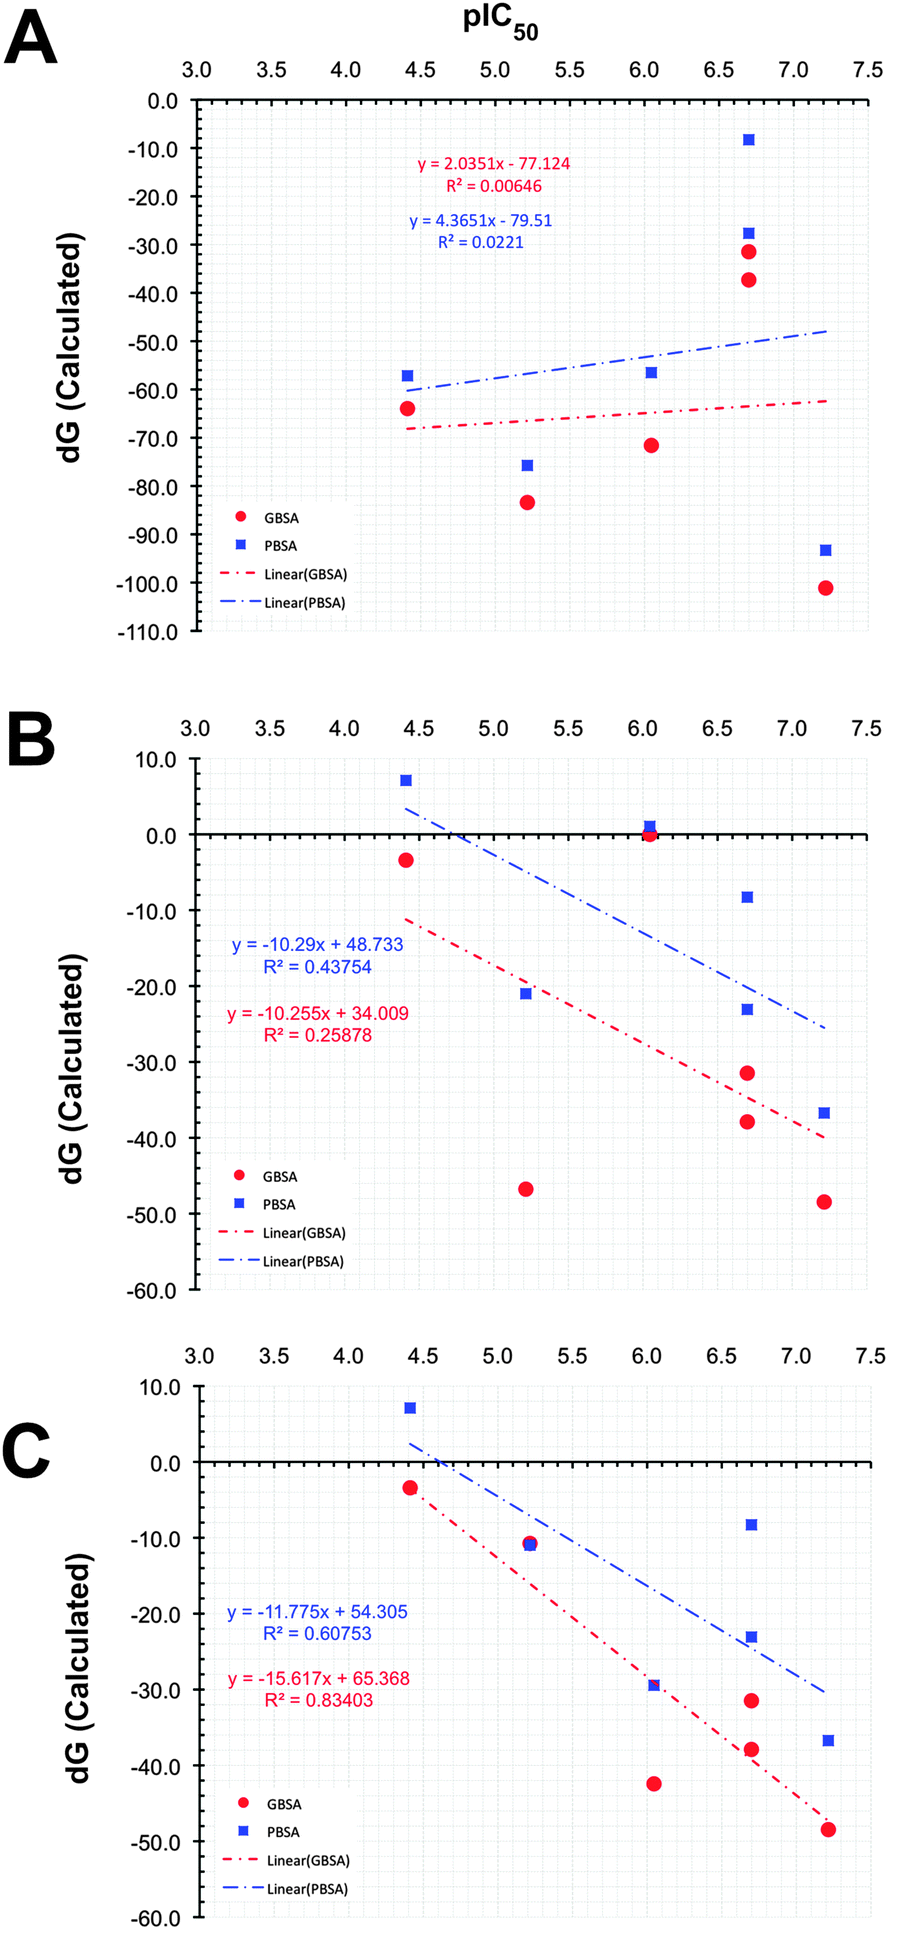 | ||
| Fig. 3 Correlation between the observed activity and the MM-PB(GB)/SA predicted activity according to scenario ONE (A), scenario TWO (B), and scenario THREE (C). | ||
The hydroxyl group at the N2 position of compound HIQ20 has a favorable pKa for deprotonation. Compound PYD has a carboxylic acid and two hydroxyl groups at the C5 and C6 positions. The pKa of the hydroxyl group at the C6 position is 6.4 and the pKa for the hydroxyl group at the C5 position could not be calculated due to the convergence issues.
In addition, when both the carboxylic acid and hydroxyl group at C6 are deprotonated, the pKa of the hydroxyl group at C5 is 20.8. Due to the proton on the (C6) OH group far from the COOH group, OH (C6) will not deprotonate due to the fact the OH (C5) next to it is partially negatively charged due to the share of a proton with the neighboring COO– group. If OH (C6) would deprotonate, there might be an unfavorable charge–charge interaction within these groups. Therefore, only the carboxylic acid is kept in the deprotonated form, whereas the two hydroxyl groups remain protonated in scenario TWO. The compound PD has two terminal carboxylic acid groups, which has unequal electron distribution due to the neighboring hydrazine group. Thus, the group (COOH) close to the NH atoms is easily deprotonated (pKa = 4.1). In the binding affinity calculation we kept one COOH group in the deprotonated form and the other COOH remains protonated in order to avoid unfavorable charge–charge interaction between the two acid groups.
In scenario TWO, the same ionization state was used for BHNP07 as in scenario ONE. Once again the newly predicted ionized forms were built, energy minimized, docked and the MD simulations were carried out for 20 ns as described in the Computational method section.
From Table 1, it can now be noticed for scenario TWO that there is a remarkable change in the predicted binding free energies of PD, PYD and HIQ21 as found by the MM-PB(GA)/SA methods. As seen from Fig. 3B the correlation coefficient (R2) between the predicted and observed activities is significantly improved from 0.006 to 0.25 for MM-GB/SA and 0.02 to 0.44 for MM-PB/SA. No significant change was observed in the binding free energy of BPT based on the MM-GB/SA method, however, it should be noted that a reduction of nearly −5 kcal mol−1 is predicted by the MM-PB/SA method in scenario TWO compared to scenario ONE. The compound HIQ21 is now predicted as a poor binder by both methods compared to scenario ONE. This is a remarkable improvement. The compound PD is still being predicted as a strong binder by the MM-PB(GB)/SA methods with a binding affinity of −21.00/−46.77 kcal mol−1, respectively. Compared to compound HIQ20, which is a strong binder (−38.73/−48.46 kcal mol−1), the binding energy of PD is nearly in the same range. On the other hand, the compound PYD is predicted as a poor binder with a binding energy of −0.018 and 1.045 kcal mol−1 from MM-GB/SA and MM-PB/SA, respectively. This reflects that indeed the ionization state plays an essential role for binding affinity prediction. Overall, in scenario TWO the binding energies and ranking have significantly improved, however, the compounds PYD and PD are still outliers. This observation led us to recheck these structures with respect to the hydrogen atom orientation and energy with the help of further QM calculations.
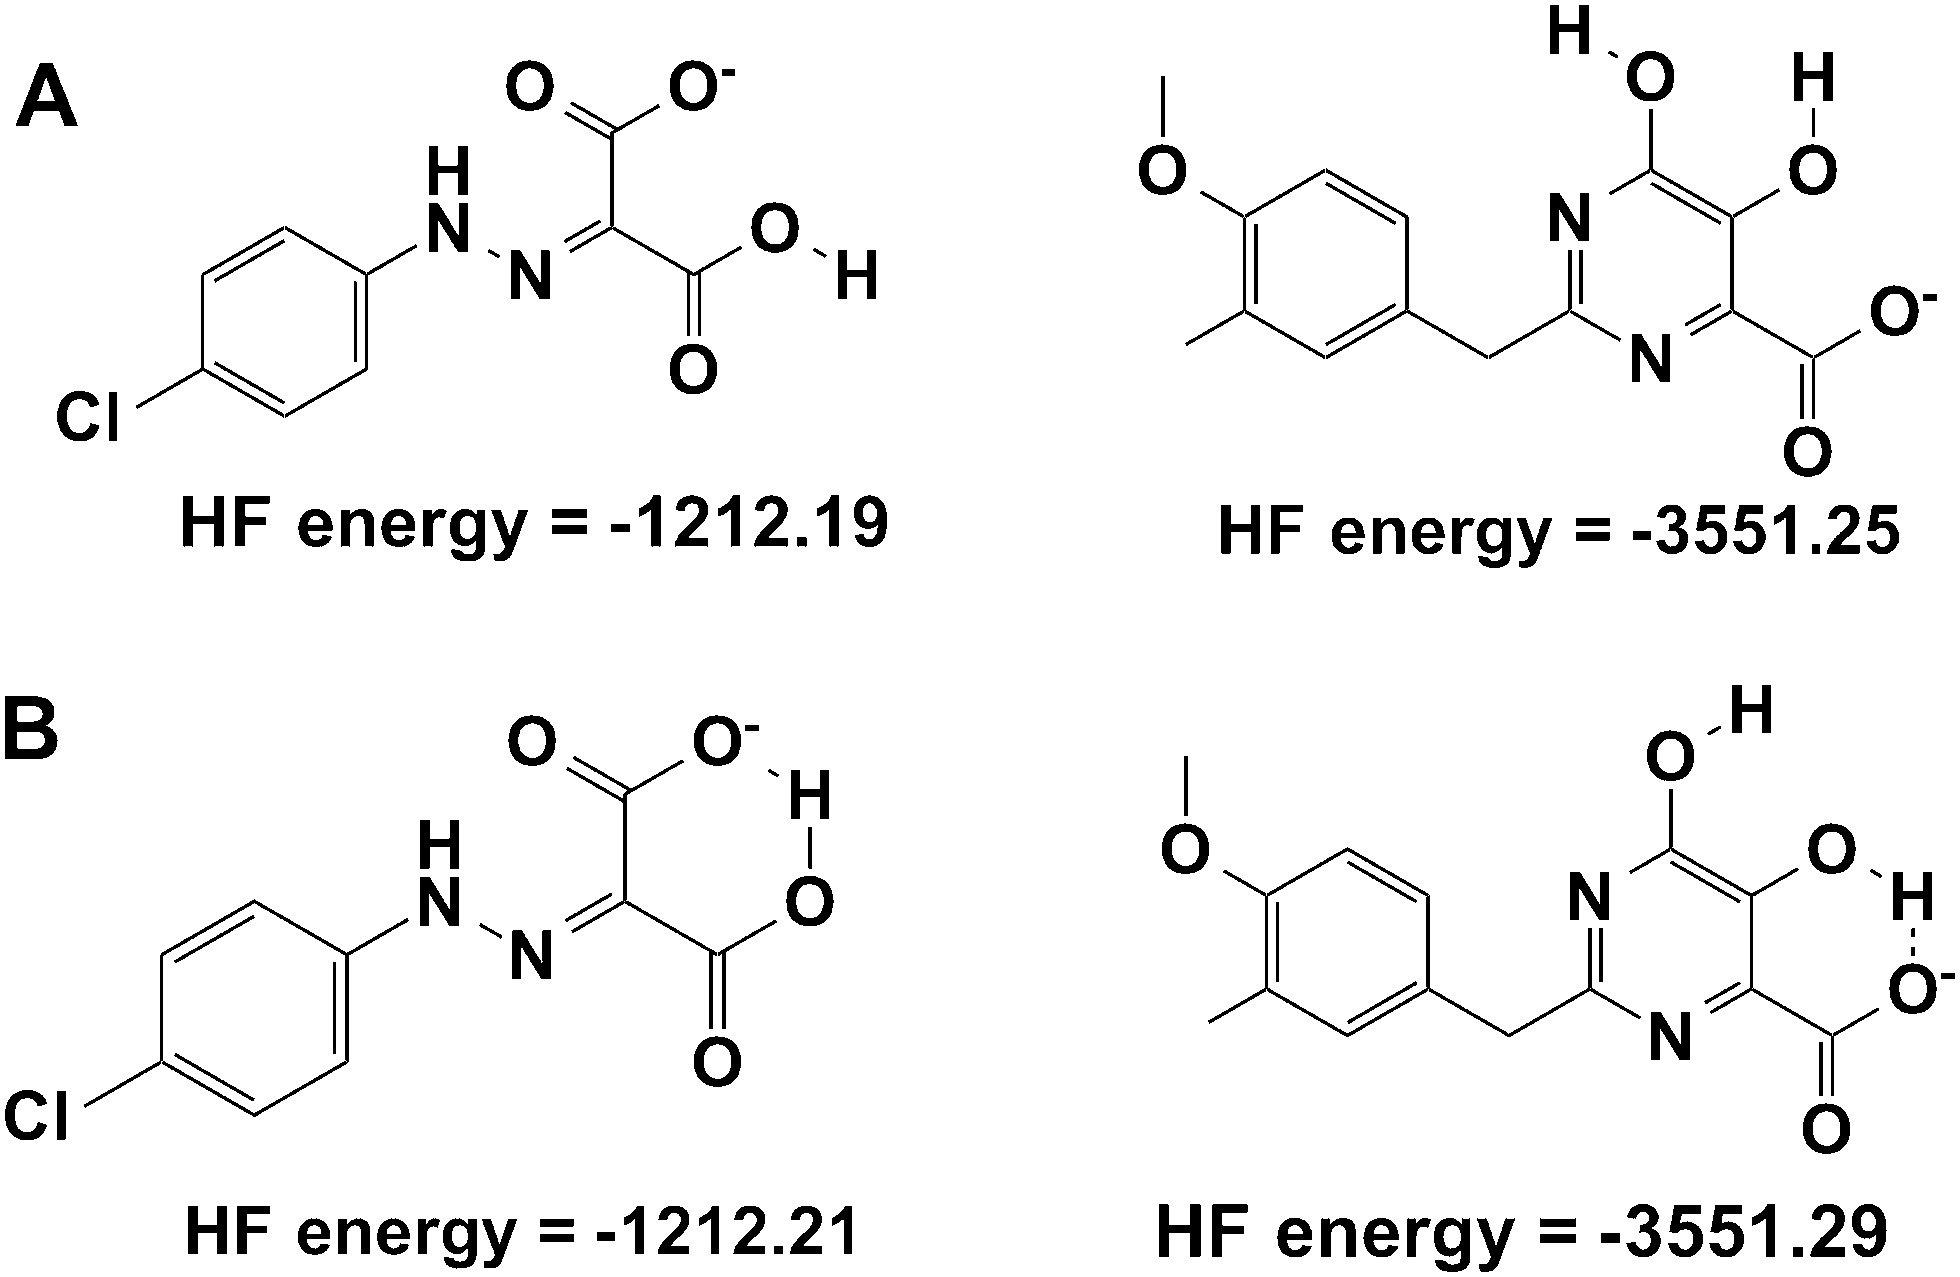 | ||
| Fig. 4 Comparison of total energies in a.u. calculated with and without the intra-molecular hydrogen bonding network in the initial structure for molecular dynamics simulations. | ||
From the part 1 results, it is summarized that in both the MM-PB/SA and MM-GB/SA methods, the van der Waals term for all the compounds is unfavorable and has the least contribution to the binding energy, whereas the electrostatic term is favorable and dominates the overall binding affinity for all the compounds. In general with respect to correct ranking according to the experimental activities, the MM-GB/SA (r2 = 0.84) method performs better than MM-PB/SA (r2 = 0.61). Having seen now the importance of using the correct ligand protonation states in the docking, MD and free energy calculations we will now investigate in more detail the structural dynamics of RNH in both ligand-free and complex forms. The analysis will be performed for the settings described in scenario THREE.
3.2. Part 2: structural dynamics of RNase H
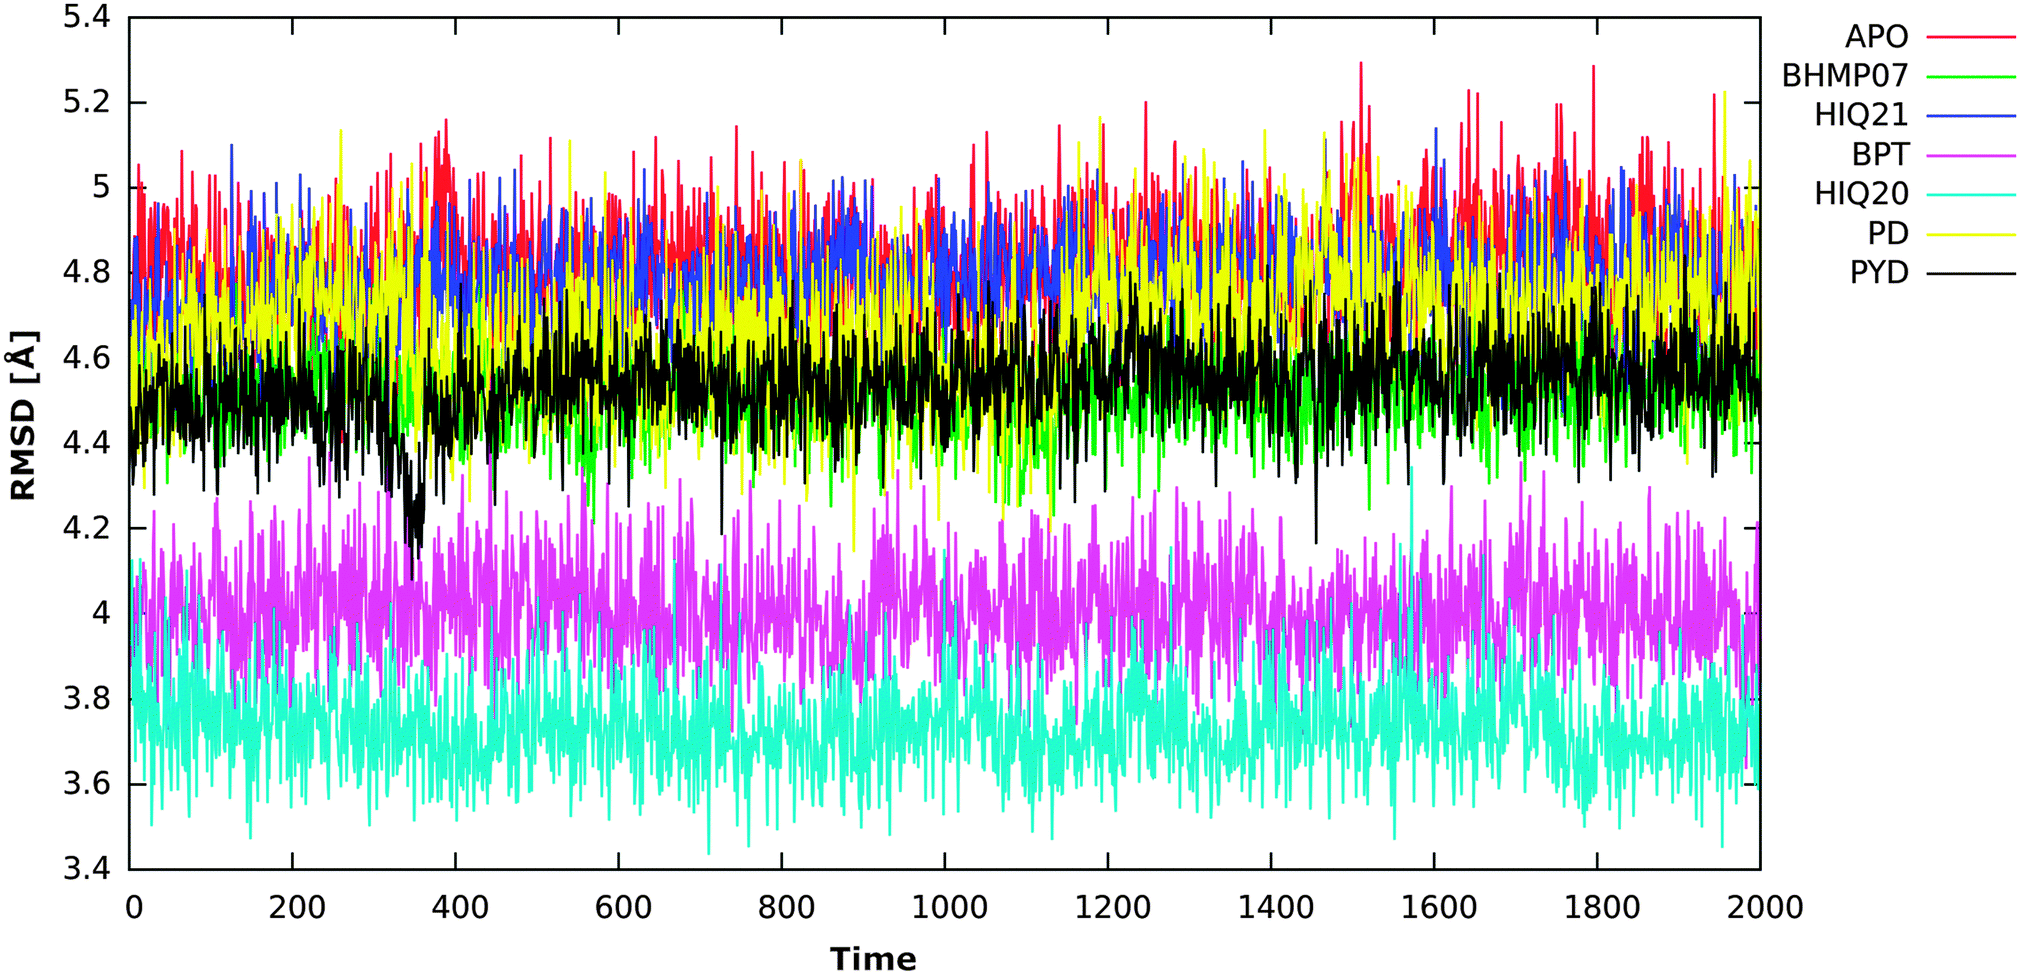
To assess the stability of all considered complexes, the atom-positional root-mean-square deviation (RMSD) of the backbone atoms (αC, N, C) of the protein relative to the initial structure was analyzed for the 2000 snapshots extracted from the 20 ns MD simulation (Fig. S2, ESI†). For all compounds the RMSD for the backbone remains below 1.2 Å after 10 ns simulation compared to the initial structure (Fig. S3, ESI†).To further evaluate which part of the protein that shows high mobility, the rmsf (b-factor) of the backbone atoms (αC, N, C) for each residue was calculated (Fig. 5). It can be seen that residues between 445–455, 505–515 and 535–545 are highly flexible and that this fluctuation is also slightly different for different complexes. For instance, residues between 505–515 and 535–545 when complexed with HIQ21 and HIQ20 are highly fluctuating compared to the other complexes. The residues show relatively low flexibility for the RNH–BHMP07 complex. Overall, the order of flexibility is increasing as follows: BHMP07 (9) < PYD (6) < PD (5) < BPT (3) < HIQ20 (2) < HIQ21 (1) and this correlates perfectly with the number of rotatable bonds of the ligands (shown in the brackets). The flexibility of the conserved residues (Asp443, Glu478, Asp498 and Asp549) is found to be quite low throughout the simulations for all the complexes. His539 shows high flexibility for all complexes and, as seen in our previous study,18 His539 plays a significant role in the formation of π or π–cation interactions during the accommodation of ligands in the binding cavity.
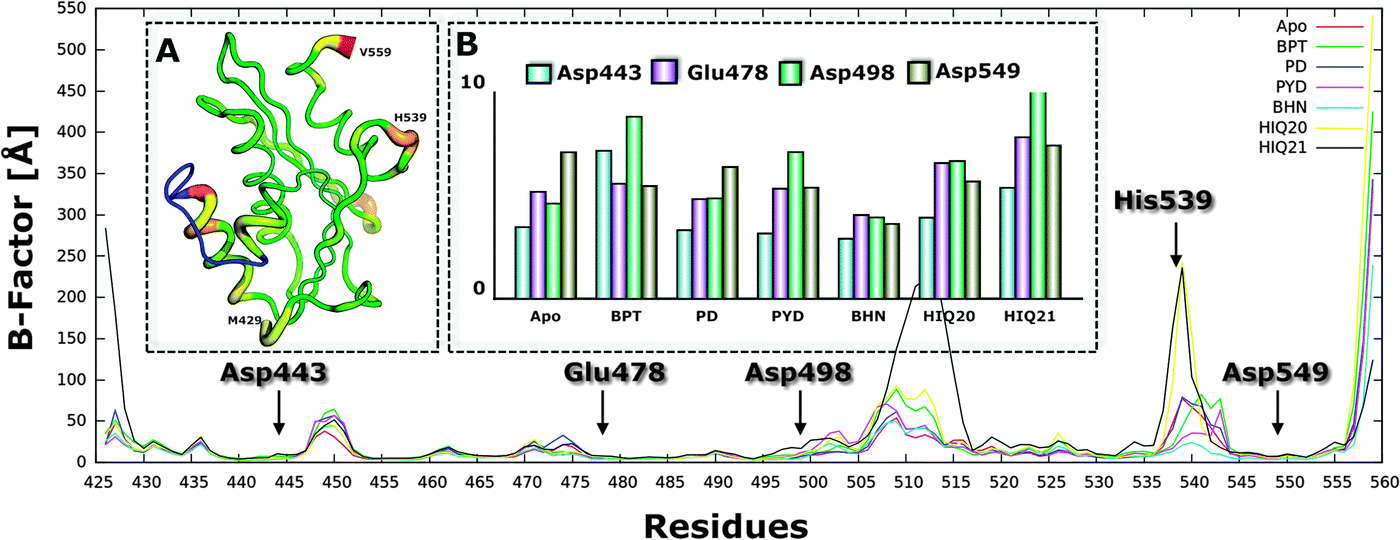 | ||
| Fig. 5 Average root-mean square fluctuation of protein backbone atoms as a function of residue number for all complexes, including ligand free simulation. Panel A shows the R-factor according to the X-ray crystal structure and panel B shows RMSF of conserved residues for all complexes. | ||
 | ||
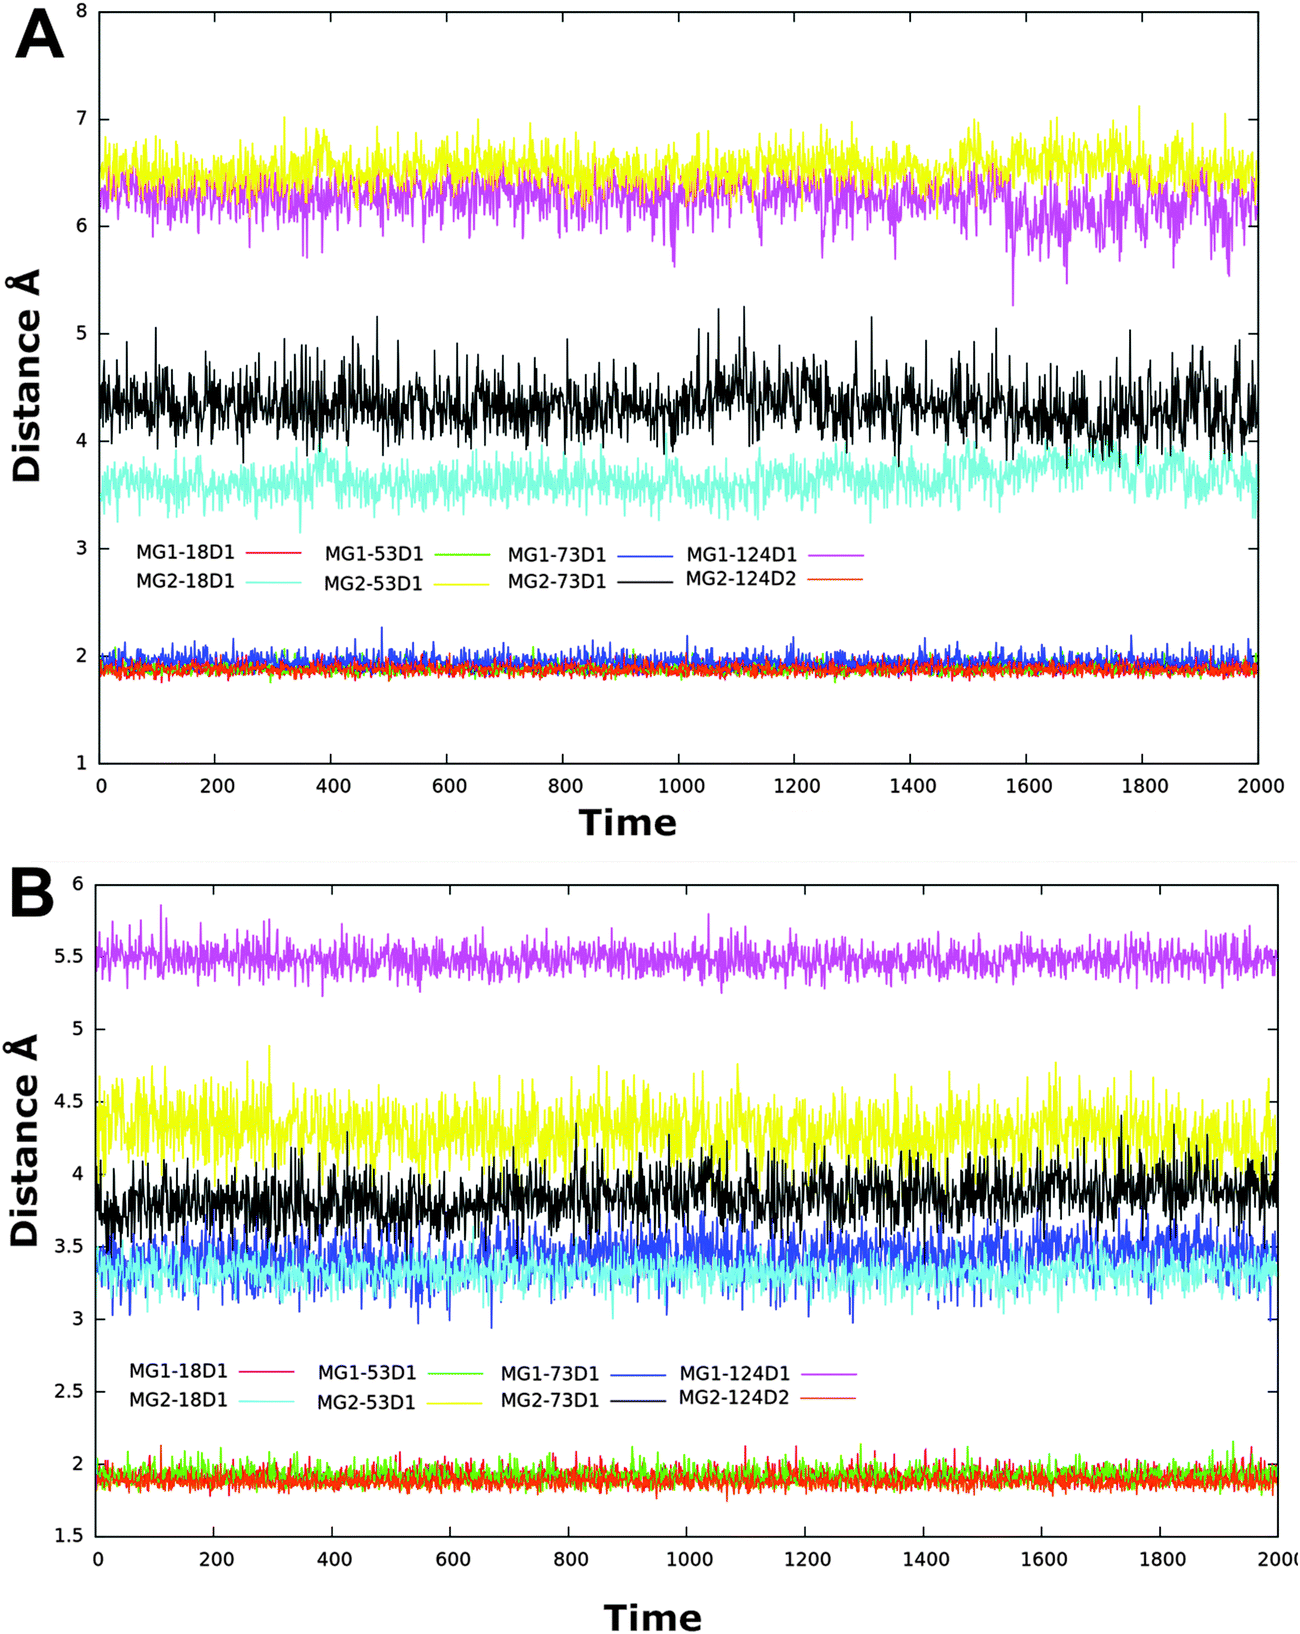
| Fig. 6 Distance between two catalytically active magnesium ions as a function of time for all complex and ligand free simulations. | ||
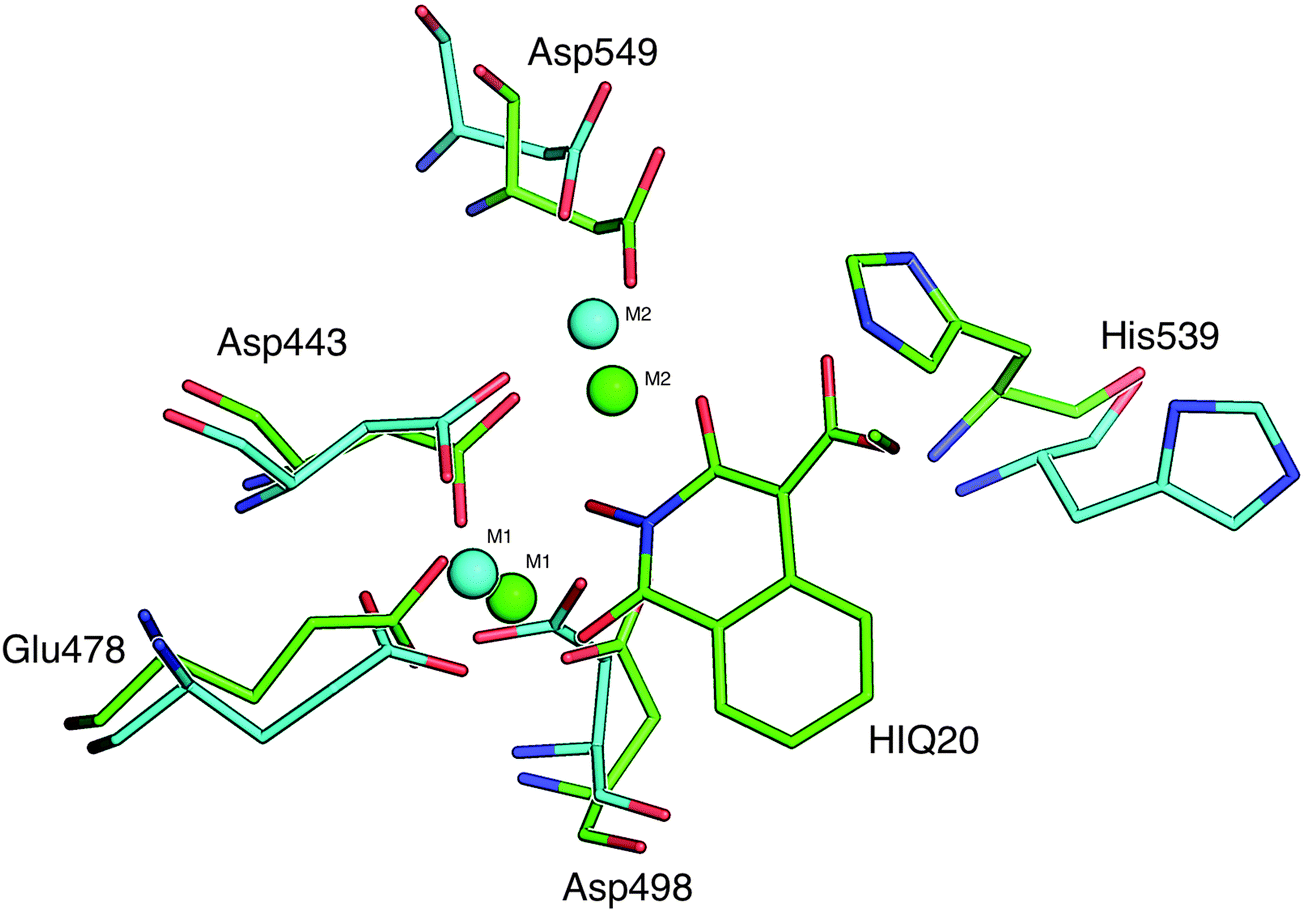 | ||
| Fig. 7 Superposition of the active site residue conformations of ligand free simulation (cyan) and HIQ20 complex (green) with RNH is shown (see text for more details). | ||
 | ||
| Fig. 8 Average interatomic distance between Mg2+ and ligands as a function of time. Panel A: HIQ20, B: BPT, C: HIQ21, D: BHMP07, E: PD and F: PYD. | ||
Compared to the other compounds in the dataset, compounds PD and PYD are relatively acidic in nature, as these both possess carboxylic acid groups. The overall charge of both compounds is −1. Although, the oxygen atoms of both compounds are very close to the magnesium ions, only O3 of compound PD and O4 of compound PYD interact favorably with magnesium ions due to the unfavorable charge–charge interaction of the other oxygen atoms which reduce the overall strength of the chelation and this causes a reduced ligand affinity compared to HIQ20 as discussed in Section 2.1.5.
 | ||
| Fig. 9 Time series of magnesium ions–residues distance of ligand free simulation of RNase H (A), RNase H–HIQ20 complex (B). | ||
A comparison of the distances between the magnesium ions and residues for the Apo and complex simulations may provide valuable information about the active site dynamics upon ligand binding. Thus, the distance between the oxygen atoms of the conserved residues and Mg2+ is compared based on the Apo and complex simulations. As seen from Fig. 9B, the distance between the magnesium–residue coordination is significantly decreased in the RNH–HIQ20 complex compared to the Apo form. For instance, Mg1–Asp549 (6.3 → 5.5), Mg2–Asp443 (3.8 → 3.4), Mg2–Glu478 (6.5 → 4.5) and Mg2–Asp498 (4.5 → 3.8) in HIQ20 compared to the ligand-free form. Similar results were observed for other ligand complexes as well. This observation indicates that the ligand-free enzyme possesses a relatively large cavity and upon ligand binding the cavity shrinks in order to provide a best fit for the ligand binding.
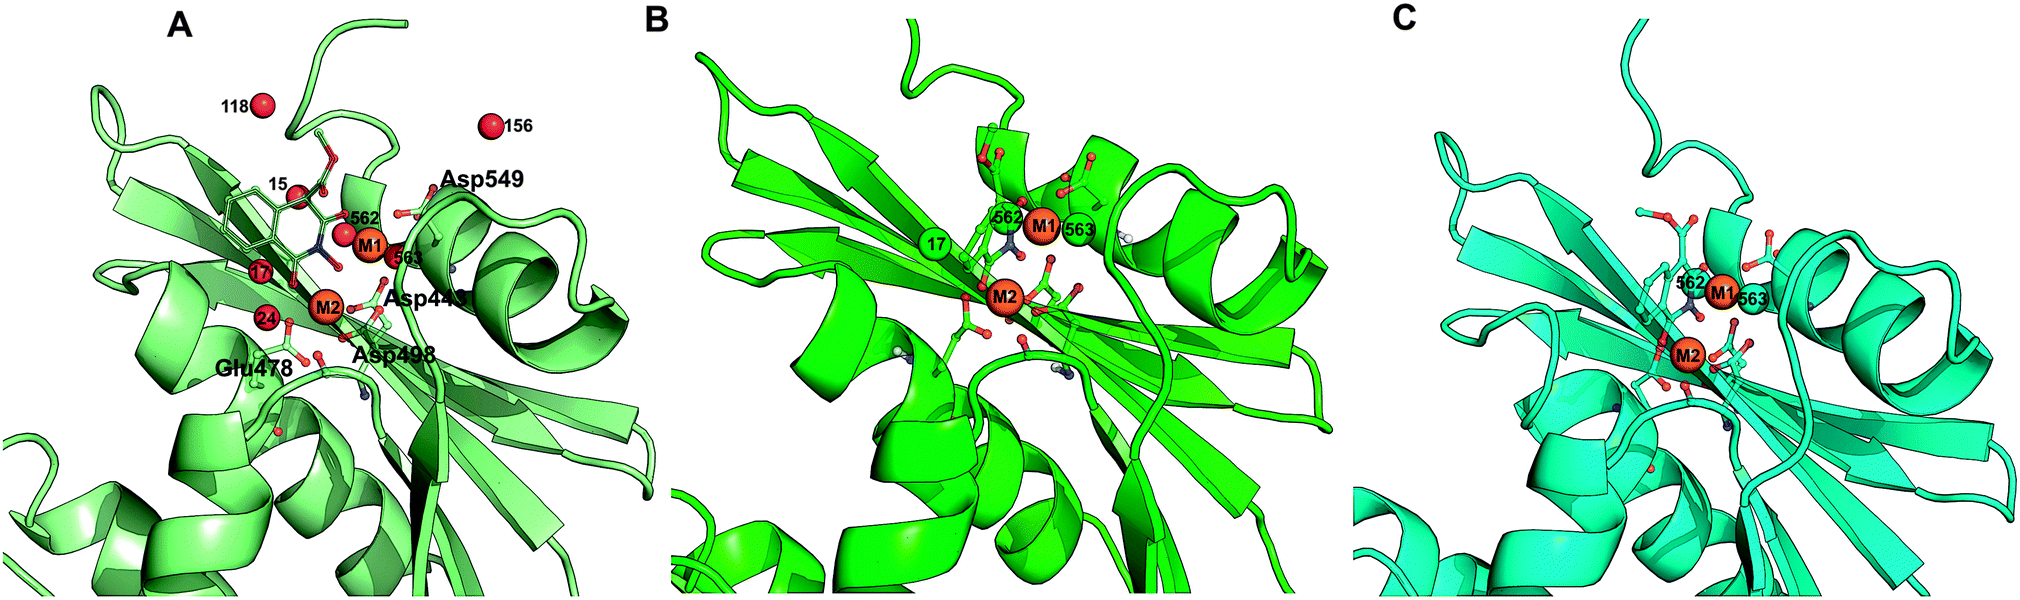 | ||
| Fig. 10 Snapshots of the active site of the RNH–HIQ20 complex; (A) active site in the starting structure; (B) active site shown after 100 ps simulation, (C) active site shown after 10 ns simulation. Important residues and HIQ20 are highlighted with the ball and stick model. Magnesium ions are shown in orange sphere and various water molecules are shown using red, green and cyan spheres. | ||
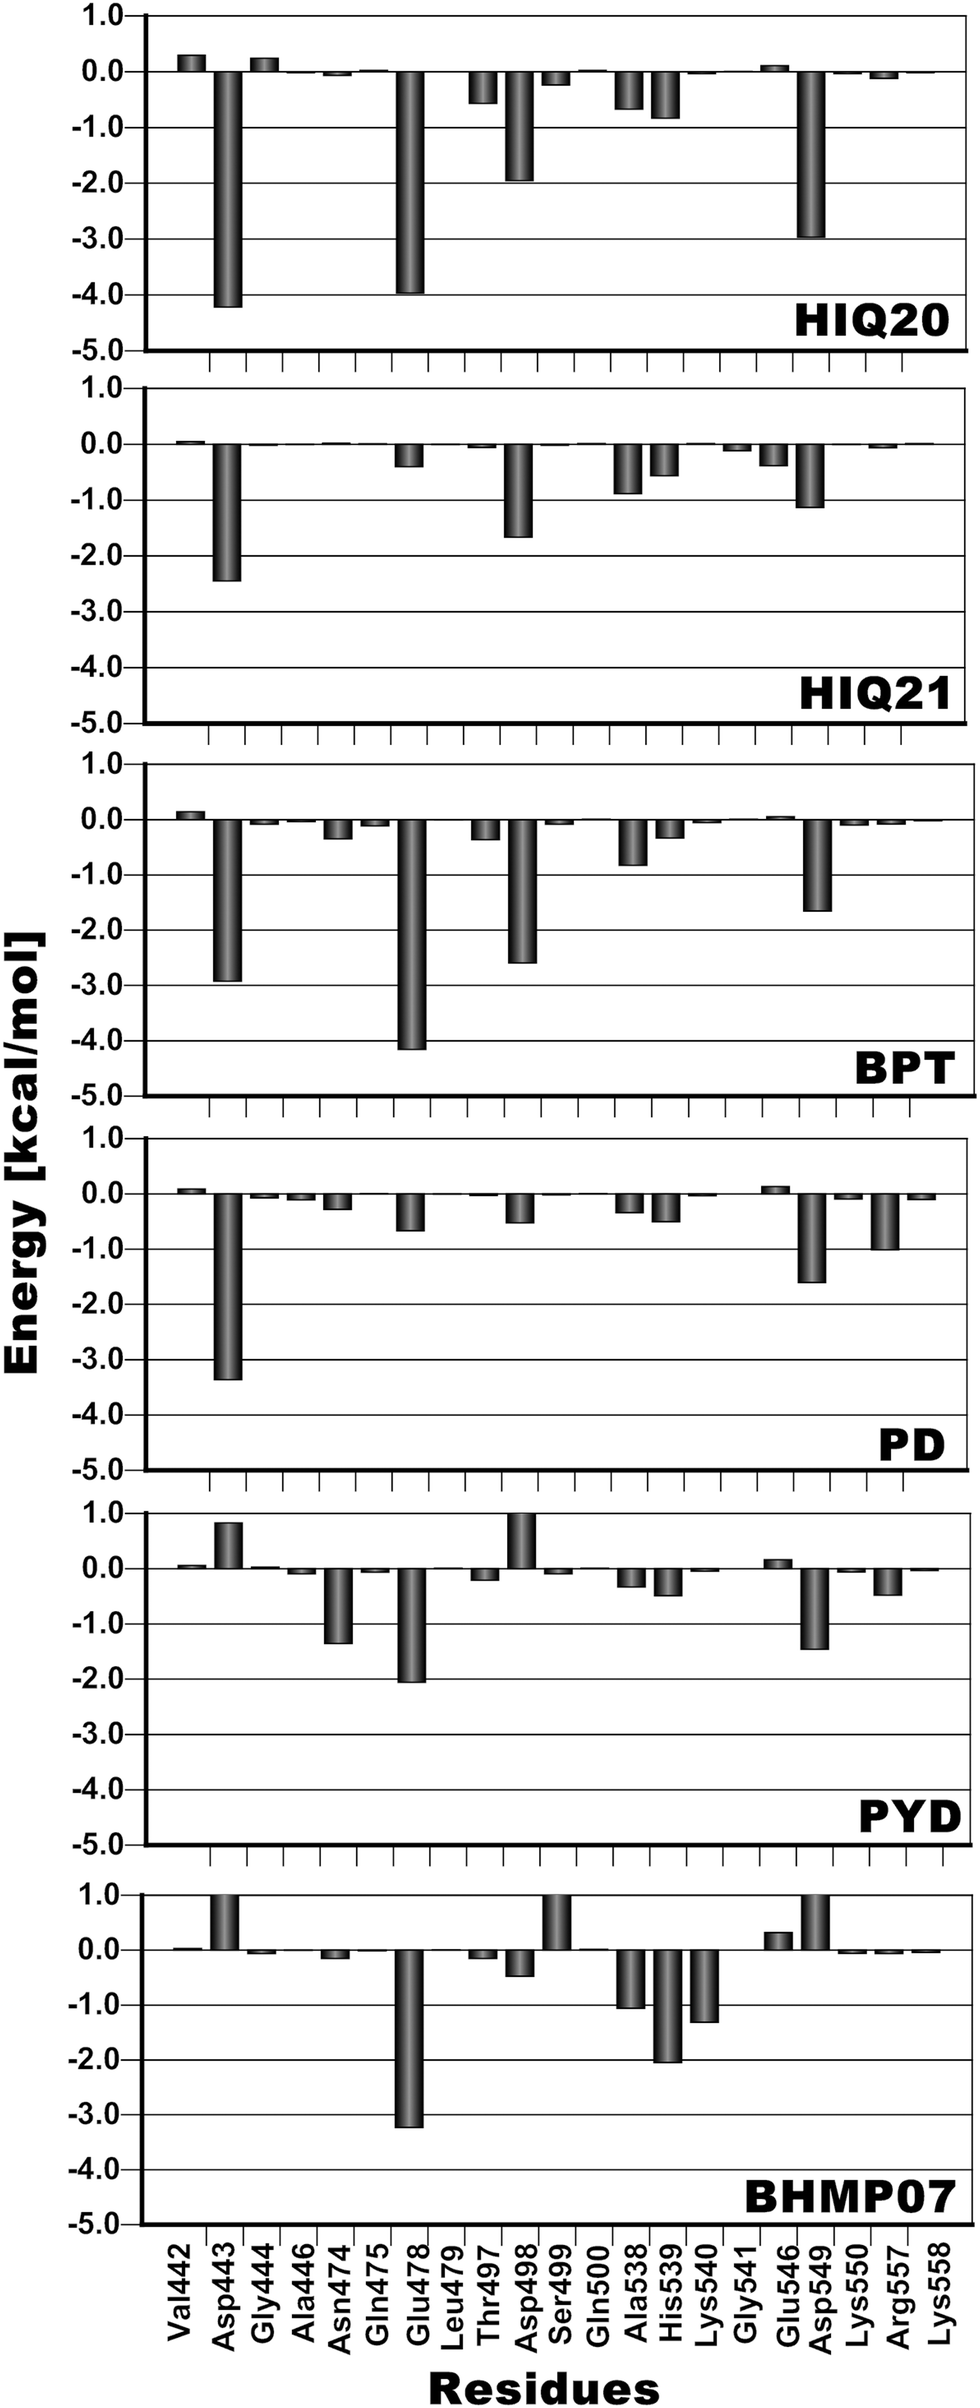 | ||
| Fig. 11 Residue decomposition of the binding free energies. | ||
| Compounds | pIC50 | ΔG* | Thr497, Glu478 (−) | Mg, Thr497, Glu478 (−) | Mg (−) | Mg, ligand (+) | Thr497, Glu478 (+) | Ligand (+) | Ligand, Thr498, Glu478 (+) | Mg, Ligand, Thr498, Glu478 (+) |
|---|---|---|---|---|---|---|---|---|---|---|
| The results refer to averages over 2000 frames and all units are reported in kcal mol−1. * According to the MM-GBSA model, extracted from the differences (average) of ΔGComplex − ΔGReceptor − ΔGLigand. + Indicates only the energy of these components are used for correlation with observed activities. − Indicates other than these components are used for correlation with observed activities. | ||||||||||
| HIQ20 | 7.21 | −48.46 | −43.67 | −10.23 | −14.76 | −33.44 | −4.53 | −66.43 | −70.96 | −37.976 |
| HIQ21 | 4.41 | −3.20 | −2.74 | −7.94 | −8.40 | 5.2 | −0.46 | −13.79 | −14.25 | 4.748 |
| BPT | 6.68 | −37.51 | −32.99 | −7.66 | −12.18 | −25.32 | −4.52 | −49.13 | −53.65 | −29.849 |
| PD | 5.21 | −10.85 | −10.17 | −8.24 | −8.93 | −1.92 | −0.68 | −33.09 | −33.77 | −2.616 |
| PYD | 6.05 | −42.79 | −40.53 | −1.81 | −4.08 | −38.71 | −2.26 | −40.47 | −42.73 | −40.98 |
| BHNP07 | 6.7 | −30.77 | −27.38 | 0.35 | −3.03 | −27.74 | −3.38 | −28.93 | −32.32 | −31.124 |
| R 2 | 0.82 | 0.79 | 0.02 | 0.05 | 0.73 | 0.91 | 0.67 | 0.71 | 0.78 | |
4. Conclusion
In the present study MM-PB(GB)/SA methods have been used as an initial validation for a structural dynamic analysis of RNH–inhibitor complexes using molecular dynamics simulations. From the MM-PB(GB)/SA study it is found that the electrostatic interactions dominate the overall binding affinities compared to the van der Waals (vdW) energy contribution. In terms of the ability to correctly rank the ligands according to experimental activities the MM-GBSA (R2 = 0.84) method performs better than MM-PBSA (R2 = 0.61). This study has especially been performed in order to unveil the overall structural dynamics of RNH and this analysis includes both ligand-free and complex simulations. From the snapshots extracted from a 20 ns simulation, inter-atomic distance analysis of the two magnesium ions reveals that the magnesium ions are very dynamic and that the distance is significantly changed for different ligands compared to the original distance (3.8 Å). The minimum distance (3.6 Å) was found for a highly active compound (HIQ20) and a maximum distance (4.67 Å) was found for a low active compound (PD). In addition to the inter-atomic distance between the magnesium ions, the protonation states of the ligands also play a crucial role in how well they bind with magnesium ions. For instance, HIQ20 (IC50 = 0.061 μM) and HIQ21 (IC50 = 38.8 μM) both possess very similar structural features, however, they have different protonation states, which results in HIQ20 being a highly active compound. In all cases residues Glu478 and Thr497 show very favorable interaction with the ligands. In addition, residues such as Ala445, Asn474, Ala538, His539 and Arg555 also showed favorable energy contributions to the overall ligand binding either by hydrogen bonding or π interactions. From the water dynamics analysis it is found that at least two water molecules at the active site coordinate with the magnesium ions throughout the simulation. Overall, the RNH structure is very stable, however, it slightly decreases the active site volume when the ligands bind. The analysis provided in this study could provide valuable information for the RNH inhibitor design.Acknowledgements
The authors are thankful for financial support from the Lundbeck Foundation, The Danish Councils for Independent Research, the Villum Foundation, Denmark. The authors are also thankful to ChemAxon and OpenEye scientific software for providing a free academic license.References
- E. De Clercq, Biochim. Biophys. Acta, Mol. Basis Dis., 2002, 1587, 258–275 CrossRef CAS.
- A. S. Fauci, Nat. Med., 2003, 9, 839–843 Search PubMed.
- D. M. Himmel, K. A. Maegley, T. A. Pauly, J. D. Bauman, K. Das, C. Dharia, A. D. Clark Jr., K. Ryan, M. J. Hickey, R. A. Love, S. H. Hughes, S. Bergqvist and E. Arnold, Structure, 2009, 17, 1625–1635 Search PubMed.
- A. J. Ribeiro, M. J. Ramos and P. A. Fernandes, J. Am. Chem. Soc., 2012, 134, 13436–13447 Search PubMed.
- P. Bean, Clin. Infect. Dis., 2005, 41(suppl 1), S96–S100 CrossRef CAS PubMed.
- FDA, Antiretroviral drugs used in the treatment of HIV infection, http://www.fda.gov.
- E. Tramontano and R. Di Santo, Curr. Med. Chem., 2010, 17, 2837–2853 Search PubMed.
- T. Ilina, K. Labarge, S. G. Sarafianos, R. Ishima and M. A. Parniak, Biology, 2012, 1, 521–541 Search PubMed.
- D. M. Himmel, S. G. Sarafianos, S. Dharmasena, M. M. Hossain, K. McCoy-Simandle, T. Ilina, A. D. Clark Jr., J. L. Knight, J. G. Julias, P. K. Clark, K. Krogh-Jespersen, R. M. Levy, S. H. Hughes, M. A. Parniak and E. Arnold, ACS Chem. Biol., 2006, 1, 702–712 CrossRef CAS PubMed.
- M. Wendeler, H. F. Lee, A. Bermingham, J. T. Miller, O. Chertov, M. K. Bona, N. S. Baichoo, M. Ehteshami, J. Beutler, B. R. O'Keefe, M. Gotte, M. Kvaratskhelia and S. Le Grice, ACS Chem. Biol., 2008, 3, 635–644 CrossRef CAS PubMed.
- A. K. Felts, K. Labarge, J. D. Bauman, D. V. Patel, D. M. Himmel, E. Arnold, M. A. Parniak and R. M. Levy, J. Chem. Inf. Model., 2011, 51, 1986–1998 CrossRef CAS PubMed.
- M. Nowotny, S. A. Gaidamakov, R. Ghirlando, S. M. Cerritelli, R. J. Crouch and W. Yang, Mol. Cell, 2007, 28, 264–276 CrossRef CAS PubMed.
- R. Costi, M. Métifiot, F. Esposito, G. Cuzzucoli Crucitti, L. Pescatori, A. Messore, L. Scipione, S. Tortorella, L. Zinzula, E. Novellino, Y. Pommier, E. Tramontano, C. Marchand and R. Di Santo, J. Med. Chem., 2013, 56, 8588–8598 CrossRef CAS PubMed.
- J. D. Barlett, Medscaps, 2006, Feb. 8, http://www.medscape.org/viewarticle/523119.
- E. B. Lansdon, Q. Liu, S. A. Leavitt, M. Balakrishnan, J. K. Perry, C. Lancaster-Moyer, N. Kutty, X. Liu, N. H. Squires, W. J. Watkins and T. A. Kirschberg, Antimicrob. Agents Chemother., 2011, 55, 2905–2915 CrossRef CAS PubMed.
- H. P. Su, Y. Yan, G. S. Prasad, R. F. Smith, C. L. Daniels, P. D. Abeywickrema, J. C. Reid, H. M. Loughran, M. Kornienko, S. Sharma, J. A. Grobler, B. Xu, V. Sardana, T. J. Allison, P. D. Williams, P. L. Darke, D. J. Hazuda and S. Munshi, J. Virol., 2010, 84, 7625–7633 Search PubMed.
- M. Billamboz, F. Bailly, C. Lion, N. Touati, H. Vezin, C. Calmels, M. L. Andreola, F. Christ, Z. Debyser and P. Cotelle, J. Med. Chem., 2011, 54, 1812–1824 CrossRef CAS PubMed.
- P. Vasanthanathan and J. Kongsted, PLoS One, 2013, 8, e73478 Search PubMed , 1–15.
- H. Fuji, E. Urano, Y. Futahashi, M. Hamatake, J. Tatsumi, T. Hoshino, Y. Morikawa, N. Yamamoto and J. Komano, J. Med. Chem., 2009, 52, 1380–1387 Search PubMed.
- S. Distinto, F. Esposito, J. Kirchmair, M. C. Cardia, M. Gaspari, E. Maccioni, S. Alcaro, P. Markt, G. Wolber, L. Zinzula and E. Tramontano, Eur. J. Med. Chem., 2012, 50, 216–229 CrossRef CAS PubMed.
- H. Yanagita, S. Fudo, E. Urano, R. Ichikawa, M. Ogata, M. Yokota, T. Murakami, H. Wu, J. Chiba, J. Komano and T. Hoshino, Chem. Pharm. Bull., 2012, 60, 764–771 Search PubMed.
- K. Arnold, L. Bordoli, J. Kopp and T. Schwede, Bioinformatics, 2006, 22, 195–201 Search PubMed.
- Schrödinger, Portland, USA, 2013.
- G. Madhavi Sastry, M. Adzhigirey, T. Day, R. Annabhimoju and W. Sherman, J. Comput.-Aided Mol. Des., 2013, 27, 221–234 Search PubMed.
- H. Li, A. D. Robertson and J. H. Jensen, Proteins, 2005, 61, 704–721 CrossRef CAS PubMed.
- M. T. Christen, L. Menon, N. S. Myshakina, J. Ahn, M. A. Parniak and R. Ishima, Chem. Biol. Drug Des., 2012, 80, 706–716 Search PubMed.
- J. C. Shelley, A. Cholleti, L. L. Frye, J. R. Greenwood, M. R. Timlin and M. Uchimaya, J. Comput.-Aided Mol. Des., 2007, 21, 681–691 Search PubMed.
- A. D. Bochevarov, E. Harder, T. F. Hughes, J. R. Greenwood, D. A. Braden, D. M. Philipp, D. Rinaldo, M. D. Halls, J. Zhang and R. A. Friesner, Int. J. Quantum Chem., 2013, 113, 2110–2142 CrossRef CAS PubMed.
- R. A. Friesner, J. L. Banks, R. B. Murphy, T. A. Halgren, J. J. Klicic, D. T. Mainz, M. P. Repasky, E. H. Knoll, M. Shelley, J. K. Perry, D. E. Shaw, P. Francis and P. S. Shenkin, J. Med. Chem., 2004, 47, 1739–1749 Search PubMed.
- D. A. Case, T. A. Darden, I. T. E. Cheatham, C. L. Simmerling, J. Wang, R. E. Duke, R. Luo, R. C. Walker, W. Zhang, K. M. Merz, B. Roberts, S. Hayik, A. Roitberg, G. Seabra, J. Swails, A. W. Goetz, I. Kolossváry, K. F. Wong, F. Paesani, J. Vanicek, R. M. Wolf, J. Liu, X. Wu, S. R. Brozell, T. Steinbrecher, H. Gohlke, Q. Cai, X. Ye, J. Wang, M.-J. Hsieh, G. Cui, D. R. Roe, D. H. Mathews, M. G. Seetin, R. Salomon-Ferrer, C. Sagui, V. Babin, T. Luchko, S. Gusarov, A. Kovalenko and P. A. Kollman, Amber 12, University of California, San Francisco, 12 edn, 2012 Search PubMed.
- M. J. Frisch, G. W. Trucks, H. B. Schlegel, G. E. Scuseria, M. A. Robb, J. R. Cheeseman, G. Scalmani, V. Barone, B. Mennucci, G. A. Petersson, H. Nakatsuji, M. Caricato, X. Li, H. P. Hratchian, A. F. Izmaylov, J. Bloino, G. Zheng, J. L. Sonnenberg, M. Hada, M. Ehara, K. Toyota, R. Fukuda, J. Hasegawa, M. Ishida, T. Nakajima, Y. Honda, O. Kitao, H. Nakai, T. Vreven, J. A. Montgomery Jr., J. E. Peralta, F. Ogliaro, M. Bearpark, J. J. Heyd, E. Brothers, K. N. Kudin, V. N. Staroverov, R. Kobayashi, J. Normand, K. Raghavachari, A. Rendell, J. C. Burant, S. S. Iyengar, J. Tomasi, M. Cossi, N. Rega, N. J. Millam, M. Klene, J. E. Knox, J. B. Cross, V. Bakken, C. Adamo, J. Jaramillo, R. Gomperts, R. E. Stratmann, O. Yazyev, A. J. Austin, R. Cammi, C. Pomelli, J. W. Ochterski, R. L. Martin, K. Morokuma, V. G. Zakrzewski, G. A. Voth, P. Salvador, J. J. Dannenberg, S. Dapprich, A. D. Daniels, Ö. Farkas, J. B. Foresman, J. V. Ortiz, J. Cioslowski and D. J. Fox, Gaussian 09, Gaussian, Inc., Wallingford, CT, USA, Revision D.01 edn., 2009 Search PubMed.
- H. J. C. Berendsen, J. P. M. Postma, W. F. van Gunsteren, A. DiNola and J. R. Haak, J. Chem. Phys., 1984, 81, 3684–3690 CrossRef CAS PubMed.
- J. M. Hayes and G. Archontis, in Molecular Dynamics – Studies of Synthetic and Biological Macromolecules, ed. L. Wang, InTeck, 2012, ch. 9 Search PubMed.
- A. Weis, K. Katebzadeh, P. Soderhjelm, I. Nilsson and U. Ryde, J. Med. Chem., 2006, 49, 6596–6606 CrossRef CAS PubMed.
- J. Kongsted and U. Ryde, J. Comput.-Aided Mol. Des., 2009, 23, 63–71 CrossRef CAS PubMed.
- B. R. Miller, T. D. McGee, J. M. Swails, N. Homeyer, H. Gohlke and A. E. Roitberg, J. Chem. Theory Comput., 2012, 8, 3314–3321 CrossRef CAS.
- V. Poongavanam, C. Steinmann and J. Kongsted, PLoS One, 2014, 9, e98659 Search PubMed , 1–11.
Footnote |
| † Electronic supplementary information (ESI) available. See DOI: 10.1039/c4ib00111g |
| This journal is © The Royal Society of Chemistry 2014 |