 Open Access Article
 This Open Access Article is licensed under a
 Creative Commons Attribution 3.0 Unported Licence
Microfluidic cell sorter-aided directed evolution of a protein-based calcium ion indicator with an inverted fluorescent response†
Yongxin
Zhao
a,
Ahmed S.
Abdelfattah
a,
Yufeng
Zhao
a,
Araya
Ruangkittisakul
b,
Klaus
Ballanyi
b,
Robert E.
Campbell
*a and
D. Jed
Harrison
*a
aDepartment of Chemistry, University of Alberta, 11227 Saskatchewan Drive, Edmonton, Alberta T6G 2G2, Canada. E-mail: jed.harrison@ualberta.ca; robert.e.campbell@ualberta.ca; Fax: +1-780-492-8231; Tel: +1-780-492-2790 Tel: +1-780-492-1849
bDepartment of Physiology, University of Alberta, Edmonton, Alberta T6G 2H7, Canada
First published on 6th May 2014
Abstract
We demonstrate a simple, low cost and disposable microfluidic fluorescence activated cell sorting system (μFACS) for directed evolution of fluorescent proteins (FP) and FP-based calcium ion (Ca2+) indicators. The system was employed to pre-screen libraries of up to 106 variants of a yellow FP-based Ca2+ indicator (Y-GECO) with throughput up to 300 cells per s. Compared to traditional manual screening of FP libraries, this system accelerated the discovery of improved variants and saved considerable time and effort during the directed evolution of Y-GECO. Y-GECO1, the final product of the μFACS-aided directed evolution, has a unique fluorescence hue that places it in the middle of the spectral gap that separates the currently available green and orange FP-based Ca2+ indicators, exhibits bright fluorescence in the resting (Ca2+ free) state, and gives a large response to intracellular Ca2+ fluctuations in live cells.
Insight, innovation, integrationFluorescent protein-based Ca2+ indicators are powerful tools for visualizing complex Ca2+ dynamics and signaling in live cells, but development of improved fluorescent protein-based Ca2+ indicators remains challenging and laborious. To address the issue, we developed an innovative high-throughput μFACS-aided screen approach and demonstrated that, relative to the traditional manual screening method, this new approach accelerated the engineering of a new yellow fluorescent Ca2+ indicator (Y-GECO). The best variant identified by μFACS-aided screen, Y-GECO1, has bright fluorescence and a large inverse response. Y-GECO1 enables robust Ca2+ imaging for the study of neuronal activities in dissociated neurons and cultured brain slices. This μFACS-aided screen technique should enable high-throughput screening of a broad range of fluorescent protein-based indicators. |
Introduction
The calcium ion (Ca2+) has a pivotal role in cell signaling, serving as the critical second messenger for numerous signaling pathways and processes in essentially all cell types. The Ca2+-signaling system is highly versatile and operates with a diverse array of spatial and temporal patterns in different tissues.1,2 To interrogate Ca2+ dynamics, it is essential to develop technologies that enable visualization and quantitative measurement of intracellular Ca2+ signals. Compared to synthetic dye-based Ca2+ indicators, fluorescent protein (FP)-based Ca2+ indicators offer a number of advantages for Ca2+ imaging in live cells and tissues. Specifically, FP-based Ca2+ indicators are genetically encoded and can therefore be delivered to cells transiently in the minimally invasive form of the corresponding gene or constitutively expressed in transgenic animals.3 Furthermore, with appropriate gene promoters and trafficking signals, FP-based Ca2+ indicators can be expressed only in specific cell types or targeted to specific subcellular compartments.Extensive protein engineering efforts have led to an expansion of the toolbox of FP-based Ca2+ indicators and introduced new members with improved or novel properties.4–8 One effective approach for developing improved FP-based Ca2+ indicators is the manual one-by-one testing of a small selection of variants rationally designed on the basis of structure-based hypotheses regarding the mechanism.5,9–11 Arguably, a more effective approach for discovering improved FP-based Ca2+ indicators is the use of directed evolution, where large libraries of randomly generated variants are subjected to a high-throughput screen to identify improved variants.6–8 Such directed evolution efforts have typically relied on manual on-plate screening of bacterial colony fluorescence with moderate throughput of up to 104 variants every few days. In this way rare clones with improved or unanticipated novel properties, that would be unlikely to be identified by rational approaches, can be discovered.
A promising approach for increasing the size of FP-based libraries that can be screened, and thereby increasing the odds of finding improved variants, is to exploit the ability of fluorescence activated cell sorting (FACS) to rapidly evaluate and sort very large numbers of fluorescently labeled cells. Relative to the labor-intensive and time-consuming process of on-plate screening, the throughput of FACS is 3 orders of magnitude higher.12,13 Unfortunately, FACS equipment is expensive, requires a high level of technical skill to operate, and is typically ineffective for screening properties other than brightness, such as analyte-dependent fluorescence changes or photoconversion. Microfluidic FACS (μFACS) devices are a promising alternative to traditional FACS for screening FP and FP-based Ca2+ indicators, as they are inexpensive and much more amenable to customization. Recently, a number of μFACS devices have been reported for screening fluorescently-labeled cells,14–24 which could potentially be customized for molecular evolution of FP and FP-based Ca2+ indicators. Despite the potential of μFACS, application of μFACS devices for evolving useful FP indicators remains elusive. To achieve this goal, we have built a simple, cost-effective and disposable high-throughput μFACS device integrated with a piezoelectric actuator based on previous reports.22,25 We use this device for library enrichment prior to a manual screen, to accelerate the directed evolution of a single FP-based Ca2+ indicator derived from the yellow FP mPapaya1.26 Compared to other sorting mechanisms such as electroosmotic,20,27 dielectrophoretic,28–30 hydrodynamic sorting31,32 and optical switching,21 the integrated piezoelectric actuator offers several advantages including low cost (<$10), low power consumption (<0.1 mW), precise control, fast response time (0.1–1 ms) and high cell viability.22 In addition, the μFACS device costs less than $10 and is disposable,22 which eliminates the possibility of cross-contamination from bacterial samples. In contrast, FACS often requires harsh and complex cleaning procedures for de-contamination of bacterial samples. These features of our μFACS device are preferable for live cell screening.
The design of the single FP-based Ca2+ indicator engineered in this work is similar to that of pericam and GCaMP.33,34 In this design, the C- and N-termini of a circularly permutated FP (cpFP) are fused to calmodulin (CaM) and a peptide binding partner (smooth muscle myosin light-chain kinase peptide RS20), respectively. The large conformational change associated with binding of CaM to Ca2+ followed by binding of RS20 to Ca2+-bound CaM, results in a change in the FP chromophore environment that modulates its fluorescent properties.7,8,33,34 Single FP reporters have been developed from engineered versions of Aequorea GFP,33,34Clavularia sp. FP,7Discosoma RFP8 and Entacmea quadricolor RFP.35 In this work, we have chosen to use a cp version of the monomeric Zoanthus sp. yellow FP-derived variant known as mPapaya0.4,26 the best mPapaya available at the beginning of this work, which has a unique emission wavelength around 540 nm. We reason that a Ca2+ indicator that retained the fluorescence hue of mPapaya would fill the spectral gap between GCaMP33 and O-GECO16 in the visible wavelength palette of available FP-based Ca2+ indicators and provide new opportunities for multicolor Ca2+ imaging.
Results and discussion
Construction of the Y-GECO prototype and initial screening for improved variants
To construct a potential yellow FP-based Ca2+ indicator, we replaced the cpGFP domain of G-GECO1.18 with the analogous cp version (N-term-148 to 238-GGTGGS-1 to 147-C-term) of mPapaya0.4.26 We designed 2 libraries in which one or two residues at the new N-terminus (residues 27 and 28 by Y-GECO numbering, Fig. S1, ESI†) and one residue at the C-terminus of cpmPapaya (residue 272, Fig. S1, ESI†) were randomized (Fig. 1A and B). The first version of the library had just residue 28 randomized at the N-terminus, while the second library had both 27 and 28 randomized. These two libraries were cloned into a customized vector that targets variants to the periplasmic space of E. coli cells.8 After plasmid transformation by electroporation, E. coli cells were plated on agar plates and formed individual colonies. Traditional on-plate manual screening of both libraries led to the identification of a variant (Y-GECO0.1) from the second library with an 88% decrease in fluorescence upon binding Ca2+ (Fig. 1C). However, Y-GECO0.1 exhibited dim fluorescence and poor folding efficiency relative to mPapaya0.4. Two rounds of directed evolution for improved folding efficiency using manual screening led to the identification of Y-GECO0.5a and b (Fig. S1, ESI†) which were still dim but had better folding efficiency and similar dynamic range to Y-GECO0.1. At this point it was apparent that many more rounds of directed evolution would be necessary to improve Y-GECO to the point where it would be useful for live cell imaging. We reasoned that a μFACS-aided approach would accelerate this process and so we designed and applied a chip based on the work of Chen et al.22,25,36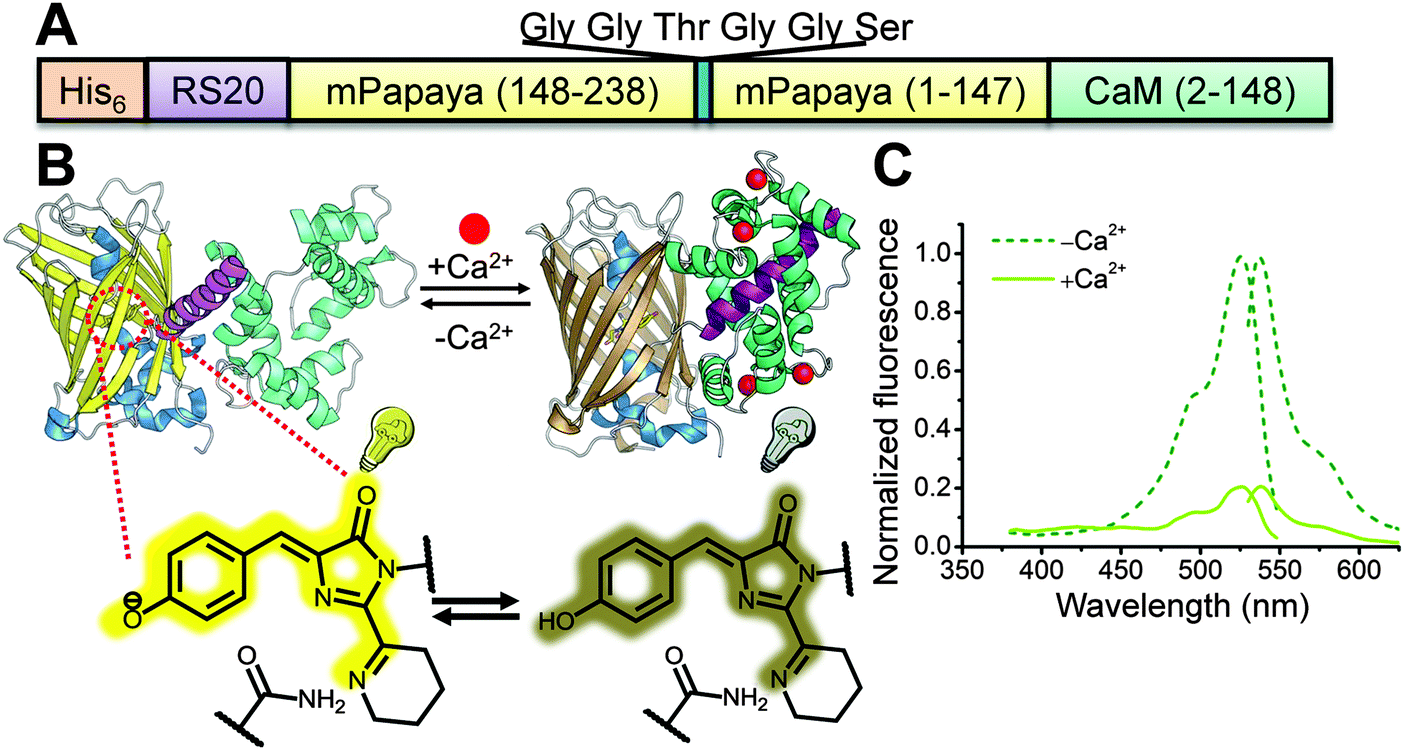 | ||
| Fig. 1 Construction of the Y-GECO prototype, Y-GECO0.1. (A) Schematic representation of the sequence of the first generation Y-GECO Ca2+ indicator based on the recently reported yellow FP mPapaya0.4.26 (B) Schematic representation of the tertiary structure and Ca2+-sensing mechanism of Y-GECO. The FP chromophore protonation state (i.e., the pKa) is modulated due to the conformation change associated with binding of RS20 by Ca2+-bound calmodulin (CaM), leading to the change in fluorescence. (C) Excitation and emission spectra of Y-GECO0.1, recorded at emission 560 nm and excitation 510 nm respectively. | ||
Design and fabrication of μFACS platform
A simple, low cost μFACS platform is ideal for the directed evolution of FP-based Ca2+ indicators as it greatly decreases the cost of fabrication and maintenance and can be readily adapted to the screen at hand compared to FACS. We elected to build a μFACS platform based on a polydimethylsiloxane (PDMS) microfluidic cell sorter chip with an integrated piezoelectric actuator.22,25,36 PDMS microchips containing 3 input channels and 3 output channels, connected with a 5 cm channel for buffer mixing were fabricated using standard soft lithography techniques. For operation of this chip, cell samples were continuously flowed through the middle input channel and were confined to a single stream by sheath flow from the two side input channels. For a typical cell sample (∼107 cells per mL), the chip operated for more than 2 hours without obvious clogging. High signal-to-noise fluorescence detection of single bacterial cells expressing Y-GECO variants was achieved using laser excitation at 488 nm with confocal detection using a photomultiplier tube (PMT) (Fig. 2D). The piezoelectric actuator integrated into the PDMS chip could be triggered for manipulation of fluid flow to achieve sorting into one of the side collection channels, with a 44% sorting efficiency of capturing bright cells that trigger actuation (Fig. 2A and Table S1, ESI†). The system was designed to have three output channels so that sorting of two different populations would be possible in principle. However, for the work described in this manuscript, we sorted all of the cells to just one of the two side outlets on the device.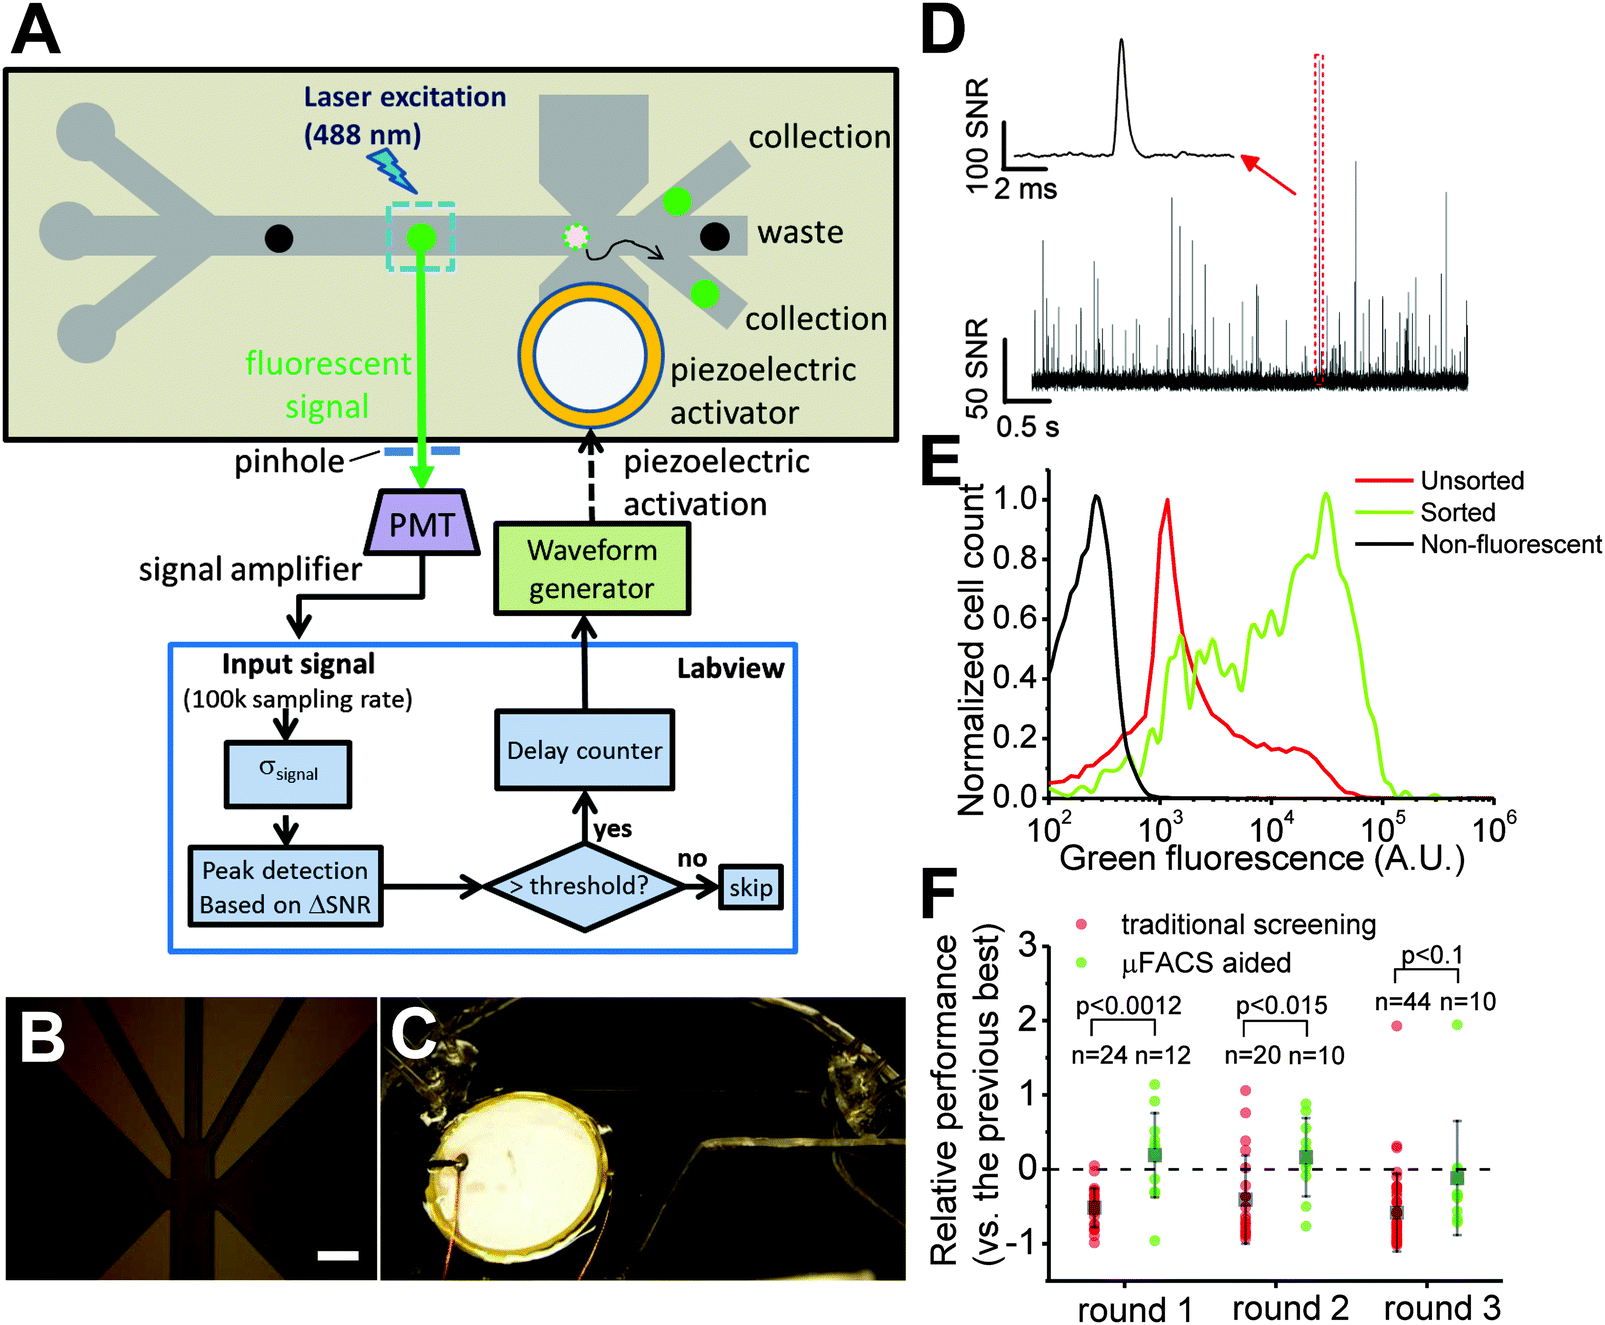 | ||
| Fig. 2 A simple and low cost μFACS platform for high throughput enrichment of libraries of FP and FP-based indicators. (A) μFACS platform using on chip laser illumination and piezoelectric actuator, off chip confocal epifluorescence detection, PMT signal amplification and acquisition system, and electronic control system. The actuator mechanism is based on literature precedent.22,25 (B) Microscopic image of channels at the sorting junction (scale bar: 150 μm). (C) View of whole microfluidic cell sorter. (D–F) Summary of screening results. (D) Signals of E. coli cells expressing Y-GECO libraries flowing on chip acquired by PMT detector. The SNR was defined as the ratio of the signal magnitude of cell fluorescence and the background noise level of PMT signals. Inset shows a bright variant. (E) Cytometric histogram for a library of Y-GECO before and after sorting using μFACS system. (F) Screening results of selected variants from round 1 to round 3 with and without aid of μFACS system. Best variants were combined from both methods between each round. Each point represents the performance (brightness × maximum Ca2+ response) of each variant relative to the best from the previous round. Gray boxes show the average of relative performance; n is the number of tested variants, larger n indicates more time and effort invested; p values were obtained from two-tailed t-test, showing μFACS gave much better performance in the first two rounds and similar performance with much less effort (n is smaller) in the third round. | ||
To facilitate semi-automated cell sorting on chip, we designed a custom LabVIEW program for signal processing and sorting control. The signal-to-noise ratio (SNR) of cell fluorescence was calculated in real time based on the magnitude and background noise level of PMT signals. Fluorescent signals with SNR higher than a pre-defined threshold triggered sorting based on piezoelectric actuation. The delay between detection at the PMT and piezoelectric pump actuation (i.e., the response time of the system) was 2.2 ± 0.6 ms (25 trials). The time for an individual cell to travel to the sorting junction was matched to this response time by adjusting the position of the detection point within the channel. Response time was primarily limited by communication between the computer and the chip. An embedded field programmable gate array chip for a close-loop sorting control could significantly improve the response time.22
The major limiting factor that determines the throughput of the μFACS for library enrichment is the requirement that only one bacterial cell should be in the sorting junction at a single moment. As the dimension of the junction was about 150 μm × 150 μm × 50 μm, the excitation volume is roughly 1.1 nL. To avoid co-sorting of cells, there should be only one or less cell per excitation volume on average at a single moment. Given that the ratio of flow rate of sheath flow to sample flow was 10![[thin space (1/6-em)]](https://www.rsc.org/images/entities/char_2009.gif) :1, the cell density of samples should be less than 1.87 × 10⁷ cells per mL (see SI text and Fig. S3 for more detailed discussion, ESI†). When the total flow rate was between 10.5 μL min−1 and 21 μL min−1, the throughput of the system was between 150–300 cells per s. With this throughput, roughly 106 Y-GECO variants could be screened within 2 hours. In practice, we screened 5 × 10⁵ to 1 × 10⁶ variants in 2 hours with actual throughput around 75 cells per second to 150 cells per second.
:1, the cell density of samples should be less than 1.87 × 10⁷ cells per mL (see SI text and Fig. S3 for more detailed discussion, ESI†). When the total flow rate was between 10.5 μL min−1 and 21 μL min−1, the throughput of the system was between 150–300 cells per s. With this throughput, roughly 106 Y-GECO variants could be screened within 2 hours. In practice, we screened 5 × 10⁵ to 1 × 10⁶ variants in 2 hours with actual throughput around 75 cells per second to 150 cells per second.
Although our μFACS does not surpass FACS in terms of throughput and sorting efficiency, our devices cost less than $10 each for fabrication and are disposable. The whole μFACS system including all the components costs less than $10k, which is at least 50 fold reduction in cost compared to commercial FACS systems, such as MoFlo (∼$500k).36 In addition, the μFACS system is amenable for customization to adapt to different purposes. The off-chip optical platform enables convenient installation of additional optical components including extra laser light sources for multicolor excitation, and extra dichroic mirrors and filters for spectroscopical separation of the emission light,18etc. With an appropriate optical setup, researchers could use μFACS to enrichment variants based on more complex optical properties, such as photostability21,37 and efficiency of Förster resonance energy transfer.
μFACS-aided directed evolution of Y-GECO
We designed a μFACS-aided directed evolution strategy for improving Y-GECO variants with the focus on improving brightness (Fig. S2, ESI†). Briefly, E. coli cells expressing periplasm-localized Y-GECO variants were suspended in a Ca2+-free buffer (around 1 × 10⁷ cells per mL) and loaded into the chip. The fluorescence signal of hundreds of cells was measured and analyzed to determine the threshold, which was the trigger to activate the sorting to collect the top 0.1% brightest clones. Cells collected during the μFACS pre-screen were grown as colonies on agar plates and then manually screened in a manner identical to the traditional on-plate screen. Flow cytometric analysis of the initial and enriched libraries by μFACS (Fig. 2E) shows that our μFACS system could enrich bright variants and increase the fluorescence intensity of the dominant peak by a factor of 16. Unlike other GECOs, the fluorescence of Y-GECO variants is dim in the presence of Ca2+ and is bright in the absence of Ca2+. Therefore, Y-GECO variants targeted to the E. coli periplasm using the pTorPE expression plasmid should be in the bright fluorescent state in cells suspended in Ca2+-free buffer. Sorting of E. coli expressing a library of variants on the basis of fluorescence brightness alone, should enrich for variants that are brighter in the Ca2+-free state. This increased brightness could be attributable to either improved protein folding efficiency, or an increase in the intrinsic brightness of the indicator, both of which are desirable traits. Of course, improvements in these desirable traits could come at the expense of indicator dynamic range. To overcome this problem, it is necessary to perform a secondary in vitro screen for Ca2+ response. Briefly, colonies were picked based on the colony brightness and grown in liquid culture. Proteins were extracted from overnight cultures and tested for Ca2+ response in microplate reader.Starting from Y-GECO0.5a and b, which was prepared from the initial two rounds of directed evolution for improved folding, we performed three rounds of parallel screening using both manual on-plate screening and the μFACS-aided approach (Fig. S2, ESI†). To enable unbiased comparison of the two screening methods, after each round we combined the pool of the most superior variants found from both methods. The combined gene pool served as a template to generate a new library that was constructed by mixing gene variants generated by error-prone PCR with gene variants generated by DNA shuffling. The resulting library was then screened using both the traditional method and the μFACS-aided approach in parallel.
Compared to the traditional manual on-plate screen, the μFACS-aided approach identified improved Y-GECO variants using substantially less effort (Fig. 2F), owing to the 100 times higher throughput of μFACS. In each of the first two rounds, the overall brightness and Ca2+ response of Y-GECO variants selected by the μFACS-aided approach were significantly higher than variants selected by the traditional on-plate screen. For round 3 it was apparent that beneficial mutations had become exceedingly rare within our library, presumably as the template had already acquired the most highly represented beneficial mutations. For this round, both screening methods produced effectively equivalent results, however, we had to pick 44 variants to find one superior variant using the traditional approach, while the μFACS enrichment approach required only 10 variants.
After completion of the third round of directed evolution using both on-plate screen and the μFACS-aided approach, each method led to identification of one best variant that showed seemingly satisfactory brightness and Ca2+ response. Fluorescence measurement of the purified proteins revealed that the variant identified in the third round of μFACS platform-aided directed evolution was superior, relative to the variant identified in the third round of traditional screening, in terms of brightness and Ca2+ response (Table S2, ESI†). This variant, designated as Y-GECO1, has 17 mutations distributed throughout the protein sequence relative to Y-GECO0.1 (Fig. S1 and Table S2, ESI†), significant improvement on folding and brightness, a large ratiometric change, and an affinity to Ca2+ within the physiologically relevant range (see following section).
These results demonstrate that a μFACS-aided screen is more efficient for identifying improved FP-based Ca2+ indicators than the manual on-plate method. However, we believe that the full potential of this approach has not yet been fully utilized. The efficacy of directed evolution of FP-based Ca2+ indicators could be significantly increased by high throughput screening for both Ca2+ response and brightness simultaneously using a μFACS system. To achieve this, at least two detection points on both ends of the 5 cm main channel are required to facilitate detection of fluorescence changes of periplasm-targeted mutants before and after binding to Ca2+. In this new detection scheme, further optimization of experiment parameters, such as flow rate, cell density, buffer composition and optics, will be critical for the performance of the μFACS. Related work is currently in progress.
In vitro characterization of Y-GECO1
Spectroscopic characterization of the purified proteins reveals that the Ca2+ binding of Y-GECO1 leads to 95% decrease in fluorescence emission when using 525 nm excitation. Notably, a new fluorescence excitation peak around 413 nm appears upon binding to Ca2+ and fluorescence intensity increases 10-fold when exciting at this wavelength. Thus, Y-GECO1 is a ratiometric Ca2+ indicator with a 200-fold peak-to-peak ratiometric change (Fig. 3A) in fluorescence excitation. In this way, Y-GECO1 is analogous to the previously reported ratiometric-pericam34 and GEX-GECO1,8 but has a much larger dynamic range of Ca2+ response. In contrast to most previously reported GECO variants,6–8 in which the pKa of chromophore shifts toward a lower value when bound to Ca2+, the pKa of Y-GECO1 chromophore shifts from 6.3 to 8.9 upon binding to Ca2+ and results in loss of overall fluorescence intensity (Fig. S4B, ESI†). In vitro titration with Ca2+ indicates the value of Kd′ for Y-GECO1 is 190 nM (Fig. S4A and Table S2, ESI†).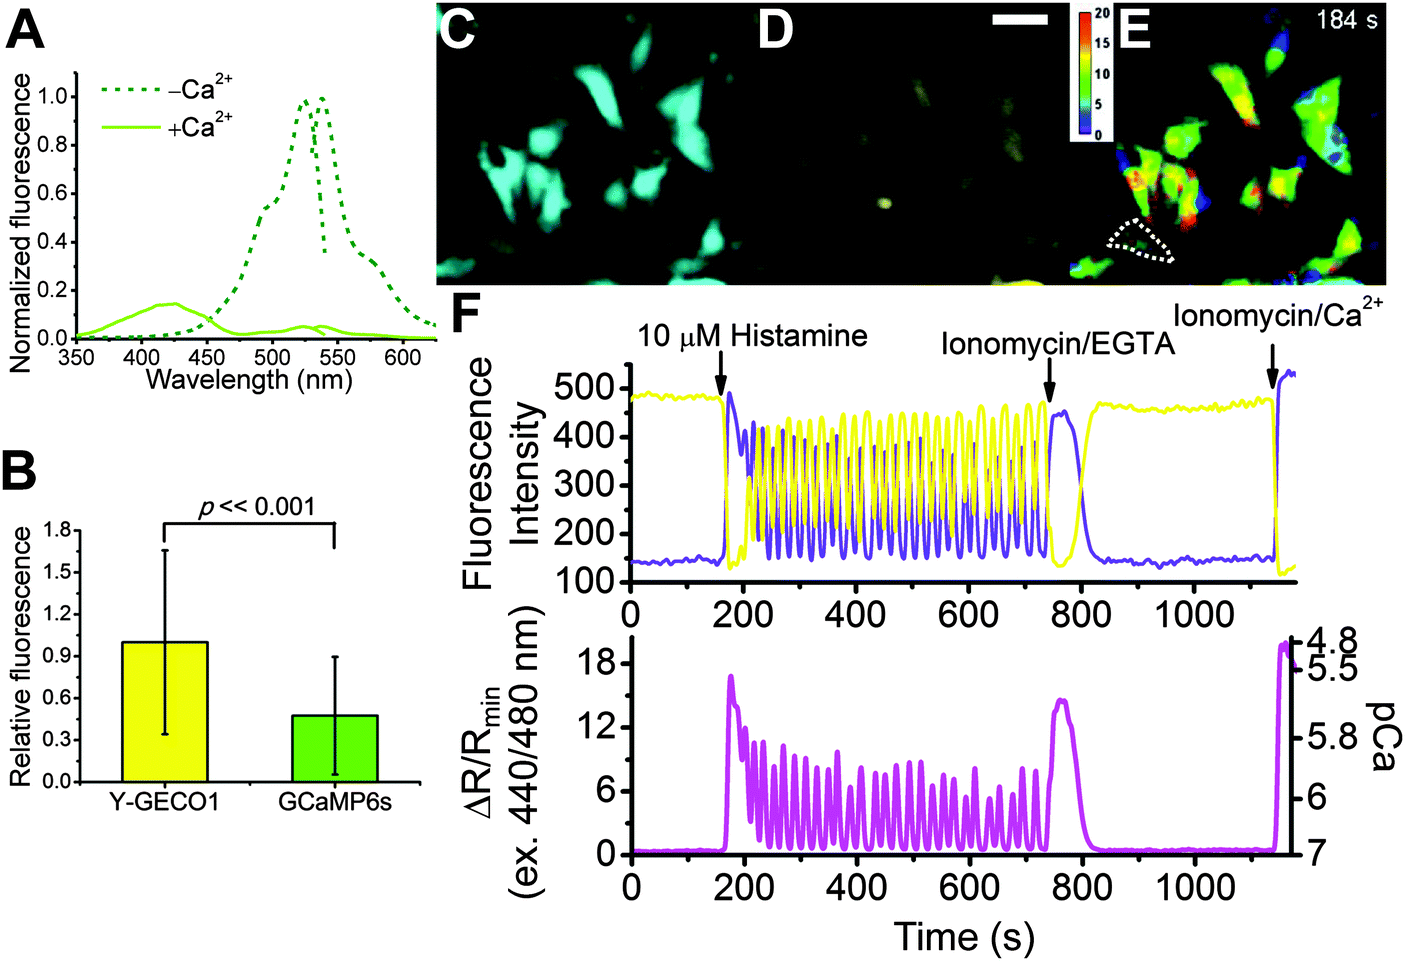 | ||
| Fig. 3 Characterization and application of Y-GECO1. (A) Excitation and emission spectra of Y-GECO1, recorded with emission at 560 nm and excitation at 510 nm, respectively. (B) Comparison of brightness in the resting [Ca2+]i of HeLa cells between Y-GECO1 (141 cells) and GCaMP6s (209 cells) using a common filter set for GFP. (C–E) Fluorescence images of HeLa cells expressing Y-GECO1 captured the moment of 10 μM histamine-induced intracellular Ca2+ rise. (C) Image acquired under 440 nm excitation. (D) Image acquired 480 nm excitation. Scale bar: 50 μm. (E) The ratiometric change ΔR/Rmin image (ratio R was calculated from dividing image C by image D; Rmin was the minimum ratio of 440 nm/480 nm after adding ionomycin/EGTA. ΔR/Rmin = R/Rmin − 1). (F) Typical [Ca2+]i transients and oscillations of a select cell (enclosed by a dotted line in E) induced by histamine stimulations. The sampling interval was 3 s. (F, upper) A typical cell trace acquired under 480 nm (yellow line) and 440 nm (violet line) excitations. (F, lower) Excitation ratios, 440 to 480 nm. The right-hand ordinate calibrates [Ca2+]i in pCa. | ||
Since mPapaya1 is superior to mPapaya0.4 in terms of brightness, photostability and maturation, we attempted to introduce some beneficial mutations of mPapaya1 relative to mPapaya0.426 into Y-GECO1, but none of them led to further improved variants (data not shown), which suggests Y-GECO1 and mPapaya1 evolved via different evolution paths. Interestingly, Y-GECO1 shares one mutation F223Y (F99Y by mPapaya numbering) with mPapaya1 (Fig. S1, ESI†), which is reported to dramatically improve the photostability of mPapaya0.6.26 According to the crystal structure of zFP538 (PDB ID: 2OGR),38 F223Y could enhance interaction with the internal α-helix of the FP and influence the chromophore environment, which may result in improved photostability. In the case of Y-GECO1, F223Y might also improve the brightness and Ca2+ response since it was the only new mutation found in the last round of screening (Fig. S1, ESI†).
Y-GECO1 is an excitation ratiometric Ca2+ indicator because, unlike Y-GECO0.1, the Ca2+ bound form exhibits long Stokes shift fluorescence due to its ability to efficiently undergo excited-state proton transfer (ESPT). That is, the protonated form of the fluorophore, which exhibits maximal absorbance at 413 nm and predominates in the presence of Ca2+, can become deprotonated in the excited state and emit fluorescence from the anionic form. ESPT has been observed in a number of other FPs and FP-based indicators including Aequorea victoria GFP,39 mKeima,40 ratiometric pericam,34 GEX-GECO1, and GEM-GECO1.8
We characterized the kinetics of the Ca2+ response by stopped-flow fluorescence spectroscopy. The koff rate of Y-GECO1 was around 1.40 s−1 at 20 °C, which was slightly slower than the fastest version of GCaMP6, known as GCaMP6f, which has a koff of 2.32 s−1 at 20 °C (Fig. S4E, ESI†). Although the kinetic response of Y-GECO1 should be sufficient for most of the applications, it has limited capability for resolving Ca2+ spikes and firing frequency variations in neurons4 and in some subcellular locations, such as the cytoplasm of dendrites and dendritic spines, where physiological Ca2+ can rise within milliseconds.41,42 Sun et al. have reported mutations that disrupt the CaM-RS20 interaction and increase the koff of GCaMP3.4 Preliminary results indicate that analogous mutations improve the koff of Y-GECO1. Specifically, Y-GECO1 ΔG13 (analogous to GCaMP3 ΔG47) has a koff = 9.75 s−1 at 20 °C (Fig. S4E, ESI†), but a 60% decrease in dynamic range (Table S2, ESI†). Efforts to further optimize this fast Y-GECO1 variant are ongoing.
Performance of Y-GECO1 in mammalian cell and tissue culture
To determine how Y-GECO1 performs in typical live cell imaging experiments, we recorded the response of Y-GECO1 to changes of the free cytoplasmic Ca2+ concentration ([Ca2+]i) in HeLa cells using established protocols.43 We used a CFP/YFP FRET filter set (438/24 nm excitation and 542/27 nm emission) for long Stokes shift yellow fluorescence and a FITC filter set (480/40 nm excitation and 535/50 emission) for observing short Stokes shift yellow fluorescence and GCaMP6s green fluorescence.5 While these filter combination are not perfectly matched to the fluorescence spectra of Y-GECO1, these sets are widely available and commonly used in cell imaging experiments. As expected, we observed opposing oscillations in the fluorescence intensities of both emission channels when cells were treated with 30 μM histamine (Fig. 3F). Using this filter combination, the maximum intensity change of Y-GECO1 in HeLa cells was determined to be 6 ± 1-fold and the maximum ratio change was 13 ± 3-fold (Table S3, ESI†). In comparison, the maximum intensity change of GCaMP6s was 20 ± 7-fold intensiometric change (Table S3, ESI†). The ratiometric nature of Y-GECO1 facilitates quantitative measurement of Ca2+ concentration (Fig. 3F) relative to intensiometric indicators such as GCaMP6 and R-GECO1.8 Although the FITC filter set did not match well with the excitation and emission of Y-GECO1, Y-GECO1 in resting state was about 220% as bright as GCaMP6s (Fig. 3B). Presumably, the performance and brightness of Y-GECO1 could be further improved using a custom filter set with 425/40 nm and 500/40 nm excitation filters, and a 560/50 nm emission filter.Y-GECO1 is capable of detecting Ca2+ transients in dissociated hippocampus neurons in wide-field fluorescence imaging with performance comparable to the current popular FP-based Ca2+ indicators GCaMP6s and R-GECO1. As shown in Fig. 4 (see also Movie S1, ESI†), Y-GECO1 successfully detected spontaneous cytosolic Ca2+ ([Ca2+]i) oscillations in both soma and processes with large ratio change and excellent SNR. Y-GECO1 was able to reveal different [Ca2+]i waveforms in the soma and processes (Fig. 4A and B). In order to estimate the maximum signal change in neurons, KCl was added to a final concentration 50 mM to depolarize neurons and induce a large Ca2+ influx via voltage-activated Ca2+ channels.44–46 Using the filter set described above, the maximum change of Y-GECO1 was 8 ± 2-fold in ratio and 2.6 ± 0.5-fold in intensity of the FITC channel. In comparison, the maximum change of intensiometric indicator GCaMP6s was 8 ± 5-fold and R-GECO1 was 3 ± 1 fold (Fig. S5, ESI†). While the intensity change is smaller for Y-GECO1 than GCaMP6s, the ability to give ratiometric sensing is a major advantage.
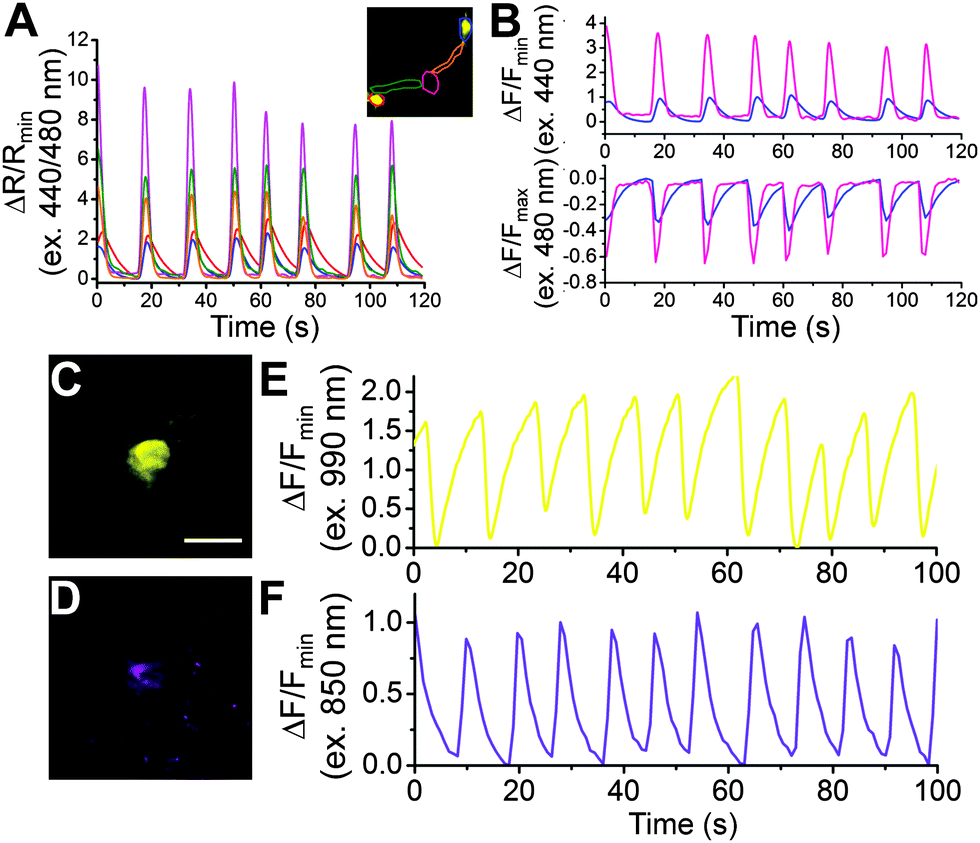 | ||
| Fig. 4 Wide-field and two photon imaging of Y-GECO1 in dissociated rat hippocampal neurons. (A and B) Results of wide-field imaging. (A) The time course changes in the ratio of 440 nm excitation to 480 nm excitation channel indicate spontaneous [Ca2+]i oscillation. The inset shows the fluorescent image of two neurons expressing Y-GECO1 under 480 nm excitation. The color of the ratiometric signals correspond to the region highlighted by the same color in the inset. (B) Imaging of spontaneous [Ca2+]i oscillation in the selected region of interest in the violet and blue excitation channels. (C–F) Two-photon imaging of dissociated hippocampus neuron expressing Y-GECO1 (C) under 990 nm excitation and (D) 850 nm excitation. Scale bar: 30 μm. (E and F) Typical fluorescence traces recording spontaneous [Ca2+]i oscillation (E) under 990 nm excitation and (F) 850 nm excitation. Note that C plus E and D plus F were not acquired in the same time. | ||
To determine if Y-GECO1 is suitable for use with multiphoton excitation, we imaged neurons expressing Y-GECO1 using a 2-photon excitation laser-scanning confocal microscope. Rhythmic decreases in fluorescence could be easily observed using 990 nm 2-photon excitation with 35 mW output power (Fig. 4C and D), owing to the bright baseline fluorescence. The long Stokes shift fluorescence of Y-GECO1 could be detected using 850 nm 2-photon excitation (35 mW output power), however, it was much dimmer than the 990 nm excitation and the autofluorescence level was higher (Fig. 4E and F). Accordingly, excitation around 990 nm is preferred. Y-GECO1 is potentially an excellent inverted intensiometric Ca2+ indicator for two-photon imaging in vivo, and the bright baseline fluorescence of Y-GECO1 facilitates easier identification of transfected cells compared to intensiometric Ca2+ indicators which are dim in the resting state, assuming similar expression levels.
We tested the performance of Y-GECO1 in hippocampal neurons in organotypic brain slices at room temperature (20 °C) using confocal microscopy. The Y-GECO1 plasmids with Synapsin I or CMV promoters were delivered by ex vivo electroporation and expressed transiently in neural cells (Fig. 5A, C and D). The bright baseline fluorescence of Y-GECO1 facilitated identification of transfected neurons. We applied theophylline to excite the organotypic brain slices. Low millimolar doses of theophylline can evoke sustained rhythmic seizure-like activities in different neural networks including motor neurons and hippocampal neurons.47–50 Indeed, Y-GECO1 successfully detected evoked [Ca2+]i transients and oscillations with large signal magnitude (Fig. 5B and Movie S2, ESI†) as evidence of seizure-like discharge. Compared to cytoplasmic targeted Y-GECO1, processes could be satisfactorily visualized without saturation of the somata by tethering Y-GECO1 to the plasma membrane with the N-terminal peptide sequence of the Src kinase Lyn6 (Fig. 5C and D). Lyn-Y-GECO1 expressed in glial cells was able to detect Ca2+ waves in various subcellular locations and process terminals (Fig. 5C). Although the FP body of Y-GECO1 belongs to Anthozoa-derived FPs, which are known to often form intracellular puncta in neurons,51 no bright intracellular puncta were found in neuronal cells expressing either cytoplasmic Y-GECO1 or membrane tethered Lyn-Y-GECO1. Our results suggest that Y-GECO1 can be a useful tool to study Ca2+ dynamic of neural cells in vivo with large signal magnitude.
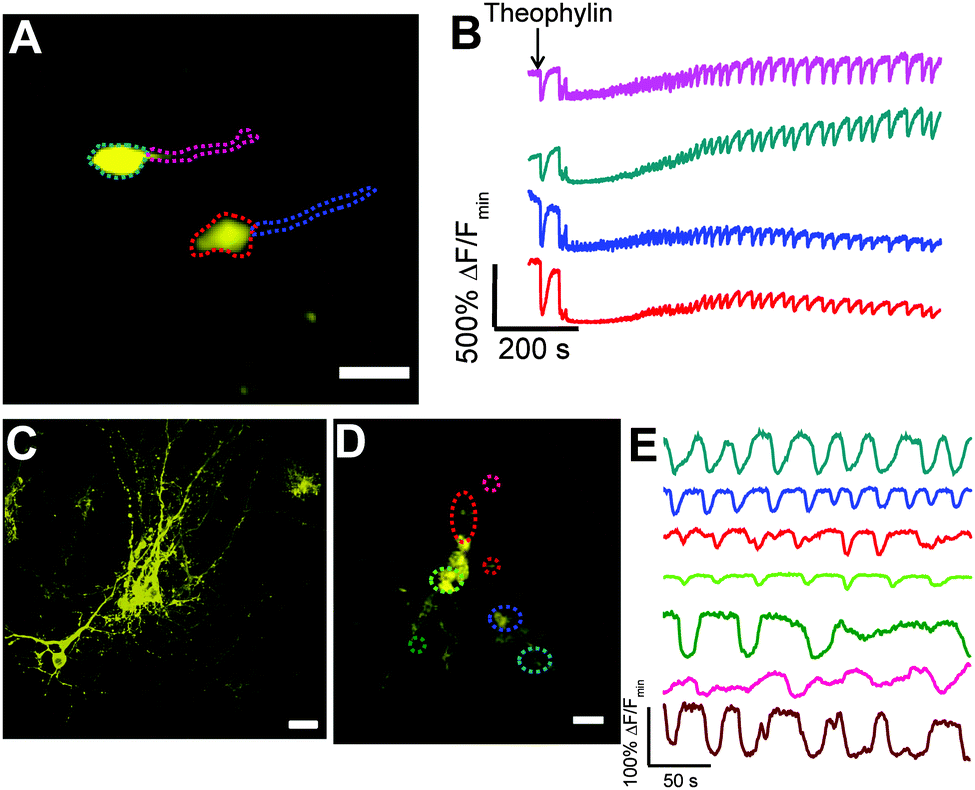 | ||
| Fig. 5 Confocal imaging of Y-GECO1 in organotypic slices. (A) Confocal imaging of neurons expressing Y-GECO1 in a hippocampal slice cultured for 5–6 days. Scale bar: 40 μm. (B) 10 mM theophylline-induced [Ca2+]i transient and oscillation in neurons was detected by Y-GECO1. The traces correspond to the regions in the image marked with the same color in (A). (C and D) Membrane targeted Lyn-Y-GECO1 in hippocampal slices. (C) 2D projection of a 3D image of neurons expressing Lyn-Y-GECO1 in a slice. Scale bar: 30 μm. (D) Glial cells expressing Lyn-Y-GECO1 with regions of interest indicated by colored dot circles. Three small circles indicate three different process terminals. Scale bar: 30 μm. (E) Imaging of theophylline-induced [Ca2+]i oscillation in glial cells expressing Lyn-Y-GECO1. The traces correspond to the regions of interest with the same color in (D). | ||
In many cases, Y-GECO1 may be used as an intensiometric Ca2+ indicator with inverted fluorescence response to Ca2+ ("turn-off" indicator), as the dim fluorescence of the 410 nm excitation would not be useful if the background fluorescence was high. From a SNR perspective, intensiometric "turn-on" Ca2+ indicators with increased fluorescence response to Ca2+ would be superior for detecting Ca2+ oscillations compared to "turn-off" indicators with similar ΔF, mainly because the dim baseline fluorescence of "turn-on" indicators has less shot noise. However, in tissue samples, the dim baseline fluorescence of "turn-on" indicators may be buried by the high background fluorescence, whereas cells expressing "turn-off" indicators are more visible due to the bright baseline fluorescence. Furthermore, because most cells are in the resting state most of the time, the overall SNR of imaging of "turn-off" indicators would generally be better than "turn-on" indicators. In addition, Y-GECO could be combined with a different color of turn-on sensor that has similar Kd for ratiometric Ca2+ imaging with significantly enhanced sensitivity.
Conclusions
We present a simple, low cost and disposable μFACS system with an integrated piezoelectric actuator for directed evolution of FP and FP-based indicators with throughput up to 300 cells per s. We developed a directed evolution approach that exploited μFACS for library enrichment, and ultimately led to improved variants of the single FP-based Ca2+ indicators Y-GECO. Three rounds of directed evolution of Y-GECO were done using both traditional and μFACS-aided approaches in parallel. Comparing the outcomes of these parallel experiments revealed that the use of μFACS improved screening results and saved considerable effort relative to the on-plate manual screening of colonies. Y-GECO1, the final product of directed evolution, possesses a novel yellow color that fills the 50 nm spectral gap between green fluorescent GCaMP and orange fluorescent O-GECO1 in the palette of genetically encoded Ca2+ indicators, and opens new opportunities for multicolor Ca2+ imaging. Y-GECO1 exhibits a large Ca2+ response and a moderate affinity to Ca2+in vitro. We demonstrated that Y-GECO1 is a useful Ca2+ probe for Ca2+ imaging in vitro and ex vivo. Specifically, Y-GECO1 enables robust detection of Ca2+ oscillations in histamine-stimulated HeLa cells, spontaneous activity in untreated neuronal cell culture, and drug-evoked Ca2+ transients in functionally intact brain slices. Y-GECO1 is useful for both one-photon and two-photon imaging and, relative to typical direct response Ca2+ indicators, has a brighter baseline fluorescence that facilitates identification of transfected cells at resting Ca2+ concentrations.Experimental
Reagents
Please see Supplemental experimental procedures for the detail of sources of reagents (ESI†).Microfluidic device fabrication
The design of the microfluidic cell sorter was based on the work of Chen et al.22 Briefly, the device was fabricated using the conventional microreplica molding technique52 in which device features were photolithographically defined by SU-8 photoresist mold and then transferred to a PDMS substrate (Sylgard 184, Dow Corning). The actuation chamber of the PDMS substrate was created by manual cutting using a surgery knife, and the inlets and outlets were created using 2 mm punch. For device assembly, the PDMS substrate and glass were surface treated using a plasma generator (Electro-Technic Products Inc.). The PDMS substrate and the glass surface were placed into physical contact and the device was incubated at 65 °C for 20 min to allow the surfaces to bond. The stainless steel surface of the piezoelectric actuator (APC international) was aligned to the PDMS actuation chamber and put in contact with the PDMS substrate and sealed with commercially available syringe epoxy steel adhesive (Gorilla Glue). Finally, Teflon tubing was inserted into the inlets and outlets of the device for fluid flow introduction.Construction of Y-GECO gene libraries
The design of Y-GECO is based on well-established designs described by our group and others.8,33–35,53 Please see Supplemental experimental procedures for the detail of construction of Y-GECO gene libraries (ESI†).Screening of GECO gene libraries
The library screening of genetically encoded Ca2+ indicators using traditional colony-based manual screening method has been previously described in detail.8 For μFACS-aided screening, the screening protocol was modified accordingly. Briefly, a library of Y-GECO was used to transform competent E. coli and the transformed cells were plated on agar plates with roughly 30–100 times higher number of cells. It is critical that the freshly transformed cells should not be grown in liquid culture directly as many mutants that do not express protein will be enriched in culture due to faster growth times. This resulted in a high density of colonies (∼105 cells per plate) on the agar plate after overnight incubation at 37 °C. Cells were then collected by washing the colonies with M9 buffer supplemented with 100 μg mL−1 ampicillin, 0.1% glycerol, 0.002% L-arabinose and 1 mM EGTA. The cell density was measured by BD Accuri C6 flow cytometer (BD bioscience) and adjusted to 1–2 × 10⁷ cells per mL accordingly.The cell suspension was loaded into μFACS system via the middle input channel using a syringe pump (Harvard Apparatus). The sample flow was confined by the sheath flows (consist of the same M9 buffer) on both sides. The Y-GECO mutants that were flowing through the laser illumination point were excited by 488 nm argon ion laser beam, and the fluorescent emission was collected by a homemade confocal epifluorescence microscope using a 25× objective (numerical aperture (NA): 0.35, Leitz Wetzlar). A customized LabVIEW program was design for signal processing and chip control. PMT signals were acquired in sampling frequency 100 kHz. The noise level was calculated based on the variation of baseline PMT signals sampled in every 0.5 ms. The SNR of the fluorescence signal of variants was calculated in real time. The piezoelectric actuation would be triggered when the SNR signal of Y-GECO variants was larger than a pre-defined threshold that was determined based on statistical analysis of cell fluorescence signals in the samples prior to cell sorting. The sorted bright variants were collected via collection channels and grown on agar-plate overnight at 37 °C, picked in the next day and cultured in liquid LB medium at 37 °C overnight.
Proteins extracted from the overnight liquid cultures of the picked clones by either the traditional method or the μFACS-aided screening method was subjected to an additional screening in a Safire2 fluorescence microplate reader (Tecan). Briefly, cells were harvested by centrifugation at 13000g for 2 min at 4 °C. Y-GECO variants along with other cytoplasmic proteins were extracted by suspension of cells using surfactant B-PER (Pierce) followed by centrifugation to pellet unwanted cell debris. The performance of each selected variant was evaluated in a fluorescence microplate reader. Their brightness and Ca2+-dependent response was compared to the best variant from the previous round. Finally, the brightest functional variants were used as the library template for the next round of directed evolution.
Protein purification and in vitro spectroscopy
Please see Supplemental experimental procedures for the detail of protein purification and in vitro spectroscopy characterizations of Y-GECO (ESI†).Construction of mammalian expression plasmids
In this work, three types of mammalian expression plasmids were used. Please see Supplemental experimental procedures for the detail of construction of mammalian expression plasmids (ESI†).HeLa cell culture imaging
Please see Supplemental experimental procedures for the detail of preparation of HeLa cell culture (ESI†).Wide-field imaging was done on a wide-field epifluorescence inverted microscope (Eclipse Ti-E, Nikon) equipped with a Photometrics QuantEM 512SC camera. The NIS-Elements Advanced Research (Nikon) was used for automated microscope and camera control. For determination of dynamic ranges in live cells, cells were imaged with a 20× air objective lens (NA 0.8). All imaging was performed at room temperature. For excitation of GCaMP6 and one channel of Y-GECO, the samples were illuminated with light from a 100 W mercury arc lamp that was passed through a 480/40 nm bandpass filter. The long pass dichroic mirror was 505 nm. The emission filter was 535/40 nm. For recording the long Stoke shift fluorescence of Y-GECO, 438/24 nm excitation filter, 458 long pass dichroic and 542/27 nm emission filter were used. 25% neutral density filter was used to decrease the strength of illumination for both indicators.
For imaging of histamine-induced Ca2+ dynamics, cells were imaged acquired with appropriate exposure every 4 s. Approximately 30 s after the start of the experiment, 100 μM histamine was added to reach a final concentration of 10 μM. Approximately 10 min after addition of histamine, 10 mM EGTA, 40 μM ionomycin in Ca2+- and Mg2+-free HHBSS was added to the dish to reach a final concentration 1 mM EGTA, 4 μM ionomycin. At the end of the experiment, 20 mM CaCl2, 40 μM ionomycin in HHBSS was added to reach a final concentration 2 mM CaCl2, 4 μM ionomycin.
Imaging of rat hippocampal neuron culture
Please see Supplemental experimental procedures for the detail of preparation of rat hippocampal neuron culture (ESI†).The system setup for wide-field imaging was similar to that for HeLa experiment except of the following. A 60× oil objective lens (CFI Plan Apo NA: 1.4), or a 40× air objective lens (CFI Plan Apo NA: 0.9) was used for neuron imaging. For GCaMP6, 25% neutral density filter was used. For Y-GECO1, 12.5% neutral density filter was used. The exposure time for both indicators was 10 ms. For excitation of R-GECO1, the excitation filter was 545/30 nm, the long pass dichroic was 565 nm and the emission was collected through 620/60 nm filter. Neurons were imaged in the culture medium at room temperature 20 °C.
For confocal imaging, fluorescence signals were measured using a confocal microscope and software (20× XLUMPlanF1, NA: 1.00, water immersion objective; Olympus FV1000; Olympus Canada, Richmond Hill, Ontario, Canada). Similarly, Olympus FV1000 connected to a MaiTai DeepSee Ti:sapphire laser with a tunable excitation range from 710–990 nm (Spectra Physics, Santa Clara, CA, USA) was used for two-photon imaging. With reduced resolution and 2–4 μs per pixel scanning rate, the image acquisition was adjusted to be 1–3 frames per s to effectively detect Ca2+ oscillation of neurons expressing Y-GECO1.
Preparation and transfection of rat hippocampal organotypic brain slices
All procedures for brain slice experiments were carried out in compliance with the guidelines of the Canadian Council for Animal Care and with the approval of the University of Alberta Animal Care and Use Committee for Health Sciences.Brains were dissected from 0-day-old (P0) Sprague Dawley rat in ice-cold HBSS containing 1.3 mM CaCl2 and 1 mM MgSO4. Horizontal 250 μm thick brain slices were generated using a vibrating microtome (Leica VT1000S, Leica Microsystems) as described previously54 and were placed on a sterile 0.4 μm pore membrane cell culture insert (Millipore PICMORG50). The insert and slice were then placed in a Petri dish containing 1.5 mL of NbActiv4 (BrainBits) supplemented with 5% fetal bovine serum (FBS) and penicillin-G potassium salt (50 units per mL), and streptomycin sulfate (50 μg mL−1). Slices were cultured at 37 °C and 5% CO2 for 24 h prior to transfection by electroporation. The insert and slice were then placed directly above a platinum plate Petri dish electrode (CUY700-P2E, Nepa Gene), and the gap between the electrode and the membrane was filled with electroporation buffer (EB) (HBSS + 1.5 mM MgCl2 + 10 mM glucose). Plasmids (pcDNA3.1, Life Technologies) for expression of the gene of interest were dissolved in EB at a concentration of 1 μg μL−1 and sufficient volume was added to just cover the slice. A square platinum electrode (CUY700-P2L, Nepa Gene) was then placed directly above the hippocampus slice and a power supply was used to apply five 20 V pulses (5 ms each, 1 Hz). The direction of electrical field was reversed and a second set of five pulses with the same settings was applied. The EB buffer was carefully removed from the slices and they were then put back and incubated at 37 °C and 5% CO2.
Confocal imaging of theophylline-induced Ca2+ elevations in rat organotypic hippocampal slices
A modified version of protocol for Ca2+ imaging in brain slices54,55 has been used in this work. Immediately prior to imaging, the slices were perfused with superfusate containing (in mM): 120 NaCl, 3 KCl, 1 CaCl2, 2 MgSO4, 26 NaHCO3, 1.25 NaH2PO4 and 10 D-glucose (pH adjusted to 7.4 by gassing with 95% O2, 5% CO2), at 5 mL min−1 using a peristaltic pump (Watson-Marlow Alitea-AB) and kept at room temperature. Imaging was started within 10 min following activation of the perfusion system. Fluorescence signals were measured using a confocal microscope and software (20× XLUMPlanF1, NA: 1.00, water immersion objective; Olympus FV1000; Olympus). The cells were excited with 488 nm laser (Olympus) and emission was collected from 500–600 nm using a variable barrier filter.Images were acquired at 2–3× digital zoom at a reduced frame resolution (256 × 256) and with 4 μs per pixel scanning rate, this allowed image acquisition to be 1–2 frames per s to effectively detect cytosolic Ca2+ oscillations of neurons and glial cells expressing Y-GECO1. For imaging of theophylline-induced Ca2+ dynamics, images were acquired every 0.5 s. Theophylline (10 mM, Sigma Aldrich, Canada) was dissolved in superfusate and bath applied via peristaltic pump approximately 30 s after the start of the acquisition. The drug was washed approximately 10 min later by switching back to control superfusate.
Accession numbers
The GenBank accession numbers for Y-GECO1 and Y-GECO1 ΔG13 are KJ193859 and KJ193860.Acknowledgements
Technical support and assistance was provided by the University of Alberta Nanofab, the Molecular Biology Service Unit, Hiofan Hoi, Christopher W. Cairo and Andy Holt. Plasmid pJMK004 was a generous gift from Adam E. Cohen. This work was supported by Natural Sciences and Engineering Research Council of Canada (Discovery grants to R.E.C. and D.J.H. and a Vanier scholarship to A.S.A.), Canadian Institutes of Health Research (R.E.C.), Micro-Nano Technologies financial assistance for microfabrication, the University of Alberta (fellowship to Y.Z.), Canada Foundation of Innovation/Alberta Advanced Education & Technology and Alberta Innovates (K.B.), Alberta Innovates Health Solutions (Scientist award to K.B. and scholarships to Y.Z. and A.S.A.). R.E.C. holds a Tier II Canada Research Chair. The University of Alberta has filed a provisional U.S. patent application on Y-GECO1.References
- M. J. Berridge, M. D. Bootman and H. L. Roderick, Calcium signalling: dynamics, homeostasis and remodelling, Nat. Rev. Mol. Cell Biol., 2003, 4, 517–529 CrossRef CAS PubMed.
- M. J. Berridge, P. Lipp and M. D. Bootman, The versatility and universality of calcium signalling, Nat. Rev. Mol. Cell Biol., 2000, 1, 11–21 CrossRef CAS PubMed.
- M. I. Kotlikoff, Genetically encoded Ca2+ indicators: using genetics and molecular design to understand complex physiology, J. Physiol., 2007, 578, 55–67 CrossRef CAS PubMed.
- X. R. Sun, A. Badura, D. A. Pacheco, L. A. Lynch, E. R. Schneider, M. P. Taylor, I. B. Hogue, L. W. Enquist, M. Murthy and S. S. H. Wang, Fast GCaMPs for improved tracking of neuronal activity, Nat. Commun., 2013, 4, 2170 Search PubMed.
- T.-W. Chen, T. J. Wardill, Y. Sun, S. R. Pulver, S. L. Renninger, A. Baohan, E. R. Schreiter, R. A. Kerr, M. B. Orger, V. Jayaraman, L. L. Looger, K. Svoboda and D. S. Kim, Ultrasensitive fluorescent proteins for imaging neuronal activity, Nature, 2013, 499, 295–300 CrossRef CAS PubMed.
- J. Wu, L. Liu, T. Matsuda, Y. Zhao, A. Rebane, M. Drobizhev, Y.-F. Chang, S. Araki, Y. Arai, K. March, T. E. Hughes, K. Sagou, T. Miyata, T. Nagai, W.-h. Li and R. E. Campbell, Improved Orange and Red Ca2+ Indicators and Photophysical Considerations for Optogenetic Applications, ACS Chem. Neurosci., 2013, 4, 963–972 CrossRef CAS PubMed.
- H. Hoi, T. Matsuda, T. Nagai and R. E. Campbell, Highlightable Ca2+ Indicators for Live Cell Imaging, J. Am. Chem. Soc., 2012, 135, 46–49 CrossRef PubMed.
- Y. Zhao, S. Araki, J. Wu, T. Teramoto, Y.-F. Chang, M. Nakano, A. S. Abdelfattah, M. Fujiwara, T. Ishihara, T. Nagai and R. E. Campbell, An Expanded Palette of Genetically Encoded Ca2+ Indicators, Science, 2011, 333, 1888–1891 CrossRef CAS PubMed.
- J. Akerboom, T.-W. Chen, T. J. Wardill, L. Tian, J. S. Marvin, S. Mutlu, N. C. Calderón, F. Esposti, B. G. Borghuis, X. R. Sun, A. Gordus, M. B. Orger, R. Portugues, F. Engert, J. J. Macklin, A. Filosa, A. Aggarwal, R. A. Kerr, R. Takagi, S. Kracun, E. Shigetomi, B. S. Khakh, H. Baier, L. Lagnado, S. S.-H. Wang, C. I. Bargmann, B. E. Kimmel, V. Jayaraman, K. Svoboda, D. S. Kim, E. R. Schreiter and L. L. Looger, Optimization of a GCaMP Calcium Indicator for Neural Activity Imaging, J. Neurosci., 2012, 32, 13819–13840 CrossRef CAS PubMed.
- L. Tian, S. A. Hires, T. Mao, D. Huber, M. E. Chiappe, S. H. Chalasani, L. Petreanu, J. Akerboom, S. A. McKinney, E. R. Schreiter, C. I. Bargmann, V. Jayaraman, K. Svoboda and L. L. Looger, Imaging neural activity in worms, flies and mice with improved GCaMP calcium indicators, Nat. Methods, 2009, 6, 875–881 CrossRef CAS PubMed.
- K. Horikawa, Y. Yamada, T. Matsuda, K. Kobayashi, M. Hashimoto, T. Matsu-ura, A. Miyawaki, T. Michikawa, K. Mikoshiba and T. Nagai, Spontaneous network activity visualized by ultrasensitive Ca2+ indicators, yellow Cameleon-Nano, Nat. Methods, 2010, 7, 729–732 CrossRef CAS PubMed.
- B. P. Cormack, R. H. Valdivia and S. Falkow, FACS-optimized mutants of the green fluorescent protein (GFP), Gene, 1996, 173, 33–38 CrossRef CAS.
- A. W. Nguyen and P. S. Daugherty, Evolutionary optimization of fluorescent proteins for intracellular FRET, Nat. Biotechnol., 2005, 23, 355–360 CrossRef CAS PubMed.
- K. Churski, T. S. Kaminski, S. Jakiela, W. Kamysz, W. Baranska-Rybak, D. B. Weibel and P. Garstecki, Rapid screening of antibiotic toxicity in an automated microdroplet system, Lab Chip, 2012, 12, 1629–1637 RSC.
- J. Clausell-Tormos, D. Lieber, J.-C. Baret, A. El-Harrak, O. J. Miller, L. Frenz, J. Blouwolff, K. J. Humphry, S. Köster, H. Duan, C. Holtze, D. A. Weitz, A. D. Griffiths and C. A. Merten, Droplet-Based Microfluidic Platforms for the Encapsulation and Screening of Mammalian Cells and Multicellular Organisms, Chem. Biol., 2008, 15, 427–437 CrossRef CAS PubMed.
- M. F. Haroon, C. T. Skennerton, J. A. Steen, N. Lachner, P. Hugenholtz and G. W. Tyson, in Methods Enzymol., ed. F. D. Edward, Academic Press, 2013, vol. 531, pp. 3–19 Search PubMed.
- B. Kintses, C. Hein, M. F. Mohamed, M. Fischlechner, F. Courtois, C. Lainé and F. Hollfelder, Picoliter Cell Lysate Assays in Microfluidic Droplet Compartments for Directed Enzyme Evolution, Chem. Biol., 2012, 19, 1001–1009 CrossRef CAS PubMed.
- L. Mazutis, J. Gilbert, W. L. Ung, D. A. Weitz, A. D. Griffiths and J. A. Heyman, Single-cell analysis and sorting using droplet-based microfluidics, Nat. Protoc., 2013, 8, 870–891 CrossRef CAS PubMed.
- P. S. Dittrich and P. Schwille, An Integrated Microfluidic System for Reaction, High-Sensitivity Detection, and Sorting of Fluorescent Cells and Particles, Anal. Chem., 2003, 75, 5767–5774 CrossRef CAS PubMed.
- A. Y. Fu, C. Spence, A. Scherer, F. H. Arnold and S. R. Quake, A microfabricated fluorescence-activated cell sorter, Nat. Biotechnol., 1999, 17, 1109–1111 CrossRef CAS PubMed.
- L. M. Davis, J. L. Lubbeck, K. M. Dean, A. E. Palmer and R. Jimenez, Microfluidic cell sorter for use in developing red fluorescent proteins with improved photostability, Lab Chip, 2013, 13, 2320–2327 RSC.
- C. Chen, S. H. Cho, F. Tsai, A. Erten and Y.-H. Lo, Microfluidic cell sorter with integrated piezoelectric actuator, Biomed. Microdevices, 2009, 11, 1223–1231 CrossRef CAS PubMed.
- J. J. Agresti, E. Antipov, A. R. Abate, K. Ahn, A. C. Rowat, J.-C. Baret, M. Marquez, A. M. Klibanov, A. D. Griffiths and D. A. Weitz, Ultrahigh-throughput screening in drop-based microfluidics for directed evolution, Proc. Natl. Acad. Sci. U. S. A., 2010, 107, 4004–4009 CrossRef CAS PubMed.
- B. M. Paegel and G. F. Joyce, Microfluidic compartmentalized directed evolution, Chem. Biol., 2010, 17, 717–724 CrossRef CAS PubMed.
- C. H. Chen, S. H. Cho, H.-I. Chiang, F. Tsai, K. Zhang and Y.-H. Lo, Specific Sorting of Single Bacterial Cells with Microfabricated Fluorescence-Activated Cell Sorting and Tyramide Signal Amplification Fluorescence in Situ Hybridization, Anal. Chem., 2011, 83, 7269–7275 CrossRef CAS PubMed.
- H. Hoi, E. S. Howe, Y. Ding, W. Zhang, M. A. Baird, B. R. Sell, J. R. Allen, M. W. Davidson and R. E. Campbell, An Engineered Monomeric Zoanthus sp. Yellow Fluorescent Protein, Chem. Biol., 2013, 20, 1296–1304 CrossRef CAS PubMed.
- L.-M. Fu, R.-J. Yang, C.-H. Lin, Y.-J. Pan and G.-B. Lee, Electrokinetically driven micro flow cytometers with integrated fiber optics for on-line cell/particle detection, Anal. Chim. Acta, 2004, 507, 163–169 CrossRef CAS PubMed.
- B. H. Lapizco-Encinas, B. A. Simmons, E. B. Cummings and Y. Fintschenko, Insulator-based dielectrophoresis for the selective concentration and separation of live bacteria in water, Electrophoresis, 2004, 25, 1695–1704 CrossRef CAS PubMed.
- T. Braschler, N. Demierre, E. Nascimento, T. Silva, A. G. Oliva and P. Renaud, Continuous separation of cells by balanced dielectrophoretic forces at multiple frequencies, Lab Chip, 2008, 8, 280–286 RSC.
- X. Hu, P. H. Bessette, J. Qian, C. D. Meinhart, P. S. Daugherty and H. T. Soh, Marker-specific sorting of rare cells using dielectrophoresis, Proc. Natl. Acad. Sci. U. S. A., 2005, 102, 15757–15761 CrossRef CAS PubMed.
- K. Jan, S. Kirat, O. N. Alan, J. Carl, M. Alan and O. B. Peter, Development of a microfluidic device for fluorescence activated cell sorting, J. Micromech. Microeng., 2002, 12, 486 CrossRef.
- A. Wolff, I. R. Perch-Nielsen, U. D. Larsen, P. Friis, G. Goranovic, C. R. Poulsen, J. P. Kutter and P. Telleman, Integrating advanced functionality in a microfabricated high-throughput fluorescent-activated cell sorter, Lab Chip, 2003, 3, 22–27 RSC.
- J. Nakai, M. Ohkura and K. Imoto, A high signal-to-noise Ca2+ probe composed of a single green fluorescent protein, Nat. Biotechnol., 2001, 19, 137–141 CrossRef CAS PubMed.
- T. Nagai, A. Sawano, E. S. Park and A. Miyawaki, Circularly permuted green fluorescent proteins engineered to sense Ca2+, Proc. Natl. Acad. Sci. U. S. A., 2001, 98, 3197–3202 CrossRef CAS PubMed.
- J. Akerboom, N. Carreras Calderón, L. Tian, S. Wabnig, M. Prigge, J. Tolö, A. Gordus, M. B. Orger, K. E. Severi, J. J. Macklin, R. Patel, S. R. Pulver, T. J. Wardill, E. Fischer, C. Schüler, T.-W. Chen, K. S. Sarkisyan, J. S. Marvin, C. I. Bargmann, D. S. Kim, S. Kügler, L. Lagnado, P. Hegemann, A. Gottschalk, E. R. Schreiter and L. L. Looger, Genetically encoded calcium indicators for multi-color neural activity imaging and combination with optogenetics, Front. Mol. Neurosci., 2013, 6, 2 CAS.
- S. H. Cho, C. H. Chen, F. S. Tsai, J. M. Godin and Y.-H. Lo, Human mammalian cell sorting using a highly integrated micro-fabricated fluorescence-activated cell sorter (mFACS), Lab Chip, 2010, 10, 1567–1573 RSC.
- J. L. Lubbeck, K. M. Dean, H. Ma, A. E. Palmer and R. Jimenez, Microfluidic flow cytometer for quantifying photobleaching of fluorescent proteins in cells, Anal. Chem., 2012, 84, 3929–3937 CrossRef CAS PubMed.
- S. J. Remington, R. M. Wachter, D. K. Yarbrough, B. Branchaud, D. C. Anderson, K. Kallio and K. A. Lukyanov, zFP538, a Yellow-Fluorescent Protein from Zoanthus, Contains a Novel Three-Ring Chromophore, Biochemistry, 2004, 44, 202–212 CrossRef PubMed.
- M. Chattoraj, B. A. King, G. U. Bublitz and S. G. Boxer, Ultra-fast excited state dynamics in green fluorescent protein: multiple states and proton transfer, Proc. Natl. Acad. Sci. U. S. A., 1996, 93, 8362–8367 CrossRef CAS.
- T. Kogure, H. Kawano, Y. Abe and A. Miyawaki, Fluorescence imaging using a fluorescent protein with a large Stokes shift, Methods, 2008, 45, 223–226 CrossRef CAS PubMed.
- M. J. Higley and B. L. Sabatini, Calcium Signaling in Dendrites and Spines: Practical and Functional Considerations, Neuron, 2008, 59, 902–913 CrossRef CAS PubMed.
- R. Yuste and W. Denk, Dendritic spines as basic functional units of neuronal integration, Nature, 1995, 375, 682–684 CrossRef CAS PubMed.
- A. E. Palmer and R. Y. Tsien, Measuring calcium signaling using genetically targetable fluorescent indicators, Nat. Protoc., 2006, 1, 1057–1065 CrossRef CAS PubMed.
- O. Garaschuk, R.-I. Milos, C. Grienberger, N. Marandi, H. Adelsberger and A. Konnerth, Optical monitoring of brain function in vivo: from neurons to networks, Pfluegers Arch., 2006, 453, 385–396 CrossRef CAS PubMed.
- C. Grienberger and A. Konnerth, Imaging Calcium in Neurons, Neuron, 2012, 73, 862–885 CrossRef CAS PubMed.
- D. Smetters, A. Majewska and R. Yuste, Detecting Action Potentials in Neuronal Populations with Calcium Imaging, Methods, 1999, 18, 215–221 CrossRef CAS PubMed.
- J. M. Brundege and T. V. Dunwiddie, Modulation of excitatory synaptic transmission by adenosine released from single hippocampal pyramidal neurons, J. Neurosci., 1996, 16, 5603–5612 CAS.
- B. Panaitescu, J. Kuribayashi, A. Ruangkittisakul, V. Leung, M. Iizuka and K. Ballanyi, Methylxanthines do not affect rhythmogenic preBötC inspiratory network activity but impair bursting of preBötC-driven motoneurons, Neuroscience, 2013, 255, 158–176 CrossRef CAS PubMed.
- A. Klishin, T. Tsintsadze, N. Lozovaya and O. Krishtal, Latent N-methyl-D-aspartate receptors in the recurrent excitatory pathway between hippocampal CA1 pyramidal neurons: Ca2+-dependent activation by blocking A1 adenosine receptors, Proc. Natl. Acad. Sci. U. S. A., 1995, 92, 12431–12435 CrossRef CAS.
- S. Thümmler and T. V. Dunwiddie, Adenosine Receptor Antagonists Induce Persistent Bursting in the Rat Hippocampal CA3 Region Via an NMDA Receptor-Dependent Mechanism, J. Neurophysiol., 2000, 83, 1787–1795 Search PubMed.
- D. Cai, K. B. Cohen, T. Luo, J. W. Lichtman and J. R. Sanes, Improved tools for the Brainbow toolbox, Nat. Methods, 2013, 10, 540–547 CrossRef CAS PubMed.
- Y. Xia and G. M. Whitesides, Soft lithography, Annu. Rev. Mater. Sci., 1998, 28, 153–184 CrossRef CAS.
- H. J. Carlson and R. E. Campbell, Circular permutated red fluorescent proteins and calcium ion indicators based on mCherry, Protein Eng., Des. Sel., 2013, 26, 763–772 CrossRef CAS PubMed.
- C. Kantor, B. Panaitescu, J. Kuribayashi, A. Ruangkittisakul, I. Jovanovic, V. Leung, T.-F. Lee, D. MacTavish, J. H. Jhamandas, P.-Y. Cheung and K. Ballanyi, in Isolated Central Nervous System Circuits, ed. K. Ballanyi, Humana Press, 2012, pp. 315–356 Search PubMed.
- A. Ruangkittisakul, S. W. Schwarzacher, L. Secchia, B. Y. Poon, Y. Ma, G. D. Funk and K. Ballanyi, High sensitivity to neuromodulator-activated signaling pathways at physiological [K+] of confocally imaged respiratory center neurons in on-line-calibrated newborn rat brainstem slices, J. Neurosci., 2006, 26, 11870–11880 CrossRef CAS PubMed.
Footnote |
| † Electronic supplementary information (ESI) available. See DOI: 10.1039/c4ib00039k |
| This journal is © The Royal Society of Chemistry 2014 |