 Open Access Article
 This Open Access Article is licensed under a
 Creative Commons Attribution 3.0 Unported Licence
Chemically induced synaptic activity between mixed primary hippocampal co-cultures in a microfluidic system†
Graham
Robertson
a,
Trevor J.
Bushell
*b and
Michele
Zagnoni
*c
aDepartment of Biomedical Engineering, University of Strathclyde, Glasgow, G4 0NW, UK
bStrathclyde Institute of Pharmacy and Biomedical Sciences, University of Strathclyde, Glasgow, G4 0RE, UK. E-mail: trevor.bushell@strath.ac.uk
cCentre for Microsystems and Photonics, Electronic and Electrical Engineering, University of Strathclyde, Glasgow, G1 1XW, UK. E-mail: michele.zagnoni@strath.ac.uk
First published on 28th April 2014
Abstract
Primary neuronal cultures are an invaluable in vitro tool for examining the fundamental physiological changes that occur in diseases of the central nervous system. In this work, we have used a microfluidic device to grow twin cultures of primary hippocampal neuronal/glia cells which are synaptically connected but environmentally isolated. Immunocytochemical staining, for β-III-Tubulin and synaptophysin, indicated that the two neuronal populations were physically connected and that synapses were present. By dispensing predefined volumes of fluids into the device inlets, one culture was chemically stimulated and the consequent increase in neuronal activity in the opposing culture was monitored using calcium imaging. To optimise the experimental procedures, we validated a numerical model that estimates the concentration distribution of substances under dynamic fluidic conditions, proposing that no cross contamination of chemical stimuli occurred during the experiments. Calcium imaging and local chemical stimulation were used to confirm synaptic connectivity between the cultures. Chemical stimulation of one population, using KCl or glutamate, resulted in a significant increase of calcium events in both neurons and astrocytes of the connected population. The integration of the system and techniques described here presents a novel methodology for probing the functional synaptic connectivity between mixed primary hippocampal co-cultures, creating an in vitro testing platform for the high-throughput investigation of synaptic activity modulation either by novel compounds or in in vitro disease models.
Insight, innovation, integrationWe have developed an in vitro system for monitoring the functional connectivity of primary hippocampal co-culture networks by integrating microfluidics with calcium imaging techniques. The microfluidic structure is essential for patterning the cell growth and regulating the local application of chemical stimuli, while calcium imaging allows the simultaneous recording of cellular activity from both networks in a high-throughput format. This novel approach enables the consequence of manipulating neuronal activity to be monitored in environmentally isolated, but synaptically connected, neuronal networks. This system has the potential to provide insights for modelling and understanding altered synaptic communication and astrocytic behaviour that are associated with central nervous system disorders. |
Introduction
Brain disorders are top of the World Health Organisation's agenda because of their impact and prevalence; many will occur more frequently as life expectancy continues to grow. Indeed, recent reports have highlighted the economic burden of mental and neurological disorders in Europe with an estimated annual cost of €798 billion.1,2 Within the UK alone, approximately 45 million cases of brain disorders were highlighted in a 2010 survey as a cost of €134 billion.3 Strikingly, this cost is likely to increase due to long term impact of these disorders especially with the ageing population.2,3 Understanding the central nervous system (CNS) is one of the ‘grand challenges’ of our age4 and there is a growing need to develop and adopt innovative technologies to increase our understanding of CNS disorders.5 A significant contribution to this has been provided by advances in high-throughput genomics which has identified a number of pathways that may be linked to CNS disorders.5 However, how many of these genes affect neuronal activity and synaptic communication is still largely unknown. To this end, in vitro techniques are an invaluable tool for investigating cellular changes and dysfunctions associated with CNS disorders.Mixed primary cultures, including both neurons and astrocytes, have proven to be a useful method associated with neurobiological research.6,7 However, it is difficult to gain control over the parameters that influence the cellular microenvironment and neuronal connectivity. Indeed, creation of patterned neuronal networks that are environmentally isolated or the localised transfection of cell populations is difficult to achieve using conventional cell culture techniques. As a consequence, it is often impossible to separate and simplify the mechanisms underlying cellular activity, obtaining only average responses observed on global cell populations. A viable solution to these problems lies in the use of microfluidic procedures which enable greater control of cell patterning, manipulation and regulation of extracellular environments whilst retaining the ability to interface the system with conventional microscopy.
Excellent examples of how neuronal cell cultures can be grown, manipulated and studied in microfluidic devices has been provided in the last 10 years.8–13 Microfluidic systems and procedures, that were originally developed to compartmentalise neurons to study their axons in isolation and their response to injury,9 have led to a range of analytical applications addressing neuron/glia co-cultures, cortical/thalamic neuronal co-cultures and neuron–neuron cultures, as well as studying synapse formation.10,13,14 These systems allow for increasingly complex but “ordered” models of the CNS to be created in vitro, facilitating the application of localised chemical stimuli, increasing the throughput of monitored responses and reducing the amount of drugs required per experiment, a factor particularly important for screening novel or expensive compounds. This makes microfluidic systems a versatile, low-cost and useful tool to screen new drugs and/or examine the genetic changes associated with CNS conditions.
Typically, methods of analysing neuronal activity in primary cultures include the use of microelectrode arrays (MEAs) and patch clamping. On one side, MEAs provide extracellular recordings that do not interfere with the growth of cells and can cover a large area of patterned neurons within a microfluidic environment.15 However, each electrode in the array (due to its size and position) is not guaranteed to always interface with a cell. This often results in poor signal quality, with a proportion of the array providing no useful information. On the other side, patch clamping is the gold standard in electrophysiology, enabling the acquisition of high quality signals and the ability to record individual action potentials from single cells, including those cultured in microfluidic devices.16 However, the process of patching a cell and obtaining high quality recordings is often slow and impractical for high-throughput assays. Therefore, several advantages, such as parallel throughput and ease of use, can be obtained from using optical techniques to analyse functional responses of neuronal networks.
In this work, we present a method of integrating multi-neuron calcium imaging with an in vitro microfluidic system for the analysis of synaptic communication between two interconnected populations of mixed primary hippocampal co-cultures. Each culture containing both neurons and astrocytes can be monitored simultaneously via calcium imaging. A computational model was validated to characterise the system's fluidic properties and to optimise experimental procedures, ensuring that no cross-contamination of substances occurred between co-cultures. Sub-networks of synaptically connected neurons were formed via microchannels, as demonstrated using immunocytochemistry to visualise neurite growth and synapse formation with co-culture communication measured using calcium imaging.
Overall, we have demonstrated that our system is capable of monitoring the connectivity of neuronal cell populations and causality between mixed primary hippocampal co-cultures due to chemical stimulation. This work shows the potential of combining calcium imaging with microfluidic technologies to provide low-cost solutions for screening processes related to identifying the functional role of novel genes associated with CNS disorders in addition to screening programmes for novel compounds.
Materials and methods
Device preparation
Microfluidic devices were fabricated in polydimethylsiloxane (PDMS) using standard soft lithography techniques. Silicon masters were produced using two layers of SU8 photoresist (3000 series, MicroChem, US) onto a silicon wafer following the manufacturer's protocol. The first layer (SU8 3010) formed the microchannels connecting the two chambers (Fig. 1), achieving a final resist thickness of 7 μm. The second layer (SU8 3035) formed the side chambers achieving a final resist thickness of 90 μm. The resist was exposed through a photomask (JD Photo-Tools, UK) to UV light and was developed in MicroPosit EC solvent (Rohm and Haas, US). To prevent PDMS adhesion to the resulting silicon master, the silicon surface was silanised by vapour deposition of 1H,1H,2H,2H-perfluorooctyl-trichlorosilane (Sigma Aldrich, UK) for 1 hour. PDMS was then poured onto the silicon master at a 10![[thin space (1/6-em)]](https://www.rsc.org/images/entities/char_2009.gif) :1 ratio of base to curing agent, degassed in a vacuum desiccator chamber and cured at 80 °C for 3 hours. The PDMS devices were then peeled from the mould, cut to the desired size, and holes were punched (8 mm diameter) to obtain the inlet and outlet wells for each chamber. PDMS devices were then cleaned and irreversibly bonded to glass microscope slides or coverslips using oxygen plasma. Bonded devices were then flooded with a solution of poly-L-lysine (PLL, 10 μg ml−1) for 1 hour to coat the chambers and microchannels. Finally, devices were washed with DI water, UV sterilised and washed with Neurobasal-A medium prior to cell injection.
:1 ratio of base to curing agent, degassed in a vacuum desiccator chamber and cured at 80 °C for 3 hours. The PDMS devices were then peeled from the mould, cut to the desired size, and holes were punched (8 mm diameter) to obtain the inlet and outlet wells for each chamber. PDMS devices were then cleaned and irreversibly bonded to glass microscope slides or coverslips using oxygen plasma. Bonded devices were then flooded with a solution of poly-L-lysine (PLL, 10 μg ml−1) for 1 hour to coat the chambers and microchannels. Finally, devices were washed with DI water, UV sterilised and washed with Neurobasal-A medium prior to cell injection.
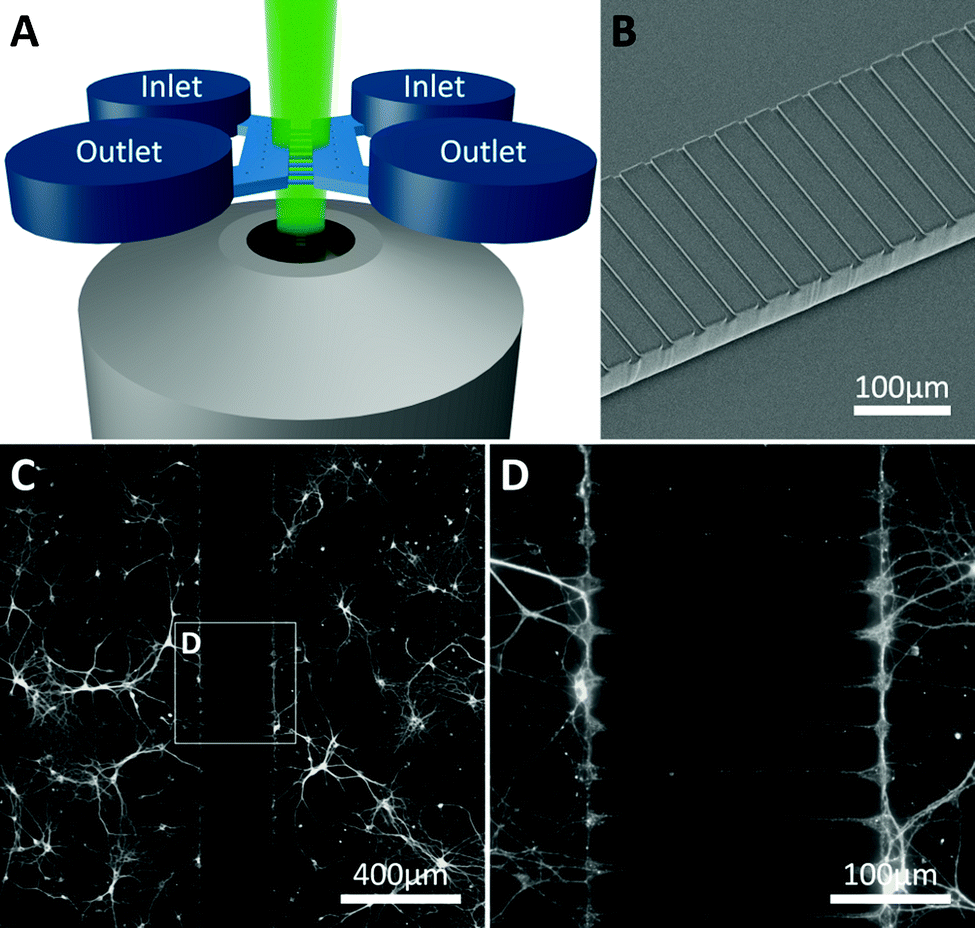 | ||
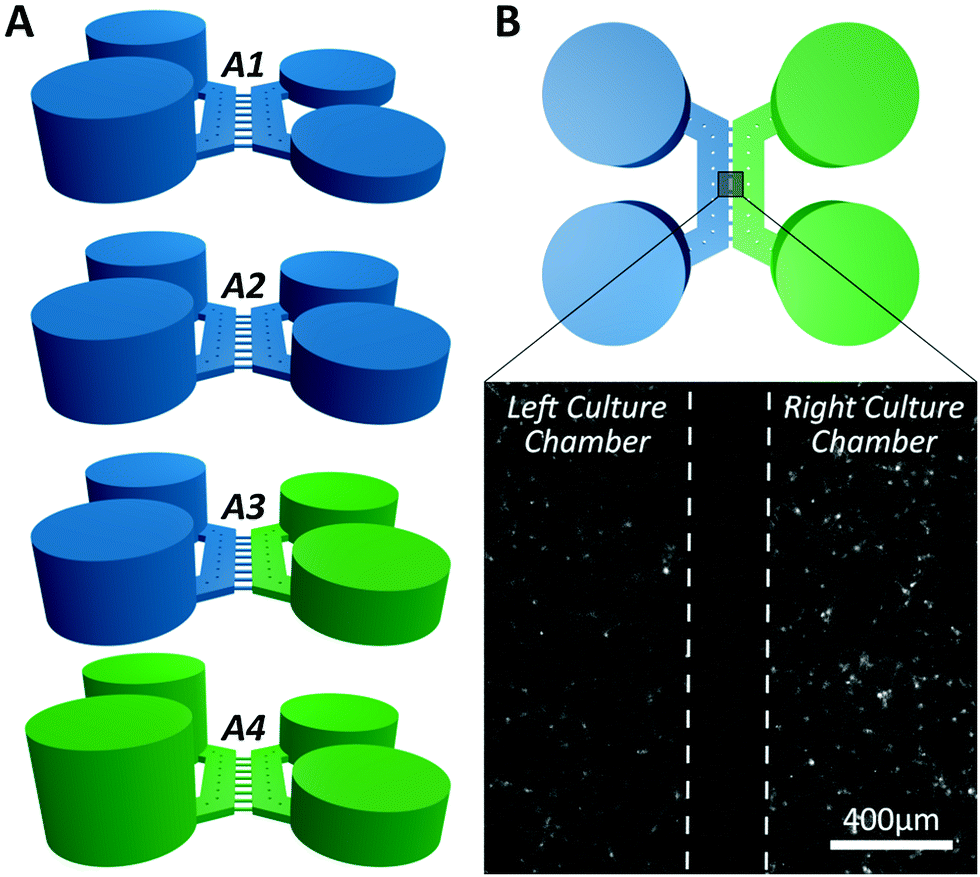
| Fig. 1 Device structure and fluorescent microscopy setup. (A) The device consists of two parallel chambers (8 mm long, 2 mm wide and 90 μm deep) which are fed by open inlet and outlet wells at each end of the chamber. The area between the two parallel chambers is bridged by an array of 200 microchannels (250 μm long, 10 μm wide and 7 μm deep) allowing both axons and dendrites to enter and form synapses with the opposing culture. (B) Scanning electron microscope image of the barrier of microchannels between the two chambers. (C, D) Two neuronal networks on either side of the barrier become connected via the microchannels (neurites stained with β-III-Tubulin). | ||
Primary hippocampal culture
Primary hippocampal cells were prepared as described previously.6,7 Briefly, Sprague Dawley rat pups (1–2 days old) were killed via cervical dislocation in accordance to UK Home Office guidelines and the hippocampus dissected out. This was chopped and incubated in papain solution (1.5 mg ml−1) before trituration in a solution containing bovine serum albumin (BSA, 10 mg ml−1). The solution was spun down and resuspended in culture medium containing Neurobasal-A supplemented with L-glutamine (2 mM) and B27 (2% v/v), at a density of 3.5 × 10⁶ cells per ml. Cells were loaded into the inlet well of each chamber and incubated for 1 hour before each well was filled with 200 μl of culture medium. Devices were kept in a humidified incubator at 37 °C/5% CO2 for up to 17 days prior to functional studies, with 100 μl of medium replaced from each well every 2–3 days.Immunocytochemistry
Immunocytochemical staining was carried out on cultures 3–17 days in vitro (DIV). Cultures within the devices were washed with phosphate buffered saline (PBS) and fixed in paraformaldehyde (4% w/v, 10 min) followed by ice cold 100% methanol (10 min). The cells were then washed in PBS and permeabilised with 0.01% Triton-X100 (10 min). Non-specific binding was prevented by incubation in a blocking solution containing foetal bovine serum (5% v/v) and BSA (1% w/v) for 1 hour.Primary antibodies for β-III-Tubulin (neuron specific cytoskeleton marker, 1:500 dilution), GFAP (astrocytic marker, 1:500 dilution), and synaptophysin (synaptic vesicle marker, 1:500 dilution) diluted in blocking solution were incubated with the cultures at 4 °C overnight. The cultures were then washed with PBS and incubated with fluorescently labelled secondary antibodies (Alexa 555 conjugated donkey anti-rabbit, Alexa 488 conjugated donkey anti-mouse, Alexa 488 conjugated goat anti-chicken) diluted in blocking solution (1:200) for 1 hour at room temperature. Epifluorescent images were taken on an inverted microscope (Axio Observer A1, Zeiss) with 5×, 10×, 20× and 50× objectives using a cooled EM-CCD camera (LucaR, Andor Technologies) and processed using Andor SOLIS for Imaging (version 4.19.30001.0) and GIMP (version 2.8). Synaptophysin images were taken with the device inverted on an upright microscope (BX51WI, Olympus) with 40× and 60× water immersion objectives, using a cooled CCD camera (QImaging) and processed using WinFluor imaging software (J. Dempster, University of Strathclyde) and ImageJ (version 1.47). These images were used to examine cell growth (β-III-Tubulin and MAP2 3-17 DIV) and subsequently to confirm synapse formation (synaptophysin, 12 DIV).
Modelling active and passive fluid transport
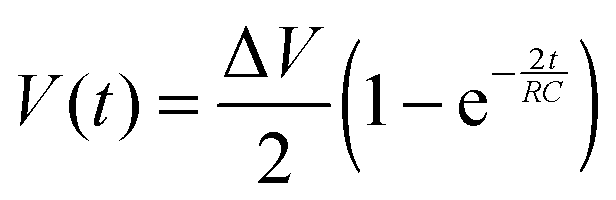
To reliably analyse cause-effect events between co-cultures within the device, the delivery of substances to cells must occur under precise spatial and temporal conditions, avoiding undesired cross-contamination effects between the co-cultures. Therefore, it is important that the active and passive transport of substances dissolved within fluids is predicted within a certain degree of accuracy. This will depend on the overall duration of the assay, the rate of change of fluid volume within the wells, the type of molecules suspended in solution and on the microchannel network geometry. Under static conditions (equal volumes in each well) only diffusion is responsible for chemical transport. When, instead, a hydrostatic pressure gradient is formed either between the chamber inlets/outlets or across the microchannels, a laminar flow will also be present. This will either facilitate or oppose the diffusive transport of substances depending on the gradient direction.In our experiments, the aim was to avoid cross-contamination of substances between the chambers to ensure that co-culture response was solely induced via synaptic communication across the microchannels. To model this process and ensure that chemical isolation of one chamber was maintained for the duration of the experiment, a dual approach was carried out. Firstly, a simplified analytical model describing the volumetric fluid transport across the four wells was developed based on the geometrical features of the microchannels and wells. As described elsewhere,17 this is analogous to an electrical circuit featuring the culture chambers and microchannels as a resistive network, RB and RC respectively, and each open well as a capacitor, C1–4 (Fig. 2). By setting the initial volumes in each well and therefore the hydrostatic pressures (electrical potentials) for a given channel network geometry, the volumetric flow rates (electrical currents) could be estimated in simplified conditions.
 | (1) |
 | (2) |
 | ||
| Fig. 2 Electrical circuit analogue of the device microfluidic network. (A) The fluidic system between the 4 open wells of the device was modelled as an electrical circuit comprising a resistive network connected to 4 capacitors.17 The height of the fluid in an open well determines the value of hydrostatic pressure (equivalent to an electrical potential). All open wells share the same geometry, therefore C1≡C2≡C3≡C4. Depending on the direction of the pressure gradient, the system can be simplified and modelled as a basic RC circuit, allowing the dynamic effects of volume changes between wells to be evaluated in a simplified manner. (B) When a volume difference is created between Well 2 and Well 3, the discharge effects due to the central microchannels can be ignored, as τC ≫ τB. (C) For the procedure adopted, once the liquid volume in Well 2 and Well 3 has been equilibrated, a flow between the two culture chambers is the only one present. (D) Plot of the temporal variation of differential volume between wells for the two configurations described in B and C, showing a few orders of magnitude difference in equilibration rates. | ||
To validate the models described with respect to the microfluidic procedures, experiments using fluorescein as a target molecule were performed by fluorescence microscopy and the results were compared to the simulations (Fig. 4B–D). Further simulations were also performed to estimate the concentration distribution of K+ ions and glutamate for the calcium imaging experiments.
Calcium imaging
Calcium (Ca2+) imaging was performed based on techniques described previously.6,18 After 10–14 DIV two hippocampal cultures within the system were loaded with the Ca2+-sensitive dye, Fluo-4 AM (5 μM, 60 min, room temperature) prior to imaging. Ca2+ transients on both sides were recorded using an inverted microscope (Axio Observer A1, Zeiss) with a cooled EM-CCD camera (LucaR, Andor Technologies) at a frame rate of 2.0 Hz and exposure time of 0.4 s using a 5× objective that gave a field of view of 2.68 mm2. Images were analysed and data processed using Andor SOLIS and Matlab R2011b.The external solution used in all Ca2+ imaging consisted of (in mM): NaCl 140, KCl 5, MgCl2 2, HEPES 10, D-glucose 10, CaCl2 2. A procedure was developed to test the functional communication between co-cultures in the left and right chambers (Fig. 3) by which a hydrostatic pressure gradient was created by filling the wells of the left culture with 150 μl of external solution and the wells of the right culture with 50 μl of external solution. Vehicle (external solution) and KCl (45 or 85 mM) or glutamate (200 μM) solutions were applied to the right culture by injecting 50 μl into the inlet of the right chamber, creating a flow over the culture until equilibrated by adding a further 50 μl of the same solution to the outlet. Injection of solutions was performed in situ, allowing a non-interrupted recording of the cellular Ca2+ responses to be taken.
 | ||
| Fig. 3 Experimental procedure for calcium imaging. (A) The wells and culture chambers were initially filled with 50 μl of external solution (blue) and subsequently selectively stimulated with KCl solution (green). (A1) A pressure difference across the microchannels was established between the two culture chambers by adding 100 μl of external solution to the wells that supply the left culture. (A2) After background recording, the right culture is stimulated by adding 50 μl vehicle to both wells for 300 s. (A3) 50 μl of external solution was removed from both wells of the right culture and 50 μl of KCl solution (final concentration 25 mM) was injected in both wells. (A4) Following indirect stimulation, the left culture is depolarised by adding 50 μl KCl solution to both wells (final concentration 25 mM) to identify neurons. (B) Example of the field of view image used to assess the activity of both cultures centred across the microchannel barrier monitoring direct and indirect effects of chemical stimulation (see Video S1 in ESI†). | ||
In all of the experiments, cells in the right culture were depolarised by adding 50 μl of KCl (45 mM) via the wells, which given the initial 5 mM KCl present in the external solution, results in a final concentration of 25 mM KCl, this is the indirect stimulation. Following a period of at least 4 minutes the cells of the left culture were depolarised by injecting 50 μl KCl (85 mM) to the open wells resulting in a final concentration of 25 mM KCl, this is the direct stimulation. In another set of experiments, 50 μl of L-glutamate (200 μM) was used instead of the first indirect KCl treatment, resulting in a final concentration of 100 μM glutamate.
From each recording, approximately 100 regions of interest (ROIs) (minimum area size of 50 pixels) were selected per chamber, where each ROI contained the soma of one cell. The average pixel intensity in each region was converted to time variant intensity signals representative of the Ca2+ activity. Signals were filtered (moving average filter, window size 11) and normalised (by dividing each data set by the first value: frame(n)/frame(0)) with responses and characterisation performed manually. A ‘significant response’ was defined as an increase in fluorescence greater than 0.5 normalised fluorescence units (NFU) of the preceding background intensity. Signals that did not exceed the background by 10% were discarded, as were signals that displayed either no significant response during the recordings (background, vehicle, indirect and direct stimulus) or experienced significant drift that could not be reliably attributed to an event. Multiple responses from the same ROI were included in the analysis providing that the previous response had sufficiently recovered or a significant secondary increase above the peak of the primary response occurred. Comparisons between frequencies of events were performed with a paired student's T-test to determine significance.
Materials
Cell culture medium, supplements, β-III-Tubulin, all secondary antibodies and Fluo4 AM were supplied by Life Technologies (UK). Other compounds (PLL, BSA, papain, FBS, MAP2, GFAP) were obtained from Sigma Aldrich (UK) and L-glutamic acid was obtained from Tocris Bioscience (UK). Synaptophysin antibodies were obtained from Millipore UK.Results
Numerical model validation
The fluid flow in the device was first estimated using a simplified analytical model (Fig. 2). Two configurations (flow paths) were considered: a pressure gradient between wells connecting a culture chamber (Fig. 2B) and a pressure gradient across the microchannels (Fig. 2C). The estimated time constants for the pressure to equilibrate were 189 s across each chamber (τB) and 39956 s across the microchannels (τC) respectively (Fig. 2D), implying that the same differential pressure along the chambers will discharge faster than when across the smaller microchannels. Given that τC is two orders of magnitude greater than τB, as a first order approximation, the two chambers can be considered fluidically isolated over short periods of time (from seconds to few minutes). However, to obtain a more accurate prediction of the fluid transport within the device, 3D numerical simulations were required to estimate how substance concentrations within the microchannels changed over time depending on the experimental conditions during application of chemical stimuli.
Simulations were performed mimicking the experimental conditions used for calcium imaging (Fig. 3), as detailed in the Material and methods section. Simulation results closely matched the outcomes from the control experiment (Fig. 4). The model was then used to simulate the experimental procedure when KCl and glutamate solutions were used, confirming that no chemical stimulus directly affected the opposite culture in the time frame of the assay (Fig. 4E and F).
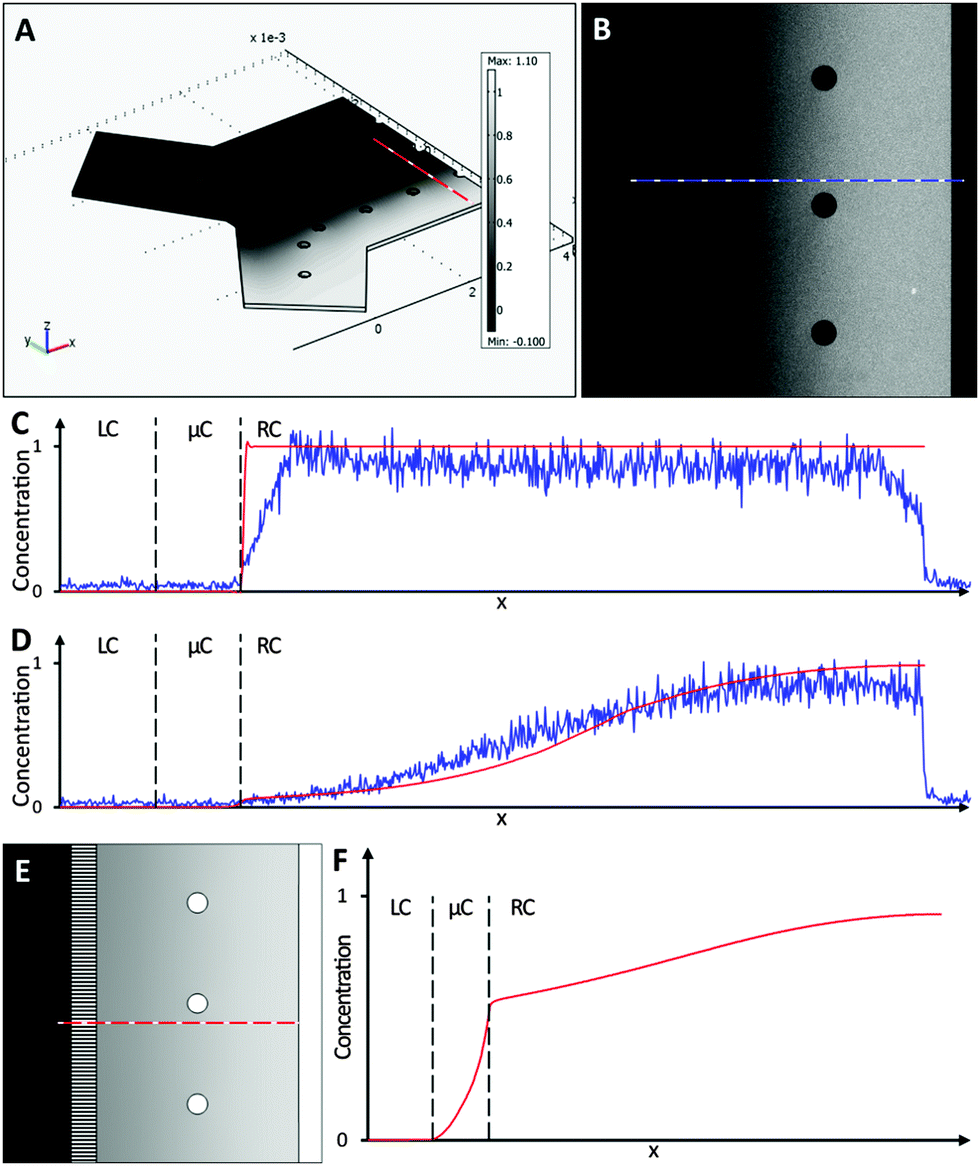 | ||
Fig. 4 A numerical model was used to simulate the diffusion of fluorescein molecules and K+ ions across the central microchannel barrier. (A) 3D view of the finite element model of the microfluidic system simulating the experimental procedure described in Fig. 3. (B) Microscope image showing fluorescein (30 μM) concentration within a chamber after 300 s, following the procedure described in Fig. 3. Neutral density filters were used to minimise bleaching of fluorescein. (C and D) Comparison between fluorescent intensity profiles from the simulation ( ) and the experiment ( ) and the experiment ( ) at 0 s and 300 s, respectively. Dashed lines indicate the boundaries between left chamber (LC), microchannels (μC) and right chamber (RC). (E and F) 2D view of simulation result and profile of K+ ion distribution within a chamber after 300 s, showing that no cross contamination should take place for the time frame of the assay. ) at 0 s and 300 s, respectively. Dashed lines indicate the boundaries between left chamber (LC), microchannels (μC) and right chamber (RC). (E and F) 2D view of simulation result and profile of K+ ion distribution within a chamber after 300 s, showing that no cross contamination should take place for the time frame of the assay. | ||
Neurite growth and synapse formation within the device
Primary hippocampal cultures (3–17 DIV) were stained to visualise neurite growth through the microchannels towards the opposing culture. Neurite growth was observed within a few days (3 DIV, Fig. 5A–C) using β-III-Tubulin and MAP2 staining, continuing until 17 DIV. Our staining indicates neurite growth throughout the microchannels but whether individual processes fully traverse the microchannel barrier cannot be elucidated from the current study. Interestingly, astrocytes, identified with GFAP (Fig. 5D), could be seen projecting into the microchannels along with the neurites. However, no astrocytic projections completely traversed the microfluidic barrier and the furthest projection observed extended up to 118 μm into the channel. In order to identify whether the neurites growing within the microchannels were forming synaptic connections, cultures were stained with the synaptic vesicle marker synaptophysin at 12 DIV,19 an age at which synaptic activity is present when investigated using standard patch clamp techniques.6,7 Punctate synaptophysin staining was clearly evident, indicating that synapse formation occurred both inside and outside the microchannels in these cultures (Fig. 5D and E).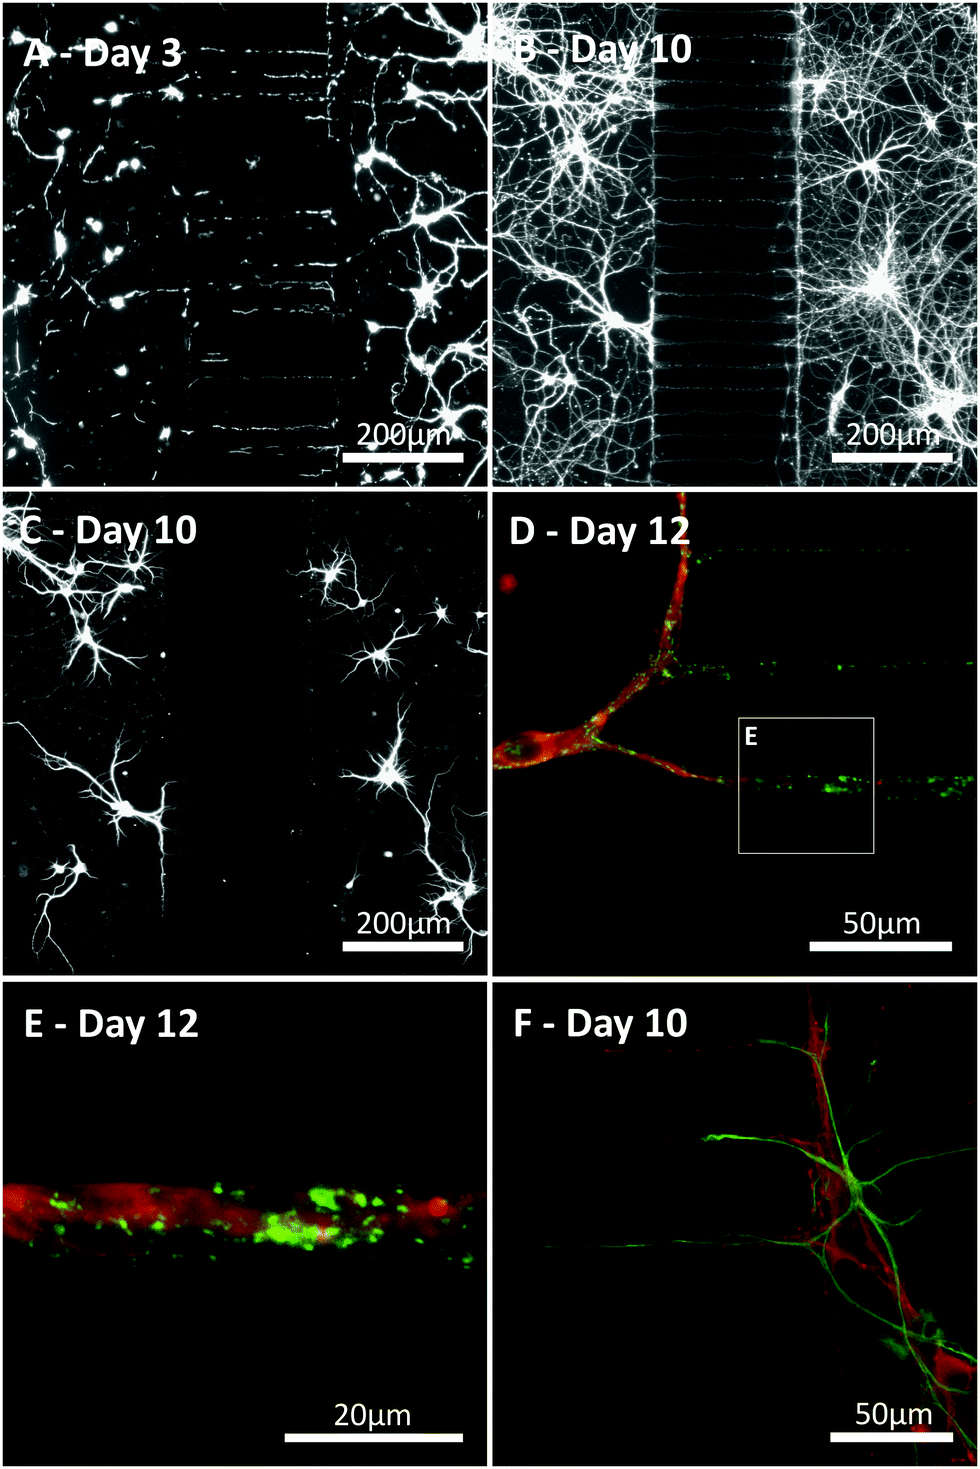 | ||
| Fig. 5 Neuronal and astrocytic processes project within the microchannels. (A, B) Representative images of cultures (3 and 10 DIV) revealing neurite growth across the microchannel barrier (β-III-Tubulin: neuron specific cytoskeleton marker). (C) As β-III-Tubulin staining extends across the microchannels, staining with the somatodendritic marker MAP2, confirms neurons extend both axonal and dendritic projections into the microchannels. (D, E) Representative images of a culture (12 DIV) showing punctuate synaptophysin staining, indicating synapse formation outside and inside the microchannels (green: β-III-Tubulin, red: synaptophysin, a synaptic vesicle marker). (F) Astrocytes are identified (green: GFAP) projecting into the microchannels along with neurites (red: β-III-Tubulin). | ||
Functional synaptic communication between neuronal networks
Having established that synapse formation occurred, we then used Ca2+ imaging to confirm that the synapses were functional and that synaptic communication occurred between the two co-cultures. An area comprising both chambers and the central microchannels was monitored over 5–10 minutes using 7 different devices (4 for KCl experiments and 3 for glutamate experiments). Signals were classed as neuronal or astrocytic, using established protocols used previously in our laboratory,6,18 depending on their response to direct KCl solution injection, with neurons showing a significant increase in fluorescence directly after KCl application (Fig. 6 and Fig. S1 in ESI†).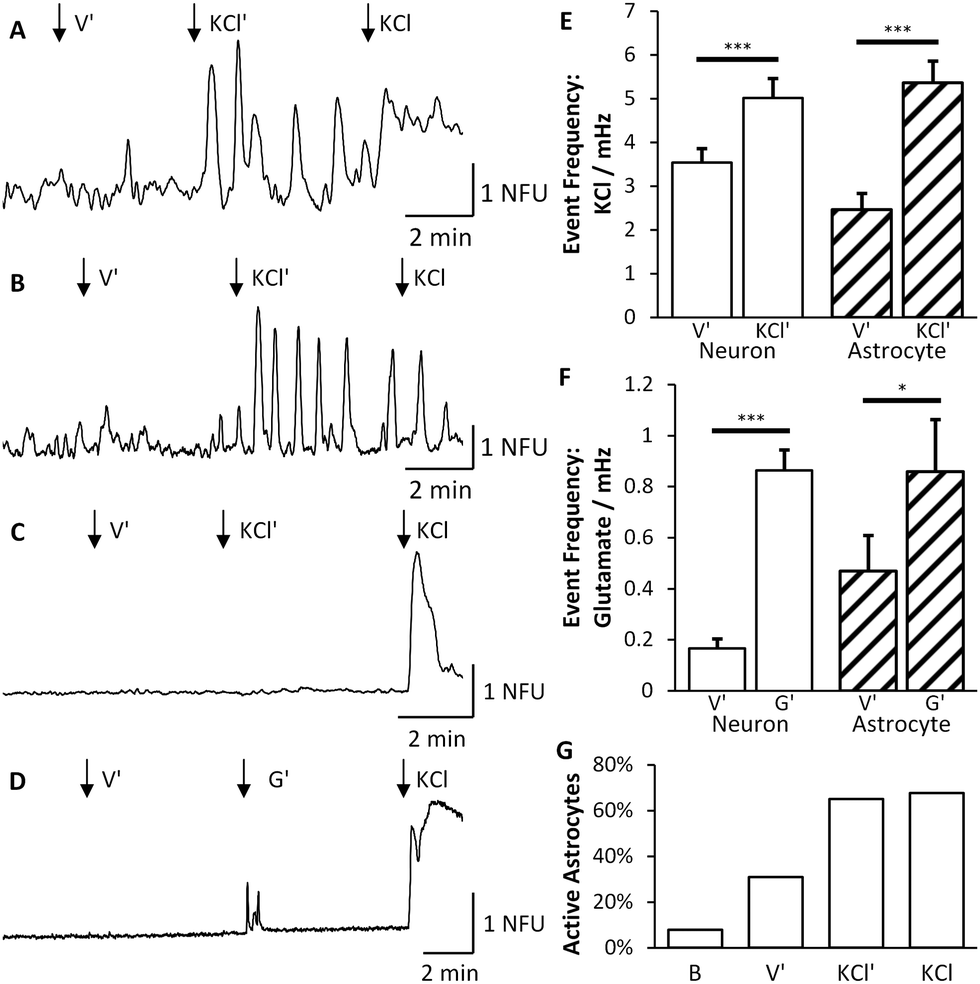 | ||
Fig. 6 KCl stimulation of the right culture (KCl′) elicits Ca2+ events in both neurons and astrocytes of the left culture. Arrows (↓) indicate time points for injection of vehicle (V′), indirect (KCl′) and direct (KCL) solutions. (A) Example trace from a single neuron, identified by its response to direct KCl stimulation, showing an increase in the number of calcium events following indirect stimulation. (B) Example trace from a single astrocyte, identified by no response to direct KCl stimulation, showing an increase in calcium events following indirect stimulation. (C) Trace revealing that not all neurons respond to indirect KCl stimulation. (D) Typical trace from a single neuron demonstrating that activity can be induced via indirect stimulation from glutamate (G′). (E) Calcium imaging analysis revealed that the event frequency of neurons (□) and astrocytes ( ) under indirect vehicle and indirect stimulation increased significantly. (F) Glutamate application also increased astrocytic and neuronal activity. (G) The total number of astrocytes that are active approximately doubles during indirect and direct applications of KCl. ) under indirect vehicle and indirect stimulation increased significantly. (F) Glutamate application also increased astrocytic and neuronal activity. (G) The total number of astrocytes that are active approximately doubles during indirect and direct applications of KCl. | ||
To determine whether synaptic communication occurred between the two fluidically isolated networks, Ca2+ events in the non-stimulated chamber were examined to assess the induced activity of these cells. Stimulation of neurons in the right culture significantly increased the number of neuronal calcium events in the left culture by 41% (n = 235, p < 0.001) from 3.54 × 10⁻³ ± 0.33 × 10⁻³ events per second to 5.01 × 10⁻³ ± 0.45 × 10⁻³ events per second (Fig. 6). These results further confirmed that the two chambers were fluidically isolated as a number of neurons remained silent during indirect KCl application but responded to the subsequent direct KCl application (Fig. 6C). Whilst an increase in the frequency of Ca2+ events was observed, there was no change in the average magnitude of the events observed in the absence or presence of indirect KCl stimulation (0.64 ± 0.068 NFU compared to 0.60 ± 0.059 NFU). Therefore, with no direct stimulus being applied to the cells, this increase in Ca2+ events must be driven by an increase in synaptic activity from the other cell population (see Video S1 in ESI†).
Interestingly, Ca2+ events were also evident in a number of cells that did not respond to direct KCl stimulation suggesting that these are glial cells, presumably astrocytes.6,18 These events significantly increased by 117%, from 2.47 × 10⁻³ ± 0.37 × 10⁻³ events per second to 5.36 × 10⁻³ ± 0.51 × 10⁻³ events per second (n = 152, p < 0.001, Fig. 6E). Only astrocytes that were significantly active were included in this analysis as all non-active ROIs were discarded. As the traces recorded for astrocytes varied substantially during each stage of the experiment, the number of astrocytes that were active during each stage was counted (Fig. 6G). 31% of the total astrocyte population were active during the indirect application of vehicle which doubled to 65% being active during indirect application of KCl and 68% during direct stimulation of KCl.
In order to provide a more physiologically relevant stimuli in the right culture, we used the major excitatory neurotransmitter within the CNS, namely glutamate. Application of glutamate (100 μM) on the right culture similarly produced an increased response in neuronal activity of the left culture (Fig. 6F). The indirect culture's response to vehicle was 1.68 × 10⁻⁴ ± 0.38 × 10⁻⁴ events per second which rose to 8.64 × 10⁻⁴ ± 0.8 × 10⁻⁴ events per second upon glutamate being applied to the right side. This is a significant increase of 415% (n = 286, p < 0.001) which is much greater than the KCl system due to the reduced activity prior to glutamate application. Astrocytes were again deduced from their lack of response to direct KCl stimulation and were found to increase in activity by 83%, from 4.70 × 10⁻⁴ ± 1.4 × 10⁻⁴ events per second to 8.6 × 10⁻⁴ ± 2.1 × 10⁻⁴ events per second (n = 57, p < 0.05).
Discussion
In this study, we have successfully demonstrated the use of a microfluidic system combined with calcium imaging for investigating how the activity of one primary hippocampal cultured network is modulated by the changes in activity in a second, environmentally isolated, network via functional synaptic connections.Modelling fluidic isolation
The validated numerical model shows that cross-contamination of substances across chambers does not occur in the timescales under which the experiments were carried out. The simulation results are also in agreement with previously described models.9,12,20 From our models, it is possible to predict the duration for which fluidic isolation is maintained and, furthermore, to estimate the optimum time for withdrawal and injection of solutions that is required to sustain a desired substance concentration condition within the device chambers. This information is particularly important for the future optimisation of co-culture transfection within the device, leading to localised genetic manipulation of a cell population, thus opening the way to studying proteins of interest and their effects on synaptic communication.However, one phenomenon that has not been taken into account in our model is the evaporation of aqueous solutions. Contrary to what happens in bulk systems used for conventional calcium imaging experiments, fluid evaporation due to the reduced volumes in microchannels and the water permeability through PDMS can potentially have significant effects in fluid volumes over long-term experiments. Nonetheless, since the on-chip experiments were limited to 20 minutes and carried out at room temperature, the effect of evaporation was not significant in this work.
Imaging neurite growth and synapse formation
To demonstrate synaptic communication between the chambers, it was first essential to confirm that both neurite growth and synapse formation were indeed present within the microchannels. Our data clearly indicates that neuronal processes were present and synapse formation occurred within the microchannels. Neurons grew processes which at an early stage, within 3 DIV, were already within the microchannels, as seen previously.8 The synaptic vesicle marker, synaptophysin, is commonly used to identify synapse formation11,19 which was clearly identified here to have occurred at 12 DIV (as expected from other studies of synaptic activity using standard electrophysiological techniques6,7). Punctate synaptophysin staining was present around the entrances/exits of the microchannels as well as within the microchannels themselves. This is a clear indication that the cultures form synapses. However, their functionality can only be confirmed by monitoring cellular activity using calcium imaging or electrophysiology.Calcium imaging and synaptic communication
Neuronal depolarisation is known to cause an increase in neuronal activity and this was evident in the present study by the increase in frequency of observed Ca2+ events monitored in the left chamber, following KCl application in the opposing right chamber. It was also shown that the excitatory neurotransmitter, glutamate, induced an increase in the frequency of Ca2+ events observed in the left chamber when applied to the right chamber.Calcium imaging is an established technique for monitoring neuronal activity6,18,21 and can be effectively used to increase the throughput of simultaneously acquired signals.22,23 Some studies have even shown that it is possible to detect single action potentials from captured Ca2+ signals.23 Similar calcium imaging techniques have previously been used within microfluidic devices to examine how a cell responds to locally applied chemical insults,14 as well as in cortico-striatal co-cultures to construct orientated synaptic networks.21 However, while these studies demonstrate the use of calcium imaging as a method for monitoring cell activity within microfluidic devices, the technique was not used in a dynamic assay to show how one stimulated culture can synaptically influence the activity of the connected culture.
Here, we have demonstrated that a chemically induced effect on neuronal activity, via the application of KCl or glutamate, can dynamically influence the neuronal activity in a fluidically isolated co-culture. Since the chemical stimulus was contained within one chamber, as proposed by our modelling, these data indicate that the increase in activity in both neurons and astrocytes resulted from functional synaptic communication between the two networks. To the best of our knowledge this is the first time, using solely calcium imaging and chemical stimuli, that the formation of functional synapses between two fluidically isolated cultures has been confirmed. Furthermore, an increase in Ca2+ events was also observed in the astrocyte population indicating that changes in neuronal activity can alter the activity of neurons and astrocytes alike. Other studies demonstrating live signalling between neuronal co-cultures have been reliant on microelectrode arrays10,15 that cannot detect this activity from astrocytes. However, underlying mechanisms for the astrocytic response are beyond the scope of this study. Nevertheless, with the understanding of astrocytic function under both physiological24,25 and pathophysiological conditions26,27 increasing dramatically, one could speculate that the proposed methodology could be useful in further increasing our understanding of the role that neuron–astrocyte interactions play under these conditions. This approach opens numerous possibilities for the use of these systems in drug discovery programmes or to further increase our understanding of the synaptic mechanisms that underlie certain CNS disorders. However, we cannot confirm that this synaptic communication occurs solely within the microchannels as we cannot rule out an effect from neurites from the opposing culture that have crossed the central barrier. Further development of the device by utilising different chamber configurations and microchannels of different geometries14,28 will allow this to be examined.
Conclusion
We have shown a novel approach integrating microfluidic systems with calcium imaging for the purpose of monitoring neuronal and astrocytic activity in functionally connected, but fluidically isolated primary hippocampal cultures. This method has high-throughput capability to monitor effects on neuronal synaptic communication in response to controlled local stimuli that could be useful for drug screening. In addition, there is the potential to extend this approach for investigating the consequence on synaptic function of genetic alterations observed in certain CNS disorders and thus highlight novel therapeutic targets.Acknowledgements
Engineering and Physical Science Research Council (EPSRC) funding via “Bridging the Gap” scheme and the Doctoral Training Centre (DTC) in Medical Devices at the University of Strathclyde.Notes and references
- D. J. Nutt, The full cost and burden of disorders of the brain in Europe exposed for the first time, Eur. Neuropsychopharmacol., 2011, 21, 715–717 CrossRef CAS PubMed.
- D. J. Nutt and J. Attridge, CNS drug development in Europe - Past progress and future challenges, Neurobiol. Dis., 2013, 61, 6–20 CrossRef PubMed.
- N. A. Fineberg, et al., The size, burden and cost of disorders of the brain in the UK, J. Psychopharmacol., 2013, 27, 761–770 CrossRef PubMed.
- P. Y. Collins, et al., Grand challenges in global mental health © 2011, Nature, 2011, 475, 27–30 CrossRef CAS PubMed.
- P. Winn, T. J. Bushell, J. Pratt and B. Picard, The future of neuroscience, Public Serv. Rev. UK Sci. Technol., 2011, 1–2 Search PubMed.
- J. Gan, S. M. Greenwood, S. R. Cobb and T. J. Bushell, Indirect modulation of neuronal excitability and synaptic transmission in the hippocampus by activation of proteinase-activated receptor-2, Br. J. Pharmacol., 2011, 163, 984–994 CrossRef CAS PubMed.
- C. J. Ledgerwood, S. M. Greenwood, R. R. Brett, J. a. Pratt and T. J. Bushell, Cannabidiol inhibits synaptic transmission in rat hippocampal cultures and slices via multiple receptor pathways, Br. J. Pharmacol., 2011, 162, 286–294 CrossRef CAS PubMed.
- A. M. Taylor, Microfluidic multicompartment device for neuroscience research, Langmuir, 2003, 19, 1551–1556 CrossRef CAS PubMed.
- A. M. Taylor, A microfluidic culture platform for CNS axonal injury, regeneration and transport, Nat. Methods, 2005, 2, 599–605 CrossRef CAS PubMed.
- T. T. Kanagasabapathi, et al., Selective pharmacological manipulation of cortical-thalamic co-cultures in a dual-compartment device, J. Neurosci. Methods, 2013, 214, 1–8 CrossRef PubMed.
- M. Shi, et al., Glia co-culture with neurons in microfluidic platforms promotes the formation and stabilization of synaptic contacts, Lab Chip, 2013, 13, 3008–3021 RSC.
- A. Kunze, et al., Astrocyte-neuron co-culture on microchips based on the model of SOD mutation to mimic ALS, Integr. Biol., 2013, 5, 964–975 RSC.
- J. Park, H. Koito, J. Li and A. Han, A multi-compartment CNS neuron-glia Co-culture microfluidic platform, J. Visualized Exp., 2009, 6–8, DOI:10.3791/1399.
- A. M. Taylor, D. C. Dieterich, H. T. Ito, S. A. Kim and E. M. Schuman, Microfluidic local perfusion chambers for the visualization and manipulation of synapses, Neuron, 2010, 66, 57–68 CrossRef CAS PubMed.
- T. T. Kanagasabapathi, D. Ciliberti, S. Martinoia, W. J. Wadman and M. M. J. Decré, Dual-compartment neurofluidic system for electrophysiological measurements in physically segregated and functionally connected neuronal cell culture, Front. Neuroeng., 2011, 4, 1–11 Search PubMed.
- V. Jokinen, et al., A microfluidic chip for axonal isolation and electrophysiological measurements, J. Neurosci. Methods, 2013, 212, 276–282 CrossRef PubMed.
- K. W. Oh, K. Lee, B. Ahn and E. P. Furlani, Design of pressure-driven microfluidic networks using electric circuit analogy, Lab Chip, 2012, 12, 515–545 RSC.
- T. J. Bushell, R. Plevin, S. Cobb and A. J. Irving, Characterization of proteinase-activated receptor 2 signalling and expression in rat hippocampal neurons and astrocytes, Neuropharmacology, 2006, 50, 714–725 CrossRef CAS PubMed.
- T. J. Bushell, C. C. Lee, R. Shigemoto and R. J. Miller, Modulation of synaptic transmission and differential localisation of mGlus in cultured hippocampal autapses, Neuropharmacology, 1999, 38, 1553–1567 CrossRef CAS.
- A. M. Taylor, et al., Microfluidic multicompartment device for neuroscience research, Langmuir, 2003, 19, 1551–1556 CrossRef CAS PubMed.
- J.-M. Peyrin, et al., Axon diodes for the reconstruction of oriented neuronal networks in microfluidic chambers, Lab Chip, 2011, 11, 3663–3673 RSC.
- N. Takahashi, T. Sasaki, A. Usami, N. Matsuki and Y. Ikegaya, Watching neuronal circuit dynamics through functional multineuron calcium imaging (fMCI), Neurosci. Res., 2007, 58, 219–225 CrossRef CAS PubMed.
- N. Takahashi, Y. Takahara, D. Ishikawa, N. Matsuki and Y. Ikegaya, Functional multineuron calcium imaging for systems pharmacology, Anal. Bioanal. Chem., 2010, 398, 211–218 CrossRef CAS PubMed.
- G. Perea and A. Araque, GLIA modulates synaptic transmission, Brain Res. Rev., 2010, 63, 93–102 CrossRef CAS PubMed.
- M. Santello, C. Calì and P. Bezzi, Gliotransmission and the tripartite synapse, Adv. Exp. Med. Biol., 2012, 970, 307–331 CrossRef CAS.
- D. Rossi and A. Volterra, Astrocytic dysfunction: insights on the role in neurodegeneration, Brain Res. Bull., 2009, 80, 224–232 CrossRef CAS PubMed.
- V. Parpura, et al., Glial cells in (patho)physiology, J. Neurochem., 2013, 121, 4–27 CrossRef PubMed.
- A. Kunze, R. Meissner, S. Brando and P. Renaud, Co-pathological connected primary neurons in a microfluidic device for Alzheimer studies, Biotechnol. Bioeng., 2011, 108, 2241–2245 CrossRef CAS PubMed.
Footnote |
| † Electronic supplementary information (ESI) available. See DOI: 10.1039/c3ib40221e |
| This journal is © The Royal Society of Chemistry 2014 |