Rules and benefits of Life Cycle Assessment in green chemical process and synthesis design: a tutorial review
Dana
Kralisch
*,
Denise
Ott
and
Doerthe
Gericke
Friedrich Schiller University of Jena, Institute of Pharmacy, Department of Pharmaceutical Technology, Otto-Schott-Str. 41, D-07745 Jena, Germany. E-mail: dana.kralisch@uni-jena.de; Fax: +49 3641 949942; Tel: +49 3641 949951
First published on 15th September 2014
Abstract
The implementation of Life Cycle Assessment and related methods in green chemical process and synthesis design strongly supports the development of greener concepts on the basis of deep and profound insights into the dependences between the selection of compounds and process parameters and the resulting environmental impacts. This review article provides an overview on things to know about LCA in general, specifics to be considered during its application in the field of chemical (re-)designs and current application examples from emerging research areas such as active pharmaceutical ingredient manufacturing, nanotechnology, flow chemistry, process intensification under harsh synthesis conditions, process integration, waste treatment, the use of alternative energy sources or solvents as well as chemistry based on renewable resources.
Introduction
In the last decade, consciousness has risen for the finiteness of resources, and the serious impact of industrialisation on the environment in various ways is no longer denied. Consequences have been envisaged: scientists have started research to understand the coherences of environmental changes with human behaviour, politicians have adopted laws restricting emissions and encouraging resource efficiency, consumers have started asking for more environmentally benign products and industry has to deal with the increasing demand for environmentally benign ways of production.But, how can the environmental impact of a novel chemical process or material design be determined in a quantitative manner right from the start to support sustainable developments? Over the past few decades, the concept of life-cycle thinking has become increasingly important. Consequently, the method of Life Cycle Assessment (LCA)1,2 has been developed and is now established as one of the major tools for the analysis of anthropogenic environmental impacts.3 LCA is outstanding in its scope of applicability and its holism. It considers the whole life cycle of a product or process and evaluates environmental impacts in terms of various environmental impact categories that go beyond the consideration of mass or energy flows.
LCA was developed in the early seventies and has since then been refined and supported with inventory databases and impact assessment methodologies. Today, it can be applied to very complex issues. Aiming to compare the eco-friendliness of products and processes, LCA is nowadays an integral part of decision-making in industry and governmental and non-governmental organisations. LCA can be used as a standalone tool or in combination with other environmental, risk, economic or social assessment tools, see also the reports by Jacquemin et al.3 or Guinée et al.4 and the references therein.
For those who want to learn more about the methodological aspects of LCA investigations during chemical process and synthesis design, this review article provides an introduction into the topic, indicating further interesting literature to read on. Against the background of the LCA theory, recent case studies derived from emerging research areas such as active pharmaceutical ingredient manufacturing, nanotechnology, flow chemistry, process intensification by harsh synthesis conditions, process integration, waste treatment, the use of alternative energy sources or solvents as well as chemistry based on renewable resources are presented, emphasising the usefulness and importance of LCA in today's green chemical design.
The methodological rules of LCA
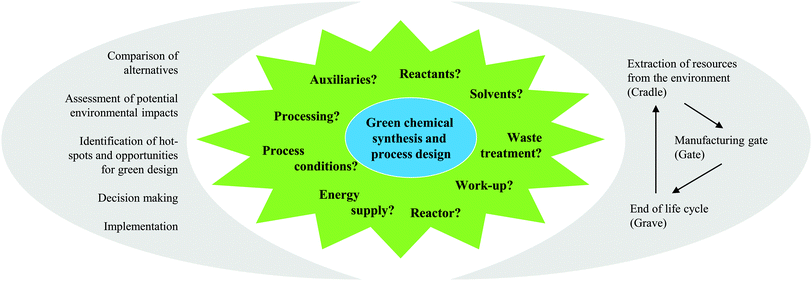
As the name ‘Life Cycle Assessment’ implies, the perspective of LCA is the entire life of the product or process under investigation (see Fig. 1). This means that all the mass- and energy-flows within the life of a product are recorded, from the acquisition of the raw material, over the distribution and the use, to the final deposition of the wastes after its use (also called “cradle-to-grave”).5The defined structure of LCA studies consists of the following stages: (i) Goal and Scope Definition, (ii) Life Cycle Inventory Analysis (LCI), (iii) Life Cycle Impact Assessment (LCIA), and (iv) Life Cycle Interpretation. LCA is usually an iterative process. While working at one of the stages, difficulties in the acquisition of data might appear or new information may give rise to a necessary change in the settings made previously. Thus, it is often useful and necessary to go back to earlier stages and change these settings.5
Goal and scope definition
During Goal and Scope Definition, the cornerstones of the study are defined. The precise determination of the intention of the study is important to establish a basis for decisions that have to be made during the execution of the study. It includes the motivation, the audience addressed and the purpose of the study. The definition of the scope also includes the phrasing of certain rules concerning the methodological procedure of the study. Here, the investigated chemical product or process is also set in terms of a functional unit as a comparable performance characteristic. All inputs and outputs are assigned to this functional unit.Life cycle inventory analysis
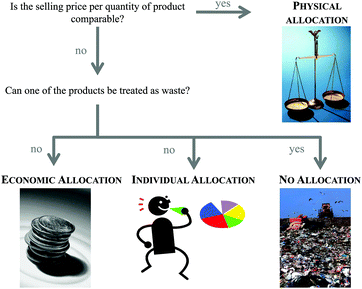
The second step of the LCA is inventory analysis. During Life Cycle Inventory (LCI) all the mass and energy flows within the scope of the study are recorded. Focus is placed on the structuring of the entire life cycle in separate unit processes as well as on the collection and calculation of data. Data collection means the assembly of all (energy and material) inputs (resources extracted from the environment) and outputs (products, wastes, emissions). Data calculation includes the validation and the relation of the data to the functional unit. At this, the LCI database ecoinvent6 is often used in the case of missing measured or gathered data, especially with regard to up- and downstream processes of the chemical synthesis under investigation. Provided by the ecoinvent Centre, the database includes the most consistent, transparent, and up-to-date Life Cycle Inventory (LCI) data worldwide. Within the several thousands of LCI datasets, relevant LCI data concerning not only bulk and speciality chemicals, but also energy supply, transport, biofuels and biomaterials, construction and packaging materials, basic and precious metals, metals processing, as well as waste treatment can be found based on industrial data.In the case of a process involving more than one commercially useful product as well as recycled materials, an allocation of the energy and material flows has to be applied.5 In general, various allocation methods are present and are controversially discussed.7–9 Two of the more common allocation procedures refer to the mass or market-value of these products (see Fig. 2).
Life cycle impact assessment
The Life Cycle Impact Assessment (LCIA) is conducted with the results of LCI. Certain potential environmental consequences (namely ‘impact categories’) are assigned to the mass- and energy-flows according to the chosen characterisation model. This way, the LCIA leads to statements about the environmental performance of the process, and the particular process step or product under investigation. There exist many different ways of assigning environmental impacts to the inventory, but they all follow a common procedure fixed in the standards EN ISO 140405 and 140445: (i) selection of a characterisation model, (ii) classification, (iii) characterisation, and optional, (iv) normalisation.The impact categories are selected according to the goal and scope of the study. The category indicator is the quantifiable representation of a certain impact category. The category indicator and the characterisation model are developed according to the environmental mechanism that is known for the particular impact category. The potential environmental impacts of the elementary flows that are identified in the LCI are classified within these impact categories. During characterisation, the potential impact of an inventoried item is quantified in terms of a representative unit, e.g., in carbon dioxide equivalents in the case of emissions causing climate change. The normalisation step is the calculation of the characteristic value of the category indicator relative to a reference value, e.g., in relation to an emission limit or per capita. The normalisation step is optional and does not have to be included in the LCIA.5
Life cycle impact assessment methods
Nowadays, a number of LCIA methods have been established. They all use different kinds of characterisation models and therefore consist of different impact categories. The inclusion of these LCIA methods in software tools commonly used for LCA enables the LCA practitioner to focus on the data for the LCI, but the choice of the LCIA method and the considered impact categories must be well conceived with respect to the goal and scope of the study.10There are two different kinds of impact categories, the input- and the output-related categories. The theoretical model behind an input-related category could be described as follows: if the elementary flow is the extraction of 1 kg mineral oil, the effect (and the indicator) will be the depletion of a particular share of the remaining fossil oil resources. In order to define the impact of this depletion the scarcity, the renewability and the availability of a resource have to be considered. Therefore the evaluation of input-related indicators is already a complex issue.11 The output-related categories are even more difficult to quantify, because the effects of the outputs are more multi-layered. There are primary, secondary and tertiary (and even more) effects of an output that can all serve for the indication of the characterisation. For the impact category of Climate Change (CC) the effect chain could be described as follows:
(i) Primary effect: increase of the concentration of gases in the atmosphere that absorb radiation (the indicator here could be the measured value of the relevant gases).
(ii) Secondary effect: increase of the temperature.
(iii) Tertiary effect: variations in climate (different effects on the climate in different regions of the world): higher temperature peaks (cooler and warmer) drought, storms.
This list can be continued with further possible effects such as changes in abiotic conditions, effects on living nature and eventually, effects on human health. If the indicator of a certain impact category is close to the inventory (close to the emission), it is called a midpoint indicator. If the indicator is describing a tertiary effect, it is called an endpoint indicator. As shown in Fig. 3, the indication of the effects becomes more complex due to the chain of events between cause and effect. Tertiary effects and beyond are difficult to measure and the number of impact categories rises, since the emission of one substance often has multiple effects (for example considering different areas of protection). Still, the use of endpoint categories would describe the actual impacts that the areas of protection are affected by, rather than the changes of the environment that result in potential effects. Therefore, the implementation of endpoint categories is one of the major goals of the current progress of LCA methodology, but cannot be recommended without objections yet.12
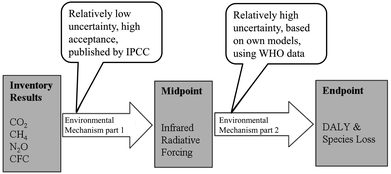 | ||
| Fig. 3 Illustration of a harmonised midpoint–endpoint model for climate change, linking to human health and ecosystem damage applied within ReCiPe.10 | ||
The characterisation model, which is the foundation of the association of the LCI results with the LCIA results, is based on confirmed scientific insight. Still, the resulting impacts should not be interpreted as verified predictions. Often, the environmental mechanism is complex and the theoretical models do not include spatial or temporal dimensions.13 The assessment of impacts is always a balancing act between scientific precision and feasibility. Therefore the results of the LCIA are afflicted with uncertainties (that are often not defined, yet) and should be seen as statements on the potential impacts.
The ISO standards EN ISO 14040 and 140445 also refer to the analysis of the data quality as a mandatory part of the LCIA. Since it is part of the Life Cycle Interpretation as well, it is further explained in the next section.
Methodologies for life cycle impact assessment
For the association of the inventory data with potential environmental impacts it is useful to choose one consistent LCIA method, which is a collection of characterisation models concerning a variety of impact categories. The choice of LCIA methods and their underlying characterisation models determined by standardisation organisations should be based on an international approval or agreement.5 There are a number of LCIA methods existing, partly still in the developmental stage. A comprehensive overview about these methods is given by Hauschild and colleagues.11 Some of the well-established ones are for example CML 2002,14 IMPACT 200215 (both midpoint oriented methods) or Eco-Indicator 9916 (endpoint oriented indicator).One of the most up-to-date LCIA methods today is ReCiPe.10 The focus during the development of this method was on the compatibility of mid- and endpoint methods in terms of the assumptions that create the measures defined in the model. ReCiPe is a combination of the established CML 2002 and the Eco-Indicator 99 methods. At the midpoint-level, ReCiPe consists of the following 18 impact categories:
1. Climate Change (CC)
2. Ozone Depletion (OD)
3. Terrestrial Acidification (TA)
4. Freshwater Eutrophication (FE)
5. Marine Eutrophication (ME)
6. Human Toxicity (HT)
7. Photochemical Oxidant Formation (POF)
8. Particulate Matter Formation (PMF)
9. Terrestrial Eco-Toxicity (TET)
10. Freshwater Eco-Toxicity (FET)
11. Marine Eco-Toxicity (MET)
12. Ionising Radiation (IR)
13. Agricultural Land Occupation (ALO)
14. Urban Land Occupation (ULO)
15. Natural Land Transformation (NLT)
16. Water Depletion (WD)
17. Mineral Resource Depletion (MRD)
18. Fossil Fuel Depletion (FD)
To give an impression of the way the impact assessment works, the category Climate Change (CC) is further described in the following section. A description of the other 17 category indicators can be found in the ReCiPe main report.10
The impact category CC summarises the effects of elementary output substances that contribute to global warming. The calculation of the Global Warming Potential (GWP) of a certain substance appearing in the LCI is performed by the use of equivalence factors that have been defined in the report of the Intergovernmental Panel on Climate Change (IPCC).17 These equivalence factors are calculated according to the following equation:10
The term ax describes the power of the substance x to increase the radiative forcing and the term x(t) describes the lifetime of the gas, as the gases in the atmosphere are subjected to different kinds of effects that influence their concentrations, like chemical reactions with other gases or degradation caused for example by UV-radiation. As can be seen from the equation, the quality that is used to describe the CC is the increase of radiative forcing caused by a greenhouse gas relative to a reference gas. In this case, the reference gas is CO2, the most important anthropogenic greenhouse gas.18 The direct relative radiative forcing per ppbv (part per billion, volume basis) is derived from infrared radiative transfer models based on laboratory measurements of the molecular properties of each substance and considering the molecular weights.10 Originating from the IPCC, the characterisation model is consensus-based and undisputed. It is classified satisfactory and recommended by the Joint Research Centre of the European Commission (JRC). Table 1 gives an overview of the characterisation model for CC. Since most production processes are connected with a significant energy demand causing additional environmental impacts, the Cumulative Energy Demand (CED) was established as a LCIA category nearly twenty years ago.19,20
| Impact category | Climate change |
|---|---|
| LCI results | Greenhouse gases |
| Characterisation model | Baseline model of 100 years as in IPCC17 |
| Category indicator | Infrared radiative forcing |
| Characterisation factor | Global warming potential (kg CO2-eq. per functional unit) |
| Environmental relevance | Infrared radiative forcing is a proxy for potential effects on the climate, depending on the integrated atmospheric heat absorption caused by emissions and the distribution over time of the heat absorption |
CED represents the energy demand during the entire life cycle of a product or process, and is nowadays accepted as a suitable screening indicator, predicting environmental burdens of production21 and reflecting many of energy-related life cycle impacts typically considered in an LCA study, e.g., global warming, resource depletion or acidification.22
During the early stages of green fine chemical process design, the Finechem software tool by Wernet et al.23,24 can be used for CED estimation, with a detailed LCI modelling. The related Cumulative Exergy Demand (CExD) depicts instead the total exergy removal from nature to provide a product, summing up the exergy of all resources required.25
Some years ago, the group of Dewulf and colleagues developed the more sophisticated LCIA category Cumulative Exergy Extraction from the Natural Environment (CEENE) for the impact assessment of process alternatives with a high share of energy supply on the overall environmental impacts.26 Exergy data on fossils, nuclear and metal ores, minerals, air, water, land occupation, and renewable energy sources were taken into account as “taken away” from natural ecosystems. They applied this measure also in the context of life-cycle based evaluation of pharmaceutical processes.27,28
Life cycle interpretation
The Life Cycle Interpretation can be subdivided into the following constituents according to EN ISO 14044:5(i) Identification of significant issues.
(ii) Evaluation.
(iii) Conclusions.
The identification of significant results is mainly achieved by structuring the results of the LCI and LCIA. The evaluation is concerned with the completeness of the data base, the consistency of the data (data quality indication) and the analysis of the sensitivity of the results for changes in data. Having checked for these criteria, conclusions can be drawn concerning the resulting recommendations but also the limitations of the LCA study.
Sensitivity and uncertainty analysis
Most data used in a typical LCA study come from secondary sources such as LCA databases, process simulation tools, information from similar processes, literature references, etc. Due to this fact as well as the inhomogeneity of those collected data, a distinct uncertainty is inherent.Furthermore, unclear definitions, the cut-off of relevant up- and downstream processes, the choice of unsuited environmental impacts, and incorrect interpretations, e.g., caused by overdone aggregation, or the combination of data from different temporal or geographic origin may affect the overall LCA, thus weakening the powerful validity and reliability of life cycle analyses compared to simple green metrics. It is the responsibility of each evaluator to reduce these causes for uncertainty carefully without losing sight of practicability and to document the quality of the data used. One approach to reduce the data gathering effort is sensitivity analysis based on expert knowledge. As an example, a variation of the typical synthesis or process parameters and the analysis of the resulting effect on the overall environmental balance support the selection of most influencing process modules.29,30 In the next step, those process modules can be evaluated in more detail than others showing only a minor contribution.
Monte Carlo simulations can further help to determine whether the calculated differences between alternatives evaluated within a comparative LCA are significant. The method relies on repeated stochastic calculations within a mostly pre-defined uncertainty band in order to obtain the distribution of the unknown probabilistic entity (e.g.ref. 31 and 32).
Indication of data quality
The description of the experimental procedures within a scientific study for greener chemical process and product design is mostly precise and comprehensive and the data quality goals can be achieved. The availability of secondary data is typically lower and therefore quality goals can only be accomplished partially. Hence, the quality of the data varies depending on the available sources within the specific study. In order to take these variations into account, the data quality of each aspect of this study should be indicated via indicators. A common procedure to indicate the data quality in an LCA is the so-called ‘Pedigree Matrix’ which has been established for this purpose by Weidema.33 The data quality indicators used by Weidema are:(i) Completeness.
(ii) Temporal correlation.
(iii) Geographical correlation.
(iv) Further technological correlation.
(v) Reliability.
The data quality is evaluated by giving scores to each data set (forming the lines of the matrix) for each of these categories (the columns of the matrix). Every score is defined beforehand, and only if all the criteria in this definition are fulfilled a particular score can be assigned. The Pedigree matrix system for qualitative assessment of data quality within LCA studies has been modified and used for many different LCA studies in the past, but mostly not in the context of chemical process and synthesis design. Table 2 shows a modified pedigree matrix applicable to data quality indication for this specific application.
| 1 | 2 | 3 | 4 | 5 | |
|---|---|---|---|---|---|
| Completeness | Complete data including information on masses, energies, by-products and recycling | Nearly complete data, data gaps filled with qualified assumptions | Incomplete data, gaps filled with qualified assumptions | Incomplete data, important data gaps filled with standard assumptions | Incomplete data, data gaps not filled |
| Representativeness | Primary experimental data from the research area under study, provided by experts, recent time period | Data from area under study, from experts related to the topic of the study, from one time period | Data from a currently conducted procedure, from the area with similar synthesis conditions, technology that could be applied | Data from the former production procedure, area or different production conditions and technology of different scale | Data age older than 20 years or unknown, unknown area and unknown or inapplicable technology |
| Reliability | Data based on repeated measurements | Data based on measurements or calculated from trustworthy models | Data based on the literature or on models | Data based on qualified estimations | Data based on non-qualified estimation or unknown origin |
One major difference between Weidema's established valuation system and the one introduced here is the aggregation of the indicators for time, space and technological correspondence into one indicator called representativeness. Weidema reasons that the division is useful in order to figure out areas for improvement more easily. Nevertheless, in the early stages of chemical process or synthesis design the simplification suggested herewith has been found useful for purposes of clarity, and last but not least, due to typically limited information about the time, space and technological implications of the novel process or material under development in a future industrial environment. The indicator score is always guided by the single aspect that scores the worst. If, for example the time-correlation scores ‘1’ and the technological correlation scores ‘5’ or is unknown, the score for representativeness is ‘5’.
Why using LCA?
The method of LCA has many advantages compared to other methods of measuring the environmental impact of products or processes. Due to its broad applicability and its validity, the LCA methodology has gained worldwide acceptance as a useful tool for strategic planning, process development as well as policy-making.Thanks to the development of this method in the last 40 years there is a set of guidelines available for it that provides precise information on implementation.13 These guidelines take care of the consistency and the transparency of LCA.
The LCA approach ensures the avoidance of a problem by shifting to other stages of the process (e.g. raw material production, waste treatment) because of its comprehensiveness. When selecting the system boundaries in a life-cycle-way of thinking, the increase of environmental impacts outside these boundaries is avoided.
The evaluation of products or processes in an LCA is typically performed in a relative way. In the case of comparative studies this can mean that completely different amounts of different chemical compounds that are needed to serve the same purpose can be compared.
Nevertheless, the decisions that follow the conduct of a LCA study are still a matter of values and opinions.
The handling of uncertainties or data gaps of the study as well as the securing of comparability of alternatives are important criteria, whether the study is conducted in a scientific way. Only the precise definition of rules, the scientific discourse concerning the methodology, the scientific base of the impact assessment and, finally, the transparency of each individual LCI data set ensure the high quality of LCA studies.
As mentioned before, the LCA method is not specially designed for the evaluation of chemical processes or its application for decision-making purposes during process design (for more detailed information see ref. 34). Thus, the practitioner has to select from the high number of LCA approaches (see e.g. dynamic LCA,35 spatially differentiated LCA,36 risk-based LCA,37 environmental input–output based LCA (EIO-LCA),38 hybrid LCA39 or Eco-OptiCAD40) the best-fitting strategy without losing the holistic, comprehensive evaluation idea behind the LCA approach.
Simplifying LCA
The benefits of applying LCA for the evaluation of green chemical processes and products, syntheses pathways and technologies have been stated above. The results of an LCA study can be used to highlight the attractiveness of a novel production pathway; they can help make decisions on which chemical compound to use or it can show optimisation potentials within an existing procedure.41 The most beneficial way of employing LCA is to apply it in the early development of new compounds or procedures. In this stage, relevant weak points can not only be fixed by after care or so-called end-of-pipe solutions, but they can also be identified and avoided in advance.42 However, the complexity and the time and effort needed to conduct an LCA study are often the reasons to prefer other, less complicated ways of evaluation at this stage. This is especially the case when new, non-established developments with little available data are to be assessed. In order to enable LCA in such cases without neglecting its high life-cycle based standards, there are different ways to decrease the amount of work and data requirements that come along with.In an attempt to enable an LCA with smaller scope, the Society of Environmental Chemistry and Toxicology (SETAC) developed a framework for Simplified Life Cycle Assessment (SLCA)43 (also called Streamlined LCA), which describes the possibilities of simplification for every phase of the LCA. According to this framework, the simplification consists of three steps which are iteratively linked:
(i) Screening: identification of the elements of the LCA that can be omitted or where generic data can be used without significantly affecting the accuracy of the final result.
(ii) Simplifying: application of the simplifying options identified in the screening step to produce a simplified LCA.
(iii) Assessing reliability: making sure that results are reliable enough to justify the conclusions drawn.
These steps are intended to be applied to all four phases of the ‘common’ LCA, because this way the holistic approach is still ensured. Just like the ‘common’ LCA, the simplification is an iterative procedure. Today, a Simplified LCA is an established part of the toolbox for decision support towards more environmentally benign chemical developments.42,44
Another possibility to decrease the amount of work afflicted with LCA is to concentrate on the most relevant life cycle stages: some LCA studies are not concerned with the entire life cycle of a product, but with the potential impacts that are caused by a particular life stage (gate-to-gate analysis). More often, a cradle-to-gate assessment is performed, including all life cycle impacts caused up to the production and work-up of the final chemical compound. It is used for comparative studies evaluating different processing alternatives or synthesis pathways resulting in the same product, characterised by a comparable product quality. The further life-cycle impacts of all alternatives considered are equal and therefore excluded.
Another simplification approach was followed by GlaxoSmithKline (GSK). They developed the FLASC™ software tool45 for fast LCA in synthetic chemistry especially for Active Pharmaceutical Ingredients (API). Material classes were chosen where it was possible to generate average LCI profile data that could be used for materials where LCI data did not exist. Then, a methodology to predict the cradle-to-gate life cycle impact profile for a typical batch chemical process used to synthesise APIs was developed based on the LCI of the materials used in the process, using a combination of actual or average data, and the mass of the material. Based on a core set of life cycle impact profiles for well-developed GSK processes including separation and/or isolation steps, a series of formulae was developed that enabled a score to be calculated for different impact categories. The average FLASC™ score was finally calculated from the individual scores for each impact category. The FLASC™ tool is now used to determine, compare and benchmark the ‘greenness’ or relative sustainability of synthetic processes in order to facilitate more informed and sustainable business choices. The motivation for the development of this tool was again the particular high optimisation potential at an early stage in research and development (R&D) activities when route and processes are being selected and detailed environmental data are not available.
Coupling with other assessment methods
Since sustainability is not only characterised by environmental but also by cost and societal criteria, LCA investigations are often coupled with other evaluation tools. As an example, every investment decision in green chemical processes and technologies is finally a cost-based decision. Therefore, the life-cycle based assessment can be extended by the economic dimension of sustainability using appropriate cost assessment tools such as Life Cycle Costing (LCC).46 The results of both, plotted in two-dimensional graphs, can show the effectiveness of certain measures in environmental as well as in economic terms.47 Additionally, combined with the results of a Societal LCA,48 all aspects of sustainability can be covered in a methodologically profound approach.Another important issue, especially in chemical process and product design is the appropriate analysis and management of risks concerning human health, environment and safety.
That is why, LCA is sometimes coupled with risk assessment as depicted in Fig. 4 on the example of nanotechnologies.
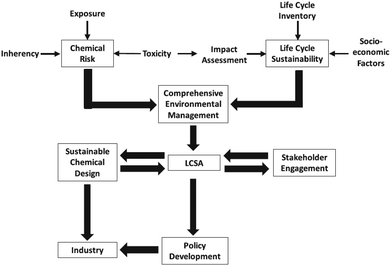 | ||
| Fig. 4 Risk management strategy for life cycle sustainability assessment (LCSA) of nanotechnologies49 with kind permission from Springer Science and Business Media. | ||
During early design stages, the environmental behaviour, potential hazards for humans and ecosystems of substances and their treatment when entering different environmental compartments, can be estimated using the Environmental, Health and Safety (EHS) risk assessment method.29 The EHS tool developed by Hungerbuehler and colleagues50,51 is a user-friendly approach to derive the risks resulting from the handling of chemicals. It is combinable with LCA (or Simplified LCA) and other evaluation approaches.
As mentioned before, the analysis and minimisation of future environmental impact potentials of a novel chemical process under development is most effective during early stages. This effect is contradictory to the profound data requirements of an LCA study, which usually can not be fulfilled (if no experiences with a similar process are on hand), until the process is implemented on the industrial scale. Here, process simulation tools such as ASPEN Tech and HYSYS are very helpful to estimate the mass and energy balance of the process and its optimisation potentials on the future production scale as a data basis for the LCI stage (also called ex-ante LCA).52,53
Coupling with multi-criteria optimisation and decision making tools
From the complexity of the LCIA on the one hand and the combination of the LCA with other evaluation methods described before on the other hand it becomes obvious that several, partly contradictory objectives are incorporated in a sustainable process or product design and evaluation process. Then, a multi-objective decision making problem occurs, especially in the case of conflicting objectives (see Fig. 5). The problem of comparing several alternatives with respect to several objectives, e.g., costs, environmental or social impact and risks, integrating also a Multi-Objective Optimisation (MOO) can be solved by Multi-Criteria Decision Analysis (MCDA). Multi-Criteria Decision Making (MCDM) techniques are gaining popularity in sustainable process management to find a good trade-off among various objectives, often considering economic, safety or ecological aspects in parallel. Several well-established MCDM methods are applicable, differing in the way preferences are handled. Widely used ranking methods are, e.g., AHP (Analytical Hierarchy Process),54,55 ELECTRE (Elimination and Choice Expressing Reality)56 and PROMETHEE (Preference Ranking Organisation Method for Enrichment Evaluations),57,58 see also ref. 59–62.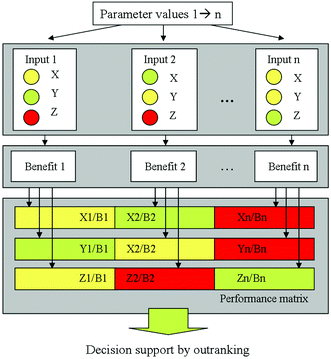 | ||
| Fig. 5 Performance matrix requiring decision support, taken from Kralisch et al.63 reproduced by permission of The Royal Society of Chemistry. | ||
Another established method is the NP (Nonlinear Programming) approach.64 It involves the minimisation or maximisation of nonlinear objective functions subject to bound constraints, linear constraints, or nonlinear constraints.
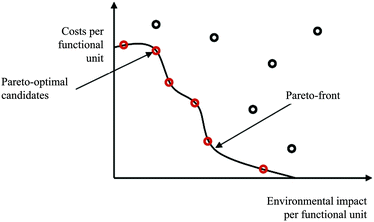
The assessment of multi objective optimisation results can be done using the Pareto concept.65 Standardised algorithms for identifying pareto-optimal solution candidates constitute for example the basis for partial ranking (out-ranking) procedures. Fig. 6 shows a bi-objective Pareto-optimal curve (considering environmental and economic impacts). Parameter configurations and resulting impacts of alternatives at the Pareto-front cannot be changed or improved without worsening the other criterion/criteria.
In order to define a preference relation of multi-attributed alternatives, the outranking methods mentioned before can be applied. As a result of a total or partial outranking procedure regarding several LCIA results, preferences for specific, pareto-optimal options for environmental efficiency can be quantified. At this, the environmental efficiency can be determined based on the relative saving potentials in different LCIA categories referred to as the worst as well as the best case candidates (highest or lowest environmental impact potential, respectively) calculated in each of these categories. Finally, one aggregated environmental efficiency value can be calculated by means of weighting factors.72,73 Furthermore, the results are transferable to, e.g., a bi-objective eco-portfolio depiction showing environmental and cost efficiency in one graph. Thereby, cost efficiency is typically calculated taking into account relevant variable and fixed production cost criteria, e.g., investment, material, energy, personnel, and waste treatment costs. High efficiency values in both categories place attention on preferential options.
Fig. 7 shows an example of criteria contributions to the total eco-efficiency ranking of alternative biodiesel production pathways.72 Despite a lower cost efficiency of processes D and E (being supercritical, waste oil based process alternatives), their environmental efficiencies are strongly preferred in contrast to conventional processing alternatives (processes A–C). In consequence, this results in a higher ranking score and thus in a preference against the other process alternatives.
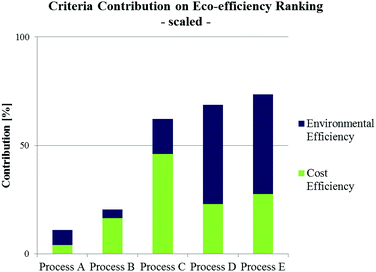 | ||
| Fig. 7 Criteria contribution (scaled) to overall eco-efficiency ranking of different biodiesel production alternatives utilising waste oil (Process A: pre-treated alkali-catalysed; Process B: acid-catalysed; Process C: heterogeneous acid-catalysed; Process D: supercritical process, Process E: supercritical, microreactor based process) according to Kralisch et al.72 | ||
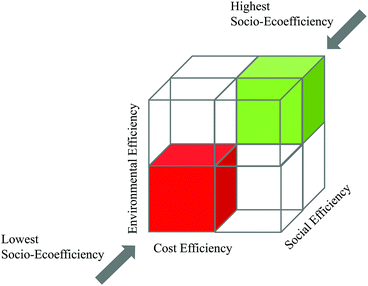 | ||
| Fig. 8 Simplified demonstration of the SEECube related to the BASF SEEbalance® concept:74 consideration of environmental, cost and social impacts. | ||
For instance, Ouattara et al.66 investigated the HAD process (hydrodealkylation of toluene) for the production of benzene focusing on an optimised criteria configuration related to costs and selected process outcome relevant life cycle impact categories in a three-dimensional evaluation.
Kralisch and co-workers76 evaluated different biodiesel production pathways using a tetrahedral chart containing environmental, safety and cost criteria, see Fig. 9. Thereby, all of the three criteria consists of a pre outranking of sub-category performance matrices (e.g., LCIA categories), resulting in a single ranking score for each criterion. The final tetrahedron emphasises not only the preference, but also the potential for further development activities in the dependency of the target criteria. If needed, a post outranking of LCA, LCC and EHS criteria can be performed by applying weighting parameters for each category, e.g., depending on target constraints or expert knowledge.
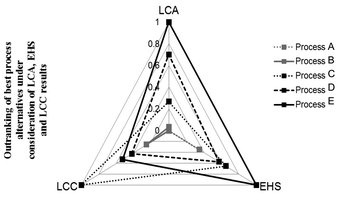 | ||
| Fig. 9 Three-dimensional criteria decision-making in the context of biodiesel manufacturing pathways. LCC: life cycle costing; LCA: life cycle assessment; EHS: environmental, health and safety risk assessment. Tetrahedral graph according to Kralisch et al.76 | ||
Application of LCA for green chemical process and synthesis design
Today, LCA is increasingly accepted as an assessment tool in green chemistry and engineering. It is applied on the laboratory as well as on the production scale. In the following, selected studies performed during the last few years in emerging fields of research and development are introduced against the background of future challenges to be coped with.LCA for evaluating chemical transformation pathways
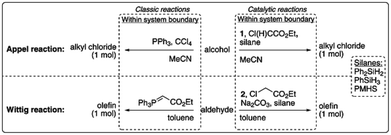 | ||
| Fig. 10 LCA system boundaries of the catalytic reactions investigated by van Kalkeren et al.77 published by The Royal Society of Chemistry. | ||
The results revealed that the replacement of phosphines by silanes can result in environmental improvements for the Wittig reaction, but that additional reagents and working in lower concentrated solutions would offset potential environmental improvements for the Appel reaction.
Griffiths and colleagues applied the LCA tool to measure the performance of a range of iron and palladium based nanoparticle catalysts for carbon dioxide utilisation on the laboratory scale.78 The catalysts combined the reverse water gas shift reaction with the Fischer–Tropsch process to convert CO2 into hydrocarbons used as fuels and feedstocks for the chemical industry. The LCA results afforded insight into ‘green’ catalyst design, since palladium addition vastly improves catalyst performance. However, they also found scenarios in which the continual addition of palladium, although showing favourable CO2 conversion and hydrocarbon yields, does not return a sufficient environmental offset to cover the embodied impacts present in its generation.
A novel approach to a catalytic synthesis of caprolactam was studied in an ex-ante environmental assessment by Roes and Patel (see Fig. 11).79 By means of the indicators non-renewable energy use (NREU) and climate change (CC), they found that the production of caprolactam by a novel homogeneous transition metal catalyst can offer clear advantages compared to the petrochemical production of caprolactam. Furthermore, 3-pentenamide, i.e., the precursor used in the novel catalytic process could be made from bio-based, instead of petrochemical butadiene, which would further reduce the environmental impacts. The same was pointed out for the syngas, which could be produced from biomass.
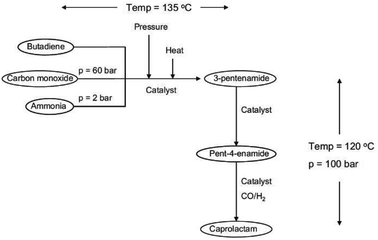 | ||
| Fig. 11 Flow sheet for the novel catalytic production of caprolactam studied by LCA79 reprinted with permission from Elsevier. | ||
The environmental as well as economic benefits of recycling and reuse of catalytic plates typically used in microreactors were checked by Kressirer and colleagues by means of LCA (CML 2002 LCIA methodology) and cost analyses.80 They found clear economic advantages, especially in the case of a combined reuse of the plates and recycling of the catalytic coatings, but the benefits to the environment were less conclusive. This was due to the additional demand for chemicals used for cleaning and recycling as well as for extra energy. Thus, further efforts for an optimisation of the overall post treatment and reuse process were required.
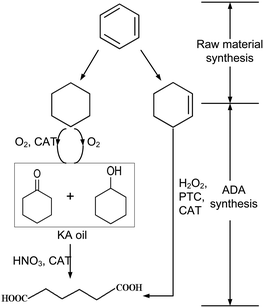 | ||
| Scheme 1 Two-(left) and one-step (right) production routes of adipic acid83 reprinted with permission from Elsevier. | ||
An alternative approach was evaluated by van Duuren et al.84 They performed a Simplified LCA of a combined biological and chemical process for the production of ADA. The LCA comprises the biological conversion of the aromatic feedstocks benzoic acid, impure aromatics, toluene, or phenol from lignin into cis,cis-muconic acid, which is subsequently converted to adipic acid through hydrogenation.
Their SLCA study focused on the LCIA categories CED, CExD, and CO2 equivalent emissions (comparable to an assessment of GWP). The highest calculated reduction potential of CED and CExD was achieved using phenol from lignine, which reduced the CED up to 57% compared to a petrochemical benchmark process. The bulk of the bioprocessing energy intensity was attributed to the hydrogenation reactor, directly related to the product concentration in the broth.
In conclusion, enhanced catalytic approaches have shown their great potential for improving the greenness of chemical processes. Of course, it has to be combined with the most material and energy efficient processing in order to exploit its full potential. But this is true also for any other concept for more environmentally benign chemical processing as discussed below.
Alternative energy sources
 | ||
| Scheme 2 Basic ester hydrolysis of p-nitrophenyl acetate (1) to sodium p-nitrophenolate.85 | ||
Although the new process alternative requires more energy compared to experiments without ultrasonication, a Simplified LCA utilising GWP and HTP as key indicators confirmed the development of a significantly greener process (e.g., decrease of the GWP up to 80% as a result of the yield increase).
 | ||
| Scheme 3 Suzuki–Miyaura reaction of aryl bromides (1) with phenylboronic acid (2) yielding biaryls (3)86 reproduced by permission of The Royal Society of Chemistry. | ||
Nevertheless, similar results were found by Kressirer and colleagues30 for a comparative investigation of oil bath, microwave or direct electric heating, taking into account the impact categories GWP and HTP. Again, microwave heating did not result in any savings due to the low energy efficiency of the microwave apparatus (being in the range of 16–20%).
Thus, using alternative forms of energy supply will not a priori result in a greener process. However, more effects than the energy efficiency ratio have to be taken into account in order to assess the environmental impact potential derived from the decision for a form of energy supply to a chemical reaction as shown by Huebner and colleagues.85 Furthermore, if switching to continuous processing, batch technologies need to be replaced by continuously operated, time reducing modules for pre and post treatment as well. Here, microwave drying can provide an alternative technique to conventional time demanding vacuum drying, e.g., within pharmaceutical processes87,88 Pharmaceutical powders have a relatively high dielectric loss factor compared to standard solvents and can therefore efficiently be dried using microwaves89, meeting also the strict quality criteria. In such cases, life-cycle based analyses can again provide valuable support in terms of holistic decision making. The integration of CExD or CEENE analysis in future studies would further enhance the meaningfulness of a comparison taking into account alternative energy sources.
Green solvents
 | ||
| Fig. 12 Combining the LCA and EHS50 method according to Capello et al.90 reproduced by permission of The Royal Society of Chemistry. | ||
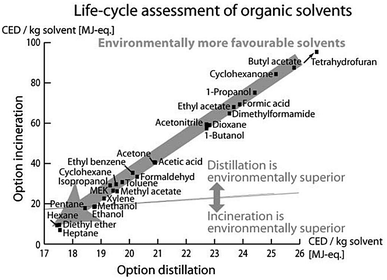
Luis et al.96 investigated the environmental burdens of batch and continuous distillation vs. incineration for the treatment of selected waste–solvent mixtures of different concentrations: acetonitrile–toluene, acetonitrile–toluene–tetrahydrofuran, ethyl acetate–water and methanol–tetrahydrofuran. The LCIA was performed by calculating the Eco-Indicator 99, UBP-97 (method of ecological scarcity),97 GWP, CED and CO2 emissions.96
Based on the LCA methodology, Amelio et al. further developed guidelines for solvent selection during the process design and evaluation of treatment alternatives. Therein, they investigated the environmental effect of treatment methods of 17 molecular solvents and their combined binary mixtures.93 Both papers concluded that the main impact arises from upstream processes of manufacturing these solvents. Thus, if the solvent supply is connected to high environmental burdens, a solvent distillation is preferred to its incineration. A comparison of the information, given by the different LCIA indicators used in this study, revealed that all indicators led to the same conclusions for the evaluated mixtures with some exceptions only for UBP-97.
Against the background of promising features of, e.g., non-flammability, high thermal stability or negligibly low vapour pressure, ionic liquids were uncritically referred to green chemistry at first and discussed as “green” substitutes to molecular organic solvents. Then, first results concerning their partial toxicity, production effort and environmental impact have induced a more differentiated point of view. Nowadays, the assessment of their chemical and biological properties, and the resulting environmental impacts have become important research and development aspects. Zhang et al.99 performed an LCA of the synthesis and application of an ionic liquid compared to selected molecular solvents. The authors emphasised the challenges and uncertainties of a product or process assessment in the early stages of development of a new class of compounds, but pointed out the importance of ecological evaluations of ionic liquids in contrast to other solvent systems. In consequence, they decided to perform a cradle-to-gate LCA, neglecting downstream processes, particularly due to the fact that information on industrial disposal routes and the resulting emission pathway into the environment was not available.
Reinhardt et al. performed simplified (focusing on CED evaluation in combination with EHS criteria) up to holistic LCA studies to evaluate and optimise the synthesis of selected ionic liquids, and compared their ecological performance to molecular solvents for the Diels–Alder reaction.63,98,100 The implementation of LCA strategies in ionic liquids R&D demonstrated the high optimisation potential for common synthesis strategies for these compounds and emphasised the need for a critical evaluation already at early process development stages. The life cycle impact of the ionic liquids was investigated to be much higher than that of the selected molecular solvents, see Fig. 13, primarily due to the extensive pathway of its manufacture. The authors concluded that potentially the ecological and economic impacts resulting from the manufacture can only be counter- or outbalanced within the application phase, if proper recycling is ensured and the use of ionic liquids results in an essential improvement in the application stage. However, in the case studies of metathesis101 and Diels–Alder reactions investigated98 clear environmental benefits for the use of molecular solvents were found.
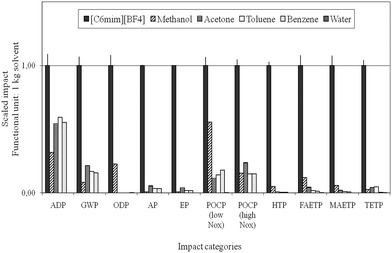 | ||
| Fig. 13 Comparison of the life cycle environmental impacts of the manufacture of ionic liquids with molecular solvents according to Ott and colleagues.98 | ||
Altogether, solvent selection, reduction and recycling have become a big issue not only in academia but also in particular in industry. If this trend is continued, one very important source of environmental impacts caused by chemical and pharmaceutical industry will be distinctly reduced. Even simplified approaches, taking into account in particular energy demand and toxicological criteria in a life cycle based manner, are of great value here.
LCA for evaluating flow processing
The chances of flow-chemistry to facilitate green processing was critically investigated by means of several (partly simplified) LCA studies (see, e.g., ref. 29, 42, 76, 102 and 103). Some of them are introduced below.An LCA comparison of a batch versus continuous flow processing of the exothermic anionic polymerisation of styrene again resulted in environmental benefits for the flow process due to the avoidance of a cryogenic cooling system.104
 | ||
| Scheme 4 Phase transfer catalysis (PTC) of benzoyl chloride and phenol evaluated by a Simplified LCA.103 | ||
An improvement of the mixing of the biphasic reaction system was realised by transferring the synthesis from batch to flow processing using different types of micromixers in combination with ionic liquids as phase transfer catalysts.
The performance of the micromixing structures was significantly influenced by the process parameters chosen, especially by the utilisation of ionic liquids such as [C18MIM]Br, [MIM][BuSO3] or [BMIM]Br as phase transfer catalysts. The ionic liquids showed strongly positive results on the yield of the esterification reaction compared to non-catalysed syntheses. Despite the high environmental burden of these compounds resulting from their material and energy demanding synthesis, the overall environmental balance was improved even when the ionic liquids were used only once without recycling. Sensitivity analyses were performed by varying relevant process parameters including the amount of solvent, the yield and flow rates. Based on this, the work-up step was found to be a major bottleneck for the green process design, independently from the decision for batch or flow processing. Another critical element was the higher energy demand of the flow processing plant including pumps and process control systems compared to the batch system. As a result, substantial savings up to 70% for the microreaction process were forecasted only under the constraint that the high electricity demand of the peripheral equipment can be reduced in an optimised production process.
These and further studies have shown that flow chemistry can provide powerful options to improve the environmental balance of chemical processes, but has to come along with benefits in yield/selectivity, energy management or solvent demand. Otherwise, the additional effort involved in increased process control will counterbalance the advantages.
Assessment of the environmental impacts of flow chemistry coupled with novel process windows conditions
Some years ago, Hessel introduced the concept of Novel Process Windows (NPW) in flow chemistry using microreaction technology.105 He argued that these smart devices allow the exploitation and intensification of chemistry under harsh process conditions. In the meantime, a broad range of experimental investigations in this area has been performed.106 Some of them were accompanied by comparative LCA studies in order to answer the question, whether NPW conditions will also result in a more environmentally efficient processing. | ||
| Scheme 5 Kolbe–Schmitt synthesis starting from resorcinol with a CO2-precursor giving 2,4-DHBA (target product) and 2,6-DHBA as by-product (Krtschil et al.107). | ||
The process was intensified using a microreaction process under NPW conditions applying high temperature (up to 250 °C) and pressure (up to 120 bar). Process design alternatives and several solvent concepts were critically compared by means of a Simplified LCA in order to develop a green process (Fig. 14).30 In addition, the application of microwave irradiation instead of oil bath heating was tested in order to increase the energy efficiency of the process. As active media, hydrogen carbonate containing water or ionic liquids, supercritical CO2 as well as Dimcarb, a liquid dimethylamine![[thin space (1/6-em)]](https://www.rsc.org/images/entities/char_2009.gif) :
:![[thin space (1/6-em)]](https://www.rsc.org/images/entities/char_2009.gif) CO2 (1.8
CO2 (1.8![[thin space (1/6-em)]](https://www.rsc.org/images/entities/char_2009.gif) :
:![[thin space (1/6-em)]](https://www.rsc.org/images/entities/char_2009.gif) 1) adduct, were investigated under different reaction conditions (e.g., temperature, pressure, concentration and molar ratio).
1) adduct, were investigated under different reaction conditions (e.g., temperature, pressure, concentration and molar ratio).
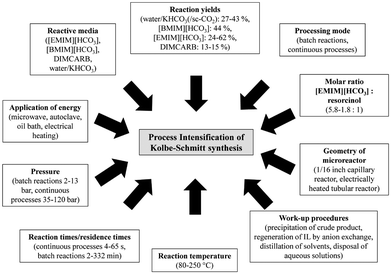 | ||
| Fig. 14 Concepts for PI of Kolbe–Schmitt synthesis by Kressirer et al.30 reprinted with permission from the American Chemical Society. | ||
The design accompanying a Simplified LCA using the LCIA methods CML 2002 and CED pointed out several hot spots for process design improvements compared to the reference, a batch process utilising aqueous KHCO3 at a reaction temperature of 100 °C under normal pressure. The application of supercritical carbon dioxide had an adverse impact on the reaction performance, but aqueous [EMIM][HCO3] or [BMIM][HCO3] led to significantly increased yields. Nevertheless, a greener process using these active solvents can only be realised in combination with an efficient recycling of these compounds.108 The authors explained this outcome with the high environmental impacts caused by the supply chain of the ionic liquids. All in all, the evaluation pointed out that the environmental balance of the Kolbe–Schmitt synthesis benefits from efficient work-up strategies and the utilisation of recyclable ionic liquids as active solvents rather than from harsh synthesis conditions or alternative forms of energy supply.
Three LCA studies were performed evaluating this topic in detail. In all cases, the same LCIA method, namely CML 2002, was used. This allows a good comparability of the results and provides the opportunity to build upon each other. At first, Morais et al. reported about the potential environmental impacts of different process design alternatives for biodiesel production from waste vegetable oils.109 The process design alternatives considered in this study included an alkali-catalysed process with a free fatty acid pre-treatment, an acid-catalysed process and a supercritical methanol process using propane as co-solvent. These processes were simulated using the process simulator ASPEN Plus®. The outcome of the study already proposed a supercritical processing of waste oil, using methanol as well as propane as co-solvents. The authors argued that although the supercritical methanol process is highly energy intensive, the downstream operation of methanol recovery and the product purification are much simpler, enabling a decrease in the overall energy consumption compared to the process alternatives with moderate reaction temperatures below 100 °C and normal pressure. An LCA study of Sawangkeaw and colleagues,110 again supported by process simulation, confirmed that supercritical processing under high temperature conditions of 400 °C can be beneficial also in the case of fresh vegetable oil (here: palm oil).
Based on this, Kralisch et al.76 recently performed a systematic LCA based decision support procedure for the best-suited process design of a biodiesel production process before a pilot plant construction. The development of the novel biodiesel production alternative was accompanied by process simulation, LCA, cost and risk analyses nearly from the beginning using an iterative evaluation procedure. They pointed out favorable process parameter combinations in parallel to experimental optimisation. The transesterification of waste oil via supercritical processing at a temperature of 380 °C and a pressure of 200 bar in intensifying continuous flow reactors was found to be the most favourable option out of eighteen and was transferred to a newly developed mini-plant design. It allows a reduction of the overall GWP up to 70% referred to the industrial established benchmark, utilising fresh vegetable oil under moderate process conditions, as well as a safe processing despite supercritical process conditions.
In summary, harsh process conditions in chemical production were found to be not per se critical for the environment. Despite the comparably high energy demand for heating, pressurizing or cooling, benefits in yield and/or simplified pre and post treatment can lead to green intensified processes.106
LCA and MOO for evaluating biomass to fuels and bio-based products
The use of biomass to produce bio-based fuel or commodity chemicals and the accompanying evaluation of eco-efficiency improvement, as shown in the above section, has gained increased importance within the last decade. This section introduces more selected examples.Recently, Patel et al. presented an early-stage sustainability assessment framework to analyse new bio-based process alternatives.112 The assessment relied on a multi-criteria approach, integrating the performance of chemical conversions based on five indicators into an index value. The indicators encompassed economics, environmental impact, hazards and risks, techno-economics and LCA. For each bio-based process, two R&D stages (current laboratory and expected future) were assessed against a comparable conventional process. The multi-criteria assessment in combination with an uncertainty and scenario analysis showed that the chemical production processes using biomass as a feedstock can provide potential sustainability benefits over conventional alternatives, but requires further development, especially in the case of biomass gasification and pyrolysis processes for fuel production.
Gerber and colleagues integrated the LCA methodology in thermo-economic process models for the conceptual design of combined fuel and electricity production from the lignocellulosic biomass.113 They formulated the LCI as a function of the design variables of the thermo-economic model and used a multi-objective optimisation algorithm to consider the environmental performance calculated by LCIA together with thermo-economic indicators as objective functions in process optimisation at an early stage of the synthesis process.
They argued that with a classical LCA approach, changes in process configuration or design conditions, effects of process integration, future installation size and technology evolution are often not considered or cannot be evaluated. Thus, typically only a few scenarios based on average technologies are discussed. The results of the study showed a non-correspondence of the thermodynamic optimum with the environmental optima, determined by means of the Eco-Indicator 9916 method (Fig. 15). The energy service substitution and therefore the increase in energy efficiency were key points for the reduction of environmental impacts, especially in the case of a process producing multiple energy services. The results of the multi-objective optimisation further highlighted the importance of the impact caused by logistics, auxiliary materials and off-site emissions associated with the process operation which are usually not accounted in a process design considering only thermo-economic objectives.
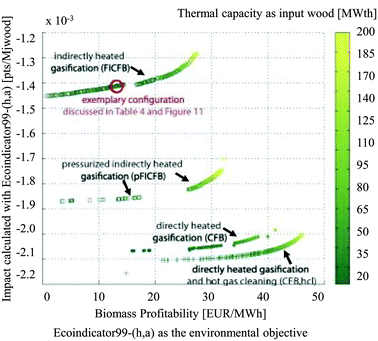 | ||
| Fig. 15 Results of multi-objective optimisation using the Eco-Indicator 99 impact as the environmental objective, biomass profitability as the economic objective, at a multiple scale113 reprinted with permission from Elsevier. | ||
The optimal design and operation of a hydrocarbon bio-refinery via fast pyrolysis, hydrotreating and hydrocracking for crude bio-oil production was investigated by Gebreslassie and colleagues.64 The authors applied a model that seeks to maximise the economic performance measured by the net present value (NPV) and to minimise the environmental impacts, described by means of the LCIA category GWP in a gate-to-gate analysis. The Pareto curve in Fig. 16 shows the optimal trade-off of several designs of the hydrocarbon bio-refinery. Each Pareto point represents an optimal design strategy for the hydro-carbon bio-refinery with a trade-off between the economic and environmental criteria NPV and GWP. As shown in Fig. 16, relative to the maximum NPV design (point C), the global GWP can be reduced to 63% at the expense of decreasing the NPV by 43%. In the other direction, the NPV is increased if GWP is increased as well. At the trade-off point B, the best compromise between these contradictory objectives was found. The study was complemented by an extended model of the bio-refinery including a number of major processing stages, such as drying of the cellulosic biomass feedstocks, the air separation unit, gasification, syngas conditioning, the Fischer–Tropsch synthesis, hydroprocessing, power generation, and diesel and gasoline production.68
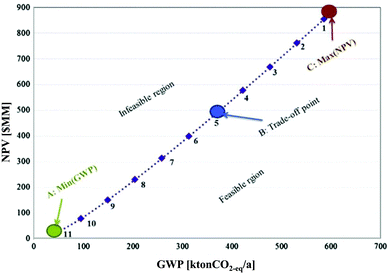 | ||
| Fig. 16 Pareto optimal curve for a hydrocarbon bio refinery64 reprinted with permission from Elsevier. | ||
These examples, together with the case studies of utilising biomass under harsh process conditions, as discussed before, provide a mixed message. The life cycle step of agricultural biomass generation is most often connected with significant environmental impacts, dominating the overall LCA balance.
Thus, careful process optimisation for high material and energy efficiency is required to come up with the best trade-off. MCDM and MOO are tools of high value bringing forward today's approaches for biomass utilisation.
LCA for green pharmaceutical processes
In the last few years, the life cycles of pharmaceuticals have also become a concern for many environmental scientists. However, so far only a few studies exist, since detailed production data on pharmaceuticals are not publicly available and their production parameters are usually kept confidential. Nevertheless, the following studies provided important insights into the optimisation potential of existing pharmaceutical production processes. | ||
| Fig. 17 Synthesis steps and their yields for the production of Galantamine·HBr evaluated by the LCA indicator CEENE15 reproduced with permission from The Royal Society of Chemistry. | ||
The solvent switch in particular, had an effect on the reduction of resource requirements. In the third generation of the process pathway optimisation, the sixth step was replaced by a continuous process using a flow reactor. The increased resource efficiency, by changing from the first till the third generation, resulted in a reduction of the overall resource consumption up to 41%, realised by new chemistry in combination with flow processing.
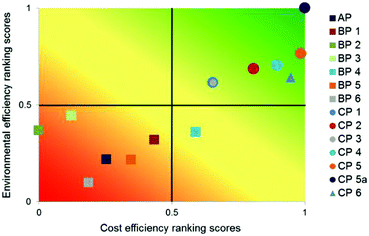 | ||
| Fig. 18 Multi-criteria outranking of API production alternatives according to their environmental and cost efficiency compared to the existing process AP; criteria weights: equal, linear minimisation of LCIA criteria and costs73 reproduced with permission from The Royal Society of Chemistry. | ||
These case studies show that the high effort required in the case of LCA studies of complex pharmaceutical processes is justified by the substantial improvement potential towards greener processing in this sector. Although the application of LCA metrics is still not a widespread practice in the pharmaceutical industry, its use is more common today than a decade ago in order to, e.g., compare different chemical routes, assess and select materials or to perform holistic LCAs of products (see also examples collected by Jiménez-González and Overcash).116
LCA applied in the nanotechnology sector
Nanotechnology is widely cited as “the defining technology for the 21st century”.117,118 The broad-impact nanotechnology sector offers advantages, but probably can also cause serious problems regarding environmental aspects within the life cycle of engineered nanomaterials, nanoproducts or nanostructured materials (as defined in, e.g., Som et al.119).Fig. 19 summarises possibilities and limitations of LCA in the context of engineered nanomaterials.123 Whereas data on material and energy input of engineered nanomaterials, e.g., carbon nanotubes, carbon nanofibers, nanosilver or nanoscale silica are well covered and also well reported in publications, there is only a partial or no data coverage or information regarding output related data, e.g., emissions to air, water and soil,118 often hindering a holistic LCA covering all life cycle stages.
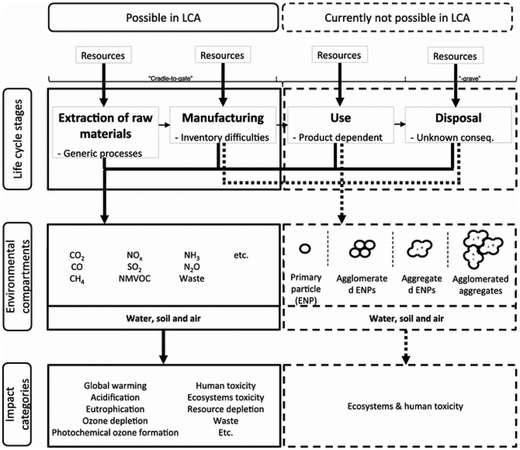 | ||
| Fig. 19 Limitations of LCA of engineered nanomaterials, according to Miseljic et al.123 with kind permission from Springer Science and Business Media. | ||
Hischier et al. further pointed out that in many case studies the use phase of engineered nanomaterials is claimed as the “stationary phase”, i.e., having no influence on the material or energy consumption in this stage.118 Though, these life cycle stages can have a significant effect on the overall environmental performance as shown above. As an example, Hischier et al. compared the difference in the CED value of carbon nanofibers, polypropylene and steel during material production, composite production and use phase in cars, thus performing a comparison based on functionality issues. The data basis were life cycle studies performed by Khanna and his co-workers, dealing with the life cycle energy consumption and environmental impact from carbon nanofiber and carbon nanofiber composites production as a possible replacement for steel in automobile body panels.124,125 From a material and composite production point of view, the LCA results indicated (partially significantly) higher life cycle energy intensities and environmental impacts of carbon nanofibers compared to conventional materials such as aluminium and steel. This assessment was based on a kilogram scale (see Fig. 20).124 However, by substituting steel by nanocomposite materials in the automobile body panels, the environmental burdens resulting from upstream processes can be significantly reduced due to, e.g., weight reduction, and thus reduced fossil energy consumption.125
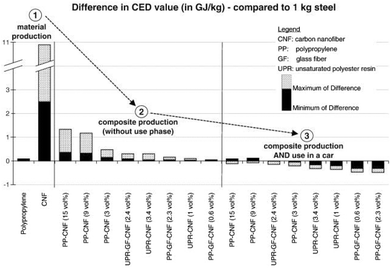 | ||
| Fig. 20 Difference in the CED value for material production, composite production and use in cars: carbon nanofiber, polypropylene compared to steel according to Hischier et al.118 using data from ref. 124, 125 reprinted with permission from Elsevier. | ||
Thus, it is of high importance to evaluate nanomaterials in the context of their entire life cycle (cradle-to-grave LCA) including production, application, (recycling) and disposal in order to quantify their benefits versus environmental impacts in a profound comparison against conventional alternative materials.
LCA for waste water treatment
Environmental issues related to wastewater treatment are numerous not only in the context of nanoparticles, and LCA applied to wastewater treatment is a field with approximately twenty years of experience. Corominas et al. have published a comprehensive review on this topic.126 Emerging waste water treatment technologies and techniques are being developed, being already commonly evaluated by means of LCA in order to compare them to the environmental efficiency of conventional technologies, see, e.g., ref. 126–130. Some examples are given below.Despite the supporting function of LCA also in chemical waste treatment, there are also some drawbacks and challenges to be handled in the future. Corominas et al.126 emphasised the need to develop standardised guidelines to ensure the quality of the LCA methodology application. In addition, the impact assessment methods need to be extended by further human and ecosystem health indicators to avoid problem shifting. Specific materials such as pathogens, pharmaceuticals or nanomaterials have not been integrated in databases yet. Thus, LCA methodologies need to be adapted to these new compounds, and ideally combined with tools like chemical and microbial risk analyses to provide a holistic analysis and decision-making for stakeholders in this sector.126,132
Conclusions
This review emphasises the need and usefulness of LCA approaches applied to chemical process and product design within various fields of research and development. Numerous case studies were presented, dealing with the assessment of applying emerging technologies and procedures, but also the optimisation of conventional processes to support the decision-making in research institutes, industry, and governmental and non-governmental organisations. They allowed the profound comparison of alternative concepts and thus provided an important support for the development of various green chemical processes and products during the last few years.Depending on the specific questions to be answered by the analysis, different life-cycle approaches (ranging from gate-to-gate to cradle-to-crave) and impact assessment methods were applied. Independent of the LCA software tool, the ecoinvent database6 was used in most case studies to model LCI data of up- and downstream processes caused by the chemical synthesis under investigation. CML 2002 was found to be the most preferential LCIA method among the users in green chemical process design, whereas the follow-up method ReCiPe was applied so far only in a few studies. The use of this method in future studies is highly recommended (in combination with the latest ecoinvent dataset) in order to improve the actuality, comparability and consistency of LCA studies. The assessment of energy-intensive chemical processes further strongly benefits from the consideration of energy-related impact categories such as CEENE.
However, besides promising opportunities for LCA studies to support green chemical designs, there are also several challenges to be coped with in the future: standardised guidelines on the dependency of the specific research field need to be developed in order to ensure the quality of the LCA methodology application.133
Especially against the background of new emerging technologies such as nanotechnology, more LCI data are required that allow one to consider the whole life cycle. LCIA assessment has to be extended by impact factors for a wider range of chemical and pharmaceutical compounds. Furthermore, only a few studies reported about sensitivity and/or uncertainty analyses or disclosed the quality of their database. Thus, standardised methods for data gap or uncertainty handling as well as common rules for sensitivity analyses are urgently required. Those measures would significantly improve the comparability and reliability of the wide range of studies dealing with chemical product or process design and implementation.
Abbreviations
| API | Active pharmaceutical ingredient |
| CC | Climate change |
| CED | Cumulative energy demand |
| CExD | Cumulative exergy demand |
| CEENE | Cumulative exergy extraction from the natural environment |
| CML | Institute of Environmental Sciences, University of Leiden, The Netherlands |
| EHS | Environmental, health and safety |
| GWP | Global warming potential |
| HTP | Human toxicity potential |
| IPCC | Intergovernmental Panel on Climate Change |
| LCI | Life cycle inventory |
| LCIA | Life cycle impact assessment |
| LCA | Life cycle assessment |
| LCC | Life cycle costing |
| MCDM | Multi-criteria decision making |
| MOO | Multi-objective optimisation |
| MWNT | Multi-walled carbon nanotubes |
| NPV | Net present value |
| PI | Process intensification |
| R&D | Research and development |
| SLCA | Simplified life cycle assessment |
Acknowledgements
The authors gratefully acknowledge the financial support provided by the European Community's 7th Framework Programme for Research and Technological Development under grant agreement no.: CP-IP 246095-2 POLYCAT.References
- EN ISO 14040, International Organisation for Standardisation, Geneva, 2006.
- EN ISO 14044, International Organisation for Standardisation, Geneva, 2006.
- L. Jacquemin, P.-Y. Pontalier and C. Sablayrolles, Int. J. Life Cycle Assess., 2012, 17, 1028–1041 CrossRef CAS.
- J. B. Guinée, R. Heijungs, G. Huppes, A. Zamagni, P. Masoni, R. Buonamici, T. Ekvall and T. Rydberg, Environ. Sci. Technol., 2011, 45, 90–96 CrossRef PubMed.
- Deutsches Institut für Normung e.V., Beuth Verlag GmbH, Berlin, 2006.
- Ecoinvent, v3.1, Ecoinvent Centre, Swiss Centre for Life Cycle Inventories, Dübendorf, Switzerland, 2014.
- A. Azapagic and R. Clift, Int. J. Life Cycle Assess., 1999, 4, 357–369 CrossRef CAS.
- A. Azapagic and R. Clift, Int. J. Life Cycle Assess., 2000, 5, 31–36 CrossRef.
- M. A. Curran, Int. J. Life Cycle Assess., 2006, 12, 65–78 Search PubMed.
- M. Goedkoop, R. Heijungs, M. Huijbregts, A. D. Schryver, J. Struijs and R. v. Zelm, ReCiPe 2008 - A life cycle impact assessment method which comprises harmonised category indicators at the midpoint and the endpoint level, Ministerie van Volkshuisvesting, Ruimtelijke Ordering en Milieubeheer, Den Hague, 2013 Search PubMed.
- M. Hauschild, M. Goedkoop, J. Guinée, R. Heijungs, M. Huijbregts, O. Jolliet, M. Margni, A. Schryver, S. Humbert, A. Laurent, S. Sala and R. Pant, Int. J. Life Cycle Assess., 2013, 18, 683–697 CrossRef CAS.
- J. Buchgeister, Umwelt-Medizin-Gesellschaft, 2012, 25, 12–21 Search PubMed.
- W. Klöpffer and B. Grahl, Ökobilanz (LCA), WILEY-VCH Verlag GmbH & Co kGaA, Weinheim, 2009 Search PubMed.
- J. B. Guinée, M. Gorrée, R. Heijungs, G. Huppes, R. Kleijn, A. de Koning, L. van Oers, A. Wegener Sleeswijk, S. Suh, H. A. Udo de Haes, H. de Bruijn, R. van Duin and M. A. J. Huijbregts, Handbook on Life Cycle Assessment Operational Guide to the ISO Standards, Kluwer Academic Publishers, Dordrecht, 2002 Search PubMed.
- O. Jolliet, M. Margni, R. Charles, S. Humbert, J. Payet, G. Rebitzer and R. Rosenbaum, Int. J. Life Cycle Assess., 2003, 8, 324–330 CrossRef.
- M. Goedkoop and R. Spriensma, Eco-indicator 99 Manual for Designers, Ministry of Housing, Spatial Planning and the Environment, Den Haag, 2000 Search PubMed.
- P. Forster, V. Ramaswamy, P. Artaxo, T. Berntsen, R. Betts, D. W. Fahey, J. Haywood, J. Lean, D. C. Lowe, G. Myhre, J. Nganga, R. Prinn, G. Raga, M. Schulz and R. Van Dorland, in Climate Change 2007: The Physical Science Basis. Contribution of Working Group I to the Fourth Assessment Report of the Intergovernmental Panel on Climate Change, ed. S. Solomon, D. Qin, M. Manning, Z. Chen, M. Marquis, K. B. Averyt, M. Tignor and H. L. Miller, Cambridge University Press, Cambridge, 2007 Search PubMed.
- Contribution of Working Group I to the Fourth Assessment Report of the Intergovernmental Panel on Climate Change, ed. S. Solomon, D. Qin, M. Manning, Z. Chen, M. Marquis, K. B. Averyt, M. Tignor and H. L. Miller, Intergovernmental Panel on Climate Change, Cambridge, United Kingdom and New York, NY, USA, 2007 Search PubMed.
- R. Frischknecht, R. Heijungs and P. Hofstetter, Int. J. Life Cycle Assess., 1998, 3, 266–272 CrossRef CAS.
- VDI-Standard: VDI 4600, Cumulative energy demand (KEA) – Terms, definitions, methods of calculation, The Association of German Engineers (VDI), Düsseldorf, Germany, 2012 Search PubMed.
- M. A. J. Huijbregts, S. Hellweg, R. Frischknecht, H. W. M. Hendriks, K. Hungerbuehler and A. J. Hendriks, Environ. Sci. Technol., 2010, 44, 2189–2196 CrossRef CAS PubMed.
- M. A. J. Huijbregts, L. J. A. Rombouts, S. Hellweg, R. Frischknecht, A. J. Hendriks, D. van de Meent, A. M. J. Ragas, L. Reijnders and J. Struijs, Environ. Sci. Technol., 2005, 40, 641–648 CrossRef.
- G. Wernet, S. Hellweg, U. Fischer, S. Papadokonstantakis and K. Hungerbuehler, Environ. Sci. Technol., 2008, 42, 6717–6722 CrossRef CAS PubMed.
- G. Wernet, S. Papadokonstantakis, S. Hellweg and K. Hungerbuehler, Green Chem., 2009, 11, 1826–1831 RSC.
- M. Bösch, S. Hellweg, M. J. Huijbregts and R. Frischknecht, Int. J. Life Cycle Assess., 2007, 12, 181–190 CrossRef.
- J. Dewulf, M. E. Boesch, M. B. De, d. V. G. Van, L. H. Van, S. Hellweg and M. A. J. Huijbregts, Environ. Sci. Technol., 2007, 41, 8477–8483 CrossRef CAS PubMed.
- G. Van der Vorst, J. Dewulf, W. Aelterman, W. B. De and L. H. Van, Environ. Sci. Technol., 2011, 45, 3040–3046 CrossRef CAS PubMed.
- G. Van der Vorst, W. Aelterman, W. B. De, B. Heirman, L. H. Van and J. Dewulf, Green Chem., 2013, 15, 744–748 RSC.
- D. Kralisch, I. Streckmann, D. Ott, U. Krtschil, E. Santacesaria, M. Di Serio, V. Russo, L. De Carlo, W. Linhart, E. Christian, B. Cortese, M. H. J. M. de Croon and V. Hessel, ChemSusChem, 2012, 5, 300–311 CrossRef CAS PubMed.
- S. Kressirer, D. Kralisch, A. Stark, U. Krtschil and V. Hessel, Environ. Sci. Technol., 2013, 47, 5362–5371 CrossRef CAS PubMed.
- M. A. J. Huijbregts, U. Thissen, T. Jager, D. van de Meent and A. M. J. Ragas, Chemosphere, 2000, 41, 575–588 CrossRef CAS PubMed.
- M. J. Huijbregts, G. Norris, R. Bretz, A. Ciroth, B. Maurice, B. von Bahr, B. Weidema and A. H. de Beaufort, Int. J. Life Cycle Assess., 2001, 6, 127–132 CrossRef.
- B. P. Weidema and M. S. Wesnæs, J. Cleaner Prod., 1996, 4, 167–174 CrossRef.
- D. Kralisch, in Green Chemistry Metrics, John Wiley & Sons, Ltd, 2009, pp. 248–271 Search PubMed.
- M. Pehnt, Renewable Energy, 2006, 31, 55–71 CrossRef.
- G. Finnveden, M. Z. Hauschild, T. Ekvall, J. Guinée, R. Heijungs, S. Hellweg, A. Koehler, D. Pennington and S. Suh, J. Environ. Manage., 2009, 91, 1–21 CrossRef PubMed.
- J. A. Assies, J. Hazard. Mater., 1998, 61, 23–29 CrossRef CAS.
- C. Hendrickson, A. Horvath, S. Joshi and L. Lave, Environ. Sci. Technol., 1998, 32, 184A–191A CrossRef CAS.
- S. Suh, M. Lenzen, G. J. Treloar, H. Hondo, A. Horvath, G. Huppes, O. Jolliet, U. Klann, W. Krewitt, Y. Moriguchi, J. Munksgaard and G. Norris, Environ. Sci. Technol., 2003, 38, 657–664 CrossRef.
- D. Russo and C. Rizzi, Comput. Ind., 2014, 65, 470–479 CrossRef.
- Z. Cui, F. Meng, J. Hong, X. Li and X. Ren, J. Biosci. Bioeng., 2012, 113, 765–770 CrossRef CAS PubMed.
- A. Stark, S. Huebschmann, M. Sellin, D. Kralisch, R. Trotzki and B. Ondruschka, Chem. Eng. Technol., 2009, 32, 1730–1738 CrossRef CAS.
- K. Christiansen, N. van den Berg, R. Haydock, M. ten Houten, S. Kotaji, E. Oerlemans, W.-P. Schmidt, H. K. Stranddorf, A. Weidenhaupt and P. R. White, Simplifying LCA: Just a Cut?, Society of Environmental Toxicology and Chemistry Europe, Brussels, 1997 Search PubMed.
- T. Hur, J. Lee, J. Ryu and E. Kwon, J. Environ. Manage., 2005, 75, 229–237 CrossRef PubMed.
- A. D. Curzons, C. Jiménez-González, A. L. Duncan, D. J. C. Constable and V. L. Cunningham, Int. J. Life Cycle Assess., 2007, 12, 272–280 CrossRef CAS.
- G. Rebitzer and D. Hunkeler, Int. J. Life Cycle Assess., 2003, 8, 253–256 CrossRef.
- I. Sell, D. Ott and D. Kralisch, ChemBioEng Rev., 2014, 1, 50–56 CrossRef CAS.
- C. Benoît, G. Norris, S. Valdivia, A. Ciroth, A. Moberg, U. Bos, S. Prakash, C. Ugaya and T. Beck, Int. J. Life Cycle Assess., 2010, 15, 156–163 CrossRef.
- D. Meyer and V. K. Upadhyayula, Clean Technol. Environ. Policy, 2014, 16, 757–772 CrossRef.
- G. Koller, U. Fischer and K. Hungerbuehler, Ind. Eng. Chem. Res., 2000, 39, 960–972 CrossRef CAS.
- H. Sugiyama, U. Fischer and K. Hungerbuehler, The EHS Tool, ETH Zurich, Safety & Environmental Technology Group, Zurich, 2006, http://sust-chem.ethz.ch/tools/EHS Search PubMed.
- H. Sugiyama, U. Fischer, K. Hungerbuehler and M. Hirao, AIChE J., 2008, 54, 1037–1053 CrossRef CAS.
- A. D. Bojarski, G. Guillen-Gosalbez, L. Jimenez, A. Espuna and L. Puigjaner, Ind. Eng. Chem. Res., 2008, 47, 8286–8300 CrossRef CAS.
- T. L. Saaty, The Analytic Hierarchy Process: Planning, Priority Setting, Resource Allocation, McGraw-Hill, 1980 Search PubMed.
- T. L. Saaty and N. Begicevic, Int. J. Econ. Bus. Res., 2012, 4, 266–283 CrossRef.
- B. Roy, La Revue d'Informatique et de Recherche Opérationelle (RIRO), 1968, 8, 57–75 Search PubMed.
- J. P. Brans and P. Vincke, Manage. Sci., 1985, 31, 647–656 CrossRef.
- M. Behzadian, R. B. Kazemzadeh, A. Albadvi and M. Aghdasi, Eur. J. Oper. Res., 2010, 200, 198–215 CrossRef.
- A. Azapagic and S. Perdan, Int. J. Sustainable Dev. World, 2005, 12, 98–111 CrossRef.
- A. Azapagic and S. Perdan, Int. J. Sustainable Dev. World, 2005, 12, 112–131 CrossRef.
- V. Polshettiwar and R. S. Varma, Non-conventional energy sources for green synthesis in water (microwave, ultrasound, and photo), 2010 Search PubMed.
- D. Bouyssou, in Encyclopedia of Optimization, ed. C. A. Floudas and P. M. Pardalos, Springer US, 2009, ch. 495, pp. 2887–2893 Search PubMed.
- D. Kralisch, D. Reinhardt and G. Kreisel, Green Chem., 2007, 9, 1308–1318 RSC.
- B. H. Gebreslassie, M. Slivinsky, B. Wang and F. You, Comput. Chem. Eng., 2013, 50, 71–91 CrossRef CAS.
- V. Pareto, Cours D'Economie Politique, Lausanne, 1896 Search PubMed.
- A. Ouattara, L. Pibouleau, C. Azzaro-Pantel, S. Domenech, P. Baudet and B. Yao, Comput. Chem. Eng., 2012, 36, 174–188 CrossRef CAS.
- L. Gerber, S. Fazlollahi and F. Marechal, Comput. Chem. Eng., 2013, 59, 2–16 CrossRef CAS.
- B. Wang, B. H. Gebreslassie and F. You, Comput. Chem. Eng., 2013, 52, 55–76 CrossRef CAS.
- F. You, L. Tao, D. J. Graziano and S. W. Snyder, AIChE J., 2012, 58, 1157–1180 CrossRef CAS.
- D. Cerri, M. Taisch and S. Terzi, in Advances in Production Management Systems. Competitive Manufacturing for Innovative Products and Services, ed. C. Emmanouilidis, M. Taisch and D. Kiritsis, Springer Berlin Heidelberg, 2013, vol. 397, ch. 49, pp. 391–396 Search PubMed.
- A. Azapagic and R. Clift, J. Cleaner Prod., 1999, 7, 135–143 CrossRef.
- D. Kralisch, D. Ott, S. Kressirer, C. Staffel, I. Sell, U. Krtschil and P. Loeb, Green Process. Synth., 2013, 2, 465–478 CAS.
- D. Ott, D. Kralisch, I. Denčic, V. Hessel, Y. Laribi, P. D. Perrichon, C. Berguerand, L. Kiwi-Minsker and P. Loeb, ChemSusChem, 2014 DOI:10.1002/cssc.201402313.
- P. Saling, in Karlsruher Schriften zur Geographie und Ökologie, 2007, vol. 22, pp. 1–115 Search PubMed.
- D. Kolsch, P. Saling, A. Kicherer, A. Grosse-Sommer and I. Schmidt, Int. J. Sustainable Dev., 2008, 11, 1–23 CrossRef.
- D. Kralisch, C. Staffel, D. Ott, S. Bensaid, G. Saracco, P. Bellantoni and P. Loeb, Green Chem., 2013, 15, 463–477 RSC.
- v. H. A. Kalkeren, A. L. Blom, F. P. J. T. Rutjes and M. A. J. Huijbregts, Green Chem., 2013, 15, 1255–1263 RSC.
- O. G. Griffiths, R. E. Owen, J. P. O'Byrne, D. Mattia, M. D. Jones and M. C. McManus, RSC Adv., 2013, 3, 12244–12254 RSC.
- A. L. Roes and M. K. Patel, J. Cleaner Prod., 2011, 19, 1659–1667 CrossRef CAS.
- S. Kressirer, L. N. Protasova, M. H. J. M. de Croon, V. Hessel and D. Kralisch, Green Chem., 2012, 14, 3034–3046 RSC.
- M. T. Musser, Ullmann's Encyclopedia of Industrial Chemistry, Adipic Acid, Wiley-VCH Verlag GmbH & Co. KGaA, Weinheim, 7th edn, 2009 Search PubMed.
- T. Polen, M. Spelberg and M. Bott, J. Biotechnol., 2013, 167, 75–84 CrossRef CAS PubMed.
- Q. Wang, I. Vural-Gürsel, M. Shang and V. Hessel, Chem. Eng. J., 2013, 234, 300–311 CrossRef CAS.
- J. B. J. H. van Duuren, B. Brehmer, A. E. Mars, G. Eggink, V. A. P. M. dos Santos and J. P. M. Sanders, Biotechnol. Bioeng., 2011, 108, 1298–1306 CrossRef CAS PubMed.
- S. Huebner, S. Kressirer, D. Kralisch, C. Bludszuweit-Philipp, K. Lukow, I. Jänich, A. Schilling, H. Hieronymus, C. Liebner and K. Jähnisch, ChemSusChem, 2012, 5, 279–288 CrossRef CAS PubMed.
- F. Schneider, T. Szuppa, A. Stolle, B. Ondruschka and H. Hopf, Green Chem., 2009, 11, 1894–1899 RSC.
- C. M. McLoughlin, W. A. M. McMinn and T. R. A. Magee, Food Bioprod. Process., 2000, 78, 90–96 CrossRef CAS.
- H. K. Solanki, V. D. Prajapati and G. K. Jani, Int. J. PharmTech Res., 2010, 2, 1754–1761 CAS.
- N. G. Patil, A. I. G. Hermans, F. Benaskar, E. Rebrov, J. Meuldijk, L. A. Hulshof, V. Hessel and J. C. Schouten, AIChE J., 2012, 58, 3144–3155 CrossRef CAS.
- C. Capello, U. Fischer and K. Hungerbuehler, Green Chem., 2007, 9, 927–934 RSC.
- C. Capello, S. Hellweg and K. Hungerbuehler, J. Ind. Ecol., 2008, 12, 111–127 CrossRef.
- C. Capello, S. Hellweg, B. Badertscher, H. Betschart and K. Hungerbuehler, J. Ind. Ecol., 2007, 11, 26–38 CrossRef CAS.
- A. Amelio, G. Genduso, S. Vreysen, P. Luis and B. Van der Bruggen, Green Chem., 2014, 16, 3045–3063 RSC.
- C. S. Slater, M. J. Savelski, T. M. Moroz and M. J. Raymond, Green Chem. Lett. Rev., 2011, 5, 55–64 CrossRef.
- Y. Gaber, U. Tornvall, M. A. Kumar, M. Ali Amin and R. Hatti-Kaul, Green Chem., 2011, 13, 2021–2025 RSC.
- P. Luis, A. Amelio, S. Vreysen, V. Calabro and B. Bruggen, Int. J. Life Cycle Assess., 2013, 18, 1048–1061 CrossRef CAS.
- R. Hischier, The method of ecological scarcity (Umweltbelastungspunkte, UBP'97), Implementation of Life Cycle Impact Assessment Methods, EMPA, Dübendorf, 2004 Search PubMed.
- Handbook of Green Chemistry - Green Solvents, ed. P. Wasserscheid and A. Stark, Wiley-VCH Verlag GmbH & Co. KGaA, 2010 Search PubMed.
- Y. Zhang, B. R. Bakshi and E. S. Demessie, Environ. Sci. Technol., 2008, 42, 1724–1730 CrossRef CAS PubMed.
- D. Reinhardt, F. Ilgen, D. Kralisch, B. Konig and G. Kreisel, Green Chem., 2008, 10, 1170–1181 RSC.
- D. Kralisch, A. Stark, S. Koersten, G. Kreisel and B. Ondruschka, Green Chem., 2005, 7, 301–309 RSC.
- D. Kralisch and G. Kreisel, Chem. Eng. Sci., 2007, 62, 1094–1100 CrossRef CAS.
- S. Huebschmann, D. Kralisch, H. Loewe, D. Breuch, J. H. Petersen, T. Dietrich and R. Scholz, Green Chem., 2011, 13, 1694–1707 RSC.
- S. Huebschmann, D. Kralisch, V. Hessel, U. Krtschil and C. Kompter, Chem. Eng. Technol., 2009, 32, 1757–1765 CrossRef CAS.
- V. Hessel, Chem. Eng. Technol., 2009, 32, 1655–1681 CrossRef CAS.
- V. Hessel, D. Kralisch, N. Kockmann, T. Noël and Q. Wang, ChemSusChem, 2013, 6, 746–789 CrossRef CAS PubMed.
- U. Krtschil, V. Hessel, P. Loeb, D. Reinhard, S. Huebschmann and D. Kralisch, Chem. Eng. J., 2011, 167, 510–518 CrossRef CAS.
- S. Kressirer, D. Kralisch, A. Stark, U. Krtschil and V. Hessel, Environ. Sci. Technol., 2013, 47, 5362–5371 CrossRef CAS PubMed.
- S. Morais, T. M. Mata, A. A. Martins, G. A. Pinto and C. A. V. Costa, J. Cleaner Prod., 2010, 18, 1251–1259 CrossRef CAS.
- R. Sawangkeaw, S. Teeravitud, P. Piumsomboon and S. Ngamprasertsith, Bioresour. Technol., 2012, 120, 6–12 CrossRef CAS PubMed.
- D. Kusdiana and S. Saka, Fuel, 2001, 80, 693–698 CrossRef CAS.
- A. D. Patel, K. Meesters, H. den Uil, E. de Jong, E. Worrell and M. K. Patel, ChemSusChem, 2013, 6, 1724–1736 CrossRef CAS PubMed.
- L. Gerber, M. Gassner and F. Maréchal, Comput. Chem. Eng., 2011, 35, 1265–1280 CrossRef CAS.
- G. Wernet, S. Conradt, H. Isenring, C. Jiménez-González and K. Hungerbuehler, Int. J. Life Cycle Assess., 2010, 15, 294–303 CrossRef CAS.
- I. Dencic, D. Ott, D. Kralisch, T. Noel, J. Meuldijk, M. De Croon, V. Hessel, Y. Laribi and P. Perrichon, Org. Process Res. Dev., Article ASAP, 2014 DOI:10.1021/op5000573.
- C. Jiménez-González and M. R. Overcash, Green Chem., 2014, 16, 3392–3400 RSC.
- A. Arnall and D. Parr, Technol. Soc., 2005, 27, 23–38 CrossRef.
- R. Hischier and T. Walser, Sci. Total Environ., 2012, 425, 271–282 CrossRef CAS PubMed.
- C. Som, M. Berges, Q. Chaudhry, M. Dusinska, T. F. Fernandes, S. I. Olsen and B. Nowack, Toxicology, 2010, 269, 160–169 CrossRef CAS PubMed.
- O. G. Griffiths, J. P. O'Byrne, L. Torrente-Murciano, M. D. Jones, D. Mattia and M. C. McManus, J. Cleaner Prod., 2013, 42, 180–189 CrossRef CAS.
- A. Anctil, C. W. Babbitt, R. P. Raffaelle and B. J. Landi, Environ. Sci. Technol., 2011, 45, 2353–2359 CrossRef CAS PubMed.
- T. Walser, E. Demou, D. J. Lang and S. Hellweg, Environ. Sci. Technol., 2011, 45, 4570–4578 CrossRef CAS PubMed.
- M. Miseljic and S. Olsen, J. Nanopart. Res., 2014, 16, 1–33 CrossRef CAS.
- V. Khanna, B. R. Bakshi and L. J. Lee, J. Ind. Ecol., 2008, 12, 394–410 CrossRef CAS.
- V. Khanna and B. R. Bakshi, Environ. Sci. Technol., 2009, 43, 2078 CrossRef CAS PubMed.
- L. Corominas, J. Foley, J. S. Guest, A. Hospido, H. F. Larsen, S. Morera and A. Shaw, Water Res., 2013, 47, 5480–5492 CrossRef CAS PubMed.
- J. Foley, D. de Haas, K. Hartley and P. Lant, Water Res., 2010, 44, 1654–1666 CrossRef CAS PubMed.
- I. Muñoz, J. Rieradevall, F. Torrades, J. Peral and X. Domènech, Sol. Energy, 2005, 79, 369–375 CrossRef.
- J. M. Foley, R. A. Rozendal, C. K. Hertle, P. A. Lant and K. Rabaey, Environ. Sci. Technol., 2010, 44, 3629–3637 CrossRef CAS PubMed.
- N. Tangsubkul, K. Parameshwaran, S. Lundie, A. G. Fane and T. D. Waite, J. Membr. Sci., 2006, 284, 214–226 CrossRef CAS.
- P. Yaseneva, C. F. Marti, E. Palomares, X. Fan, T. Morgan, P. S. Perez, M. Ronning, F. Huang, T. Yuranova, L. Kiwi-Minsker, S. Derrouiche and A. A. Lapkin, Chem. Eng. J., 2014, 248, 230–241 CrossRef CAS.
- S. Renou, J. S. Thomas, E. Aoustin and M. N. Pons, J. Cleaner Prod., 2008, 16, 1098–1105 CrossRef.
- M. A. Curran, Life Cycle Assessment Handbook: A Guide for Environmentally Sustainable Products, Wiley, 2012 Search PubMed.
| This journal is © The Royal Society of Chemistry 2015 |


