 Open Access Article
Creative Commons Attribution 3.0 Unported Licence
Fast, energy-efficient synthesis of luminescent carbon quantum dots†
Yongsheng
Li
a,
Xiaoxia
Zhong
*a,
Amanda E.
Rider
bc,
Scott A.
Furman
d and
Kostya (Ken)
Ostrikov
*bc
aKey Laboratory for Laser Plasmas (Ministry of Education) and Department of Physics and Astronomy, State Key Laboratory of Advanced Optical Communication Systems and Networks, Shanghai Jiao Tong University, Shanghai 200240, China. E-mail: xxzhong@sjtu.edu.cn
bCSIRO Materials Science & Engineering, Lindfield, NSW 2070, Australia
cSchool of Physics, The University of Sydney, NSW 2006, Australia. E-mail: Kostya.Ostrikov@csiro.au
dCSIRO Materials Science & Engineering, Lindfield, NSW 2070, Australia
First published on 25th February 2014
Abstract
A simple, fast, energy and labour efficient, carbon dot synthesis method involving only the mixing of a saccharide and base is presented. Uniform, green luminescent carbon dots with an average size of 3.5 nm were obtained, without the need for additional energy input or external heating. Detection of formation moment for fructose–NaOH-produced carbon dots is also presented.
Introduction
Since their recent discovery, carbon quantum dots (C-dots)1 have been subject to extensive multidisciplinary research due, most notably, to their promising luminescence properties – in particular their chemiluminescence,2 tunable excitation and emission spectra,3,4 non-blinking fluorescent emission,3,5 large two-photon excitation cross section2 and two photon excitation in the near infrared.6 Another benefit over traditional quantum dots (QDs) is that C-dots have higher biocompatibility and less toxicity compared to metal/semiconductor based QDs.7–9 These properties have led to the recognition of the outstanding potential of C-dots for a range of applications such as bio-imaging, bio-labelling, biomedicine, optoelectronic devices and sensors,7 nano carriers for gene delivery,10 sensitizers for solar cells,10 peroxidase mimetic compound for dyes degradation,7 as well as photo-catalysis.11A wide variety of methods have been used to produce C-dots including strong acidic and electrochemical oxidation,10 ultrasonic methods, hydrothermal treatment,10 pyrolysis of glycerol,11 laser ablation of graphite11 and microwave-assisted synthesis,2,3,7 exfoliation in organic solvent by modified Hummer's method,12 thermal annealing of BBQ char,13 thermal carbonization of molecules,7 as well as atmospheric plasma-based synthesis.14,15 More exotic precursors such as paper,16 capsicum17 and watermelon peel18 have also been used. These methods have many limitations, from complicated experimental set-ups and labor-intensive operation, through to the need for strong acids, high energy consumption and significantly high synthesis temperature and operating times which is not conducive for establishing a green synthesis method.19
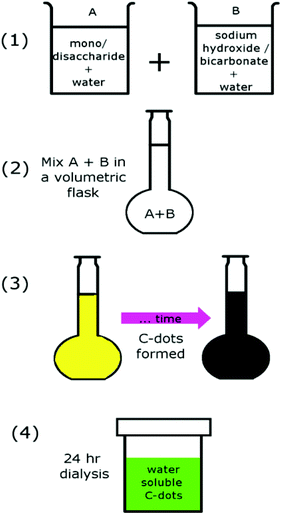
In contrast, here we present a simple, energy-efficient synthesis method for the production of green luminescent C-dots. This method is energy, material, and labour efficient. Indeed, the only steps required are mixing saccharide and basic solutions, leaving them alone for a relatively short period of time and then dialysing to obtain C-dots (Scheme 1).
The process does not need acidic catalysts, external heating or additional energy input. A range of saccharide and base source materials are considered in this paper. However, an emphasis is placed on a fructose/sodium hydroxide combination which is used to demonstrate the real time detection of the moment of C-dot formation, something which is exceedingly difficult if complicated apparatus and high temperatures are involved in the synthesis process. It should be noted that this method adheres to a number of the principles of green chemistry,20 namely: maximising the atom economy, increasing energy efficiency (i.e. room temperatures and pressures used), using renewable precursor materials (e.g., the saccharides) and real time analysis during synthesis.
Experimental methods
A monosaccharide (D-fructose: AMRESCO Inc.) and a disaccharide (Maltose, Sinopharm Chemical Reagent Co., Ltd) were used as the source material for the C-dots with 2 different base solutions (NaOH and NaHCO3, Pinghu Chemical Reagent Factory and Sinopharm Chemical Reagent Co., Ltd, respectively) being considered. The first step was the dissolution of the saccharide in water to form a 500 mM solution. In a separate beaker, the NaOH or NaHCO3 was dissolved to form a 500 mM solution (excepting the fructose–NaHCO3 case where the NaHCO3 solution was maintained at 250 mM). The concentration of the solutions appears to be critical, here the reactant concentrations were chosen to lead to the formation of C-dots (detected by changes in solution colour and subsequent luminescence when irradiated with a laser) under conditions without any external heating. If the concentrations are not high enough, additional energy (i.e., via external heating sources) is required to initiate C-dot nucleation and growth. The two solutions were then added to a volumetric flask, whereupon additional water was added to bring the volume up to 100 mL. In general, the resultant mixtures (saccharide/base combinations) were initially colourless, after which some became yellowish and transparent. A 24 hour dialysis process was undertaken approximately a week after mixing and yielded water-soluble C-dots. The samples were then exposed to a 405 nm laser source, whereupon the mixtures exhibited green fluorescence (see ESI, Fig. S1†).The fructose–NaOH-based C-dots were selected for further study via transmission electron microscopy (TEM, both standard and high-resolution), fluorescence spectroscopy (Perkin Elmer, Ls 55, Fluorescence spectrometer), UV-Vis absorption spectroscopy (Avaspec-2048-2-USB2), Fourier Transform Infrared (FTIR) spectroscopy (Nicolet 6700, Thermo Scientific) and Raman spectroscopy (Jobin-Yvon LabRAM HR 800 UV micro-Raman spectrometer, 325 nm He–Cd laser). The TEM particle size distribution was obtained by a standard digital image processing using the software program DigitalMicroGraph.
Results and discussion
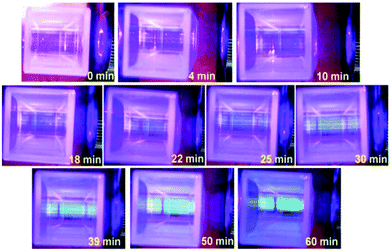
The fructose–NaOH mixture was studied more closely immediately after mixing (prior to dialysis), with a 405 nm laser. The mixture started to exhibit visible luminescence between 18 and 22 minutes after the fructose and NaOH solutions had been combined (see Fig. 1), which indicates that an appreciable amount of C-dots had begun to form around that time. The glow became progressively stronger up until 60 min, indicating an increased population of C-dots.A TEM image and accompanying particle size distribution (PSD) of the C-dots produced from fructose–NaOH is provided in Fig. 2(a) and (b), respectively. The PSD peaks around 3.5 nm and is relatively size uniform. High-resolution TEMs were taken for a more in-depth look at the interplanar distances in the C-dots and are provided in Fig. 3. The C-dots exhibit interplanar spacings a, which match the (1,1,1) plane of diamond [a = 2.050 Å],21 (1,0,0) plane of graphite [a = 2.119 Å], and the (0,0,3) plane of graphite [a = 3.350 Å], respectively.
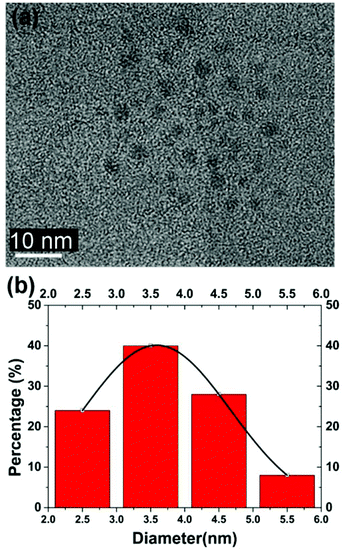 | ||
| Fig. 2 (a & b) Example TEM image and associated particle size distribution for fructose–NaOH produced C-dots. Scale bar is in white. | ||
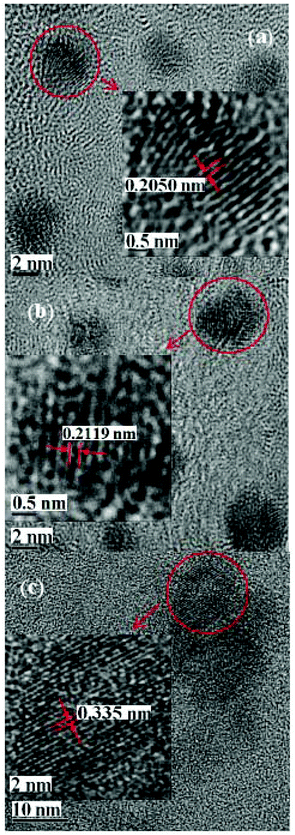 | ||
| Fig. 3 High resolution TEMs of C-dots. The inter-planar spacing is indicated on the figures, the scale bars are in black. | ||
We can conclude from the HRTEM micrographs in Fig. 3 where we show the magnified areas from different selected C-dots combined with the high G/D peak ratio in the Raman spectrum in Fig. 4a (an indication of the good-quality graphitic structure) that there are a range of crystalline orientations present in the C-dots. In the study of graphitic carbon nanomaterials, these two techniques are considered complementary and sufficient to confirm the crystalline quality of the C-dots.
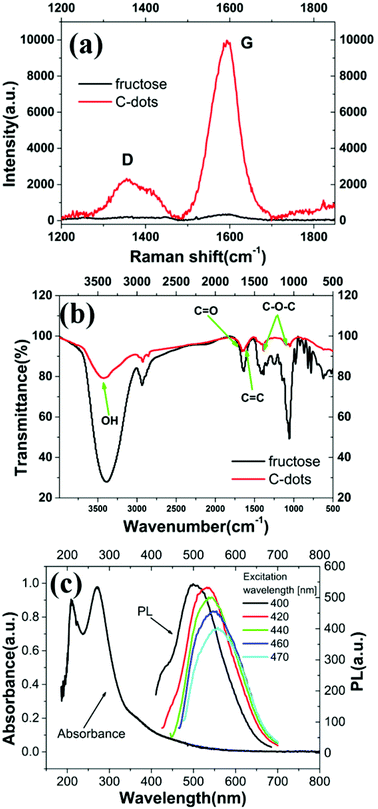 | ||
| Fig. 4 (a) Raman and (b) FTIR spectra of fructose and C-dots. (c) UV-Vis absorption and photoluminescence spectra for C-dots. | ||
Vibrational spectroscopy data are provided in Fig. 4. The Raman spectra of both fructose and C-dots are included in Fig. 4(a). The peak at ∼1590 cm−1 (the G peak, attributed to sp2-hybridised carbons) is the dominant feature in the spectra. The C-dot spectrum in Fig. 4(a) upon de-convolution (see ESI, Section S2†) also shows 2 weaker peaks around ∼1357 and ∼1418 cm−1. Based on the strength of the G peak in the Raman spectra, we can conclude that the majority of C-dots produced in this manner are predominantly graphitic in nature. The FTIR spectra in Fig. 4(b) indicates the presence of –OH functional groups, C![[double bond, length as m-dash]](https://www.rsc.org/images/entities/char_e001.gif) C bonds,22 C–H and C–O stretching, C–C vibration as well as a peak at 1380 cm−1 which could be partly indicative of a C–O–C asymmetric stretch or C–H bending arising from a methyl functional group (further details in ESI, Section S3†). The photoluminescence (PL) and UV-Vis absorption spectra are shown in Fig. 4(c). The absorbance peaks are ∼210 and 270 nm. It is clear from Fig. 1a and 4(c) that the C-dots emit in the green band (PL varies from nearly 500 to more than 550 nm when excited from 400 to 470 nm).
C bonds,22 C–H and C–O stretching, C–C vibration as well as a peak at 1380 cm−1 which could be partly indicative of a C–O–C asymmetric stretch or C–H bending arising from a methyl functional group (further details in ESI, Section S3†). The photoluminescence (PL) and UV-Vis absorption spectra are shown in Fig. 4(c). The absorbance peaks are ∼210 and 270 nm. It is clear from Fig. 1a and 4(c) that the C-dots emit in the green band (PL varies from nearly 500 to more than 550 nm when excited from 400 to 470 nm).
The quantum yield of C-dots synthesized from fructose–NaOH is presented in Table 1. The C-dot quantum yield was calculated relative to that of quinine sulphate, a standard fluorescent substance (known quantum yield of 54% at the wavelengths of interest), via the equation:23
 | (1) |
| Excitation wavelength | I QS | A QS | Φ QS (%) | I S | A S | Φ S (%) |
|---|---|---|---|---|---|---|
| 350 | 317![[thin space (1/6-em)]](https://www.rsc.org/images/entities/char_2009.gif) 383 383 |
0.0747 | 54 | 1867.03 | 0.019 | 1.2 |
| 360 | 286![[thin space (1/6-em)]](https://www.rsc.org/images/entities/char_2009.gif) 334.2 334.2 |
0.0612 | 54 | 1924.63 | 0.0174 | 1.2 |
| 370 | 177![[thin space (1/6-em)]](https://www.rsc.org/images/entities/char_2009.gif) 576.2 576.2 |
0.0399 | 54 | 1818.92 | 0.0152 | 1.4 |
| 380 | 71![[thin space (1/6-em)]](https://www.rsc.org/images/entities/char_2009.gif) 339.82 339.82 |
0.0195 | 54 | 1471.22 | 0.0135 | 1.6 |
| 390 | 21![[thin space (1/6-em)]](https://www.rsc.org/images/entities/char_2009.gif) 886.94 886.94 |
0.0093 | 54 | 1113.34 | 0.0118 | 2.2 |
An interesting property of C-dots is their outstanding solubility and dispersion in aqueous solutions. This was clearly seen in our experiments, without any additional surfactants or stabilisers. This feature is very different from carbon nanotubes with the very different (namely water repellent) surface chemistry which leads to the conclusion that the (intrinsic) surface chemistry of the C-dots attained without any surfactants makes them reasonably hydrophilic and soluble. Since the saccharide molecules are reformed into quantum dots (near all or all reagents eventually react) it is unlikely that un-reacted saccharide molecules act as surfactants. Moreover, the C-dots are very stable in the solution, even after 15 months, see ESI, Section S4.† The mechanism of this stability is likely related to the structural integrity and crystallinity of the C-dots, whilst a plausible formation mechanism is presented in the ESI, Section S5,† further studies are required to confirm this assumption.
Among the most important potential applications of the C-dots, are biological applications, owing to their remarkable biocompatibility. Spectral tunability of emission still remains a significant issue and several approaches are actively pursued. For potential in vivo bio-labelling and bio-imaging applications in particular, emission with the wavelengths above 600 nm (e.g., in the NIR/IR spectral range) is of particular interest, mostly because of the auto-fluorescence from cells or tissues in the range around 500 nm. The C-dots in this paper feature emission in the green range and as such may be used to visualize flow chemistry where the green emission is not excited intrinsically.
There are a few basic approaches to tune the emission from C-dots beyond 600 nm, namely reducing the size, altering surface functionalisation, controlling the relative content of sp3 and sp2 clusters, oxygen content, and the number of defects within the C-dots. For example, when a sufficient number of oxygen defects are present, the C-dots may emit in the near-IR/IR range, which makes them suitable for applications in bio-imaging and bio-labelling. Given the limitations of the size control (which can be achieved, e.g., by shortening the growth time) and fixed reactants, control of the phase composition, as well as the oxygen content and defect presence are quite promising. The phase composition should be tuned in a way to reduce the role of sp3 clusters which contribute to the shorter-wavelength (e.g., near-UV/UV) emission,29 while the NIR/IR emission channels should be maximized. For example, emission in the near-700 nm range can be effectively generated by exciting the transition between the π* bands and oxygen-related defect states.30 The oxygen content can be effectively controlled, for example, by using a plasma-assisted process in a liquid31 and/or introducing precursors with different oxygen content.32 This endeavour will be a subject of our future work.
Conclusions
In summary, we have presented an energy, material, and labour efficient synthesis method for the production of green luminescent carbon dots. This method is effective for a variety of saccharide and base combinations. This approach is very simple, and enables real-time detection of the formation moment of C-dots even without complicated equipment. This process is likely to be of interest to a range of researchers requiring cheap, simple, and safe synthesis of green-luminescent carbon quantum dots. Moreover, our approach adheres to green chemistry principles, requires little infrastructure and holds high promise for industrial scalability.Acknowledgements
YSL and XXZ acknowledge support from the National Science Foundation of China (grant no. 11275127, 90923005), Shanghai Science and Technology Committee (grant no. 09ZR1414600). KO acknowledges support from the ARC and the CSIRO OCE Science Leadership Scheme. AER acknowledges support from the CSIRO Sensors and Sensor Networks TCP and the CSIRO OCE Postdoctoral Fellowship Scheme.Notes and references
- Y.-P. Sun, B. Zhou, Y. Lin, W. Wang, K. A. S. Fernando, P. Pathak, M. J. Meziani, B. A. Harruff, X. Wang, H. Wang, P. G. Luo, H. Yang, M. E. Kose, B. Chen, L. M. Veca and S.-Y. Xie, J. Am. Chem. Soc., 2006, 128, 7756–7757 CrossRef CAS PubMed.
- J. Jiang, Y. He, S. Li and H. Cui, Chem. Commun., 2012, 48, 9634–9636 RSC.
- J.-M. Liu, L. Lin, X.-X. Wang, S.-Q. Lin, W.-L. Cai, L.-H. Zhang and Z.-Y. Zheng, Analyst, 2012, 137, 2637–2642 RSC.
- Z. Qian, J. Ma, X. Shan, L. Shao, J. Zhou, J. Chen and H. Feng, RSC Adv., 2013, 3, 14571 RSC.
- J. C. G. Esteves da Silva and H. M. R. Gonçalves, TrAC, Trends Anal. Chem., 2011, 30, 1327–1336 CrossRef CAS PubMed.
- L. Cao, X. Wang, M. J. Meziani, F. Lu, H. Wang, P. G. Luo, Y. Lin, B. A. Harruff, L. M. Veca, D. Murray, S.-Y. Xie and Y.-P. Sun, J. Am. Chem. Soc., 2007, 129, 11318–11319 CrossRef CAS PubMed.
- A. Safavi, F. Sedaghati, H. Shahbaazi and E. Farjami, RSC Adv., 2012, 2, 7367 RSC.
- M. Nurunnabi, Z. Khatun, K. M. Huh, S. Y. Park, D. Y. Lee, K. J. Cho and Y.-K. Lee, ACS Nano, 2013, 7, 6858–6867 CrossRef CAS PubMed.
- J. Zong, X. Yang, A. Trinchi, S. Hardin, I. Cole, Y. Zhu, C. Li, T. Muster and G. Wei, Nanoscale, 2013, 5, 11200–11206 RSC.
- B. Chen, F. Li, S. Li, W. Weng, H. Guo, T. Guo, X. Zhang, Y. Chen, T. Huang, X. Hong, S. You, Y. Lin, K. Zeng and S. Chen, Nanoscale, 2013, 5, 1967–1971 RSC.
- C.-W. Lai, Y.-H. Hsiao, Y.-K. Peng and P.-T. Chou, J. Mater. Chem., 2012, 22, 14403 RSC.
- F. Liu, M.-H. Jang, H. D. Ha, J.-H. Kim, Y.-H. Cho and T. S. Seo, Adv. Mater., 2013, 25, 3657–3662 CrossRef CAS PubMed.
- J. Wang, S. Sahu, S. K. Sonkar, K. N. Tackett II, K. W. Sun, Y. Liu, H. Maimaiti, P. Anilkumar and Y.-P. Sun, RSC Adv., 2013, 3, 15604 RSC.
- J. Wang, C.-F. Wang and S. Chen, Angew. Chem., Int. Ed., 2012, 51, 9297–9301 CrossRef CAS PubMed.
- K. Ostrikov, E. C. Neyts and M. Meyyappan, Adv. Phys., 2013, 62, 113–224 CrossRef CAS.
- J. Wei, J. Shen, X. Zhang, S. Guo, J. Pan, X. Hou, H. Zhang, L. Wang and B. Feng, RSC Adv., 2013, 3, 13119 RSC.
- B. Yin, J. Deng, X. Peng, Q. Long, J. Zhao, Q. Lu, Q. Chen, H. Li, H. Tang, Y. Zhang and S. Yao, Analyst, 2013, 138, 6551–6557 RSC.
- J. Zhou, Z. Sheng, H. Han, M. Zou and C. Li, Mater. Lett., 2012, 66, 222–224 CrossRef CAS PubMed.
- P.-C. Hsu, Z.-Y. Shih, C.-H. Lee and H.-T. Chang, Green Chem., 2012, 14, 917 RSC.
- US Environmental Protection Agency, “Basics of Green Chemistry,” can be found under http://www2.epa.gov/green-chemistry/basics-green-chemistry#twelve, 2013.
- A. L. Vereshchagin and G. S. Yur, Inorg. Mater., 2003, 39, 312–318 CrossRef.
- J. McMurry, Organic Chemistry, Brooks/Cole, USA, 2000 Search PubMed.
- A. M. Brouwer, Pure Appl. Chem., 2011, 83, 2213–2228 CrossRef CAS.
- S. Mitra, S. Chandra, S. H. Pathan, N. Sikdar, P. Pramanik and A. Goswami, RSC Adv., 2013, 3, 3189 RSC.
- L. Tian, D. Ghosh, W. Chen, S. Pradhan, X. Chang and S. Chen, Chem. Mater., 2009, 21, 2803–2809 CrossRef CAS.
- P. G. Luo, S. Sahu, S.-T. Yang, S. K. Sonkar, J. Wang, H. Wang, G. E. LeCroy, L. Cao and Y.-P. Sun, J. Mater. Chem. B, 2013, 1, 2116 RSC.
- C. Ding, A. Zhu and Y. Tian, Acc. Chem. Res., 2014, 47, 20–30 CrossRef CAS PubMed.
- A. B. Bourlinos, A. Stassinopoulos, D. Anglos, R. Zboril, M. Karakassides and E. P. Giannelis, Small, 2008, 4, 455–458 CrossRef CAS PubMed.
- B. B. Wang, Q. J. Cheng, L. H. Wang, K. Zheng and K. Ostrikov, Carbon, 2012, 50, 3561–3571 CrossRef CAS PubMed.
- T. Gokus, R. R. Nair, A. Bonetti, M. Böhmler, A. Lombardo, K. S. Novoselov, A. K. Geim, A. C. Ferrari and A. Hartschuh, ACS Nano, 2009, 3, 3963 CrossRef CAS PubMed.
- Y. Lu, S. F. Xu, X. X. Zhong, K. Ostrikov, U. Cvelbar and D. Mariotti, Europhys. Lett., 2013, 102, 15002 CrossRef.
- D. H. Seo, Z. Yue, X. Wang, I. Levchenko, S. Kumar, S. Dou and K. Ostrikov, Chem. Commun., 2013, 49, 11635–11637 RSC.
Footnote |
| † Electronic supplementary information (ESI) available: S1: Other combinations. S2: Deconvolution of Raman spectra. S3: FTIR peak labelling. S4: Long term stability of C-dots. S5: Plausible formation mechanism. S6: Notes on probable toxicity and potential bioapplications. See DOI: 10.1039/c3gc42562b |
| This journal is © The Royal Society of Chemistry 2014 |

