 Open Access Article
Guidelines based on life cycle assessment for solvent selection during the process design and evaluation of treatment alternatives†
Antonio
Amelio
*a,
Giuseppe
Genduso
a,
Steven
Vreysen
b,
Patricia
Luis
c and
Bart
Van der Bruggen
a
aDepartment of Chemical Engineering, Process Engineering for Sustainable Systems (ProcESS), KU Leuven, W. de Croylaan 46, 3001 Leuven, Belgium. E-mail: antonio.amelio@cit.kuleuven.be; Fax: +32 16 322991; Tel: +32 16 322341
bThomas More, Kleinhoefstraat 4, 2440 Geel, Belgium
cMaterials & Process Engineering (iMMC-IMAP), Université catholique de Louvain, Place Saint Barbe 2, 1348 Louvain-la-Neuve, Belgium
First published on 12th February 2014
Abstract
The aim of this paper is to develop guidelines in order to assist in decision making with respect to treatment options of waste solvents, and more importantly for the choice of solvent in the design of the process a priori, from an environmental point of view based on the composition of a mixture. Life cycle assessment (LCA) was used to evaluate two treatment alternatives: continuous distillation and incineration. The software Ecosolvent® v.1.0.1 was used to perform the LCA, considering two scenarios (the best and worst scenarios) and five environmental indicators: Eco-indicator 99, UBP-97, global warming potential, cumulative energy demand and CO2-balance. From the results, it can be concluded that the environmental impact originating from the production of the solvents is the main issue to consider for the selection of distillation or incineration as the treatment method during the process design. In general, those solvents with a low impact during their production stage were found to be candidates for incineration. Moreover, those compounds that yield a great environmental burden during the production step should be always recovered in order to minimize the total impact. A series of charts is presented as guidelines to select the most environmentally favorable alternative for mixtures of solvents, and to select which solvent to use considering the environmental effects that are produced. Regarding the information given by the different indicators, it was observed that all the studied indicators lead to the same conclusions for the evaluated mixtures with some exceptions for UBP-97.
1 Introduction
A wide range of organic solvents is used in the pharmaceutical and chemical industries.1 These solvents are used in large amounts for a variety of products (paints, coatings, adhesives), as raw material for product syntheses, as reaction media, and for equipment cleaning. Since many solvents are highly volatile, considerably persistent, and highly toxic, the handling of solvents in the chemical industry represents a high priority environmental issue.2 After their use in chemical production processes, solvents often cannot be reused in the original process due to residual contaminations, quality requirements and/or legal restrictions.3 Such solvents become waste solvents.Waste solvent management should aim at minimizing hazardous waste, reducing raw material input and lowering the emission of toxic substances; therefore, it should be considered part of an environmentally friendly chemical product and in process design. Currently, two different waste solvent treatment options are generally applied: thermal treatment in hazardous waste solvent incinerators and solvent recovery. The most important technology for solvent recovery is distillation (rectification). Because pending legislation could dramatically increase the cost of spent solvent incineration, manufacturers may determine that recovering these solvents may have the best impact on the company's bottom line. As time progresses, solvent recovery will likely become a “must-invest” decision for the majority of pharmaceutical manufacturers.4 From an environmental perspective it is not known to date whether waste-solvent incineration (with heat regeneration) or recovery is the preferable treatment option. Both treatment options enable a reduction of the demand of non-renewable resources. Solvent incineration substitutes fuel for steam and electricity, obtained after conversion of the energy produced during the incineration. The recovery of waste solvents avoids petrochemical solvent production.3 At a first glance, it could be said that distillation is more environmentally friendly than incineration due to the ‘solvent recovery’ involved in this technology. Some authors5 showed for three pharmaceutical cases that solvent recovery in the pharmaceutical industry has a significant effect on the environmental impact of API manufacture. However, incineration can be advantageous with respect to distillation. For example, in a previous work,6 it was identified that in some cases of solvents with a lower environmental impact, the use of incineration led to a lower overall environmental impact. This was related to a negligible impact reduction by distillation due to solvent recovery, thus the production of energy by incineration shows a clear advantage compared with distillation. If the solvent production entails a large environmental burden, the environmental credits obtained by solvent recovery are higher than those obtained by the energy production from incineration. In addition, the presence of azeotropic mixtures (i.e., mixtures that cannot be separated by conventional distillation) can also affect the applicability of distillation due to the high energy requirements. Other recovery technologies should be also evaluated,7,8 showing the best engineering alternatives to waste incineration, although this is not the main objective in the present work. Thus only distillation will be considered as the recovery technology.
A suitable method for a comprehensive quantification of the environmental impact of these technologies is the life-cycle assessment (LCA) method,9 which is a systematic method for analyzing the environmental aspects of a product, process or service through a cradle-to-grave approach.5 In this approach, a product is examined from when and how its raw materials were acquired, to its production, use, and finally destruction.10 Thus, it allows a comprehensive understanding of the overall environmental effects of a process, allowing the analyst to recognize problems and solutions that a single-issue approach does not readily identify.5
In order to develop an LCA, the following steps should be considered: goal definition and scope; life cycle inventory analysis (LCI); life cycle impact assessment and life cycle interpretation. The development of an LCA is time intensive and not linear. Throughout the process, it is necessary to return to previous steps and interpret the results and the relation of these results to other steps in the LCA process. One possibility for overcoming such limitations is the application of life-cycle inventory (LCI) models, which help to calculate waste-solvent specific inventory flows (such as emission flows and ancillary uses) as a function of few input parameters (such as waste-solvent composition and treatment technology).11 Such LCI models12–15 are integrated in a software tool that enables the identification of environmentally preferable waste-solvent treatment options in the industry. This tool,1,11 denoted as Ecosolvent, combines LCI models for distillation and thermal treatment. With this tool, a full LCA of various waste solvent treatment options can be performed for specific, user-defined waste-solvent compositions, in order to identify the environmentally preferable waste-solvent treatment options in the industry.11
Capello et al.16 determined how green a solvent is using two different methods: the EHS assessment method, which is a screening method that aims to identify potential hazards of chemicals, and the life-cycle assessment (LCA) method. They proposed a comprehensive framework for the environmental assessment of solvents that covers major aspects of the environmental performance of solvents in chemical production, as well as important health and safety issues.16 Their study focuses on 26 pure organic solvents that are commonly used in the chemical industry, considering EHS scorepoints and CED/kg solvent [MJ-eq.]. This same framework can also be used for a comprehensive assessment of new solvent technologies (e.g., ionic liquids, supercritical fluids).
The aim of this work is to perform an in-depth analysis to develop guidelines that a priori allow the choice of solvent to use and select the best treatment method (incineration or distillation), as a function of the composition of the chemical solvent, during the decision making that takes place in the early stages of process design. The software Ecosolvent® v.1.0.1 was used to assess the impact during solvent production for selected pure solvents, assisting in the choice of the solvent during a decision making phase, and to establish reference guidelines for the most appropriate selection of technology for binary mixtures of different solvents, using different impact indicators enabling a clear assessment based on all environmental aspects (from CO2 emissions to more complete and complex environmental evaluations).
2 Materials and methods
2.1 Methodology
The 45 different organic solvents present in Ecosolvent® v.1.0.1. were the object of the present study. First, the impact resulting from solvent production was calculated for 1 kg of every organic solvent.17 The data were collected for each indicator and divided into levels of impact according to the main value of the Eco-indicator-99 (ECO-I 99). In each level, there are solvents within the same range of the ECO-I 99's mean value for the solvent production. From each level, two or three solvents were selected as a reference for that level and analyzed when present in binary mixtures. Thus, the treatment by means of two distillation steps is compared with the impact arising from incineration and an evaluation of which solvent in the mixture should be recovered or incinerated can be performed. The data collected by means of this methodology were then structured in a chart for each environmental indicator. The charts are designed to allow a fast comparison of which kind of treatment technology is better to select depending on the composition of the mixture; but also to assist in the selection of one solvent during the design process phase, considering the higher or lower impact that it can create relative to another possible solvent. In addition, these results can be extrapolated to solvents that are of the same level of impact during the production step, and solvents that are not available in the Ecosolvent software but whose value of impact during the solvent production is known. With these charts the user will have a fast tool to know if the solvent of interest should be incinerated or recovered for a preliminary analysis.Finally, examples of some binary mixtures are considered to demonstrate the methodology used in this work. The basis of calculus is 1 kg of the mixture with a concentration of 50 wt% of each compound. The studies are performed considering two scenarios (best and worst scenarios), and establishing a target recovery with a purity of 99% of one of the components in the mixture. The resulting waste stream is then incinerated with energy recovery. Batch distillation is not reported since batch and continuous distillation showed no statistical difference in a previous work.6
2.2 Ecosolvent
Ecosolvent® v.1.0.1 (Safety and Environmental Group, Zurich, Switzerland) was developed1,11 as a generic life cycle inventory tool that combines life cycle inventory models of distillation and thermal treatment in hazardous waste incinerators and cement kilns. In addition, a wastewater treatment model for the disposal of aqueous distillation residues is also included. The tool is publicly available at no cost (http://www.sust-chem.ethz.ch/tools/ecosolvent).| Iinc = Ioil + Ianc + ICO2 + Iem + Ienergy | (1) |
| Idist = Ipre + Ist + Iel + In2 + Ianc + Iair + Ires + Iww + Isolv | (2) |
A detailed description of the mathematical approach can be found in Capello et al. (2008).
In this work, all those environmental indicators were considered in order to have a clear view of the imitations of the technology from different perspectives. A detailed description of each indicator can be found in work cited above.19,20–22 As a summary, a brief definition is included below:
- The Eco-indicator 99 is a lifecycle assessment methodology, which is specifically developed for product design.3,19 The method contains a damage model (fate-, exposure-, effect-, and damage analysis), normalization and weighing step, which makes it possible to express the environmental impact with a single score, the ecoindicator point. The potential damage is focused on three categories: damage to human health, to ecosystem quality and to resources.19 The scale of Eco-indicators is chosen in such a way that the value of 1 pt is representative for one thousandth of the yearly environmental load of one average European inhabitant.19,23
- The cumulative energy demand (CED) calculates the primary energy demand,19 which is expressed as MJ equivalents.
- The method of ecological scarcity (UBP'97) takes into account a comparative weighing and aggregation of various environmental interventions by use of so-called eco-factors, which are calculated from the present pollution level (current flows) and on the pollution considered as critical (critical flows). The score is expressed as UBP.
- The global warming potential is calculated according to IPCC guidelines,21 and it is expressed as CO2 equivalents.
- The total CO2 indicates the total CO2 emissions of a complete CO2 balance.
2.3 Case scenarios
The two case scenarios described in Table 1 have been considered, named as best and worst case scenarios.6 Continuous distillation and incineration have been applied and compared for the material or energy recovery of the waste solvent for each case scenario. It has been also considered for distillation that the residue after the second step is incinerated.| Best scenario | Worst scenario | |||
|---|---|---|---|---|
| Distillation | Incineration | Distillation | Incineration | |
| Recovery of solvents is 99% for all the mixtures.a Steam (average production) from average European steam production using 76% natural gas and 24% heavy fuel oil.b Steam (from natural gas) using 100% natural gas. | ||||
| Ancillaries | — | — | — | — |
| Steam | From waste-solvent incineration | — | Average European production | — |
| Avoided steam production | — | Average European productiona (100% efficiency) | — | From natural gasb (90% efficiency) |
| Electricity | CH | — | UCTE | — |
| Air treatment | Air incineration | — | VOCs | — |
| Residue 1 | Distillation step 2 | — | Distillation step 2 | — |
| Residue 2 | Incineration | — | Incineration | — |
The best-case scenario tries to minimize the environmental burdens (and maximize the environmental credits), and the worst-case scenario assumes maximal environmental burdens (and minimal environmental credits).1 The best scenario for distillation is considered using the Swiss electricity mix (CH) as the source of electricity, and the worst scenario is considered using the average European electricity mix (UCTE) for electricity production.6
The residue from the first distillation step (residue 1) is sent to the second distillation step, and the residue produced in this second step (residue 2) is treated in a special waste solvent incinerator, in both scenarios. In the steam production for the distillation, the best scenario considers the steam from waste solvent incineration since it avoids the production and the following consumption of fossil fuels and produces a lower environmental burden; instead, the average European production in thermal power plant considers mixtures of natural gas and other fuels, and its use can be assumed to be the worst scenario.1 The emissions of outlet air were of minor importance, except for in the worst-case scenario of outlet air assessed with UBP'97. In this scenario, it was assumed that the outlet air, containing non-methane volatile organic carbon (NMVOC), was directly emitted into the atmosphere.1 When incineration is applied, steam can be produced, and this production can be considered as a reduction of steam from other sources. In the best case, the production of steam from the worst source and maximum efficiency is avoided whereas in the worst case, the production of steam using the most impactful source with the least efficiency is considered. A detailed explanation of the case scenarios can be found elsewhere.1,6,11
2.4 Uncertainty of results
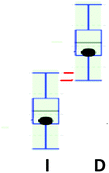
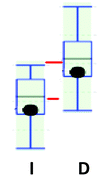
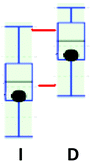
In order to determine the uncertainty of results, the Ecosolvent tool makes calculations by taking the parameter uncertainty of input and model parameters into account using stochastic modeling (Monte Carlo analysis) to quantify the uncertainty.17 Therefore, the results are presented with uncertainty and not as exact values. Note that the only uncertainty arising from the life cycle inventory analysis is quantified, whereas uncertainty originating from impact assessment factors cannot be considered. The span between the minimum and maximum value represents the 95% interval.Fig. S1 in the ESI† is included to help with the interpretation of the results. Results larger than 0 represent environmental burdens (e.g., due to the use of steam in the distillation process), and results below 0 denote environmental credits due to the avoidance of virgin solvent production (credits for solvent recovery) or fossil fuels (credits for the energy use of the waste solvent).
In this work, the impact originating from solvent production will be calculated for the 45 evaluated solvents and the selection of the most appropriate treatment method (distillation or incineration) of binary solvent mixtures from an environmental point of view will be determined. The obtained results are discussed according to the statistical criteria (colors for the charts) indicated in Table 2.
3 Results
3.1 Levels of impact according to the solvent production
The impact caused during the solvent production has been calculated for all the environmental indicators and available solvents in Ecosolvent® v.1.0.1 for 1 kg of waste solvent. The detailed results are shown in Table S1 in the ESI,† which have been ordered according to the mean value of the Ecoindicator-99.The results are reported as single scores, directly calculated. The explanations can be found the ESI.†![[thin space (1/6-em)]](https://www.rsc.org/images/entities/char_2009.gif) 11 They show how the environmental impact of each inventory parameter was calculated in the two case studies, including the statistical data ranges of distillation parameters and consumption and impact factors.
11 They show how the environmental impact of each inventory parameter was calculated in the two case studies, including the statistical data ranges of distillation parameters and consumption and impact factors.
Fig. 1 shows the values of the impact (Ecoindicator-99) of each solvent caused during the production step, which are grouped according to their chemical structure (alcohols, ketones, aldehydes, etc.) in order to have a more clear view for the comparison. Results for the other environmental indicators (UBP'97, GWP, CED, CO2) are shown in Fig. 2–5. Also, the values for a generic organic solvent, useful to approximate other solvents using Ecosolvent, have been included as reference (red column in Fig. 1 and Fig. 2–5).17
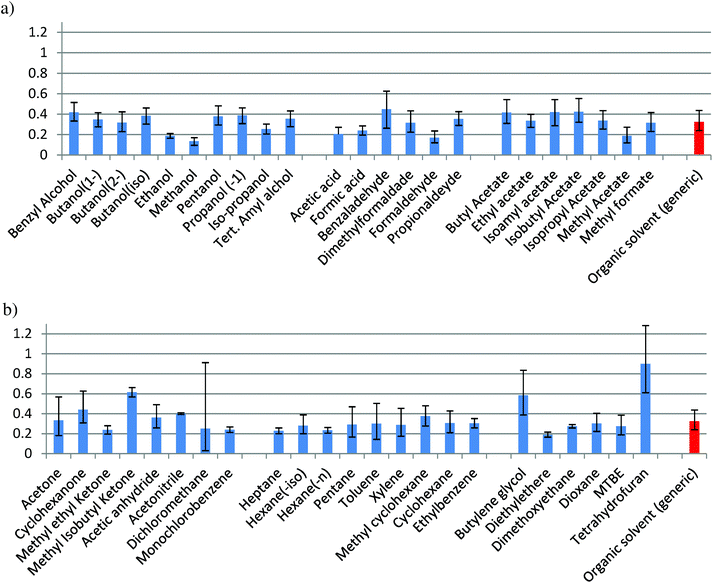 | ||
| Fig. 1 ECO-I 99 caused during solvent production for: (a) alcohols, acid & aldehydes, and esters; (b) ketones & others, hydrocarbons with more than 5 carbon atoms, oxygenates. | ||
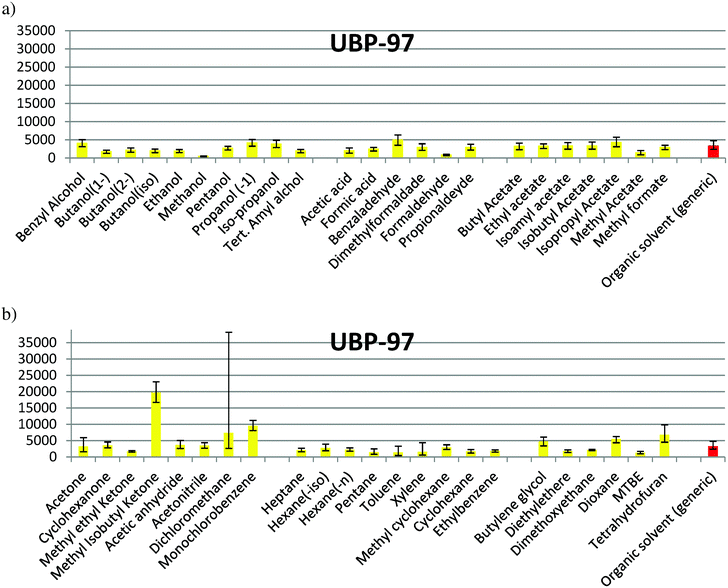 | ||
| Fig. 2 UBP-97 caused during solvent production for: (a) alcohols, acid & aldehydes, and esters; (b) ketones & others, hydrocarbons with more than 5 carbon atoms, oxygenates. | ||
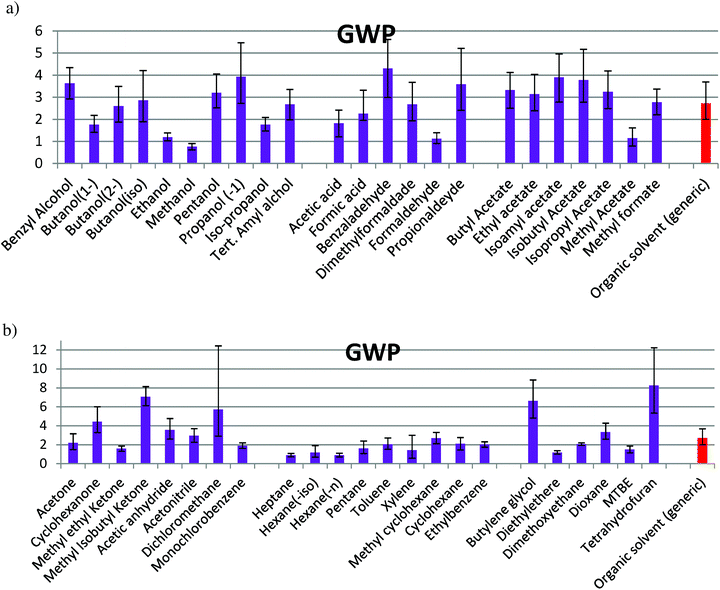 | ||
| Fig. 3 GWP caused during solvent production for: (a) alcohols, acid & aldehydes, and esters; (b) ketones & others, hydrocarbons with more than 5 carbon atoms, oxygenates. | ||
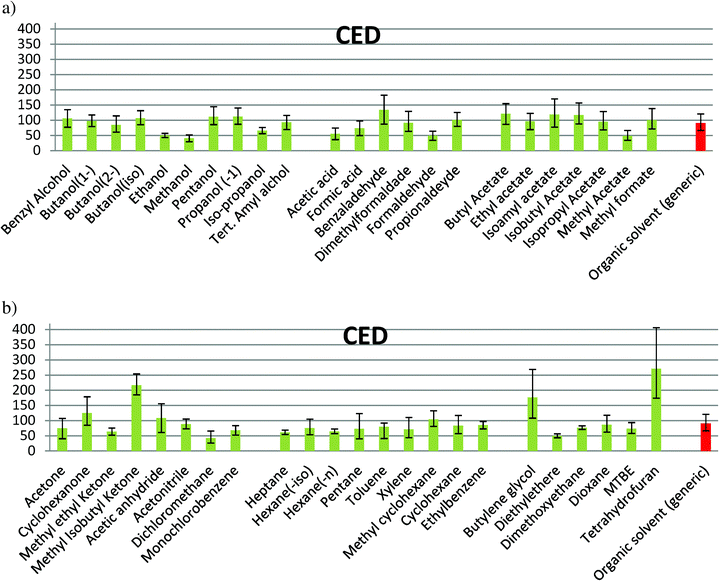 | ||
| Fig. 4 CED caused during solvent production for: (a) alcohols, acid & aldehydes, and esters; (b) ketones & others, hydrocarbons with more than 5 carbon atoms, oxygenates. | ||
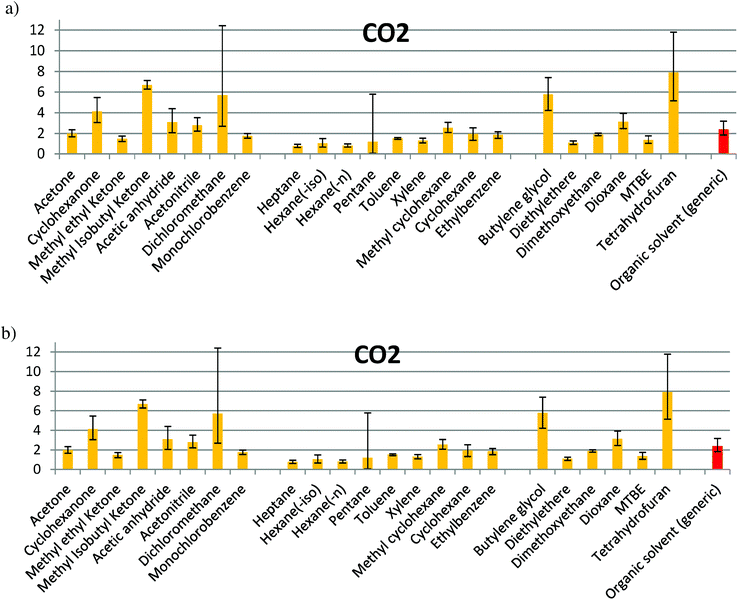 | ||
| Fig. 5 CO2 caused during solvent production for: (a) alcohols, acid & aldehydes, and esters; (b) ketones & others, hydrocarbons with more than 5 carbon atoms, oxygenates. | ||
In the families composed of alcohols, acids/aldehydes and esters (Fig. 1a), the confidence interval of solvent production for almost all the solvents is partially or totally overlapped with that for the organic generic solvent. Methanol, ethanol, acetic acid, formic acid, methyl acetate and formaldehyde show a lower impact, while benzaldehyde has a higher impact than the average. In Fig. 1b, a significant difference of the values between THF, butylene glycol and methyl isobutyl ketone (MIK) with the organic generic solvent can be observed. Dichloromethane shows the largest uncertainty and diethyl ether has a value lower than the average. For the rest of solvents, an impact within the interval of confidence of the generic organic solvent can be observed. The maximum value found for this environmental indicator is in the production of tetrahydrofuran (THF), while the minimum value is when methanol is produced, according to the values of Ecoindicator-99 (see Table S1 in ESI† and Fig. 1). The impacts shown in Fig. 1 for Ecoindicator-99 have the same trends with the other environmental indicators, as shown in Fig. 2–5. For Ecoindicator-99, methanol has the lowest interval of confidence, also for all the others indicators, UBP-97, GWP, CO2 and CED. Regarding tetrahydrofuran, it has the highest impact, except when UBP-97 is considered. In this case, MIK shows the highest burden during the production step for this indicator. Furthermore, dichloromethane shows the largest interval of confidence, except for CED (Table S1† and Fig. 2–5).
The interval of confidence for a solvent can change between two different environmental indicators. However, the solvents have been grouped into 7 families according to their level of impact considering the Ecoindicator-99, as shown in Table 3. Each level shows those solvents with the same range of impact yielded during the production phase. These families will allow the elaboration of charts that will serve as guidelines during the decision making.
| Eco-99 | ||
|---|---|---|
| Level | Range value | Compounds |
| a Compounds that will be studied outside the levels. | ||
| I | 0.135 < x | Methanol |
| II | 0.135 < x < 0.19 | Formaldehyde, methyl acetate, ethanol, diethyl ether |
| III | 0.19 < x < 0.219 | Acetic acid, heptane, n-hexane, methyl-ethyl-ketone, formic acid, mono-chloro-benzene, dichloro-methane,a iso-propanol, MTBE, di-methoxy-ethane, iso-hexane, xylene, pentane |
| IV | 0.219 < x < 0.347 | Toluene, dioxane, ethyl-benzene, cyclohexane, dimethyl-formaldehyde, methyl-formate, 2-butanol, acetone, ethylacetate, isopropyl-acetate, 1-butanol |
| V | 0.347 < x < 0.388 | Propionaldehyde, tert-amyl alcohol, acetic anhydride, methyl cyclohexane, pentanol, iso-butanol, 1-propanol |
| VI | 0.388 < x < 0.424 | Acetonitrile, butyl acetate, benzyl alcohol, iso-amyl acetate, iso-butyl acetate |
| VII | 0.424 < x < 0.9 | Cyclohexanone, benzaldehyde, butylene glycol, methyl-ketone,a tetrahydrofuran |
3.2 Charts
For each impact level of solvents, some compounds have been selected as reference to study the best treatment technology whenever they are present in binary mixtures. They have been chosen to represent each level, considering the range of impact in the level. For some levels, more solvents have been chosen to cover the overall range considered. Table 4 shows the values of the studied indicators for the selected compounds. The three values that are shown per solvent and per indicator refer to the minimum value, the mean value and the maximum value.| Impact level | Compounds | Descriptive values | Eco-I 99 | UBP-97 | GWP | CED | CO2 |
|---|---|---|---|---|---|---|---|
| I | Methanol | Min | 0.097 | 370 | 0.616 | 29.2 | 0.553 |
| Mean | 0.135 | 480 | 0.764 | 40.9 | 0.650 | ||
| Max | 0.172 | 607 | 0.906 | 52.1 | 0.742 | ||
| Formaldehyde | Min | 0.122 | 678 | 0.91 | 34.4 | 0.801 | |
| Mean | 0.169 | 856 | 1.13 | 49.2 | 0.978 | ||
| Max | 0.237 | 1065 | 1.39 | 64.1 | 1.18 | ||
| II | Ethanol | Min | 0.166 | 1559 | 1.03 | 43.6 | 0.945 |
| Mean | 0.188 | 1932 | 1.19 | 50.2 | 1.11 | ||
| Max | 0.212 | 2391 | 1.39 | 57.1 | 1.28 | ||
| III | Heptane | Min | 0.200 | 1620 | 0.731 | 54.4 | 0.633 |
| Mean | 0.228 | 2125 | 0.901 | 61.5 | 0.788 | ||
| Max | 0.258 | 2719 | 1.09 | 69.1 | 0.962 | ||
| Formic acid | Min | 0.197 | 1982 | 1.96 | 49.7 | 1.83 | |
| Mean | 0.240 | 2485 | 2.26 | 73.6 | 2.40 | ||
| Max | 0.287 | 2981 | 3.32 | 97.7 | 3.10 | ||
| Xylene | Min | 0.174 | 630 | 0.579 | 43.6 | 1.10 | |
| Mean | 0.288 | 1635 | 1.42 | 71.5 | 1.31 | ||
| Max | 0.454 | 4439 | 3.00 | 110 | 1.54 | ||
| IV | Dioxane | Min | 0.223 | 4396 | 2.59 | 62.2 | 2.47 |
| Mean | 0.302 | 5535 | 3.34 | 86.4 | 3.13 | ||
| Max | 0.404 | 6294 | 4.28 | 118 | 3.95 | ||
| Methyl formate | Min | 0.232 | 2373 | 2.20 | 71.4 | 2.02 | |
| Mean | 0.316 | 2928 | 2.78 | 100 | 2.48 | ||
| Max | 0.417 | 3562 | 3.37 | 138 | 3.02 | ||
| Isopropylacetate | Min | 0.256 | 3151 | 2.48 | 68.4 | 2.21 | |
| Mean | 0.337 | 4311 | 3.25 | 95.3 | 3.22 | ||
| Max | 0.436 | 5786 | 4.19 | 129 | 4.53 | ||
| V | Propionaldehyde | Min | 0.291 | 2228 | 2.41 | 79.8 | 2.35 |
| Mean | 0.353 | 2947 | 3.59 | 101 | 3.37 | ||
| Max | 0.426 | 3825 | 5.21 | 126 | 4.73 | ||
| Propanol (−1) | Min | 0.309 | 3304 | 2.72 | 87.0 | 2.15 | |
| Mean | 0.388 | 4175 | 3.93 | 112 | 3.35 | ||
| Max | 0.463 | 5169 | 5.47 | 140 | 4.91 | ||
| Acetonitrile | Min | 0.393 | 2710 | 2.27 | 73.3 | 2.23 | |
| Mean | 0.401 | 3534 | 2.96 | 88.6 | 2.80 | ||
| Max | 0.410 | 4426 | 3.70 | 105 | 3.52 | ||
| Isobutyl acetate | Min | 0.322 | 2483 | 2.77 | 87.7 | 2.68 | |
| Mean | 0.424 | 3317 | 3.78 | 117 | 3.52 | ||
| Max | 0.555 | 4461 | 5.17 | 157 | 4.64 | ||
| VII | Benzaldehyde | Min | 0.264 | 3552 | 2.99 | 87.4 | 2.73 |
| Mean | 0.449 | 4989 | 4.30 | 134 | 3.79 | ||
| Max | 0.626 | 6391 | 5.61 | 183 | 5.08 | ||
| Tetrahydrofuran | Min | 0.611 | 4568 | 5.34 | 174 | 5.15 | |
| Mean | 0.900 | 6833 | 8.26 | 271 | 7.90 | ||
| Max | 1.28 | 9871 | 12.2 | 406 | 11.8 | ||
| Dichloromethane | Min | 0.031 | 2649 | 2.90 | 26.0 | 2.70 | |
| Mean | 0.251 | 7412 | 5.73 | 42.6 | 5.70 | ||
| Max | 0.912 | 3820 | 12.4 | 65.8 | 12.4 | ||
| MIK | Min | 0.569 | 16![[thin space (1/6-em)]](https://www.rsc.org/images/entities/char_2009.gif) 755 755 |
6.12 | 185 | 6.30 | |
| Mean | 0.615 | 19![[thin space (1/6-em)]](https://www.rsc.org/images/entities/char_2009.gif) 725 725 |
7.06 | 217 | 6.70 | ||
| Max | 0.663 | 23![[thin space (1/6-em)]](https://www.rsc.org/images/entities/char_2009.gif) 062 062 |
8.14 | 254 | 7.13 |
In Table 4, dichloromethane and MIK were taken out of the individual impact levels since it was observed that they do not produce the expected response and they should be considered as outliers in this study. Nevertheless, these solvents are important to be analyzed as well, because dichloromethane showed the largest uncertainty and MIK showed the highest impact for the UBP-97. Thus, none of these solvents can be classified easily in any of the considered levels. Their analysis has been thus done separately.
The solvents in Table 4 have been analyzed with Ecosolvent® v.1.0.1, in binary mixtures with a concentration of 50 wt%. Continuous distillation versus incineration has been compared as treatment technologies.
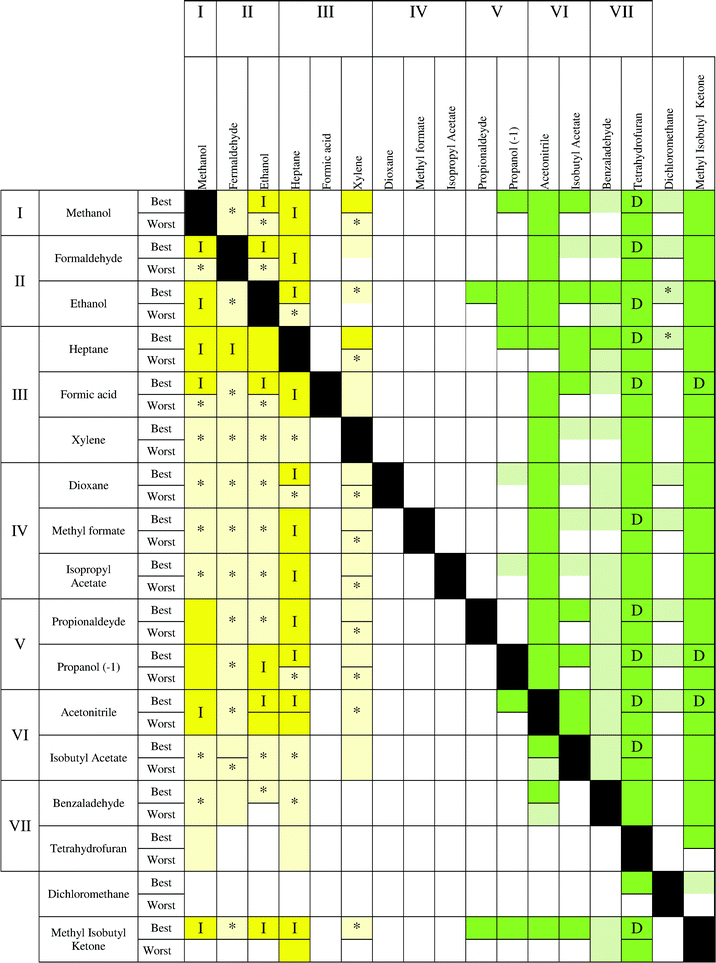
The results are reported in Fig. 6–10, following the methodology indicated in section 2.4. In these charts, every box represents the result of the treatment of a binary mixture composed of the target solvent to be recovered (in the heading of the chart) with a second solvent in the mixture (left side of the chart). These charts allow the user to establish the best treatment technology for each compound, even if it is not in the chart by only knowing the value of the impact during its production and taking into account to which impact level the solvent belongs (the same value for the solvent production). Furthermore, there are two situations to consider in every box: the best and worst scenarios.
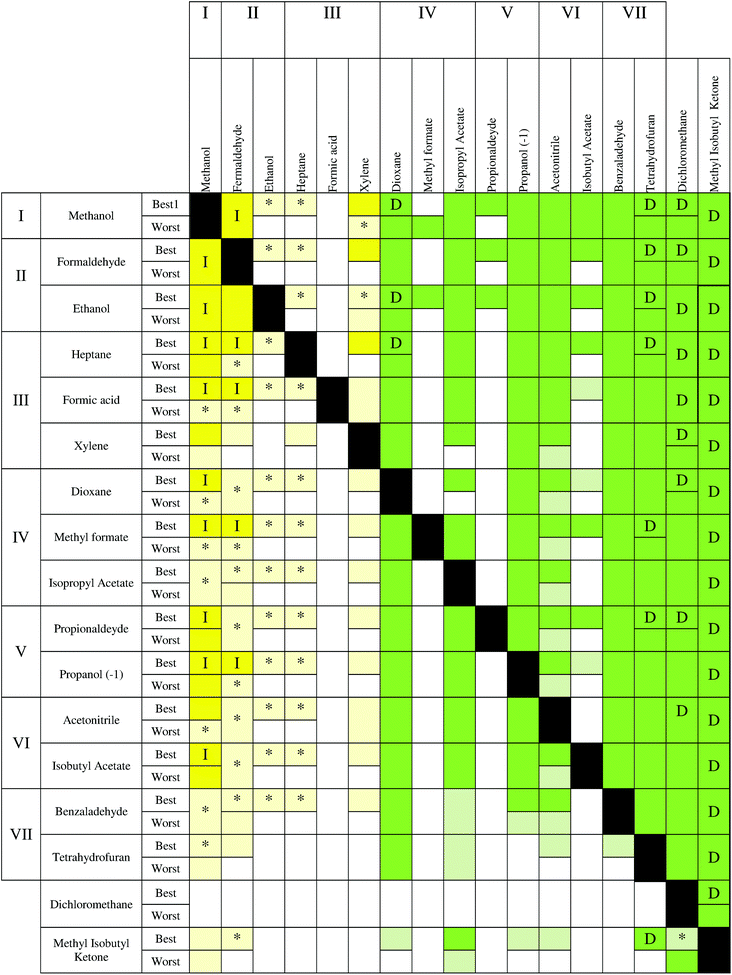
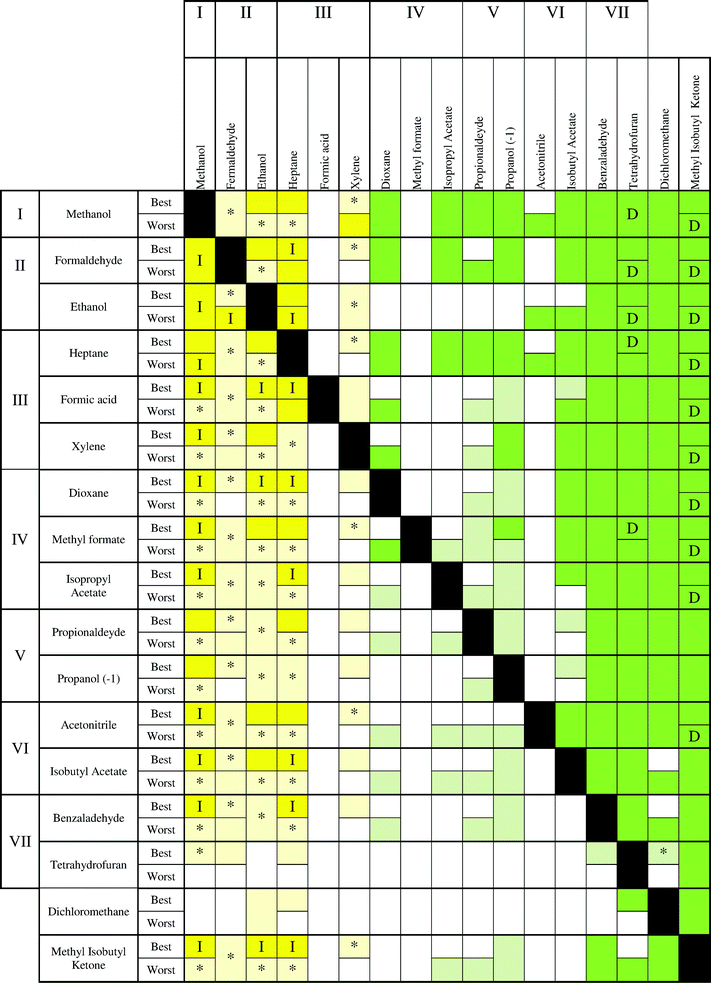
In Fig. 6, three different parts can be observed. On the left side, where the recovery of the solvent with a low impact is considered, the yellow color is prevailing, indicating that incineration is the best technology, although with some uncertainty for some compounds. In particular, mixtures of methanol, formaldehyde, ethanol, heptane and xylene show a clear advantage for using incineration. Moving to the middle (colorless), no statistical differences can be observed between applying incineration or distillation. Finally, an area colored in green on the right side can be observed. In this case, distillation presents a clear advantage for the recovery of the solvents THF, acetonitrile, benzaldehyde, isobutyl acetate and MIK. These solvents can be considered as compounds that should be always recovered. Indeed, these solvents have the highest values of environmental impact during the solvent production (see Fig. 1 and Table S1†). Also in the low part of the table, the uncertainty is higher because mixtures with a low impact (methanol, ethanol, heptanes, etc.) and a high impact (THF, benzaldehyde, isobutyl acetate, etc.) solvents are analyzed. In addition, with the exception of MIK, whenever the main compound is a low impact solvent during the production stage, distillation and incineration can have the same impact. However, incineration remains the best technology when isobutyl acetate, benzaldehyde and tetrahydrofuran are in the mixture. A higher uncertainty (light yellow colour) is observed in the lower part. Finally, dichloromethane shows a large uncertainty whenever it is recovered or it is the second compound (second last row). Furthermore, the best case has a lower uncertainty than the worst case. Regarding the other indicators, some differences can be observed. The environmental indicator UBP 97 (Fig. 7) shows a reduction of the region where incineration shows an environmental advantage and with a higher uncertainty. However, the area where distillation is advantageous (green) is larger than the corresponding area in the ECO-I 99 chart, with the best performance observed when MIK is the target compound. In this chart, it is possible to notice an alternation of colorless and green boxes in the middle part, which is due to the way in which the solvents are ordered (following the levels of impact of the Ecoindicator-99).
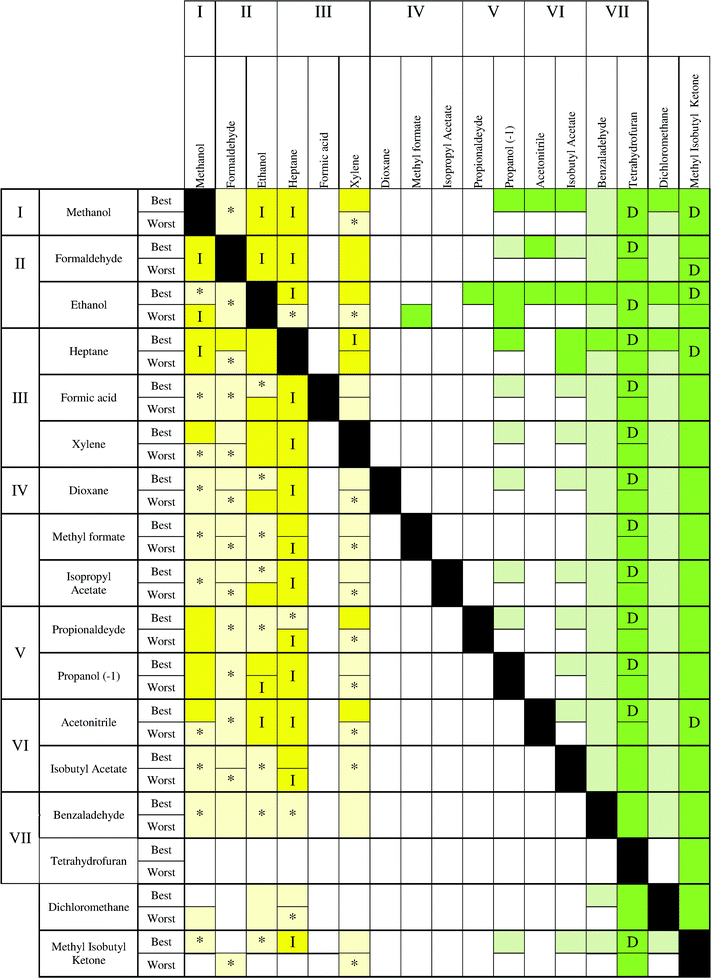
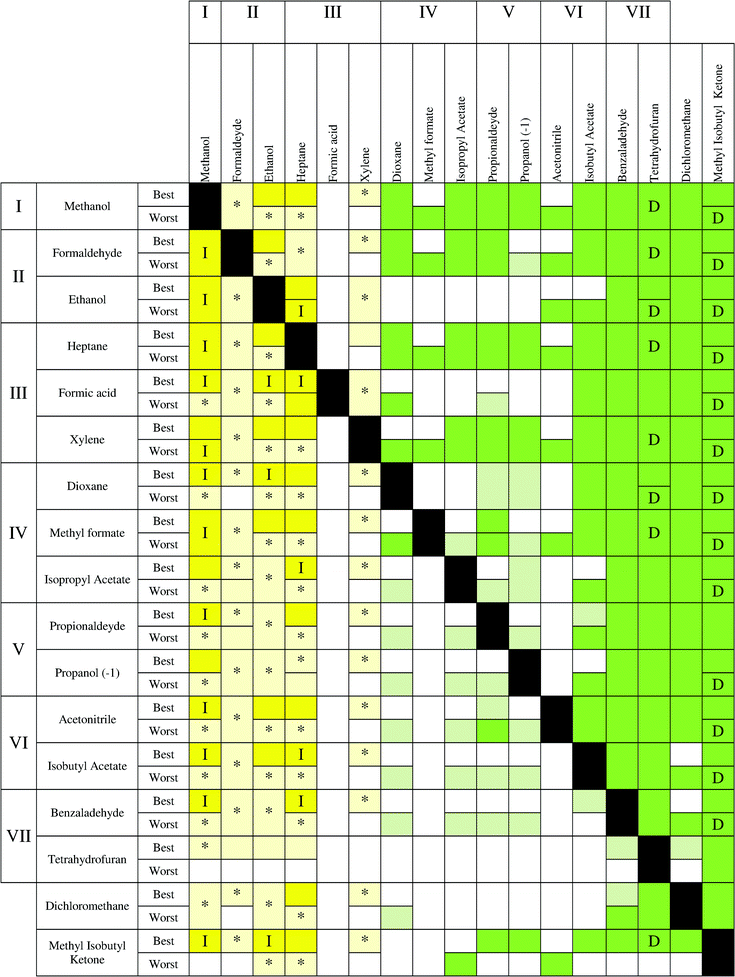
Also, in the case of CO2 balance and GWP, the results are similar to Fig. 8 and 10, but with some differences. On the left side, the incineration is always the best technology, but in the recovery of methanol, heptane and ethanol for the best case, incineration shows good results when they are incinerated with the solvents of the central part. Instead, a higher uncertainty was found for the recovery of formaldehyde. The compounds in the middle part present more advantages for recovery by using distillation than in the case of ECO-I 99. The only exception is methylformate, which should be taken out of its impact level, because it has a disparate performance in comparison to the other solvents in the same level (IV). Furthermore, for these environmental indicators, the worst case has a lower uncertainty than the best case, in particular when the solvent production impact increases.
The performance for Ecoindicator-99 is the same for CED (Fig. 9). The only exceptions are dichloromethane, where distillation is the best technology, while acetonitrile has a large uncertainty whenever it is recovered. Some differences can be found with UBP-97, mostly with the alternation and the results for the recovery of MIK described above. Furthermore, ECO-I 99 results shown good performances with all other indicators, in particular with CED, while CO2 balance and GWP have the same results.
From the charts, it is clear that methanol should be always incinerated, as well as ethanol–formaldehyde and heptane–xylene. Dichloromethane confirmed the high uncertainty related to the solvent production phase, thus, it is difficult to extract valuable information when dichloromethane is present in the mixture as the second compound. Furthermore, formic acid showed a complete uncertainty for all the maps.
It has also been noticed that MIK showed the best results for distillation in the case of UBP-97, confirming that the value of solvent production gives important information to predict the best technology to use. In fact, for the other environmental indicators, THF has the highest burden during the solvent production and consequently the best results if it is recovered. Furthermore, THF shows a high uncertainty when it is not the compound to recover, due to its large interval of confidence. As a conclusion, it can be generally stated that solvents with high impact during the production stage should be recovered by distillation and those solvents with lower impact should be incinerated to take advantage of energy production.
From the charts, the following criteria can be established:
• solvents with a high impact during the production should be recovered by distillation.
• solvents with a low impact during the production should be incinerated.
• for solvents with a medium impact during the production, distillation and incineration may show the same advantage and a more detailed study considering specific data for the real process should be performed.
3.3 Examples of binary mixtures
Some binary mixtures with different impacts during the production step (low, medium or high impact) have been selected to show in detail the effects of different impact combinations in the two scenarios, best and worst: high impact–low impact, high impact–high impact, low impact–low impact, high impact–medium impact, medium impact–low impact, and low impact–low impact. The results are reported in Fig. 11, where distillation is aimed at recovering the first solvent (S1) or the second solvent (S2), and also the case of incineration.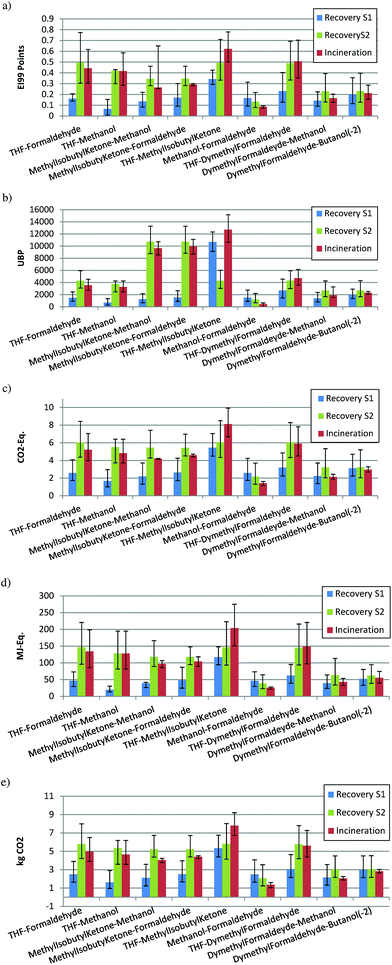 | ||
| Fig. 11 (a) Example ECO-I 99, best case; (b) example UBP-97, best case; (c) example GWP, best case; (d) example CED, best case; (e) example CO2, best case. | ||
The mixtures tetrahydrofuran–formaldehyde, tetrahydrofuran–methanol, MIK–formaldehyde and MIK–methanol have been chosen as representatives of a binary mixture with one solvent that produces a high environmental burden during the production (i.e., THF, MIK, acetonitrile, benzaldehyde) and one solvent with a low environmental burden (i.e., methanol, ethanol, heptane, xylene). Fig. 11a shows the impacts (ECO-I 99) when the first or second solvent are the target to be recovered by distillation and when the mixture is incinerated. It can be observed that the solvent (S1) with a high impact during the production, shows preference for recovery by distillation. Instead, if the solvent with low impact is recovered (S2), the incineration is better from an environmental point of view.
For the mixture THF–MIK, both high impact solvents, distillation is better than incineration, the recovery of THF being advantageous in comparison with the recovery of MIK. When there are two low impact solvents (methanol–formaldehyde), the value of ecopoints is very low and there is a large uncertainty, although the incineration shows a lower impact. Finally, for medium impact–low impact compounds in mixtures, incineration is better than distillation if the low impact solvent (S2) is recovered. A large uncertainty is shown when the medium impact solvent is recovered (S1) as for the last mixture dimethyl formaldehyde–butanol(2-).
With UBP-97, the situation is different, because the solvent with the highest impact is methyl isobutyl ketone (MIK). When MIK is present in the mixture but it is not the target compound to be recovered, the impact is very high (mixtures MIK–methanol, MIK–formaldehyde, MIK–THF). However, in mixtures with THF (THF–methanol, THF–formaldehyde, THF–dimethyl formaldehyde) the value of impact is lower (for the recovery of S1, recovery of S2 or incineration) than the case of mixtures with MIK. Nevertheless, the recovery of the component with higher impact has always a benefit from an environmental point of view. In fact, it is important to notice how in the mixture THF–dimethyl formaldehyde (high impact–medium impact) the uncertainty is much lower than the same mixture but with another indicator. Also the values of impact are completely different when MIK is present (mixtures MIK–methanol, MIK–formaldehyde, MIK–THF).
It is interesting to compare the situation for the mixture THF–MIK in Fig. 11a,b and 12a,b. In Fig. 11a and 12a, if THF is recovered, distillation has the lowest impact, but in Fig. 11b and 12b the impact of distillation is partially overlapped with incineration. The situation is the opposite for the two indicators if MIK is recovered; in the case of ECO-I 99 the recovery of MIK shows a lower mean value than incineration, but with a large uncertainty, whereas for UBP-97 it always better to recover MIK. This demonstrates again the idea that the solvent with the highest impact should be recovered. Indeed, this situation is observed only for UBP-97, while for the other indicators, THF always shows the lowest environmental burden if it is recovered. Furthermore, in Fig. 11c–e, a similar performance with the results of ECO-I 99 can be noticed. However, the difference between distillation and incineration with these indicators is lower. Mostly for the last mixtures (dimethyl formaldehyde–butanol(2-) and dimethyl formaldehyde–methanol), those compounds with the same impact or very similar show a big uncertainty (the mean values are very close) but with a lower interval of confidence for incineration, which suggests that incineration is the best treatment alternative. Thus, the impact values with ECO-I 99, GWP, CED and CO2 indicators for both scenarios, have the same magnitude for all mixtures except when THF is to be recovered. However, UBP-97 does not follow this trend. The main reason is in the high value of MIK in the UBP indicator, which has no correspondence with the values for other indicators. For the worst scenario (Fig. 12a–e), for all the indicators, the main difference found with the best scenario is the larger uncertainty but the results have the same trend.
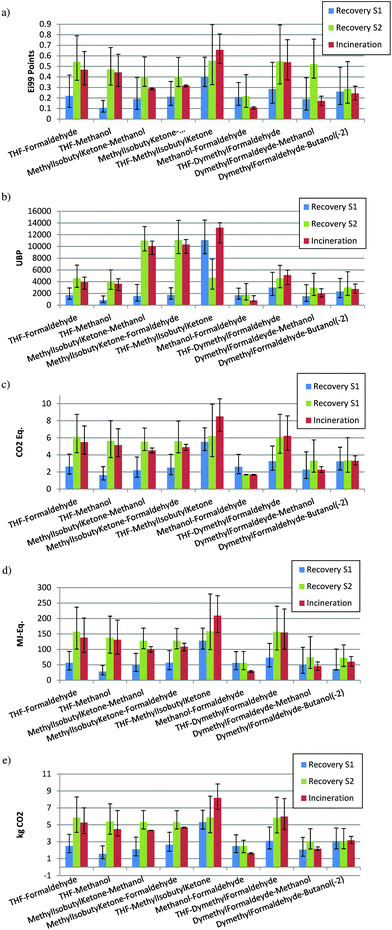 | ||
| Fig. 12 (a) Example ECO-I 99, worst case; (b) example UBP-97, worst case; (c) example GWP, worst case; (d) example CED, worst case; (e) example CO2, worst case. | ||
Thus, in agreement with the developed criteria in the previous section, if methanol or formaldehyde are recovered (low impact compounds), incineration is the best treatment technology. On the contrary, distillation is the best alternative with MIK and THF; the high impact compounds. Less information can be obtained when the main compounds to be recovered are medium impact solvents.
Thus, these guidelines give useful information for the preliminary decisions that take place during the design of a process, such as the choice of solvents considering their environmental impact. Nevertheless, in this work, only distillation has been considered as the recovery option and it does not exclude the possibility that another technology for solvent recovery presents a better potential, such as membrane-based technologies.7 Great research opportunities are opened in this field.
4 Conclusions
The treatment of chemical solvents is an important issue in the chemical industry. Particularly in the pharmaceutical and speciality chemical industry, organic solvents accrue in large amounts due to complex production routes. In this work, life cycle assessment is presented as a tool to be used during the decision making to assist in the choice of the solvent during the process design, and which technology is the most appropriate for the treatment of chemical solvents from an environmental point of view. In this regard our work has been shown, using two different tools, to be useful as a reference at the beginning of a process design. In our work we want to improve the information present using several ecoindicators and considering more particular and real situations, such as high purity (99%) and different compositions of the mixture.First, the studied solvents have been grouped into levels according to the environmental impact resulting from the solvent manufacture, giving an overview of their environmental burden. Next, charts of binary mixtures have been developed for each environmental indicator. These charts indicate whether distillation or incineration should be applied depending on the composition of the mixture, and if distillation takes advantage, which solvent should be recovered. They offer a tool for the user to decide at the beginning of the process design which technology (distillation or incineration) is the best from an environmental point of view, knowing only the chemical composition, but mostly they allow the determination of which solvent would produce the lowest impact. The charts are built on the basis that for solvents with a low impact during their manufacture, incineration is the best technology, and, if the main compound has a high impact, distillation is advantageous. When the component to be recovered in the mixture has a medium impact, a more detailed analysis is required due to the uncertainty of the values, for example via simulation of the real process to achieve real values and combination with life cycle assessment using as input data those obtained from the simulation.
It can be thus concluded that when components such as methanol, ethanol, heptane, xylene, acetic acid, n-hexane, methyl-ethyl-ketone, mono-chloro-benzene, iso-propanol, MTBE, di-methoxy-ethane, iso-hexane, xylene, pentane, formaldehyde, methyl acetate, diethylether are present in the mixture, they should be incinerated since their recovery presents no environmental benefits. On the other hand, for the solvents with high impact during their production, such as THF, MIK, acetonitrile, benzaldehyde, butyl acetate, benzyl alcohol, iso-amyl acetate and iso-butyl acetate, distillation becomes the best technology in order to minimize the production of these solvents. Regarding the information given by different indicators, all the studied indicators (Ecoindicator-99, UBP-97, GWP, CED, CO2) have the same general trend, with the only exception being UBP-97, which has some different results for the impact during the solvent production, and which solvents have to be recovered. Furthermore, the worst case scenario has a higher uncertainty than the best case scenario.
Acknowledgements
The Research Council of KU Leuven is gratefully acknowledged for providing a PhD grant to A. Amelio (OT/2012). P. Luis acknowledges the support by a Marie Curie–CIG Career Integration Grant (PCIG9-GA-2011-294218). The authors also acknowledge financial support from The Environmental & Energy Technology Innovation Platform (MIP).References
- C. Capello, S. Hellweg and K. Hungerbühler, J. Ind. Ecol., 2008, 12, 111–127 CrossRef.
- G. Wypych, in Handbook of solvents, Chem. Tec. Publishing, Toronto, 2001 Search PubMed.
- T. B. Hofstetter, C. Capello and K. Hungerbühler, Process Saf. Environ. Prot., 2003, 81(Part B), 189–202 CrossRef CAS.
- Rockwell Automation, http://literature.rockwellautomation.com/idc/groups/literature/documents/wp/ssb-wp001_-en-e.pdf, December 2009.
- M. J. Raymond, C. S. Slater and M. J. Savelski, Green Chem., 2010, 12, 1826–1834 RSC.
- P. Luis, A. Amelio, S. Vreysen, V. Calabro and B. Van der Bruggen, Int. J. Life Cycle Assess., 2013, 18(5), 1048–1061 CrossRef CAS.
- P. Luis, A. Amelio, S. Vreysen, V. Calabro and B. Van der Bruggen, Appl. Energy, 2014, 113, 565–575 CrossRef CAS PubMed.
- W. A. Carole, C. S. Slater, M. J. Savelski, T. Moroz, A. Furiato and K. Lynch, Proceedings of the 8th International Conference on EcoBalance, Tokyo, 2008, pp. 235–238 Search PubMed.
- EN ISO 14040: 1997, Environmental management – Life cycle assessment – Principles and framework, European Comitee for Standardisation, Brussels, Belgium.
- R. Jaques, Presented at the 32nd Annual Conference of the Australia and New Zealand Architectural Science Association, Paper No. 47, 1998 Search PubMed.
- C. Capello, S. Hellweg, B. Badertscher, H. Betschart and K. Hungerbühler, J. Ind. Ecol., 2007, 11(4), 26–38 CrossRef CAS.
- C. Seyler, S. Hellweg, M. Monteil and K. Hungerbühler, Int. J. Life Cycle Assess., 2004, 10(2), 120–130 CrossRef.
- C. Seyler, T. B. Hofstetter and K. Hungerbühler, J. Cleaner Prod., 2005, 13, 1211–1224 CrossRef PubMed.
- C. Jimenez-Gonzalez, M. Overcash and A. Curzons, J. Chem. Technol. Biotechnol., 2001, 76(7), 707–716 CrossRef CAS PubMed.
- C. Capello, S. Hellweg, B. Badertscher and K. Hungerbühler, Environ. Sci. Technol., 2005, 39, 5885–5892 CrossRef CAS.
- C. Capello, U. Fischer and K. Hungerbühler, Green Chem., 2007, 9, 927–934 RSC.
- D. Weber and C. Capello, User guide: the ecosolvent tool, ETH Zurich, Safety & Environmental Technology Group, Zurich, 2006 Search PubMed.
- M. Goedkoop and R. Spriensma, PRé Consultants b.v, Amersfoort, Amersfoort, 2nd edn, 2000 Search PubMed.
- N. Jungbluth and R. Frischknecht, Cumulative energy demand. Implementation of Life Cycle Impact Assessment Methods, ecoinvent 2000 Report No. 3, EMPA, Dübendorf, 2004.
- R. Hischier, The method of ecological scarcity (Umweltbelastungspunkte, UBP'97), Implementation of Life Cycle Impact Assessment Methods, ecoinvent 2000 Report No. 3, EMPA, Dübendorf, 2004.
- J. T. Houghton, Y. Ding, D. J. Griggs, M. Noguer, P. J. van der Linden, X. Dai, K. Maskell and C. A. Johnson, IPCC (2001) Climate change 2001: the scientific basis, Third assessment report, IPCC, Cambridge, 2001.
- M. Goedkoop, R. Heijungs, M. Huijbregts, A. D. Schryver, J. Struijs and R. Van Zelm, ReCiPe 2008: a life cycle impact assessment method which comprises harmonized category indicators at the midpoint and the endpoint level, Report I. VROM, Den Haag, 2009.
- T. Benko, A. Szanyi, P. Mizsey and Z. Fonyo, Cent. Eur. J. Chem., 2006, 4(1), 92–110 CrossRef CAS PubMed.
Footnote |
| † Electronic supplementary information (ESI) available. See DOI: 10.1039/c3gc42513d |
| This journal is © The Royal Society of Chemistry 2014 |

