 Open Access Article
Creative Commons Attribution 3.0 Unported Licence
Conversion of sugars to ethylene glycol with nickel tungsten carbide in a fed-batch reactor: high productivity and reaction network elucidation
Roselinde
Ooms
a,
Michiel
Dusselier
a,
Jan A.
Geboers
b,
Beau
Op de Beeck
a,
Rick
Verhaeven
a,
Elena
Gobechiya
a,
Johan A.
Martens
a,
Andreas
Redl
c and
Bert F.
Sels
*a
aCenter for Surface Science and Catalysis, KU Leuven, Kasteelpark Arenberg 23, 3001, Heverlee, Belgium. E-mail: bert.sels@biw.kuleuven.be; Fax: (+32) 1632 1998; Tel: (+32) 1632 1593
bMax-Planck-Institut für Kohlenforschung, Kaiser-Wilhelm-Platz 1, D-45470 Mülheim an der Ruhr, Germany
cTEREOS SYRAL SAS, Z.I et Portuaire B.P.32, F-67390 Marckolsheim, France. E-mail: andreas.redl@tereos.com; Tel: +33388581615
First published on 15th October 2013
Abstract
Bifunctional nickel tungsten carbide catalysis was used for the conversion of aqueous sugar solutions into short-chain polyols such as ethylene glycol. It is shown that very concentrated sugar solutions, viz. up to 0.2 kg L−1, can be converted without loss of ethylene glycol selectivity by gradually feeding the sugar solution. Detailed investigation of the reaction network shows that, under the applied reaction conditions, glucose is converted via a retro-aldol reaction into glycol aldehyde, which is further transformed into ethylene glycol by hydrogenation. The main byproducts are sorbitol, erythritol, glycerol and 1,2-propanediol. They are formed through a series of unwanted side reactions including hydrogenation, isomerisation, hydrogenolysis and dehydration. Hydrogenolysis of sorbitol is only a minor source of ethylene glycol. To assess the relevance of the fed-batch system in biomass conversions, both the influence of the catalyst composition and the reactor setup parameters like temperature, pressure and glucose addition rate were optimized, culminating in ethylene glycol yields up to 66% and separately, volume productivities of nearly 300 gEG L−1 h−1.
Introduction
Biomass has great potential as a substitute for fossil feedstock for the renewable production of transportation fuels and industrially important chemicals. It is estimated that more than 90% of the global annual amount of terrestrial plant biomass produced through photosynthesis – corresponding to 57 × 109 tonnes of elemental carbon – is not digestible by humans and this renewable resource may thus be used for fuel or chemical purposes without competition with the food-industry.1–4 In particular, cellulose – a β-1,4-homopolymer of glucose – has been highlighted recently as a suitable and abundant carbon source for the production of chemicals.5–27Ethylene glycol is a valuable product used in antifreeze liquids and as a precursor for polymers such as polyethylene terephthalate (PET). The global annual production of ethylene glycol is experiencing a tremendous increase due to the rising demand for polyesters.28,29 Nowadays, ethylene glycol is produced mainly from ethylene, a petrochemical or bioethanol-derived product.30 An alternative route, namely the direct catalytic conversion of cellulosic biomass to ethylene glycol, can reduce the dependence of the polymer and antifreeze industries on petroleum or multi-step processes, enabling the production of packaging materials from renewable sources.
The formation of ethylene glycol from (reduced) sugars has been reported since 1935.31–41 Sorbitol, the hydrogenation product of glucose, was often used as feed and catalytically converted into a mixture of glycerol, ethylene glycol and 1,2-propanediol. Although product distributions varied with the catalyst type, additives like CaO and reaction conditions (pressure, substrate concentration and temperature), 1,2-propanediol always appeared to be one of the most dominant products. It was only since the recent discovery by Ji et al.,42,43 who reported the direct catalytic conversion of cellulose to ethylene glycol, that the selective formation of ethylene glycol was conceivable. In their first publication, they noted a remarkable 61% yield of ethylene glycol with a nickel-promoted tungsten carbide catalyst in a one-pot aqueous batch reaction of 30 min at 518 K. In later studies,44,45 the yield was further increased up to 75% by using different carbon supports with a better pore structure. Others recently reported the use of near-stoichiometric amounts of WO3 in combination with Ru on carbon for the conversion of sugars like glucose to 50% ethylene glycol.46 Based on cellulose conversion with tungstic acid (H2WO4) and Ru on carbon, the suggestion was made by Tai et al.47 that dissolved HxWO3 is the active component responsible of catalyzing the C–C bond cleavage. Those findings opened the way for other combinations of hydrogenation catalysts and tungsten-based catalysts.48,49 Unfortunately, low substrate concentration (often less than 10 g L−1 in water) and sometimes complicated catalyst synthesis, in casu nickel tungsten carbide, could hamper industrial upscaling in its present form. The mechanism of C–C bond cleavage leading to ethylene glycol formation and the intermediates involved are not yet fully elucidated. While a direct hydrogenolysis mechanism was mentioned in the first reports, recent research by Zhang and coworkers points to a selective retro-aldol mechanism at the origin of the C–C cleavage, followed by hydrogenation.45,48,50
In the frame of an industrial collaboration, we thoroughly investigated the bifunctional Ni tungsten carbide system to convert renewable feedstock to ethylene glycol. Glucose instead of cellulose was used, as highly concentrated cellulosic suspensions are very difficult to handle in state-of-the-art industrial processing. A fed-batch system was selected as this reactor type simulates the slow release of glucose from cellulose through hydrolysis in a batch reaction, ensuring low glucose concentration. As such, degradation of thermolabile glucose is prevented, while still allowing the ability to pump in highly concentrated glucose syrups, viz. up to 333 g L−1 in this work. Moreover, such concentrated glucose streams of industrial grade are available today at a reasonable price, whereas in the future, they could become cheaper via the hydrolysis of cellulose in second generation biorefineries. Indeed, the release of glucose from cellulose is becoming increasingly viable with solid acid catalysts and enzymes, foreseeing glucose availability on a large scale.11,22,51,52 Therefore, processes that convert glucose into valuable chemicals53 – e.g. via fed-batch processing50 with solid catalysts, as reported in this contribution for ethylene glycol – will be of importance to fuel the economic feasibility of the future biorefineries. Very recently, Zhang and coworkers reported an engineering study using a semi-continuous setup for producing ethylene glycol from aqueous glucose (final concentration 50 g L−1) with the combination of a homogeneous tungsten catalyst and heterogeneous Ru on carbon.50
Besides enabling the use of a highly concentrated glucose feed (final concentration 200 g L−1), the fed batch set-up in our study is also ideal to unambiguously clarify the reaction network of ethylene glycol formation by performing a series of experiments with different substrates. In this way, the conversion of any unstable intermediate is easily assessed because its degradation is avoided as a result of the limited contact time. Three groups of intermediates were examined: aldoses (ranging from trioses to hexoses), ketoses and the reduced forms of these sugars such as sorbitol, xylitol, erythritol/threitol, glycerol and ethylene glycol. Using the latter provides insight into its stability as it is the desired product. The fate of other identified intermediates, viz. products of hydrogenolysis and dehydration like 1,2-propanediol, 5-HMF and sorbitan, was evaluated as well. Through careful analysis of the product distributions of the different experiments and accurate determination of the carbon mass balance in liquid and gas, we here confirm that there are two reaction paths to ethylene glycol: (i) in the major route, glucose undergoes a selective retro-aldol reaction to glycol aldehyde and a tetrose, the latter is then cleaved as well via retro-aldol into two additional glycol aldehyde units which lead to ethylene glycol via hydrogenation; (ii) unselective hydrogenolysis of reduced sugars (ranging from triols to hexitols) also produces some additional ethylene glycol. Byproducts are mainly formed through hydrogenation of glucose (and lower monosaccharides) to stable sorbitol (and corresponding polyols) and their unselective C–C hydrogenolysis.
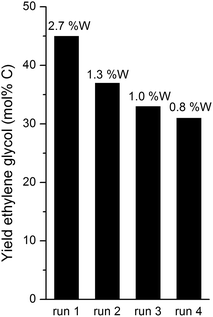
With the acquired mechanistic understanding, reaction conditions, reactor set-up and catalyst composition were adapted to stimulate retro-aldol, while suppressing glucose hydrogenation and dehydration and polyol hydrogenolysis. Ethylene glycol yields up to 66% were ultimately achieved from highly concentrated glucose syrups, while at shorter reaction times, a staggering ethylene glycol productivity of 293 g L−1 h−1 was reached, though somewhat at the expense of the ethylene glycol yield. Carbon mass balances approached 90 mol% in most cases after analysis of C in both gas and liquid phases. Preliminary reuse experiments indicated that the catalyst system could be recycled with acceptable losses in ethylene glycol yield and limited W-leaching in the cold reaction filtrate. Useful byproducts are sorbitol, erythritol/threitol, 1,2-propanediol and 1,2-butanediol.
Materials and methods
Catalyst preparation
The preparation of the tungsten carbide catalysts, viz. 2% Ni–30% W2C/AC-973 (W2C = tungsten carbide, AC = activated carbon, 973 = reduction temperature in K during pretreatment) was adapted from the procedure described by Ji et al.:42 2 g of activated carbon support (Darco KB-B, surface area 1500 m2 g−1) was impregnated with 3 ml of an aqueous solution containing 0.315 g Ni(NO3)2 hydrate and 1.177 g (NH4)6H2W12O40 and dried overnight at 493 K. The dried powder was reduced in a pure hydrogen flow (at 1600 ml g−1 h−1 contact time) according to the reported procedure. However, after reduction the catalyst was not passivated in a 1% O2/N2 flow for 12 hours, but directly transferred into the reactor under a nitrogen atmosphere. The synthesis of this catalyst is very subtle and the above procedure should be followed punctiliously to obtain reproducible data. Particular attention should be paid that the catalyst is not exposed to air after the reduction step. Powder XRD (X-ray diffraction) patterns were recorded on a STOE STADI P Combi diffractometer with an image plate position sensitive detector (IP PSD) in the region 2θ = 10 to 60° (Δ2θ = 0.03°). The measurements were performed in transmission mode at room temperature using CuKα1 radiation with λ = 1.54056 Å selected by means of a Ge(111) monochromator. The ICDD database PDF-2, release 2008 was used for identification of the phases present in the sample.54 The reflections at 2θ = 34.5°, 38.2°, 39.6° and 52.4° indicate the presence of the W2C-phase [01-079-0743]. This is in agreement with the W2C reflections measured by Ji et al.42 Occasionally an additional reflection at 2θ = 40.5° appeared as well, which is tentatively assigned to metallic W [01-089-2767]. However, the presence of this reflection entailed no noticeable effect on the activity of the catalyst. The presence of NiW [00-047-1172] is evidenced by a few reflections with the strongest one at 2θ = 43.5°.Catalytic reaction
In a typical batch experiment, the 100 ml stainless steel reactor (Parr Instruments Co.) was loaded with 0.8 g catalyst (2% Ni–30% W2C/AC-973) and 50 ml of the 200 g L−1 aqueous glucose solution. After flushing with hydrogen, the reactor was pressurized with 6.0 MPa hydrogen and heated to 518 K under constant stirring at 750 ppm. The moment at which the reactor reached a temperature of 518 K was taken as the starting point of the reaction. After one hour, the reactor was quickly cooled in an ice bed. Samples were taken from the cold reaction solution after opening the reactor.In a typical fed-batch experiment, the reactor was loaded with 0.8 g catalyst and 20 ml water. After flushing with hydrogen, the reactor was pressurized with 6.0 MPa hydrogen and heated to 518 K. After reaching the reaction temperature, the sugar solution was fed gradually into the reactor with a Waters 515 HPLC pump. During the course of the reaction, 30 ml of an aqueous 333 g L−1 (D-)glucose syrup was added at a constant flow rate of 0.167 ml min−1, leading to a total reaction time of 3 hours. In this way, a total of 10 g glucose and 50 ml water were present in the reactor, corresponding to a 200 g L−1 feed concentration in this work. Other addition rates were evaluated as well and they lead to different reaction times, e.g. 15 minutes in the case of a feeding rate of 2 ml min−1. After introducing the entire glucose solution, the reactor was cooled and the samples were taken in the same way as in the batch experiment. The fed-batch recycling experiments were performed with 0.8 g 2% Ni–30% W2C/AC starting with 4.5 MPa H2 pressure and a total reaction time of 1 hour. At the end of the reaction, the vessel was cooled and the catalyst was recovered by centrifugation (50 min, 10![[thin space (1/6-em)]](https://www.rsc.org/images/entities/char_2009.gif) 000 rpm) and subsequent decantation. Then, the catalyst was washed with 50 ml of H2O, followed by centrifugation/decantation. The wet catalyst was transferred into the reaction vessel with 20 ml of water for the 2nd run under identical reaction conditions. The recycling procedure was repeated for the 3rd and 4th runs.
000 rpm) and subsequent decantation. Then, the catalyst was washed with 50 ml of H2O, followed by centrifugation/decantation. The wet catalyst was transferred into the reaction vessel with 20 ml of water for the 2nd run under identical reaction conditions. The recycling procedure was repeated for the 3rd and 4th runs.
Analysis of the reaction products
The reaction products were analysed using an Agilent 1200 Series HPLC equipped with a Varian MetaCarb 67C column and a RID. Millipore water was used as a mobile phase. In addition, a Hewlett Packard 5890 GC, equipped with a HP 7673 auto sampler, a 50 m Poraplot Q column and a FID were used for a better separation of the C1 to C3 compounds such as methanol, ethanol, ethylene glycol and 1,2-propanediol. Long-chain polyols (C4, C5 and C6) were additionally quantified after derivatisation of the reaction products via silylation9 and analysed with a Hewlett Packard 5890 Series II GC equipped with a 50 m CP-Sil-5CB column and FID. All reported product yields are expressed as the molar fraction of carbon (mol% C) represented by that product, relative to the total amount of carbon introduced in the reactor. ICP-OES measurements for W content determination in the reaction filtrate were measured at 224.88 nm. Samples were hereto filtered and sodium hydroxide was added. Volumetric productivity values were calculated by dividing the total weight of ethylene glycol formed by the time of reaction and the total liquid reaction volume (in g L−1 h−1).Results and discussion
Performance of batch vs. fed-batch reactor set-ups
In this work, we studied the possibility of adapting the cellulose to ethylene glycol reaction system initiated by Zhang and coworkers42,43,50 to a fed-batch reactor using concentrated glucose syrups to achieve high ethylene glycol volume productivities. In an initial experiment we benchmarked the glucose to ethylene glycol conversion in the fed-batch reactor against that in the reference batch reactor. Table 1 shows that the batch experiment starting from a 200 g L−1 glucose solution results in less than 10% ethylene glycol yield. The dominant products are reduced C6 sugars such as sorbitol and their dehydrated forms such as sorbitan. Besides the products listed in Table 1, a significant amount of char was found in the reactor vessel after reaction. This char is likely formed through the decomposition of glucose at high reaction temperatures.55–57 Knežević et al.55 also reported char formation from glucose in hot compressed water. A known route to char is the condensation of sugars and their dehydration products like 5-hydroxymethylfurfural (5-HMF) to oligomeric and polymeric fractions, which eventually become insoluble. High glucose concentrations are more prone to such 5-HMF and char formation.58 In this respect, it is important to note that no such amount of char is observed in a typical batch reaction starting from cellulose instead of glucose.42,43,50 This observation is likely explained by the gradual release of glucose through rate determining hydrolysis of the recalcitrant cellulose. In accordance with the literature, microcrystalline Avicel cellulose (1 wt% in water) was fully converted after 24 hours at 518 K in our setup, yielding 59 wt% ethylene glycol at a carbon mass balance of 78 mol%. The issue of char formation emphasises the importance of a low glucose concentration and implies that a batch reactor setup is not ideal to achieve high volume productivities.| Reactor set-up | Batcha | Fed-batchb |
|---|---|---|
| a Conditions batch set-up: the reactor was loaded with 50 ml H2O, 10 g glucose and 0.8 g 2% Ni–30% W2C/AC-973, pressurized with 60 bar H2 and kept at 518 K during 3 hours. b Conditions fed-batch set-up: the reactor was initially loaded with 20 ml H2O and 0.8 g 2% Ni–30% W2C/AC-973, pressurized with 60 bar H2 and heated to 518 K. In 3 hours, 30 ml of a 333 g L−1 aqueous glucose solution was pumped into the reactor vessel bringing the overall feed concentration of glucose to 200 g L−1. | ||
| Conversion | 100 | 100 |
| Yield of products | ||
| Sorbitol | 28 | 10 |
| Mannitol | 1 | 3 |
| Sorbitan isomers | 20 | 3 |
| Xylitol | 3 | 0.2 |
| Arabinitol | 0.5 | 0.2 |
| Erythritol | 3 | 6 |
| Threitol | 0.5 | 2 |
| 1,2-Butanediol | 2 | 3 |
| Glycerol | 3 | 3 |
| 1,2-Propanediol | 5 | 4 |
| n-Propanol | 2 | 0.7 |
| Ethylene glycol | 8 | 47 |
| Ethanol | 0.1 | 0.3 |
| Methanol | 0.3 | 0.4 |
| Carbon balance | 76 | 83 |
The proposed benefits of the fed-batch reactor strategy are clear from the data in Table 1: the ethylene glycol yield increases six-fold to 47% at the expense of reduced (and subsequently dehydrated) sugars, while the mass balance increases from 76% to 83%, when compared to the batch reactor experiment. To close the mass balance, gas phase and solid residues were analyzed as well, but both pointed to less than 0.5 mol% C content of the input carbon. This indicates little char formation.
The fed-batch setup in Table 1 produces about 32 g L−1 h−1 ethylene glycol. To explain the tremendous difference between fed-batch and batch, a true understanding of the reaction network was ambiated. Afterwards, the fed-batch system was further optimized with regard to temperature, pressure and feed rate.
Investigation of the reaction network
Table 1 shows that sorbitol and erythritol are the main byproducts in the fed-batch reaction. Low amounts of mannitol, threitol, glycerol, sorbitan isomers, 1,2-butanediol and 1,2-propanediol were also formed (<5% yield), as well as trace amounts of xylitol, arabinitol, n-propanol, ethanol and methanol (<1% yield). To elucidate the whole reaction network including these products and to track the main reaction pathways towards ethylene glycol formation, these identified chemicals were fed into the reactor under the same reaction conditions of Table 1, albeit at somewhat lower concentration. For the network study, 30 ml of a 17 g L−1 substrate solution is gradually fed in the 100 ml reactor over 3 hours with constant feed rate.Four different reaction pathways starting from glucose were considered a priori in the study. Firstly, since the conversion of a glucose molecule into 3 ethylene glycol molecules formally requires six hydrogen atoms, the reaction in water needs to be performed under hydrogen pressure. As such, one obvious reaction is the direct hydrogenation of glucose to sorbitol. Its subsequent hydrogenolysis could lead to ethylene glycol, as was suggested earlier.31–40 If this is the main route to ethylene glycol, the Ni tungsten carbide catalyst should have a certain unique hydrogenolytic activity, mainly producing ethylene glycol instead of 1,2-propanediol and glycerol. Previous research on glucose decomposition in hot-compressed water suggested the occurrence of three other chemical reactions:56,58–60 dehydration to 5-HMF (and others), cleavage to smaller compounds through retro-aldol reaction and aldose–ketose isomerisation. These reactions could all somehow play a role in the formation of ethylene glycol.
Of the four reaction types, dehydration of glucose will be considered first. This reaction has been reported to produce mainly 1,6-anhydroglucose (AHG) and 5-HMF.56,58,60,61 However, no considerable amounts of AHG or 5-HMF were detected in our batch nor fed-batch reaction, as shown in Table 1. Their absence could indicate fast condensation/polymerization under the applied reaction conditions, leading to char. Taking into account the mass balance, there will indeed be some char formed in the fed-batch set-up, but additional experiments using 5-HMF and AHG as a feed did exclude their role in ethylene glycol synthesis. Glucose dehydration was thus dismissed as a primary reaction pathway to ethylene glycol. The reaction is thus considered as an undesirable side-reaction that needs to be avoided as much as possible to improve the carbon efficiency. In other words, the catalyst preferably contains no (strong) acidity so as to circumvent such catalyzed dehydration.
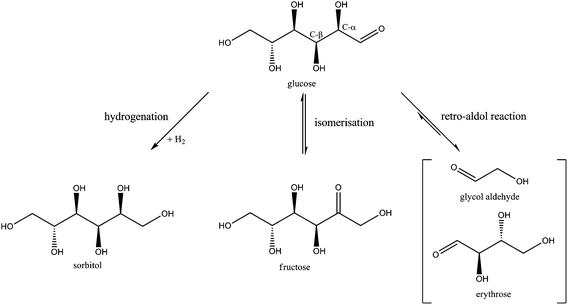
The possible primary reaction pathways for converting glucose to ethylene glycol that should still be considered are hydrogenation (potentially followed by dehydration and/or hydrogenolysis), retro-aldol and aldose–ketose isomerisation. These pathways, visualized in Scheme 1, were further studied in more detail by feeding their corresponding products in the fed-batch reactor.
| Substrate | Sorbitol dehydration mixturea | Isosorbide |
|---|---|---|
| Reaction conditions: fed-batch reactor loaded with 20 ml H2O and 0.8 g 2% Ni–30% W2C/AC-973, pressurized with 60 bar H2 and heated to 518 K.a In 3 hours, 30 ml of a 17 g L−1 of the sorbitol dehydration mixture (>75% of sorbitan) was pumped into the reactor vessel. Product distribution and carbon balance calculated on the total amount of sorbitan isomers, sorbitol and isosorbide in the reactor.b Conversion of sorbitan. | ||
| Conversion | 23b | 19 |
| Product distribution | ||
| Sorbitol | 9 | |
| Sorbitan isomers | 54 | |
| Isosorbide | 7 | 81 |
| Ethylene glycol | 0 | 0 |
| Carbon balance | 70 | 81 |
| Substrate | Sorbitol | Xylitol | Erythritol | Glycerol | Ethylene glycol |
|---|---|---|---|---|---|
| a Reaction conditions: fed-batch reaction; reactor loaded with 20 ml H2O and 0.8 g 2% Ni–30% W2C/AC-973, pressurized with 60 bar H2 and heated to 518 K. In 3 hours, 30 ml of a 17 g L−1 substrate solution was pumped into the reactor vessel. | |||||
| Conversion | 68 | 55 | 51 | 15 | 7 |
| Product distribution | |||||
| Sorbitol | 32 | ||||
| Mannitol | 2 | ||||
| Sorbitan | 5 | ||||
| Xylitol | 0.4 | 45 | |||
| Arabinitol | 0.8 | 3 | |||
| Erythritol | 1 | 5 | 49 | ||
| Threitol | 1 | 1 | 9 | ||
| Glycerol | 8 | 5 | 2 | 85 | |
| 1,2-Propanediol | 14 | 11 | 13 | 8 | |
| n-Propanol | 6 | 3 | — | 0.8 | |
| Ethylene glycol | 14 | 15 | 15 | 2 | 93 |
| Ethanol | 0.2 | 0.2 | — | — | — |
| Methanol | 0.4 | 0.7 | 2 | 3 | 1 |
| Carbon balance | 85 | 89 | 90 | 99 | 94 |
The dehydrated sorbitol products are not very reactive under the applied reaction conditions as reflected by the moderate conversion. Since no ethylene glycol or other degradation products are detected from the conversion of sorbitan isomers (in the sorbitol dehydration mixture) and isosorbide, it is clear that these compounds are not at play in the formation of ethylene glycol. For both reactions, low mass balances were measured, probably due to polymerisation reactions, while no other products were detected. The latter is in agreement with an earlier report on the conversion of cellulose and sorbitol to isosorbide which reports the formation of insoluble byproducts.25
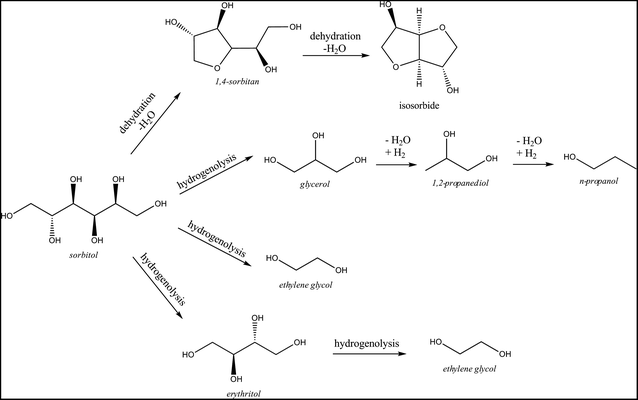
The conversion of the set of reduced sugars (see Table 3) reveals that their stability increases with decreasing carbon chain length: while sorbitol is slowly converted into other products, ethylene glycol – the desired product in this study – is much more stable under the applied reaction conditions. Such high product stability is of course advantageous for the fed-batch reaction with regard to ethylene glycol production. Conversion of glycerol reveals 1,2-propanediol as the main product. It was previously reported62,63 that glycerol can be converted via dehydration to hydroxyacetone and subsequent hydrogenation to 1,2-propanediol. The conversion of erythritol and xylitol, reduced sugars with a C4 and C5 backbone respectively, results in approximately equal amounts of C2 and C3 compounds. This product distribution differs from that of the reaction with sorbitol as C3 compounds were analysed as the main products there, with a total selectivity of 53%. Because ethylene glycol is not the main product from sorbitol (16% selectivity at 14% yield), its direct formation from sorbitol is not considered as the major pathway. Indeed, if ethylene glycol originated primarily from direct hydrogenolysis of sorbitol, a reaction starting from sorbitol would be expected to yield more ethylene glycol than a reaction starting from glucose, which is not the case (compare data in Table 3vs.Tables 1 and 4). Moreover, the data from Table 3 show that sorbitol is converted through two different pathways (presented in Scheme 2). The dominant pathway is sorbitol C–C and C–O hydrogenolysis, forming mainly C3 compounds such as glycerol, 1,2-propanediol and n-propanol in addition to smaller amounts of ethylene glycol.
| Substrate | Glucose | Mannose | Galactose | Xylose | Arabinose | Erythrose | Glyceraldehyde |
|---|---|---|---|---|---|---|---|
| a Reaction conditions: fed-batch reaction; reactor loaded with 20 ml H2O and 0.8 g 2% Ni–30% W2C/AC-973, pressurized with 60 bar H2 and heated to 518 K. In 3 hours, 30 ml of a 17 g L−1 substrate solution was pumped into the reactor vessel. | |||||||
| Conversion | 100 | 100 | 100 | 100 | 100 | 100 | 100 |
| Yield of products | |||||||
| Sorbitol | 9 | 4 | — | ||||
| Galactitol | — | — | 15 | ||||
| Mannitol | 3 | 8 | — | ||||
| Sorbitan | 3 | 3 | 2 | ||||
| Xylitol | 0.4 | 0.4 | — | 15 | 1 | ||
| Arabinitol | 0.3 | 0.7 | — | 4 | 9 | ||
| Erythritol | 6 | 8 | 3 | 0.5 | 0.7 | 13 | |
| Threitol | 2 | 3 | 7 | — | — | 5 | |
| Glycerol | 7 | 6 | 11 | 20 | 25 | 1 | 54 |
| 1,2-Propanediol | 8 | 4 | 6 | 8 | 8 | 2 | 18 |
| n-Propanol | — | 4 | — | 2 | 3 | — | 2 |
| Ethylene glycol | 36 | 45 | 33 | 29 | 34 | 49 | 7 |
| Ethanol | 0.2 | 0.2 | 0.2 | 0.3 | 0.3 | 0.5 | 0.3 |
| Methanol | 0.5 | 0.4 | 0.7 | 2 | 1 | 0.9 | 1 |
| Carbon balance | 75 | 87 | 78 | 81 | 82 | 71 | 82 |
In parallel, dehydration products like sorbitan isomers (mainly 1,4-sorbitan) are formed as well, further leading to isosorbide and polymerization products as shown in Table 2. Thus, despite some ethylene glycol formation from sorbitol, the hydrogenation of glucose to sorbitol is clearly not a dominant pathway to ethylene glycol in the catalytic system, which is in agreement with the report by Zhao et al.50 Moreover, since sorbitol is significantly more stable than glucose under the applied reaction conditions, its formation through hydrogenation should be avoided in the interest of maximizing the yield of ethylene glycol.
| Substrate | Fructose | Erythrulose | DHA |
|---|---|---|---|
| a Reaction conditions: fed-batch reaction; reactor loaded with 20 ml H2O and 0.8 g 2% Ni–30% W2C/AC-973, pressurized with 60 bar H2 and heated to 518 K. In 3 hours, 30 ml of a 17 g L−1 substrate solution was pumped into the reactor vessel. DHA = dihydroxyacetone. | |||
| Conversion | 100 | 100 | 100 |
| Yield of products | |||
| Sorbitol | 5 | ||
| Mannitol | 5 | ||
| Sorbitan | 2 | ||
| Xylitol | 0.2 | ||
| Arabinitol | 0.2 | ||
| Erythritol | 0.6 | 10 | |
| Threitol | 0.4 | 9 | |
| 1,2-Butanediol | — | 13 | |
| Glycerol | 24 | 2 | 66 |
| 1,2-Propanediol | 28 | 21 | 25 |
| n-Propanol | 5 | 0.4 | 1 |
| Ethylene glycol | 6 | 10 | 1 |
| Ethanol | 0.5 | 0.4 | 0.1 |
| Methanol | 0.6 | 5 | 0.4 |
| Carbon balance | 78 | 71 | 94 |
Every aldose leads to detectable amounts of the corresponding sugar alcohol originating from carbonyl hydrogenation. As discussed in the previous section, these reduced sugars can undergo unselective hydrogenolysis and dehydration reactions and their stability depends on their chain length, with ethylene glycol as the most stable one. For these reactivity reasons, the amount of the corresponding sugar alcohols that are retrieved from these sugars decreases with increasing chain length.
Carbonyl hydrogenation of galactose to galactitol seems slightly more competitive when compared to that of glucose and mannose, while mannose led to the highest ethylene glycol yield. This could indicate that selective C–C splitting is sensitive to the conformation of the hydroxyls in the sugar molecule, which are involved in the coordination with the catalyst site. Interestingly, the product ratio of erythritol vs. threitol reverses when comparing the reaction outcome of mannose and glucose with galactose. The stereoselectivity of the higher threitol content with galactose agrees with the selective retro-aldol Cα–Cβ splitting (to threose and glycol aldehyde), followed by carbonyl hydrogenation.
The conversion of the C5 aldoses – xylose and arabinose – resulted in the formation of equal amounts of C2 and C3 products. This is well in agreement with a retro-aldol pathway: the aldoses are cleaved into glyceraldehyde and glycol aldehyde, which yield glycerol and ethylene glycol upon hydrogenation. Conversion of erythrose (a C4) through a sequential retro-aldol and hydrogenation reaction is expected to yield mainly ethylene glycol. This is indeed supported by the data in Table 4, where ethylene glycol is the main product. Erythritol, formed via carbonyl hydrogenation of erythrose, is the main byproduct. Reaction with glyceraldehyde resulted in a fairly low selectivity to ethylene glycol. Instead, glyceraldehyde was mainly hydrogenated to glycerol with some subsequent hydrogenolysis forming 1,2-propanediol and n-propanol.
Generally, the high selectivity for cleaving the α–β C–C bond with respect to the aldehyde group (e.g. see Scheme 1) strongly supports the retro-aldol cleavage mechanism, in agreement with some earlier studies.50,58,64,65
More specifically, the conversion of fructose results in about 57% of C3 compounds such as glycerol, 1,2-propanediol and n-propanol. This is consistent with the report of Zhang and co-workers on the preferential conversion of inuline (= a polyfructan) rich artichoke to 1,2-propanediol.66 In the conversion of erythrulose, C3 compounds are also the main products, but with a lower carbon selectivity of about 23%. Finally, the conversion of dihydroxyacetone produces almost no smaller fragments (>90% of all carbon remains contained in the C3 fraction), glycerol and 1,2-propanediol being the main products.
These observations are consistent with retro-aldol cleavage between the α and β position relative to the carbonyl and lead to a higher selectivity for C3 compounds in the conversion of fructose compared to glucose: the C3/C2 product ratio amounts to 8.8 for fructose, compared to 0.4 for glucose. This difference in ratio unambiguously proves that retro-aldol Cα–Cβ cleavage prevails over unselective hydrogenolysis, which should otherwise yield similar ratios for both hexoses. Since dihydroxyacetone does not have a reactive β position to the carbonyl, no retro-aldol reaction can take place and any smaller (C1 and C2) compounds are expected to result from hydrogenolysis of glycerol. Since these compounds are almost absent, hydrogenolysis is not a preferred reaction pathway under the applied reaction conditions. By comparing the data of erythrose (Table 4) and erythrulose (Table 5) conversion, differences in the product spectrum again support retro-aldol cleavage rather than random tetrol hydrogenolysis: up to 50% of EG was obtained for erythrose compared to only 10% for erythrulose. Interestingly, the previously reported (Lewis) acid-catalyzed conversion of tetroses to vinyl glyoxal, an interesting precursor for novel polyester building blocks,26,67 was not observed in the applied reaction conditions, possibly due to the preferred retro-aldol reaction instead of the retro-Michael dehydration68 in the presence of the Ni–W2C catalyst at high temperatures.
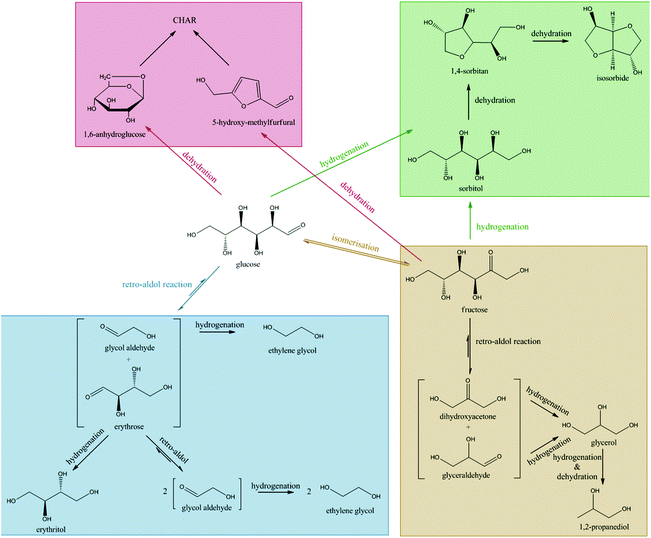
In summary, isomerisation during the glucose to ethylene glycol reaction will have a profound influence on the final product distribution. Isomerisation of glucose to fructose will lead to byproducts according to two parallel pathways. Firstly, fructose is rapidly hydrogenated to sorbitol/mannitol, which undergoes further hydrogenolysis and dehydration reactions as in Scheme 2. Alternatively, fructose undergoes a retro-aldol reaction, eventually leading to C3 products such as glycerol, 1,2-propanediol and n-propanol. Since both of these pathways (summarized as well in Scheme 3) lead to C3 products, glucose isomerisation will always result in an increase in C3 product selectivity.
In light of previous studies of this catalytic system,45 we presume that the retro-aldol activity is attributed to the tungsten component of the catalyst and the hydrogenation activity is associated with the metallic nickel component of the catalyst. How the tungsten component of the catalyst stimulates the selective C–C bond cleavage is not yet fully understood, but there might be a link with the unique epimerization activity of tungsten and molybdenum oxides at slightly acidic pH, firstly reported by Bilik.69–73 Isotope labeling in glucose to mannose epimerization experiments demonstrated the involvement of a 1,2-carbon shift due to a catalyzed C–C cleavage between position α and β with respect to the aldehyde group.71 Probably, the high temperature applied in this work prohibits the reformation of the new C–C between the aldehyde carbon and Cβ, that normally occurs in the epimerization mechanism. However, more fundamental studies are required to support this hypothesis.
Byproducts are mainly formed through direct hydrogenation of glucose and the intermediate erythrose to sorbitol/mannitol and erythritol, respectively. These byproducts may undergo further hydrogenolysis to smaller fragments. Additionally, isomerisation of glucose to fructose also leads to the formation of byproducts, since the subsequent retro-aldol reaction of fructose produces C3 sugars, dihydroxyacetone and glyceraldehyde. These trioses are hydrogenated to glycerol, which leads to only small amounts of ethylene glycol as a result of slow hydrogenolysis.
The mechanistic insights into the reaction network are further used to rationalise the influence of reaction conditions (temperature, pressure), fed-batch parameters (glucose addition rate) and catalyst composition on the yield and volume productivity of ethylene glycol.
Fine-tuning of reaction conditions
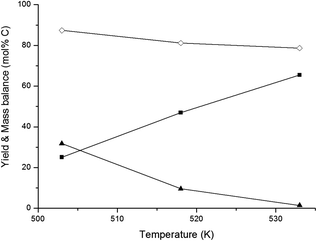
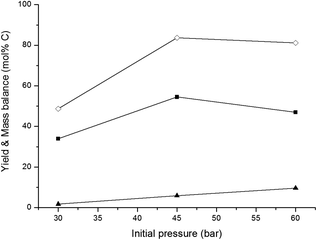
In an overview by Crezee et al.,74 the activation energy for hydrogenation of glucose to sorbitol is reported to be highly dependent on the type of catalyst. Déschamp et al.75 reported an apparent activation energy of 67 kJ mol−1 over a nickel catalyst, while an apparent activation energy of 55 kJ mol−1 over a ruthenium catalyst was reported by Crezée et al.74 (both determined between 343 and 403 K). Based on these data, it can be assumed that the apparent activation energy of hydrogenation over the 2% Ni–30% W2C/AC-973 catalyst ranges somewhere between 50 and 70 kJ mol−1. The activation energy of the retro-aldol reaction was examined by Yoshida et al.65 They investigated glucose decomposition in hot compressed liquid and determined an activation energy of 126 kJ mol−1 for the transformation of glucose into erythrose. Although this value may be lowered somewhat by the presence of the 2% Ni–30% W2C/AC-973 catalyst, the activation energy of the retro-aldol reaction is still expected to be significantly higher than that of the hydrogenation reaction since a C–C bond needs to be cleaved. The recent paper by Zhao et al. confirms the differences in energy barriers: they report 148 and 38 kJ mol−1 for the retro-aldol and hydrogenation of glucose, respectively, under similar conditions with a W based salt and Ru/carbon.50 A direct consequence of the corroborated assumptions is that the retro-aldol reaction should be favoured over the hydrogenation reaction by increasing the reaction temperature, resulting in higher ethylene glycol yields and a reduced formation of sugar alcohols like sorbitol. The hypothesis is indeed in agreement with the data shown in Fig. 1. Ethylene glycol yield increases with temperature up to 66 mol% C at 533 K, while lower reaction temperatures favour the co-formation of sorbitol.
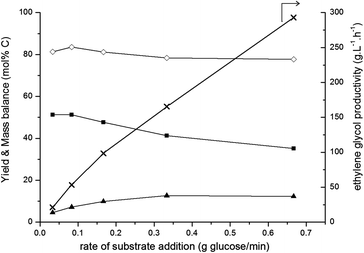
These trends are supported by the fed-batch data shown in Fig. 3 and from earlier kinetic studies:50 fast addition of glucose (high glucose concentration; right-hand side) leads to a moderate ethylene glycol yield and a relatively low carbon mass balance. This is probably due to glucose dehydration and decomposition reactions, forming insoluble char. Decreasing the rate of glucose addition leads to an increased ethylene glycol yield and a higher carbon mass balance due to promotion of the retro-aldol reaction over side reactions. However, at the lowest glucose addition rates, ethylene glycol yield stabilizes around 50% in the applied conditions.
For industrial set-ups, the volumetric productivity (g L−1 h−1) of ethylene glycol is also an important factor, next to the classically reported molar yield. Increasing the rate of glucose addition leads to ethylene glycol productivities near 300 g L−1 h−1 (right-hand axis in Fig. 3) without drastically compromising the ethylene glycol yield (left-hand axis). Such high productivities are unattainable for a batch process and typically prove the great value of the fed-batch set-up for sugar and biomass conversions. For comparison, ethylene glycol productivities in glucose conversion reactions in a batch or fed-batch set-up under the same reaction conditions (see Table 1) are 5 g L−1 h−1 and 32 g L−1 h−1, respectively. There, this six-fold difference was caused merely by changing the reactor set-up, without further optimising the pressure, temperature and feed addition rate. When glucose was gradually released from cellulose by using a batch set-up, which Ji et al.42,43 achieved by starting from 10 g L−1 cellulose in water, an ethylene glycol yield of 61 wt% was obtained. This corresponds to an ethylene glycol productivity of 12.2 g L−1 h−1. The fed-batch system not only allows the use of a higher substrate final concentration, e.g. 200 gglucose L−1, additionally the substrate addition rate can be readily adapted as well. By doing so, a maximum ethylene glycol volume productivity of approximately 25 times higher than the productivity obtained with cellulose in a batch set-up, viz. 293 g L−1 h−1, was reached.
Conclusions
Bifunctional nickel containing tungsten carbide catalysts, previously used for the conversion of cellulose to ethylene glycol, are also very effective for the conversion of glucose in a fed-batch set-up with an ethylene glycol yield ranging from 36 to 66% at full glucose conversion, corresponding to an ethylene glycol volume productivity between 30 and 300 g L−1 h−1. The final yield and volume productivity depend on the catalyst composition, reaction temperature, hydrogen pressure (closed system or continuous feed) and glucose addition rate. The catalyst showed a gradual loss of activity.The use of the fed-batch reactor allowed us to systematically investigate the reaction network with identification of the origin of nearly all byproducts. The importance of the retro-aldol reaction, followed by hydrogenation, for the formation of ethylene glycol was unambiguously confirmed in this reaction network study. This mechanistic insight will open the way for designing and developing new catalysts, which favour retro-aldol reaction, while suppressing unwanted isomerisation, dehydration and direct hydrogenation side reactions in the reductive atmosphere.
The use of a fed-batch reactor entails many other advantages for the conversion of glucose to ethylene glycol. While simulating the release of glucose from cellulose upon hydrolysis during the reaction, gradual feeding of glucose in the fed-batch reactor occurs in a more controlled way and allows higher throughputs compared to real cellulosic biomass. For the latter, it is known that hydrolysis rates are fluctuating due to the heterogeneous nature of cellulose, with its crystalline and amorphous parts, and the presence of impurities. Compared to batch experiments, gradual addition of concentrated aqueous glucose solutions results in high ethylene glycol selectivities caused by a diminished hydrogenation to sorbitol and a diminished isomerisation to fructose – both leading to unwanted C3 compounds – and by bypassing the degradation route to furanics (and ultimately to char) under the high reaction temperature applied. The use of a fed-batch reactor is able to provide a high volumetric productivity of ethylene glycol and thus results in a highly concentrated ethylene glycol product stream. The latter is important with regard to an economically feasible separation of ethylene glycol from the aqueous solution. However, as in the current ethylene oxide based production, where glycols are already being separated from water via distillation, this hurdle will be overcome.81 Fine-tuning of the glucose addition rate resulted in a maximum ethylene glycol productivity of 293 g L−1 h−1 at an ethylene glycol yield of about 35% at 518 K and 45 bar partial H2 pressure. Higher ethylene glycol yields around 66% were obtained at higher temperature and lower flow rates. The influence of temperature, pressure and catalyst composition was fully assessed. Interestingly, an optimal bifunctional catalyst system was obtained by physically combining a balanced amount of Ni on activated carbon with W2C on activated carbon. Spatial proximity of both catalytic species seems therefore of less importance.
In light of the use of glucose as a platform chemical in future second generation biorefineries, high productivity values could render the production of bio-derived ethylene glycol from glucose more economically feasible. Fed-batch reactor set-ups easily tolerate the use of various kinds of soluble biomass fractions such as sugar alcohols, ketoses and aldoses. By replacing the initial feed composition with other available sugar blends like sucrose and hydrolysates of (hemi)cellulose, alcohol product composition and proportion may be changed readily and can be predicted based on this reaction network study. Such flexibility foresees a fast anticipation on varying market demands and prices of the produced polyols such as ethylene glycol, 1,2-propanediol and glycerol.
Future work should concentrate on new catalyst designs with focus on balancing the various active sites to further improve the retro-aldol reaction route at the expense of the other competitive but undesired reaction pathways. Long term catalyst stability in hot condensed water will be another challenge to tackle in the near future before ethylene glycol production from aqueous glucose can be conceived commercially.
Acknowledgements
R.O. acknowledges the financial support of Syral. M.D. acknowledges “FWO Vlaanderen” (grant 1.1.955.10N) for financial support and his appointment as a postdoctoral researcher. Methusalem CASAS is acknowledged for long term funding (E.G.) and the Belgian government is acknowledged for financial support through IAP funding (Belspo). B.O. thanks the EU FP7 project BIOCORE that is supported by the European Commission through the Seventh Framework Programme for Research and Technical development under contract no. FP7-241566, for financial support.Notes and references
- M. L. Imhoff, L. Bounoua, T. Ricketts, C. Loucks, R. Harrlss and W. T. Lawrence, Nature, 2004, 429, 870–873 CrossRef CAS PubMed.
- J.-P. Lange, Biofuels, Bioprod. Biorefin., 2007, 1, 39–48 CrossRef CAS.
- J. H. Clark and F. Deswarte, Introduction to Chemicals from Biomass, Wiley-VCH, West Sussex, 2008 Search PubMed.
- U. Roland, D. Sell and T. Hirth, Renewable Raw Materials: New Feedstocks for the Chemical Industry, Wiley-VCH, Weinheim, 2011 Search PubMed.
- A. Corma, S. Iborra and A. Velty, Chem. Rev., 2007, 107, 2411–2502 CrossRef CAS PubMed.
- P. L. Dhepe and A. Fukuoka, ChemSusChem, 2008, 1, 969–975 CrossRef CAS PubMed.
- R. Rinaldi and F. Schüth, ChemSusChem, 2009, 2, 1096–1107 CrossRef CAS PubMed.
- R. Rinaldi and F. Schüth, Energy Environ. Sci., 2009, 2, 610–626 CAS.
- J. Geboers, S. Van de Vyver, K. Carpentier, K. de Blochouse, P. A. Jacobs and B. F. Sels, Chem. Commun., 2010, 46, 3577–3579 RSC.
- S. Van de Vyver, J. Geboers, M. Dusselier, H. Schepers, T. Vosch, L. Zhang, G. Van Tendeloo, P. A. Jacobs and B. F. Sels, ChemSusChem, 2010, 3, 698–701 CrossRef CAS PubMed.
- S. Van de Vyver, L. Peng, J. Geboers, H. Schepers, C. F. de, C. J. Gommes, B. Goderis, P. A. Jacobs and B. F. Sels, Green Chem., 2010, 12, 1560–1563 RSC.
- R. Palkovits, K. Tajvidi, J. Procelewska, R. Rinaldi and A. Ruppert, Green Chem., 2010, 12, 972–978 RSC.
- P. Gallezot, Top. catal., 2010, 53, 1209–1213 CrossRef CAS.
- J. Geboers, S. Van de Vyver, R. Ooms, B. Op de Beeck, P. A. Jacobs and B. F. Sels, Catal. Sci. Technol., 2011, 1, 714–726 Search PubMed.
- J. Geboers, S. Van de Vyver, K. Carpentier, P. A. Jacobs and B. F. Sels, Chem. Commun., 2011, 47, 5590–5592 RSC.
- J. Geboers, S. Van de Vyver, K. Carpentier, P. A. Jacobs and B. F. Sels, Green Chem., 2011, 13, 2167–2174 RSC.
- S. Van de Vyver, J. Geboers, P. A. Jacobs and B. F. Sels, ChemCatChem, 2011, 3, 82–94 CrossRef CAS.
- S. Van de Vyver, J. Thomas, J. Geboers, S. Keyzer, M. Smet, W. Dehaen, P. A. Jacobs and B. F. Sels, Energy Environ. Sci., 2011, 4, 3601–3610 CAS.
- R. Palkovits, K. Tajvidi, A. M. Ruppert and J. Procelewska, Chem. Commun., 2011, 47, 576–578 RSC.
- M. J. Climent, A. Corma and S. Iborra, Green Chem., 2011, 13, 520–540 RSC.
- S. Van de Vyver, J. Geboers, W. Schutyser, M. Dusselier, P. Eloy, E. Dornez, J. W. Seo, C. M. Courtin, E. M. Gaigneaux, P. A. Jacobs and B. F. Sels, ChemSusChem, 2012, 5, 1549–1558 CrossRef CAS PubMed.
- N. Meine, R. Rinaldi and F. Schüth, ChemSusChem, 2012, 5, 1449–1454 CrossRef CAS PubMed.
- M. Benoit, A. Rodrigues, K. De Oliveira Vigier, E. Fourre, J. Barrault, J.-M. Tatibouet and F. Jerome, Green Chem., 2012, 14, 2212–2215 RSC.
- D. M. Alonso, S. G. Wettstein and J. A. Dumesic, Green Chem., 2013, 15, 584–595 RSC.
- B. Op de Beeck, J. Geboers, S. Van de Vyver, J. Van Lishout, J. Snelders, W. J. J. Huijgen, C. M. Courtin, P. A. Jacobs and B. F. Sels, ChemSusChem, 2013, 6, 199–208 CrossRef CAS PubMed.
- M. Dusselier, P. Van Wouwe, A. Dewaele, E. Makshina and B. F. Sels, Energy Environ. Sci., 2013, 6, 1415–1442 CAS.
- H. Kobayashi and A. Fukuoka, Green Chem., 2013, 15, 1740–1763 RSC.
- IHS, World Ethylene Oxide and Glycol Analysis, http://www.sriconsulting.com/WP Accessed 29/03/2012, 2012.
- S. Pariente, N. Tanchoux, F. Fajula, G. Centi and S. Perathoner, Bioethanol: Production and Pathways for Upgrading and Valorization, in Catalysis for Renewables: From Feedstock to Energy Production, ed. G. Centi and R. A. van Santen, Wiley, Weinheim, 2007, pp. 183–207 Search PubMed.
- A. Morschbacker, Polym. Rev., 2009, 49, 79–84 CrossRef CAS.
- H. S. Rothrock, 2 004 135, 1935.
- M. S. S. R. Tanikella, 0 072 629, 1983.
- M. Dubeck and G. G. Knapp, 4 430 253, 1984.
- B. Casale and L. Marini, 0 510 238, 1992.
- G. Gubitosa and B. Casale, 0 553 815, 1993.
- G. Gubitosa and B. Casale, 93/14867, 1993.
- S. P. Chopade, D. J. Miller, J. E. Jackson, T. A. Werpy, J. G. Frye Jr. and A. H. Zacher, 01/066499, 2001.
- T. A. Werpy, J. G. Frye Jr., A. H. Zacher and D. J. Miller, 03/035582, 2003.
- S. P. Crabtree and D. V. Tyers, 05/051874, 2005.
- B. W. Hoffer and R. Prochazka, 08/071641, 2008.
- M. A. Andrews and S. A. Klaeren, 5 026 927, 1991.
- N. Ji, T. Zhang, M. Zheng, A. Wang, H. Wang, X. Wang and J. G. Chen, Angew. Chem., Int. Ed., 2008, 47, 8510–8513 CrossRef CAS PubMed.
- N. Ji, T. Zhang, M. Zheng, A. Wang, H. Wang, X. Wang, Y. Shu, A. L. Stottlemyer and J. G. Chen, Catal. Today, 2009, 147, 77–85 CrossRef CAS PubMed.
- Y. Zhang, A. Wang and T. Zhang, Chem. Commun., 2010, 46, 862–864 RSC.
- M.-Y. Zheng, A.-Q. Wang, N. Ji, J.-F. Pang, X.-D. Wang and T. Zhang, ChemSusChem, 2010, 3, 63–66 CrossRef CAS PubMed.
- Y. Liu, C. Luo and H. Liu, Angew. Chem., Int. Ed., 2012, 51, 3249–3253 CrossRef CAS PubMed.
- Z. Tai, J. Zhang, A. Wang, M. Zheng and T. Zhang, Chem. Commun., 2012, 48, 7052–7054 RSC.
- A. Wang and T. Zhang, Acc. Chem. Res., 2013, 46, 1377–1386 CrossRef CAS PubMed.
- Z. Tai, J. Zhang, A. Wang, J. Pang, M. Zheng and T. Zhang, ChemSusChem, 2013, 6, 652–658 CrossRef CAS PubMed.
- G. Zhao, M. Zheng, J. Zhang, A. Wang and T. Zhang, Ind. Eng. Chem. Res., 2013, 52, 9566–9572 CrossRef CAS.
- Y.-B. Huang and Y. Fu, Green Chem., 2013, 15, 1095–1111 RSC.
- G. Moxley, Z. Zhu and Y. H. P. Zhang, J. Agric. Food Chem., 2008, 56, 7885–7890 CrossRef CAS PubMed.
- A. Yepez, A. Pineda, A. Garcia, A. A. Romero and R. Luque, Phys. Chem. Chem. Phys., 2013, 15, 12165–12172 RSC.
- International Centre for Diffraction Data, PDF-2 (2008) – Reference Code, 00-006-0529.
- D. Knežević, W. P. M. van Swaaij and S. R. A. Kersten, Ind. Eng. Chem. Res., 2009, 48, 4731–4743 CrossRef.
- M. Watanabe, Y. Aizawa, T. Iida, C. Levy, T. M. Aida and H. Inomata, Carbohydr. Res., 2005, 340, 1931–1939 CrossRef CAS PubMed.
- Z. Srokol, A.-G. Bouche, A. van Estrik, R. C. J. Strik, T. Maschmeyer and J. A. Peters, Carbohydr. Res., 2004, 339, 1717–1726 CrossRef CAS PubMed.
- Y. Yu and H. Wu, Ind. Eng. Chem. Res., 2011, 50, 10500–10508 CrossRef CAS.
- B. M. Kabyemela, T. Adschiri, R. M. Malaluan and K. Arai, Ind. Eng. Chem. Res., 1999, 38, 2888–2895 CrossRef CAS.
- M. Sasaki, K. Takahashi, Y. Haneda, H. Satoh, A. Sasaki, A. Narumi, T. Satoh, T. Kakuchi and H. Kaga, Carbohydr. Res., 2008, 343, 848–854 CrossRef CAS PubMed.
- G. R. Akien, L. Qi and I. T. Horvath, Chem. Commun., 2012, 48, 5850–5852 RSC.
- E. D'Hondt, S. Van de Vyver, B. F. Sels and P. A. Jacobs, Chem. Commun., 2008, 6011–6012 RSC.
- B. Sels, E. D'Hondt and P. Jacobs, in Catalysis for Renewables: From Feedstock to Energy Production, ed. G. Centi and R. A. van Santen, Wiley-VCH, 2007, ch. 11, pp. 223–255 Search PubMed.
- X. Lü and S. Saka, J. Supercrit. Fluids, 2012, 61, 146–156 CrossRef PubMed.
- T. Yoshida, S. Yanachi and Y. Matsumura, J. Jpn. Inst. Energy, 2007, 86, 700–706 CrossRef CAS.
- L. Zhou, A. Wang, C. Li, M. Zheng and T. Zhang, ChemSusChem, 2012, 5, 932–938 CrossRef CAS PubMed.
- M. Dusselier, P. Van Wouwe, S. De Smet, R. De Clercq, L. Verbelen, P. Van Puyvelde, F. E. Du Prez and B. F. Sels, ACS Catal., 2013, 3, 1786–1800 CrossRef CAS.
- M. Dusselier, P. Van Wouwe, F. de Clippel, J. Dijkmans, D. W. Gammon and B. F. Sels, ChemCatChem, 2013, 5, 569–575 CrossRef CAS.
- S. Zhao, L. Petrus and A. S. Serianni, Org. Lett., 2001, 3, 3819–3822 CrossRef CAS PubMed.
- V. Bilik, Chem Zvesti, 1972, 26, 183–186 CAS.
- M. L. Hayes, N. J. Pennings, A. S. Serianni and R. Barker, J. Am. Chem. Soc., 1982, 104, 6764–6769 CrossRef CAS.
- L. Petruš, M. Petrušova and Z. Hricoviniova, Top. Curr. Chem., 2001, 215, 15–41 CrossRef.
- R. Stockman, J. Dekoninck, B. F. Sels and P. A. Jacobs, in Studies in Surface Science and Catalysis, ed. S. Abdelhamid and J. Mietek, Elsevier, 2005, vol. 156, pp. 843–850 Search PubMed.
- E. Crezee, B. W. Hoffer, R. J. Berger, M. Makkee, F. Kapteijn and J. A. Moulijn, Appl. Catal., A, 2003, 251, 1–17 CrossRef CAS.
- N. Déchamp, A. Gamez, A. Perrard and P. Gallezot, Catal. Today, 1995, 24, 29–34 CrossRef.
- B. W. Hoffer, E. Crezee, P. R. M. Mooijman, A. D. van Langeveld, F. Kapteijn and J. A. Moulijn, Catal. Today, 2003, 79–80, 35–41 CrossRef CAS.
- M. Makkee, A. P. G. Kieboom and H. Van Bekkum, Carbohydr. Res., 1985, 138, 225–236 CrossRef CAS.
- M. Watanabe, Y. Aizawa, T. Iida, R. Nishimura and H. Inomata, Appl. Catal., A, 2005, 295, 150–156 CrossRef CAS PubMed.
- M. Sasaki, K. Goto, K. Tajima, T. Adschiri and K. Arai, Green Chem., 2002, 4, 285–287 RSC.
- B. M. Kabyemela, T. Adschiri, R. M. Malaluan and K. Arai, Ind. Eng. Chem. Res., 1997, 36, 1552–1558 CrossRef CAS.
- S. Rebsdat and D. Mayer, in Ullmann's Encyclopedia of Industrial Chemistry, Wiley-VCH Verlag GmbH & Co. KGaA, 2000 Search PubMed.
| This journal is © The Royal Society of Chemistry 2014 |

