 Open Access Article
Creative Commons Attribution 3.0 Unported Licence
Edible oleogels based on water soluble food polymers: preparation, characterization and potential application
Ashok R.
Patel
*a,
Nick
Cludts
a,
Mohd Dona Bin
Sintang
a,
Ans
Lesaffer
b and
Koen
Dewettinck
a
aVandemoortele Centre ‘Lipid Science & Technology’, Lab. of Food Tech. & Engg., Faculty of Bioscience Engg., Ghent University, Coupure Links 653, 9000 Gent, Belgium. E-mail: Patel.Ashok@Ugent.be
bVandemoortele R&D Izegem, Prins Albertlaan 79, 8870 Izegem, Belgium
First published on 26th August 2014
Abstract
Oil structuring using food-approved polymers is an emerging strategy and holds significant promise in the area of food and nutrition. In the current study, edible oleogels (containing >97 wt% of sunflower oil) were prepared using a combination of water soluble food polymers (methylcellulose and xanthan gum) and further evaluated for potential application as a shortening alternative. Microstructure studies (including cryo-SEM) and rheology measurements were conducted to gain more insights into the properties of these new types of oleogels. In addition, the functionality of oleogel as a shortening alternative was studied in terms of batter properties and the texture analysis of cakes and compared to the reference batches made using either oil, commercial shortening or cake margarine. Interestingly, while the batter properties (air incorporation, rheology and microstructure) of the oleogel batch were more close to the oil batch, the textural properties of cakes were significantly better than oil and resembled more to the cakes prepared using shortening and margarine.
Introduction
In the past decade or so, the negative effects of saturated and trans-fat consumption on human health have been prominently highlighted in several scientific as well as non-scientific (popular press) media.1,2 Owing to this negative publicity, food manufacturers are feeling pressurised to look for alternative strategies to structure lipid-based food products in the absence of significant amounts of saturated and trans-fats.1,3 Oleogelation is one such exciting strategy which has been actively researched by food scientists in the past few years.4 Oleogelation, as the name implies, simply means transformation of a liquid oil into a ‘gel-like’ structure with viscoelastic properties.4,5 Creating structured gels that contain a large amount of edible liquid oil (usually above 90 wt%) opens up new possibilities of replacing harmful saturated fats with unsaturated fats, resulting in food products that have a relatively better nutritional profile.4–9However, though very promising, oleogelation has a major limitation in terms of the available food-approved structurants that can be used for gelling liquid oils. Of all the known structurants (waxes, phytosterol–sterol esters, food emulsifiers, resins etc.),9–11 polymers appear to be the most promising candidates,12 but most food-approved polymers are inherently hydrophilic in nature and thus cannot be dispersed easily in oil to achieve the necessary structure/network formation required for gelation.7 Therefore, if we could find a way to introduce these water soluble polymers into oil and drive the subsequent network formation, the polymer oleogelation could be used to revolutionize the way lipid-based food products are formulated.
In this study, we introduce a novel way of utilizing water soluble food polymers to create oleogels containing a high concentration of edible liquid oil (>97 wt%). The method relies on an indirect approach and includes a two-step process of first fabricating a concentrated oil in water emulsion stabilized by a combination of water soluble food polymers (methylcellulose, MC and xanthan gum, XG) followed by the complete removal of the water phase to drive the structure formation where oil droplets are tightly packed in the polysaccharide network. The dried products were sheared into oleogels that showed interesting rheological properties and were further evaluated as a shortening alternative to ascertain their functionality for potential edible applications.
Some of the previous studies that report on using food polymers for oil gelation include ethylcellulose-based oleogels,13 protein-templated oil gels14,15 and Pickering emulsion-based oil gels.16 Unlike the above mentioned studies, our current approach does not require surfactants, a very high temperature processing, protein cross-linking or fabrication of colloidal particles. The drying of emulsions in the current work was carried out in a heating oven which can be considered as the main energy intensive step, but another popular industrial method – spray-drying – can also be easily applied because the emulsions show a strong shear-thinning behaviour due to the presence of XG in the continuous water phase.
Results and discussion
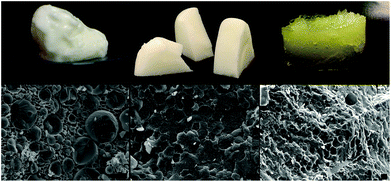
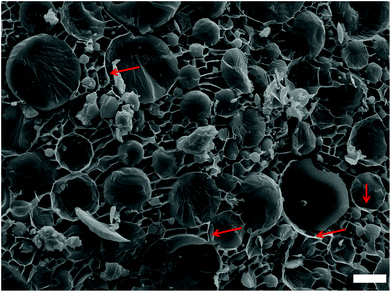
Representative pictures of the appearance and the microstructure of the emulsion, the dried product and oleogels are shown in Fig. 1. As indicated by the cryo-SEM images (taken after freeze fracture followed by sublimation), the oil droplets are distributed evenly in the network of polymers constituting the bulk phase. On removal of water, the oil droplets seem to draw close to each other, acquiring a microstructure akin to high internal phase emulsions or foams where the dispersed phase units are tightly packed together with prominent interfacial boundaries. This structure of the dried product also confirms that the presence of polymers at the interface and in the bulk phase prevented the coalescence of droplets on complete removal of water. The intact nature of oil droplets was also retained in the sheared oleogels and this unique microstructure is responsible for the viscoelastic properties of these samples.Both MC (E464) and XG (E415) are food-approved, edible materials used primarily as stabilizing and thickening agents respectively.17 While XG is obtained naturally as a fermentation product of certain bacterial strains, MC is synthesized chemically by substituting some hydroxyl groups on natural cellulose by hydrophobic methoxy groups.17 Due to the presence of hydrophobic moieties, MC displays surface activity and hence is used for the stabilization of colloidal dispersions such as emulsions and foams.18 XG, on the other hand, is non-surface active but can still aid in colloid stabilization (when used along with a surface active stabilizer) by prolonging the kinetic stability through bulk phase viscosity enhancement.19,20 For our work, 60 wt% oil in water emulsions were prepared using only MC, only XG and a combination of MC–XG as stabilizers. As expected, the emulsion stabilized by XG showed instant phase separation while the emulsion stabilized by MC had large droplet sizes (Fig. 2a and 4a) suggesting that these components did not have sufficient functionality to stabilize concentrated emulsions. However, when the combination of MC–XG was used as stabilizers, the resulting emulsions had finer droplets with better droplet size distribution profiles (Fig. 2b and 4a). The emulsion stabilized with the combination of MC–XG was also stable to drying (Fig. 2c) as indicated by the absence of coalescence of oil droplets on removal of water. The prevention of coalescence could be attributed to the well-structured interface of polysaccharides (Fig. 3) around the droplets that provide the necessary physical barrier, minimizing internal contacts among the oil droplets when the continuous water phase is evaporated.
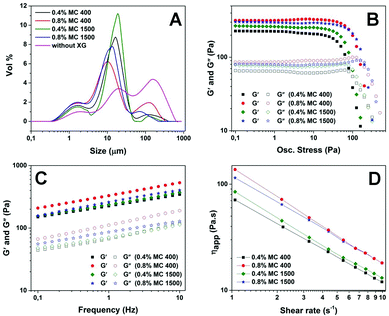
The rheological properties of emulsions prior to drying were evaluated to study the influence of polymer concentration on the overall consistency of emulsions. Batches of emulsions were prepared by varying the XG concentration at a constant MC concentration and vice versa. Variation in the XG concentration did not have any significant effect on the rheology but the MC type and concentrations used for emulsion preparation did show a prominent effect. Emulsions prepared at concentrations below 0.4 wt% of MC (irrespective of the viscosity grade) showed phase separation on drying. On the other hand, a concentration above 0.8 wt% of MC was practically not feasible to incorporate into the emulsion due to the difficulty in hydrating a high concentration of MC while preparing the stock solutions. Among the viscosity grades of MC tried in this work (MC 15, MC 400, MC 1500 and MC 4000), while MC 4000 formed a very viscous solution making it very difficult to incorporate it even at 0.4 wt% into the emulsion, MC 15 stabilized emulsions released oil on drying. Hence, the rest of the investigation was continued only with MC 400 and MC 1500. Data from the rheological characterization of emulsions prepared at a constant XG concentration (0.6 wt%) and varying MC type at two different concentrations (0.4 and 0.8 wt%) are shown in Fig. 4b–d. For both MC 400 and 1500, the higher concentration (0.8 wt%) resulted in a better structure compared to the lower concentration (0.4 wt%) as suggested by a wider region of linear response (also known as the linear viscoelastic region, LVR) to applied sinusoidal stress, a higher critical stress value, a higher elastic modulus over the entire frequency range and higher apparent viscosity values.21 It is also interesting to note that the emulsion prepared at 0.8 wt% of lower viscosity grade (MC 400) unexpectedly showed a better overall consistency compared to 0.8 wt% of MC 1500. A plausible reason for this observation could be attributed to the hydration effect: the functionality of the polymer is strongly determined by the degree and completeness of its hydration in the aqueous medium,20 and it can be assumed that when a higher concentration is used, a lower viscosity grade polymer (MC 400) is likely to be better hydrated than the higher viscosity grade (MC 1500) and hence would have a comparatively higher contribution towards the overall rheology of emulsions. Moreover, the effect of better hydration of MC 400 at high concentrations on emulsifying properties is also reflected by the droplet size distribution curves (Fig. 4a).
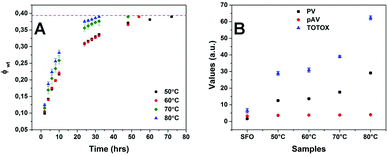
The drying of the samples in the oven was followed at 4 different temperatures 50, 60, 70 and 80 °C by recording the fraction weight loss periodically until a constant weight was obtained. As seen from Fig. 5a, the time required for complete drying of emulsion (fraction weight loss, ϕwt ∼ 0.39) ranged from 32 hours at 80 °C to 72 hours at 50 °C. The effect of drying on the oxidative deterioration of oil was studied by comparing the peroxide value (PV), p-anisidine value (pAV) and total oxidation (TOTOX) as shown in Fig. 5b. As expected, the drying temperatures had an effect on the stability of oil with exposure to high temperature (80 °C) for a lesser time showing more deterioration than exposure to relatively lower temperatures (50 and 60 °C) for a longer time. Since rancidity of oil is difficult to define through a single test, usually a combination of results from different tests is used as indicators of oxidative stability of oils.22 The PV is the most common parameter used for characterizing the oxidative state of oils; PV of fresh oils are usually much less than 10 meq kg−1 (≤1 meq kg−1) and a rancid taste is perceivable when the value is between 30 and 40 meq kg−1.23–25 Though a PV above 10 meq kg−1 indicates the oil to be in a high oxidation state, the upper limit for acceptance of vegetable oils is 15–20 meq kg−1 in general.26–29 As seen from the graph in Fig. 5b, except for the sample dried at 80 °C, all the other samples were below the upper limit of acceptance (PV < 20 meq kg−1). The p-anisidine value gives an indication of the secondary oxidation and usually PV < 10 mmol kg−1 ensures that the oil is of acceptable quality.29,30 Samples dried at all 4 temperatures showed a low pAV (<5 mmol kg−1) which was comparable to the value of the reference sunflower oil suggesting no effect of the drying process on the secondary oxidation (decomposition of peroxides to aldehydes), which also explains the absence of any rancid odour in the dried samples. However, based on PV, all the dried samples can be considered to be in the high oxidation state and most susceptible to undergo oxidation over time. Thus, in future work, we will investigate the incorporation of some antioxidants to minimize the deteriorating effect of drying temperatures on oil quality. It is interesting to note here that all the emulsion samples showed a very strong shear-thinning behaviour (Fig. 4d); hence, we believe that in addition to the incorporation of antioxidants, spray drying could also be used as an alternative drying technique (to minimize oil deterioration) even though these emulsions have a rather high viscosity at rest.
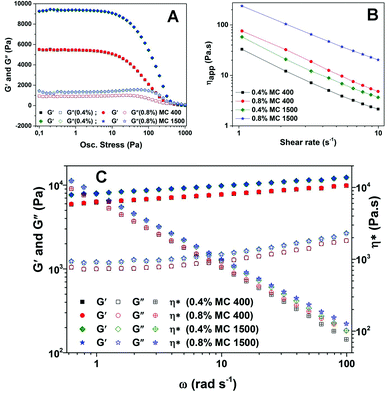
The dried products were then sheared into oleogels and characterized further to gain an insight into their rheological properties. The microstructure of the sample was retained after shearing as seen from cryo-SEM images where clusters of packed droplets were seen scattered in the oil continuous phase (reported elsewhere).31 It is important to note here that the collapse of the structure depends on the shearing time; at longer shearing times (5 minutes and above), a significant leakage of the oil was observed. The shearing time of 30 seconds at 11![[thin space (1/6-em)]](https://www.rsc.org/images/entities/char_2009.gif) 000 rpm was selected in the current work to enable conversion of dried soft solids into gel-like material without significant collapse of the packed oil droplet structure. Fig. 6 shows the rheological data obtained from oscillatory and flow measurements conducted on oleogels prepared from emulsions stabilized by MC 400 and MC 1500 at two different concentrations (0.4 and 0.8 wt%). It should be noted that these concentrations refer to the initial concentration of MC present in the emulsion; after complete removal of water, the concentration of MC should be approximately 0.65 and 1.30 wt% (please refer to Table 1). However, the concentrations of MC in oleogels are referred to as 0.4 and 0.8 wt% in Fig. 6 to enable an easy comparison with the rheological data presented before for emulsions in Fig. 4. It is quite clear from the graph of amplitude and frequency sweeps (Fig. 6a and c) that while the grade of MC had a distinct influence on the rheological properties of oleogels, the difference in the concentration for the same grade of MC had no apparent effect on the viscoelastic properties of oleogels (as suggested by overlapping curves). This is unlike what we observed in the case of emulsions (as discussed above) where the effect of the concentration of MC was prominently seen. The ‘solid-like’ behaviour of all four oleogels is confirmed by G′ values which were much higher than the corresponding G′′ values. Moreover, in both cases, the phase angle was below 10 degrees in the LVR region (data not shown) suggesting an in-phase response to the applied sinusoidal stress which is characteristic of viscoelastic solids.32 The higher viscosity grade MC 1500 gave a much stronger gel compared to MC 400 as indicated by the average values of elastic modulus in LVR (G′LVR for MC 1500 and MC 400 were ∼9275 and 5350 Pa respectively). The G′ and G′′ values also showed a low frequency dependence (as suggested by Fig. 6c) confirming the high gel strength of the samples. The inverse proportional relationship of complex viscosity (η*) with increasing angular frequency (ω) and G′ being greater than G′′ over the entire frequency range are all characteristic of strong gels.33,34 Moreover, the absence of a cross-over point (G′ = G′′) even at high frequency values confirms that the oleogel samples do not show a gel to sol transformation even at an increased rate of deformation. All the oleogel samples showed a very strong shear-thinning behaviour35 as clearly seen from the log–log plot shown in Fig. 6b. It is interesting to note that even though the viscosity decreases progressively with increasing shear rate, the viscosity of the sample with the weakest gel structure (i.e. oleogel prepared from the emulsion stabilized by 0.4 wt% of MC 400) is significantly higher than the viscosity of sunflower oil (∼0.05 Pa s)36 even at the end of the flow measurement (at 10 s−1), hence confirming that there is no gel–sol transformation under the applied force probably due to the well-structured interface covering the oil droplets.
000 rpm was selected in the current work to enable conversion of dried soft solids into gel-like material without significant collapse of the packed oil droplet structure. Fig. 6 shows the rheological data obtained from oscillatory and flow measurements conducted on oleogels prepared from emulsions stabilized by MC 400 and MC 1500 at two different concentrations (0.4 and 0.8 wt%). It should be noted that these concentrations refer to the initial concentration of MC present in the emulsion; after complete removal of water, the concentration of MC should be approximately 0.65 and 1.30 wt% (please refer to Table 1). However, the concentrations of MC in oleogels are referred to as 0.4 and 0.8 wt% in Fig. 6 to enable an easy comparison with the rheological data presented before for emulsions in Fig. 4. It is quite clear from the graph of amplitude and frequency sweeps (Fig. 6a and c) that while the grade of MC had a distinct influence on the rheological properties of oleogels, the difference in the concentration for the same grade of MC had no apparent effect on the viscoelastic properties of oleogels (as suggested by overlapping curves). This is unlike what we observed in the case of emulsions (as discussed above) where the effect of the concentration of MC was prominently seen. The ‘solid-like’ behaviour of all four oleogels is confirmed by G′ values which were much higher than the corresponding G′′ values. Moreover, in both cases, the phase angle was below 10 degrees in the LVR region (data not shown) suggesting an in-phase response to the applied sinusoidal stress which is characteristic of viscoelastic solids.32 The higher viscosity grade MC 1500 gave a much stronger gel compared to MC 400 as indicated by the average values of elastic modulus in LVR (G′LVR for MC 1500 and MC 400 were ∼9275 and 5350 Pa respectively). The G′ and G′′ values also showed a low frequency dependence (as suggested by Fig. 6c) confirming the high gel strength of the samples. The inverse proportional relationship of complex viscosity (η*) with increasing angular frequency (ω) and G′ being greater than G′′ over the entire frequency range are all characteristic of strong gels.33,34 Moreover, the absence of a cross-over point (G′ = G′′) even at high frequency values confirms that the oleogel samples do not show a gel to sol transformation even at an increased rate of deformation. All the oleogel samples showed a very strong shear-thinning behaviour35 as clearly seen from the log–log plot shown in Fig. 6b. It is interesting to note that even though the viscosity decreases progressively with increasing shear rate, the viscosity of the sample with the weakest gel structure (i.e. oleogel prepared from the emulsion stabilized by 0.4 wt% of MC 400) is significantly higher than the viscosity of sunflower oil (∼0.05 Pa s)36 even at the end of the flow measurement (at 10 s−1), hence confirming that there is no gel–sol transformation under the applied force probably due to the well-structured interface covering the oil droplets.
| Sample name | Oil (g) | Cellulose derivative (g) | XG (g) | Water (g) |
|---|---|---|---|---|
| Emulsions | ||||
| MC 400 | 60 | 0.4 of MC 400 | 0.6 | 39 |
| 0.4 wt% | ||||
| MC 400 | 60 | 0.8 of MC 400 | 0.6 | 38.6 |
| 0.8 wt% | ||||
| MC 1500 | 60 | 0.4 of MC 1500 | 0.6 | 39 |
| 0.4 wt% | ||||
| MC 1500 | 60 | 0.8 of MC 1500 | 0.6 | 38.6 |
| 0.8 wt% | ||||
| Dried products and oleogels | |||
|---|---|---|---|
| Sample name | Oil (wt%) | Cellulose derivative (wt%) | Xanthan gum (wt%) |
| MC 400 | 98.37 | 0.65 of MC 400 | 0.98 |
| 0.4 wt% | |||
| MC 400 | 97.73 | 1.30 of MC 400 | 0.97 |
| 0.8 wt% | |||
| MC 1500 | 98.37 | 0.65 of MC 1500 | 0.98 |
| 0.4 wt% | |||
| MC 1500 | 97.73 | 1.30 of MC 1500 | 0.97 |
| 0.8 wt% | |||
To test the functionality of the oleogel, cake trials were conducted where the oleogel was used as a shortening alternative and compared with other cake batches prepared using oil, commercial shortening and cake margarine. Batter properties of these batches were studied in terms of air incorporation (density and microstructure) and rheology (oscillatory, flow and creep recovery measurements). In addition, a texture analysis was also carried out on the final cake products.
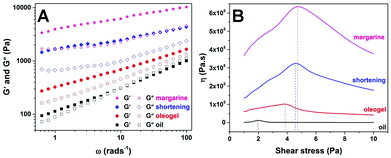
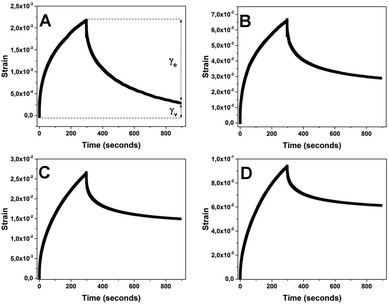
The batters with cake margarine and shortening were well-structured compared to the runny batters prepared with oil and oleogel as also confirmed by the curves of frequency sweeps shown in Fig. 7a. The margarine and shortening batters had the strongest structure (higher G′ at lower frequency, bigger difference between G′ and G′′ and a smaller slope of the curve)37 as compared to both oleogel and oil batters where the initial G′ values were much lower (∼275 and ∼95 Pa respectively). In addition, the response of oleogel and oil batters showed a strong frequency dependence as indicated by the steeper curves with positive slopes. In the case of oil batter, a prominent crossover (G′ = G′′) point is even seen at 10 rad s−1 confirming the transformation to the sol state at a higher rate of deformation. The difference in the rheology of batters can also be seen from the curves of the stress ramps (Fig. 7b). While the oil batter showed a low value of yield stress (1.99 Pa), oleogel, shortening and margarine batters had relatively higher yield stress values (3.98, 4.64 and 4.81 Pa respectively). Based on the yield stress and initial viscosity values in the stress ramps and the interpretation of frequency curves, the overall consistency of batters can be sequenced from strongest to weakest as follows: margarine > shortening > oleogel > oil. The reason for a better consistency of margarine batter compared to shortening batter can be attributed to the presence of water which probably contributes to the wetting and subsequent binding of flour solids. The batter properties were also compared by studying the viscoelasticity of batters through a creep-recovery test (Fig. 8). Viscoelastic samples are defined by their characteristic response to a constant stress which is called creep (and refers to the slow progressive deformation or increase in strain over time at constant stress) and when the load or stress is removed, the material exhibits recovery or a progressive decrease of deformation (strain).37 The extent to which the strain recovers on removal of stress gives an indication of the elastic (γe) and viscous (γv) portions of the viscoelastic behaviour corresponding to the solid and liquid-like properties of the samples.38 Margarine batter showed the highest recovery of strain (γe = 86.5%) among all the samples while the oil batter showed the least recovery with γe = 35% indicating a clear difference in the consistency of the two batters. The recoverable strain in the case of both shortening and oleogel (56.3 and 43.3% respectively) was much lower than that of margarine batter implying the importance of the presence of water (in addition to structured oil) in building up the consistency of cake batter.39
The difference in the microstructure of cake batters as seen under the polarized light microscope is shown in Fig. 9. The most prominent differences that can be noticed from these images are as follows: (a) the presence of air bubbles: the oil batter (Fig. 9d) showed the least air incorporation compared to the other 3 batters which is also reflected in the values of batter densities (0.78, 0.84, 0.92 and 1.08 g ml−1 for margarine, shortening, oleogel and oil batters respectively). The stabilization of air bubbles in margarine and shortening samples can be attributed partially to the presence of emulsifiers; (b) the images get less dense and the batter solids (starch granules and sugar crystals) get more spaced-out as we move from A to D, the dense appearance of images is an indication of the structured oil systems forming a network in the matrix that stabilizes the particulate interactions as well as the incorporated air bubbles and (c) the presence of fat crystals (seen as brownish-red due to the wavelength filter used in PLM) is found only in margarine and shortening batters as expected.
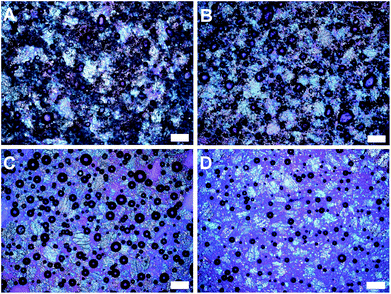 | ||
| Fig. 9 Polarized light microscopy (PLM) images of cake batters prepared using margarine (A), shortening (B), oleogel (C) and oil (D). Scale bars = 200 μm. | ||
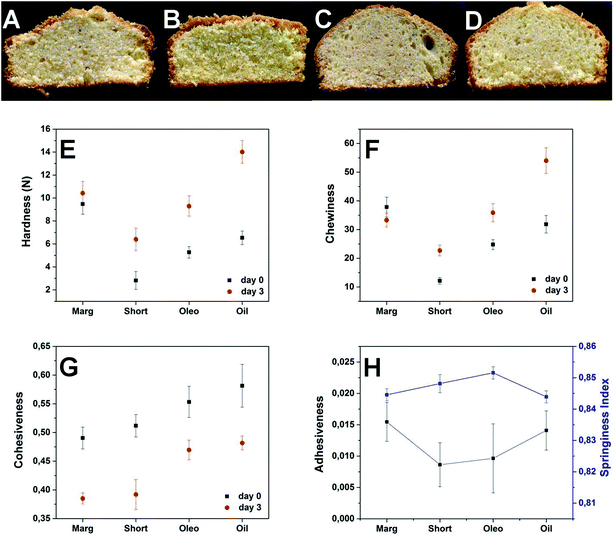
The final cake products (photographs shown in Fig. 10) were subjected to a texture profile analysis test (TPA test) to compare their properties. Generally, it is possible to obtain good cakes using just oil; however, the main problem with such cakes is the loss of ‘freshness’ or quality during storage. Hence, in the current study, cake samples were evaluated using a TPA test on the day of preparation (day 0) as well as after 2 days of storage at room temperature (day 3). The textural parameters such as hardness, chewiness, cohesiveness, adhesiveness and springiness index were compared for 4 cake batches to understand the properties of cakes and how they change during storage. In the case of hardness and chewiness, the margarine cake gave the best results showing no significant changes during storage; all other cake samples showed a significant increase in both the hardness as well as the chewiness (Fig. 10e and f). However, the oleogel sample showed comparable results to the shortening sample and a significant improvement when compared to the oil sample. The increase in the hardness and chewiness results from the crosslinking of the gluten network during storage and the structured oil systems (plastic margarine and shortening) usually prevent this by forming a physical barrier.40 The comparatively better functionality of oleogel over oil does suggest that the structuring in oleogel does help in preventing the crosslinking over just oil. Cohesiveness has been defined as the strength of the internal bonds making up the product41 (in terms of sensorial properties it is the amount of deformation the sample undergoes before rupture when biting completely through the sample),42 as seen from Fig. 10g, all the cake samples showed a decrease in the cohesiveness during storage. The decrease in the cohesiveness thus indicates an increase in the brittleness of the cake sample. The margarine and shortening cakes showed a higher drop in cohesiveness compared to oleogel and oil cakes. The reason for this observation could be attributed to the post crystallization and crystal aggregation occurring in margarine and shortening cakes due to the widely fluctuating temperatures during baking;43 this crystalline phase change may lead to a decrease in the inter-particulate interactions in the cake matrix over time. The differences in the adhesiveness (negative work done to pull the plunger out of the sample)44 and springiness index (defined as the extent to which the sample returns to its original size after first compression)45 were non-significant among the studied samples (Fig. 10h) and hence could not be compared.
The results from the tests done on batters and cakes can be summarized as follows: (a) the air incorporation in oleogel batter was higher than that in oil batter but lower than those in margarine and shortening batters possibly because of the absence of emulsifiers as well as fat crystals in oleogel; (b) batters for oleogel and oil were more runny and flowed easily under the applied force as compared to margarine and shortening batters; this considerable fluidity of batters could be considered to be an advantage in terms of ease of handling;43 (c) the flour solids (starch granules and sugar crystals) were more spaced-out in the oil batter due to the dilution by liquid oil whereas the margarine and shortening batters had a much denser appearance due to the presence of the crystalline phase; (d) the hardness and chewiness properties of oleogel cakes during storage were significantly better than oil and comparable to shortening cakes indicating that structured oil does help in minimizing crosslinking of the gluten network compared to liquid oil and (e) the oleogel cakes showed the least drop in the cohesiveness during storage retaining their soft, pliant structure and consequently a decrease in the crumb formation.
Experimental
Materials
Methyl cellulose (MC 15, 400, 1500 and 4000 cps) samples were received as generous gifts from Harke FoodTech., Germany. Xanthan gum (Satiaxine CX 931) was received as a gift sample from Cargill R&D Vilvoorde, Belgium. Sunflower oil, commercial shortening and cake margarine were received as gift samples from Vandemoortele R&D, Izegem, Belgium. Flour, sugar, baking powder and eggs were purchased from the local supermarket. Distilled water was used for all the experiments.Preparation of emulsions and oleogels
Stock solutions of MC and XG were prepared by weighing accurate amounts of polymer powders in distilled water. Water continuous emulsions (100 g) were then prepared by first dispersing oil in MC solution using a high energy dispersing unit (Ultraturrax®, IKA®-Werke GmbH & Co. KG, Germany) at 11![[thin space (1/6-em)]](https://www.rsc.org/images/entities/char_2009.gif) 000 rpm followed by the addition of XG solution at once under continuous shearing (refer Table 1 for composition of different emulsions prepared). The drying of the emulsion samples was carried out using high temperature drying in a heating oven (at temperatures 50–80 °C), the drying process was monitored by measuring the weight loss over the time and stopped when a constant weight was obtained. To prepare oleogel, the dried product was sheared very briefly (30 seconds) using Ultraturrax® at 11
000 rpm followed by the addition of XG solution at once under continuous shearing (refer Table 1 for composition of different emulsions prepared). The drying of the emulsion samples was carried out using high temperature drying in a heating oven (at temperatures 50–80 °C), the drying process was monitored by measuring the weight loss over the time and stopped when a constant weight was obtained. To prepare oleogel, the dried product was sheared very briefly (30 seconds) using Ultraturrax® at 11![[thin space (1/6-em)]](https://www.rsc.org/images/entities/char_2009.gif) 000 rpm.
000 rpm.
Microstructure studies
Optical and cryo-scanning electron microscopy was utilized to study the microstructure of the samples. Optical microscopy (under normal and polarized light) was done on a Leica DM2500 microscope (Leica Microsystems, Belgium). For cryo-SEM, samples were placed in the slots of a stub, plunge-frozen in slush nitrogen and transferred into the cryo-preparation chamber (PP3010 T Cryo-SEM Preparation System, Quorum Technologies, UK) where they were freeze-fractured and subsequently sputter-coated with Pt and examined in a JEOL JSM 7100F SEM (JEOL Ltd, Tokyo, Japan). The emulsion sample was also subjected to 20 minutes of sublimation following the freeze fracture to get rid of the water phase.Droplet size measurements
The droplet size (volume weighted mean, d4,3) of the emulsion samples was measured using a Master sizer (Malvern Instruments Ltd, UK) after appropriate dilution. All measurements were carried out at 20 °C and the results reported are averages of three readings.Rheological measurements
The rheological measurements were carried out on an advanced rheometer AR 2000ex (TA Instruments, USA) equipped with a Peltier system for temperature control. A parallel plate cross-hatched geometry of diameter 40 mm was used and the geometry gap was set at 1000 μm. A range of experiments including the amplitude sweep (stress = 0.1–1000 Pa, frequency = 1 Hz), frequency sweeps (0.1–10 Hz for emulsions and 0.5–100 rad s−1 for oleogels, oscillatory stress = 2 Pa) were carried out at 5 °C. For flow measurements, samples were subjected to increasing shear rates (1 and 10 s−1) at 5 °C. Frequency sweeps (05–100 rad s−1, oscillatory stress = 1 Pa), stress ramp and creep recovery tests for cake batters were carried out at 20 °C. Creep recovery tests were carried out by subjecting the samples to a constant stress (below the yield stress) for 5 minutes followed by 10 minutes of recovery by decreasing the stress to zero.Stability of oil
To evaluate the effect of drying on the oil stability, peroxide, p-anisidine and total oxidation values of oil in the oleogel samples were compared, with sunflower oil (SFO) as the reference, using AOCS official methods.46 The peroxide value was determined using the acetic acid–isooctane method; the method determines the milliequivalent of peroxide per kg of sample that oxidizes potassium iodide under the test conditions. The p-anisidine value determines the amount of aldehydes (products of secondary oxidation) that reacts with p-anisidine under the test conditions. Total oxidation was calculated using the above values through the following equation: TOTOX = 2 × PV + pAV.Preparation of cakes
In order to evaluate the potential application of oleogel as a shortening alternative, classic 4/4 sponge cakes were prepared using 300 g wheat flour, 13 g baking powder, 300 g liquid whole egg, 300 g sugar and 300 g of fat as the cake margarine, shortening, oleogel (prepared from emulsion stabilized using 0.8 wt% MC 1500) or oil. The oil, oleogel and shortening were used at levels to match the fat content in margarine. The cake batter was prepared by mixing these ingredients in a Kitchen Aid® mixer followed by baking at 175 °C for 35 minutes. For density measurements, batter samples filled in glass cylinders with known volumes were accurately weighed in triplicate.Characterization of cakes – texture analysis
The baked cakes were subjected to a texture profile analysis (TPA) test on a texture analyser (Instron Model 5942, USA). TPA was carried out by first preparing cubes with a size of 2 cm from the centre of cakes. These cubes were then subjected to a 2 step compression using a cylindrical probe of 6 cm diameter at a speed of 10 mm min−1. In the first cycle, the sample was compressed to 50% of its height (50% strain) followed by removal of load through upward movement of the probe. The whole cycle was repeated in step 2. The measured force during these 2 cycles as a function of time was plotted to get a TPA curve. Measurements were done on 10 replicates of each sample. The mean and SD values of each parameter were statistically analysed.Statistical analysis
Data from texture analysis were compared using statistical analysis. One-way ANOVA was used on the data to establish statistical significance in the differences observed.Conclusions
In conclusion, a new method for structuring liquid oil using food polysaccharides was successfully demonstrated. The structuring of oil results from the interesting microstructure wherein the oil droplets are tightly packed together in the matrix of polymers. The structured interface prevents the coalescence of oil droplets when the water phase is removed through drying. The oleogels showed a high gel strength and a strong shear-thinning flow behaviour. The functionality of oleogel as a shortening alternative was studied by comparing the batter as well as cake properties, and based on the rheological and texture measurement results, the functionality of oleogel was significantly better than oil and were comparable to commercial shortening and in some cases to the margarine sample. The promising results of these new types of oleogels warrant further studies including: the oil deterioration control on drying through addition of anti-oxidants, suitability of spray drying as an alternative drying process and incorporation of suitable emulsifiers to enhance the functionality of oleogel as a shortening alternative.Acknowledgements
This research was supported by the Marie Curie Career Integration Grant (project: SAT-FAT-FREE) within the 7th European Community Framework Programme. Hercules foundation is acknowledged for its financial support in the acquisition of the scanning electron microscope JEOL JSM-7100F equipped with cryo-transfer system Quorum PP3000T and Oxford Instruments Aztec EDS (grant number AUGE-09-029).Notes and references
- A. G. Marangoni and N. Garti, Edible oleogels: Structure and health implications, AOCS Press, Urbana, Illinois, 2011 Search PubMed.
- G. R. List, D. Kritchevsky and W. M. N. Ratnayake, Trans Fats in Foods, AOCS Press, 2007 Search PubMed.
- G. R. L. Dharma and R. Kodali, Trans Fats Alternatives, AOCS Press, USA, 2005 Search PubMed.
- E. D. Co and A. G. Marangoni, J. Am. Oil Chem. Soc., 2012, 89, 749–780 CrossRef PubMed.
- M. A. Rogers, A. J. Wright and A. G. Marangoni, Soft Matter, 2009, 5, 1594–1596 RSC.
- A. R. Patel, P. S. Rajarethinem, A. Gredowska, O. Turhan, A. Lesaffer, W. H. De Vos, D. Van de Walle and K. Dewettinck, Food Funct., 2014, 5, 645–652 CAS.
- A. R. Patel, D. Schatteman, A. Lesaffer and K. Dewettinck, RSC Adv., 2013, 3, 22900–22903 RSC.
- A. R. Patel, D. Schatteman, W. H. D. Vos and K. Dewettinck, RSC Adv., 2013, 3, 5324–5327 RSC.
- M. Pernetti, K. F. van Malssen, E. Flöter and A. Bot, Curr. Opin. Colloid Interface Sci., 2007, 12, 221–231 CrossRef CAS PubMed.
- L. S. K. Dassanayake, D. R. Kodali and S. Ueno, Curr. Opin. Colloid Interface Sci., 2011, 16, 432–439 CrossRef CAS PubMed.
- A. R. Patel, D. Schatteman, W. H. De Vos, A. Lesaffer and K. Dewettinck, J. Colloid Interface Sci., 2013, 411, 114–121 CrossRef CAS PubMed.
- A. G. Marangoni, US Pat., WO2010143066, 2010 Search PubMed.
- A. J. Gravelle, S. Barbut and A. G. Marangoni, Food Res. Int., 2012, 48, 578–583 CrossRef CAS PubMed.
- R. Mazzenga, in Edible Oleogels: Structure and Health Implications, ed. A. G. Marangoni and N. Garti, AOCS Press, Urbana Illinois, 2011, pp. 271–294 Search PubMed.
- R. Mezzenga and S. Ulrich, Langmuir, 2010, 26, 16658–16661 CrossRef CAS PubMed.
- Z.-M. Gao, X.-Q. Yang, N.-N. Wu, L.-J. Wang, J.-M. Wang, J. Guo and S.-W. Yin, J. Agric. Food Chem., 2014, 62, 2672–2678 CrossRef CAS PubMed.
- Food Polysaccharides and Their Applications, ed. A. M. Stephan, G. O. Phillips and P. A. Williams, CRC Press, FL, USA, 2006 Search PubMed.
- T. Shibata, in Renewable Resources for Functional Polymers and Biomaterials: Polysaccharides, Proteins and Polyesters, The Royal Society of Chemistry, 2011, pp. 48–87 Search PubMed.
- Food Emulsifiers and Their Applications, ed. G. L. Hasenhuettl and R. W. Hartel, Chapman & Hall, New York, USA, 1997 Search PubMed.
- Functional Properties of Food Macromolecules, ed. S. E. Hill, D. A. Ledward and J. R. Mitchell, Aspen Publishers Inc., Maryland, USA, 1998 Search PubMed.
- Rheology: Concepts, Methods and Applications, ed. A. Y. Malkin and A. I. Isayev, Chemtech Publishing, Toronto, Canada, 2006 Search PubMed.
- J. C. Allen and R. J. Hamilton, Rancidity Foods, Springer, 1994 Search PubMed.
- C. H. Lea, Rancidity in Edible Fats, Chemical publishing Company, Incorporated, 1939 Search PubMed.
- Chemistry and Technology of Oils & Fats, ed. M. M. Chakrabarty, Allied Publishers Pvt Ltd, 2003 Search PubMed.
- R. Steele, Understanding and Measuring the Shelf-life of Food, CRC Press, 2004 Search PubMed.
- S. Gómez-Alonso, V. Mancebo-Campos, M. Desamparados Salvador and G. Fregapane, Eur. J. Lipid Sci. Technol., 2004, 106, 369–375 CrossRef PubMed.
- D. Moigradean, M.-A. Poiana and I. Gogoasa, J. Agroalimen. Proc. Technol., 2012, 18, 272–276 CAS.
- G. Nagaraj, Oilseeds: Properties, Products, Processing and Procedures, New India Publishing Agency, 2009 Search PubMed.
- S. O'Keefe and O. Pike, in Food Analysis, ed. S. S. Nielsen, Springer, US, 2010, ch. 14, pp. 239–260 Search PubMed.
- J. W. Pamela, in Methods to Access Quality and Stability of Oils and Fat-Containing Foods, AOCS Publishing, 1995 Search PubMed.
- A. R. Patel, N. Cludts, M. D. Bin Sintang, B. Lewille, A. Lesaffer and K. Dewettinck, ChemPhysChem, 2014 DOI:10.1002/cphc.201402473.
- Rheology for Chemists: An Introduction, ed. J. W. Goodwin and R. W. Hughes, The Royal Society of Chemistry, 2000, pp. 213–285 Search PubMed.
- Springer Handbook of Experimental Fluid Mechanics, Springer-Verlag, Berlin, Germany, 2007 Search PubMed.
- J. W. Goodwin and R. W. Hughes, in Rheology for Chemists: An Introduction, The Royal Society of Chemistry, 2008, pp. 135–193 Search PubMed.
- Rheology Series, ed. J. F. H. H. A. Barnes and K. Walters, Elsevier, 1989, vol. 3, pp. 11–35 Search PubMed.
- H. Yalcin, O. S. Toker and M. Dogan, J. Oleo Sci., 2012, 61, 181–187 CrossRef CAS.
- The Rheology Handbook: For Users of Rotational and Oscillatory Rheometers, Vincentz Network GmbH & Co. KG, Hannover, Germany, 2006 Search PubMed.
- R. S. Lakes, Viscoelastic Solids, Taylor & Francis, 1998 Search PubMed.
- F. C. Wang and X. S. Sun, Cereal Chem., 2002, 79, 567–571 CrossRef CAS.
- E. B. Bennion, G. S. T. Bamford and A. J. Bent, The Technology of Cake Making, Springer, 1979 Search PubMed.
- A. S. Szczesniak, J. Food Sci., 1963, 28, 385–389 CrossRef PubMed.
- A. M. Munoz, J. Sensory Studies, 1986, 1, 55–83 CrossRef PubMed.
- B. S. Ghotra, S. D. Dyal and S. S. Narine, Food Res. Int., 2002, 35, 1015–1048 CrossRef CAS.
- Texture in Food, ed. D. Kilcast, Woodhead Publishing Ltd & CRC Press, Cambridge, UK, 2004 Search PubMed.
- Food Texture: Instrumental and Sensory Measurement, ed. H. R. Moskowitz, Marcel Dekker Inc., New York, USA, 1987 Search PubMed.
- AOCS OFFICIAL METHOD, AOCS Press, Champaign, USA, 1996 Search PubMed.
| This journal is © The Royal Society of Chemistry 2014 |

