 Open Access Article
Creative Commons Attribution 3.0 Unported Licence
In vitro transport and satiety of a beta-lactoglobulin dipeptide and beta-casomorphin-7 and its metabolites†
Simone
Osborne
*a,
Wei
Chen
a,
Rama
Addepalli
a,
Michelle
Colgrave
a,
Tanoj
Singh
b,
Cuong
Tran
c and
Li
Day
b
aCSIRO Animal, Food and Health Sciences, 306 Carmody Road, St Lucia, QLD 4067, Australia. E-mail: Simone.Osborne@csiro.au; Fax: +61-732142900; Tel: +61-732142274
bCSIRO Animal, Food and Health Sciences, 671 Sneydes Road, Werribee, VIC 3030, Australia
cCSIRO Animal, Food and Health Sciences, Gate 13 Kintore Avenue, Adelaide, SA 5000, Australia
First published on 19th May 2014
Abstract
Understanding the digestive behaviour and biological activities of dairy proteins may help to develop model dairy products with targeted health outcomes including increased satiety and healthy weight maintenance. Caseins and whey proteins constitute over 95% of milk proteins with consumption of these proteins associated with increased satiety and a decreased prevalence of metabolic disorders. To investigate the in vitro digestive behaviour and satiety of dairy proteins at the intestinal epithelium, the in vitro transport and hydrolysis of 500–2000 μM β-casomorphin-7 (YPFPGPI or β-CM7) and a β-lactoglobulin (β-Lg) dipeptide (YL) was measured using Caco-2 cell monolayers grown on transwells as a model of the intestinal epithelium. Transport of YL was concentration dependent and ranged from 0.37–5.26 × 10⁻⁶ cm s−1, whereas transport of β-CM7 was only detected at 2000 μM and was significantly lower at 0.13 × 10⁻⁶ cm s−1. Rapid hydrolysis of β-CM7 in the apical chamber by the Caco-2 cells produced three peptide metabolites: YP, GPI and FPGPI. All of these metabolites were detected in the basolateral chamber after 30 min with both the YP and GPI peptides transporting at a higher rate than intact β-CM7. In vitro satiety was indicated by the secretion of cholecystokinin [26–33] (CCK-8) and glucagon-like peptide 1 (GLP-17–36NH2) in the STC-1 enteroendocrine cell model. CCK-8 secretion was highest in response to β-CM7 followed by the β-CM7 metabolite FPGPI. CCK-8 secretion however was not significantly stimulated by the tri- or dipeptides. Secretion of GLP-1 was not significantly stimulated by β-CM7 or YL. These in vitro results suggest that dairy peptide size enhances CCK-8 secretion, whilst limiting transport across Caco-2 monolayers.
Introduction
Bovine milk is a source of biologically active peptides produced by the gastrointestinal digestion of milk proteins.1,2 Milk peptides have been found to exhibit various bioactivities including antithrombotic, antioxidant, antihypertensive, antimicrobial, immunomodulatory, anticarcinogenic, opioid and mineral-carrying activities,3–7 as such these peptides have been linked to a myriad of beneficial health outcomes including improved clinical outcomes in cancer patients,8 reducing cardiovascular risk and disease,5 improved digestive function, nutrient absorption and growth and development of organs.9Within bovine milk, caseins are by far the most abundant group of proteins and are comprised of αS1-, αS2-, β- and κ-caseins. Digestion of β-casein produces one of the best known groups of food derived opioid peptides referred to as β-casomorphins. The whey protein group is more diverse comprised of β-lactoglobulin (β-Lg), α-lactoalbumin, immunoglobin and several other proteins. β-Lg is the most abundant whey protein and is also an important source of bioactive peptides with gastrointestinal digestion producing a variety of opioid peptides.10
β-Casomorphin-7 (YPFPGPI, β-CM7) represents β-casein [60–66] and is one of the most well known β-casomorphins due to its diverse biological activities and high resistance to enzymatic degradation.11 The numerous biological activities reported to be associated with β-CM7 reveal a dichotomous nature. Apart from its strong opioid activity,12,13 β-CM7 has been reported to provide a protective effect in diabetes through the reduced absorption of glucose and a reduction in oxidative stress.14 However, other studies implicate β-CM7 in the aetiology of human diseases like cardiovascular disease, type 1 diabetes and sudden infant death syndrome.15 β-CM7 is also the key difference in the peptide profile following the gastrointestinal digestion of A1 milk compared to A2 milk.16,17 Thirteen genetic variants of the β-casein gene exist in dairy cattle breeds world-wide, however A1 and A2 are the most common variants giving rise to A1 and A2 milk.15 A single amino acid substitution at position 67 from a proline in A1 β-casein, to a histidine in A2 β-casein, influences the enzymatic digestion of A1 and A2 milk and subsequent release of the β-CM7 peptide. Enzymatic digestion of A1 milk using pepsin, trypsin and elastase releases four to ten-fold higher levels of β-CM7 compared to the same enzymatic digestion of A2 milk.16,17
The precise biological activity of β-CM7 is complicated by the lack of detection of intact bovine β-CM7 in adult human plasma. To date, intact β-CM7 has not been detected in adult human plasma following the ingestion of bovine milk or other casein containing dairy products, however it has been found in the jejunum of healthy adult subjects (aged 18–30) following the ingestion of bovine casein,11 and in the plasma of infants (under 1 year) following ingestion of formula containing bovine milk.18 Animal studies involving adult and infant beagles investigated the plasma levels of intact β-CM7 following ingestion of bovine (casein based) milk.19 Quantifiable levels of intact β-CM7 were only present in blood plasma from infant beagles, with intact β-CM7 not detected in adult beagles. Therefore it is unknown whether intact β-CM7 persists beyond the adult intestinal epithelial in vivo. A recent review on the potential health impact of β-casomorphins and related peptides,20 concluded that the presence of intact β-casomorphin molecules in blood after intake of milk or casein has not been established in vivo as such there is no quantitative data on the absorption of intact bioactive peptides for adults, except in the case for di- and tripeptides with reported antihypertensive properties.
In vitro studies involving the Caco-2 transwell model of the intestinal epithelium have revealed transport of intact β-CM7 with low permeability rates.21,22 In these studies rapid hydrolysis of β-CM7 over 60 min was observed and linked with the action of dipeptidyl peptidase IV.21,22 It is possible that brush border enzymes, including dipeptidyl peptidase IV, are responsible for rapid degradation of β-CM7 that survives gastrointestinal digestion preventing intact β-CM7 from being detected in adult human plasma. It is likely that smaller peptides produced from the hydrolysis of β-CM7, rather than intact β-CM7, are preferentially absorbed across the intestinal epithelium.
Bioactive dairy peptides are not only released by gastrointestinal digestion following consumption of dairy foods, but are also generated during dairy processing and are therefore present in products including milk protein hydrolysates, fermented milk, yoghurt and cheese.23,24 Food products supplemented with milk protein-derived bioactive peptides have also been manufactured and have gained market interest. Consumption of dairy products is associated with increased satiety25–27 as well as a decreased prevalence of metabolic disorders like obesity and type 2 diabetes.2,28 Amongst dairy proteins there is evidence demonstrating the satiating effects of whey and casein proteins.26 Understanding the digestive behaviour of dairy proteins and transport mechanisms of resulting peptides may help to develop dairy based foods with targeted health outcomes.
Satiety is influenced by a complex network of postprandial gastrointestinal hormones secreted by enteroendocrine cells in response to changes in the gut lumen.29 Cholecystokinin (CCK) is a gut–brain peptide predominantly secreted by enteroendocrine I cells in the small intestine in response to dietary peptides and fatty acids, regulating gall bladder contraction, pancreatic enzyme secretion, gastric emptying and appetite.30 The term CCK refers to a family of peptide hormones that are the result of post-translational modifications to pro-CCK into several differently sized peptides including CCK-8, CCK-33 and CCK-58.31In vivo CCK-8 [26–33] is one bioactive form of CCK linked to satiety. In vitro STC-1 cells mainly process pro-CCK into CCK-8,32 as such CCK-8 is secreted by STC-1 cells and routinely used to indicate satiety. Extensive research on CCK has firmly established this hormone as a feed suppressive peptide.33 Thus, CCK is an important regulator of ingestion, digestion and nutrient absorption and a useful indicator of satiety in vivo and in vitro.
In vitro studies have shown that protein hydrolysates,34 peptides35,36 and amino acids37 induce CCK-8 secretion in the STC-1 mouse enteroendocrine cell line as well as in CHO (Chinese hamster ovary) cells38 stably transfected to express the CCK-A receptor.39 The effect of bovine β-CM7 or the β-Lg dipeptide on CCK secretion in vitro or in vivo is unknown; however several in vivo studies report conflicting findings in terms of the effect of β-casomorphins on feed intake and satiety. Some animal studies report that administration of β-casomorphins increases feed intake,40–42 whilst other studies suggest that β-casomorphins present in casein hydrolysates prolong gastrointestinal transit and delay gastric emptying43 through CCK-A receptors and opioid receptors.44–46 Furthermore, an in vitro study involving HEK293A human embryonic kidney cells transfected with two isoforms of the 5-HT2C (serotonin) receptors, demonstrated receptor agonist activity in response to casein hydrolysate fractions suggesting casein peptides, including β-casomorphins, may be involved in the regulation of food intake and the suppression of appetite through serotonin receptors.47 Conversely, radioreceptor analysis indicated that both human and bovine β-CM7 act as 5-HT2C antagonists,48 suggesting a stimulatory role for these peptides. The effect of β-Lg on satiety is also unclear, however many studies report the satiating effect of whey protein49,50 with one recent study implicating a role for β-Lg51 in satiety. Therefore, investigating the effect of β-CM7 and the β-Lg dipeptide on the secretion of CCK-8 in vitro might help to gain insights into the physiological effect of these peptides.
Glucagon-like peptide 1 (GLP-1) is another gastrointestinal hormone secreted by enteroendocrine cells in response to changes in the gut lumen. GLP-1, produced by intestinal L-cells in response to dietary carbohydrates, fatty acids and peptides, is an incretin hormone involved in glucose-dependent insulin release, attenuation of blood sugar, deceleration of gastric emptying, acid secretion and food intake.52 GLP-1 exists in two biologically active forms produced by the post-translational modification of the proglucagon precursor into the non-amidated GLP-17–37 and amidated GLP-17–36NH2. In humans GLP-1 is efficiently amidated (>80%), however following intestinal secretion GLP-17–36NH2 is rapidly degraded by dipeptidyl peptidase IV (DPPIV) producing GLP-19–36NH2.53In vitro, both of these forms are secreted by the STC-1 mouse enteroendocrine cell line, with the amidated form also being the most abundant.54In vitro studies have shown that β-casein stimulates GLP-1 secretion by STC-155 and other cells,56 however it is unknown whether β-CM7 or the β-Lg dipeptide stimulate GLP-1 in vitro.
In this present work the in vitro transport and satiety of bovine β-CM7 and a dipeptide derived from β-Lg were investigated in an effort to understand the fate and biological activity of these peptides during intestinal absorption. Caco-2 cell monolayers grown on transwell membranes were used to model the intestinal epithelium for transport studies, whilst CCK-8 and GLP-1 secretion by the mouse enteroendocrine STC-1 cell line was used as an indicator of satiety.
Materials and methods
Cell culture media and reagents
The Caco-2 (human colorectal adenocarcinoma) cell line was purchased from the American Type Culture Collection (ATCC). The STC-1 (mouse enteroendocrine) cell line was secured from the safe deposit section of ATCC (via Dr Douglas Hanahan). Dulbecco's modified eagle's medium (DMEM) with high glucose (4500 mg mL−1), heat inactivated fetal bovine serum (FBS), nonessential amino acids (NEAA), Hank's balanced salt solutions (HBSS), phosphate buffered saline (PBS), rhodamine phalloidin, TO-PRO®3 and penicillin/streptomycin were purchased from Gibco/Life Technologies. Transwells with polycarbonate membranes (0.4 μm pore size; surface area 0.33 cm2) were from Corning. Cell culture flasks and 96 well plates were from Nunc. The CellTiter 96® AQueous non-radioactive cell proliferation assay (MTS) cell viability assay was from Promega. Bovine β-CM7 (YPFPGPI), β-Lg (YL) dipeptide and β-CM7 (YP) dipeptide were from Bachem. The β-CM7 metabolites GPI and FPGPI were synthesised by AusPep. The cholecystokinin [26–33] (CCK-8), non-sulphated (human, rat, mouse) fluorescent EIA kits and bombesin were from Phoenix Pharmaceuticals Inc (Burlingamed, USA). The HPLC reagents included triflouroacetic (TFA) acid from Sigma and acetonitrile (ACN) from Merck. LC-MS reagents included formic acid (FA) from Ajax Finechem Pty Ltd and acetonitrile from RCI Labscan Ltd. The MALDI-TOF reagents, including 2-cyano-4-hydroxy-cinnamic-acid (CHCA) and Peptide Calibration Standard II (PepCal II), were purchased from Bruker (Billerica, USA).Determination of dairy peptide toxicity
Cell viability in response to the dairy peptides was evaluated prior to and following the Caco-2 transwell experiments, and following the STC-1 secretion assays using MTS assays.For the Caco-2 cells, cell viability in response 31.25–2000 μM peptide concentration was established using 1 × 10⁴ Caco-2 cells per well grown in a 96 well plate for 7 days. On day 7, growth media was removed and replaced with HBSS containing peptides for 60 min. The Caco-2 cells were then washed once in HBSS and assayed using 100 μL HBSS with 20 μL MTS reagents. Following a 2 h 37 °C/5% CO2 incubation, absorbance at 485 nm indicated cell viability. Cell viability was also monitored following the transport experiments by measuring pre- and post-transepithelial electrical resistance readings (TEER).
For the STC-1 cells, cell viability was assessed following collection of the CCK-8 and GLP-1 containing cell supernatants. The cells were assayed using 100 μL HBSS with 20 μL MTS reagents. Following a 2 h 37 °C/5% CO2 incubation, absorbance at 485 nm indicated cell viability.
Caco-2 cell and STC-1 culture
The Caco-2 cells were routinely cultured in DMEM supplemented with 10% FBS, 1% w/v penicillin/streptomycin and 1% w/v NEAA. The STC-1 cells were cultured in DMEM supplemented with 10% FBS, 1% w/v penicillin/streptomycin and 1% w/v Glutamax. All cells were grown at 37 °C in a humidified atmosphere with 5% CO2. For experimentation all cells were maintained between passages 5–20.Caco-2 cell monolayer culture on transwells and peptide transport
The Caco-2 cells were seeded into transwell apparatus at a cell density of 1.2 × 10⁵ cells cm−2 and cultured in growth media for 21 days to facilitate cell differentiation and formation of an intact monolayer. During the 21 day differentiation period, growth media was removed and replaced with fresh media every 2–3 days. Cell differentiation and formation of an intact monolayer was monitored by measuring the transepithelial electrical resistance (TEER) of the cell monolayer in an apical – basolateral direction. TEER was measured using a Millicell-ERS Voltohmmeter (Millipore) with values above 0.35 kΩ cm−2 indicative of differentiated Caco-2 cells and an intact monolayer.22,57,58Formation of an intact monolayer was also visualised using confocal microscopy by fixing the Caco-2 cells to the transwell membrane and staining with fluorescent dyes. At day 21, the cells were washed, fixed57 and stained with rhodamine phalloidin and TO-PRO®3 to visualise the tight junctions and nuclei (respectively). Confocal microscopy was performed on a Leica TCS SP5 confocal laser scanning microscope (Leica 143 Microsystems, Wetzlar, Germany) using a 100× oil immersion objective. To image the tight junctions (stained with rhodamine phalloidin) a 543 nm laser was used and bandwidth of 564–699 nm collected. To image the cell nuclei (TO-PRO®3) a 488 nm laser was used and bandwidth of 494–527 nm collected.
On the day of transport TEER was measured and growth media replaced with HBSS in the apical and basolateral chambers for 4 h to enhance uptake of exogenous peptides. For dairy peptide transport, 200 μL of 500, 1000 and 2000 μM β-CM7 and YL in HBSS were applied to the apical chamber for 30 min. HBSS (600 μL) was also replaced in the basolateral prior to transport. After 30 min all apical and basolateral transport samples were collected and stored at −80 °C. HBSS was replaced in all chambers with TEER values measured again. Transport studies were performed in duplicate with six replicates (n = 12). The rate of peptide transport across the transwell membrane was determined by calculating the apparent permeability coefficient (Papp) as previously described59 and as follows: (ΔQ/Δt) × (1/A × 1/C0). Where ΔQ is the change in peptide concentration in the basolateral chamber (μmoles); Δt is the transport time (seconds); A is the surface area of the transwell membrane (cm2) and C0 is the initial concentration of peptides applied to the apical chamber (μmoles mL−1). Papp is measured in cm s−1.
Multiple reaction monitoring (MRM) of intact peptides in apical and basolateral samples
Ultra high performance liquid chromatography (UHPLC, Shimadzu) coupled to a 4000 QTRAP LC-MS/MS system (AB/Sciex, Foster City, USA) was used for quantification of the β-Lg YL dipeptide and the various forms of β-CM7, including the intact peptide (YPFPGPI) and its metabolites (YP, GPI and FPGPI), in the Caco-2 transwell transport samples. Peptide separation was achieved using a Kinetex 1.7 μm C18 100 Å (100 × 2.1 mm) column from Phenomenex with a flow rate of 0.4 mL min−1 using a linear gradient of 5–45% buffer B over 10 minutes. Buffer A consisted of 0.1% v/v FA in MilliQ water and buffer B consisted of 0.1% v/v FA and 90% v/v ACN in MilliQ water. The column oven temperature was 60 °C. The total run time was 15 min and an injection volume of 2 μL was used. The MS parameters were as follows: curtain gas 35; ion spray voltage 5300 V, temperature 500 °C, ion source gas 1 and 2 both set to 50. All transport samples were diluted in 0.1% v/v FA. Four sets of peptide standards containing: 0.0025–10 μM β-Lg YL dipeptide (12 concentrations); 0.05–50 μM β-CM7 (10 concentrations); 0.05–25 μM YP (9 concentrations); 0.05–10 μM GPI (8 concentrations) and 0.005–2.5 FPGPI μM (9 concentrations) were used to calculate unknown peptide concentrations in the apical and basolateral transport samples. Linear regression analysis of log10 transformed data was performed in GraphPad Prism v6. The following liner regression equations were used to calculate the unknowns for each peptide analysed:(1) β-Lg YL = 0.9735x + 6.480 (r2 = 0.9984).
(2) β-CM7 = 1.833x + 4.897 (r2 = 0.9653; low range standards for basolateral samples 0.05–2.5 μM) and 1.019x + 5.243 (r2 = 0.9753; high range standards for apical samples 1.0–50 μM).
(3) β-CM7 metabolite YP = 0.9344x + 5.416 (r2 = 0.9984).
(4) β-CM7 metabolite GPI = 0.9203x + 5.237 (r2 = 0.9972).
(5) β-CM7 metabolite FPGPI = 0.9441x + 6.263 (r2 = 0.9974).
Reverse phase high performance chromatography (RP-HPLC) and matrix-assisted laser desorption ionisation time-of-flight/time-of-flight (MALDI-TOF/TOF) analysis
To identify apical and basolateral peptides, the transport samples were separated using RP-HPLC with a 250 × 2.1 mm, 300 Å, 5 μm C18 reverse phase column (Everest, Grace Davison Discovery Sciences). The flow rate was 0.15 mL min−1 with buffer A 0.1% v/v TFA in MilliQ water, and buffer B 0.1% v/v TFA in ACN. A linear gradient of 5–60% buffer B over 65 minutes was employed. The column compartment temperature was 25 °C. Fractions were collected and dried by vacuum concentration. For MALDI-TOF/TOF mass spectrometry, solutions were lyophilised and reconstituted in 20 μL of 0.1% trifluoroacetic acid and analysed by matrix-assisted laser desorption/ionization (MALDI) on an UltrafleXtreme tandem time of flight (TOF/TOF) MS (Bruker Daltonics, Bremen, Germany). The sample (1 μL) was mixed 1![[thin space (1/6-em)]](https://www.rsc.org/images/entities/char_2009.gif) :
:![[thin space (1/6-em)]](https://www.rsc.org/images/entities/char_2009.gif) 1 with CHCA (7.5 mg mL−1 in 70% acetonitrile, 0.1% TFA, 1 mM ammonium phosphate) and 1 μL spotted directly onto a polished steel MALDI target. Data were acquired in positive ion reflector mode over the mass range 100–1000 Da using the FlexControl software. The laser power was set to 30% and 2000 shots were averaged for MS acquisition. Tandem MS spectra were acquired automatically with 2000 shots averaged per spectra.
1 with CHCA (7.5 mg mL−1 in 70% acetonitrile, 0.1% TFA, 1 mM ammonium phosphate) and 1 μL spotted directly onto a polished steel MALDI target. Data were acquired in positive ion reflector mode over the mass range 100–1000 Da using the FlexControl software. The laser power was set to 30% and 2000 shots were averaged for MS acquisition. Tandem MS spectra were acquired automatically with 2000 shots averaged per spectra.
CCK-8 and GLP-1 secretion by STC-1 cells
STC-1 cells per well were seeded into 96 well plates (1 × 10⁵ cells per well) in phenol red-free, DMEM growth media and incubated for 24 h at 37 °C/5% CO2. Following the 24 hour incubation, growth media was replaced with phenol red-free and serum-free DMEM and incubated for 3 h at 37 °C/5% CO2. Following the 3 hour incubation, 100 μL of HBSS containing different peptides were added to the cells for 2 h at 37 °C/5% CO2. Bombesin (100 μM) and a commercial whey hydrolysate (1 mg mL−1) were used as positive controls for CCK-8 secretion and GLP-1 secretion. HBSS was used as the negative control for both CCK-8 and GLP-1 secretion. Cell supernatants were collected after the 3 hour incubation and stored at −80 °C until required. Cell viability was measured immediately after the assay as detailed above. Cholecystokinin 26–33 (CCK-8) and glucagon-like peptide 1 7–36 amide (GLP-17–36NH2) was measured in the supernatants using the CCK-8, non-sulphated (human, rat, mouse) and GLP-17–36NH2 fluorescent EIA kits (Phoenix Pharmaceuticals Inc). Assays were performed in triplicate and expressed as ratio to basal (HBSS) secretion.Statistical analysis
All statistical analyses were conducted using a one-way ANOVA followed by post hoc comparisons using Tukey's or Dunnett's multiple comparisons test. p-values less than 0.05 were considered significant. These calculations were performed using GraphPad Prism 6 Software for Windows (GraphPad Software, San Diego California USA, http://www.graphpad.com).Results
In vitro transport of intact β-CM7 and β-Lg dipeptide (YL)
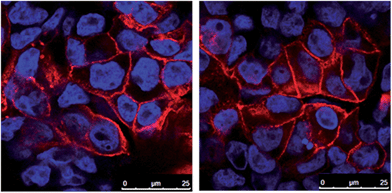
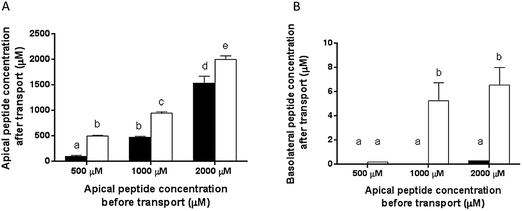
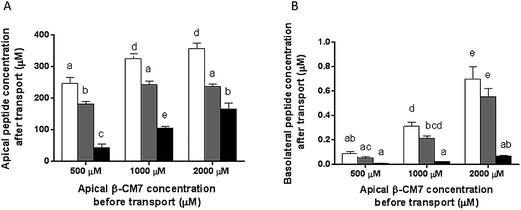
To investigate the fate of β-CM7 and dipeptide YL during intestinal absorption, the Caco-2 transwell model of the small intestine was used to measure in vitro transport and hydrolysis of 500, 1000 and 2000 μM β-CM7 and YL. Toxicity of these concentrations was assessed prior to transport using a cell viability assay. No significant changes to cell viability were observed at any of the peptide concentrations. Additionally, TEER values were measured before and after transport and remained above 0.35 kΩ cm−2 indicating Caco-2 cell viability and an intact monolayer. Confocal images of fixed and stained Caco-2 cell monolayers grown on transwell membranes indicative of TEER values >0.35 kΩ cm−2 are shown in Fig. 1. For transport of 500, 1000 and 2000 μM β-CM7, the average TEER values were 0.85, 0.78 and 0.78 kΩ cm−2 before transport, and 0.61, 0.6 and 0.73 kΩ cm−2 immediately after transport, respectively. For transport of 500, 1000 and 2000 μM LY, the average TEER values were 0.80, 0.83 and 0.96 kΩ cm−2 before transport and 0.58, 0.72 and 0.75 kΩ cm−2 immediately after transport, respectively.To promote uptake and transport of the peptides across the Caco-2 cell monolayers, serum peptides were depleted by incubating the Caco-2 cells in HBSS for 4 h prior to transport (as previously described60,61). Hydrolysis and transport of intact β-CM7 and YL after 30 min was determined by measuring the peptide concentrations in the apical and basolateral chambers using multiple reaction monitoring mass spectrometry (MRM-MS). Apical concentrations of YL did not significantly change following transport with only slight decreases in peptide concentration following application of 1000 and 2000 μM YL (Fig. 2A). The apical concentration of β-CM7 decreased significantly by 82%, 53% and 23% following application of 500, 1000 and 2000 μM β-CM7, respectively (Fig. 2A). Intact YL was quantified in all basolateral samples by MRM-MS, however intact β-CM7 was only detected at the highest concentration (Fig. 2B).
Basolateral peptide concentrations were used to calculate transport rates (Table 1) with the highest rate observed for 1000 μM YL, however there were no significant differences in transport rate following application of 1000 and 2000 μM YL. Transport rate of β-CM7 could only be calculated following application of 2000 μM β-CM7. The significantly lower levels of β-CM7 remaining in the apical samples (compared to β-Lg), in conjunction with the absence of β-CM7 in the basolateral samples, indicated hydrolysis of β-CM7 by the Caco-2 cells.
| Initial apical concentration | β-CM7 Papp (×10−6 cm s−1) | YL Papp (×10−6 cm s−1) |
|---|---|---|
| a Data expressed as the mean ± standard error of duplicate experiments conducted in replicates of six (n = 12). Data with different letters a and b display significant statistical differences (one way ANOVA with Tukey multiple comparisons, p < 0.05). b ND β-CM7 not detected in MRM-MS analyses. | ||
| 500 μM | ND | 0.37 ± 0.04a |
| 1000 μM | ND | 5.26 ± 1.51b |
| 2000 μM | 0.13 ± 0.002a | 3.28 ± 0.74b |
In vitro hydrolysis of β-CM7 and identification of β-CM7 metabolites
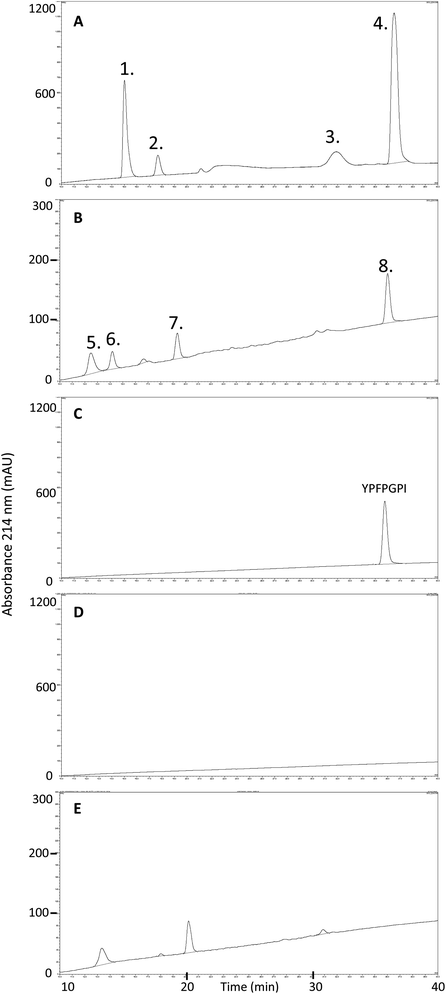
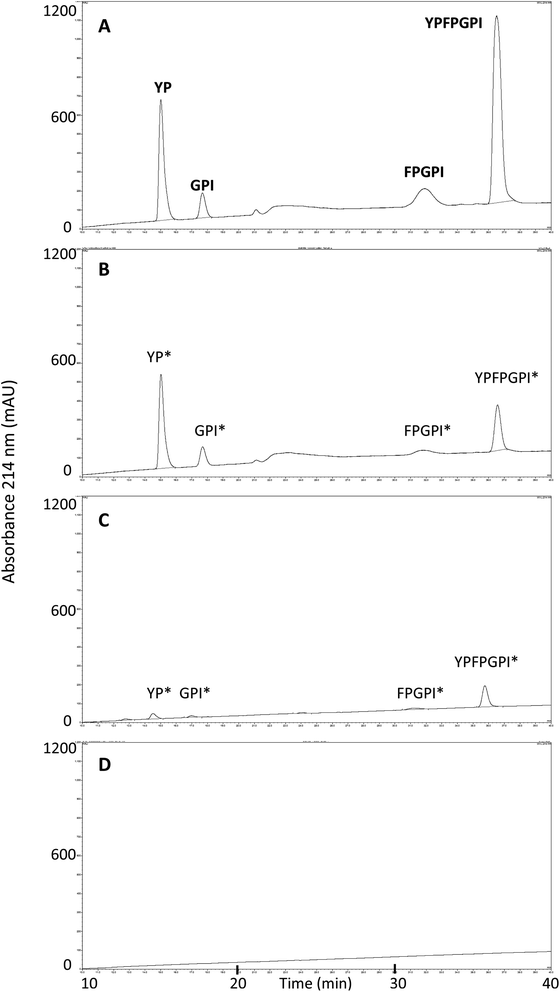
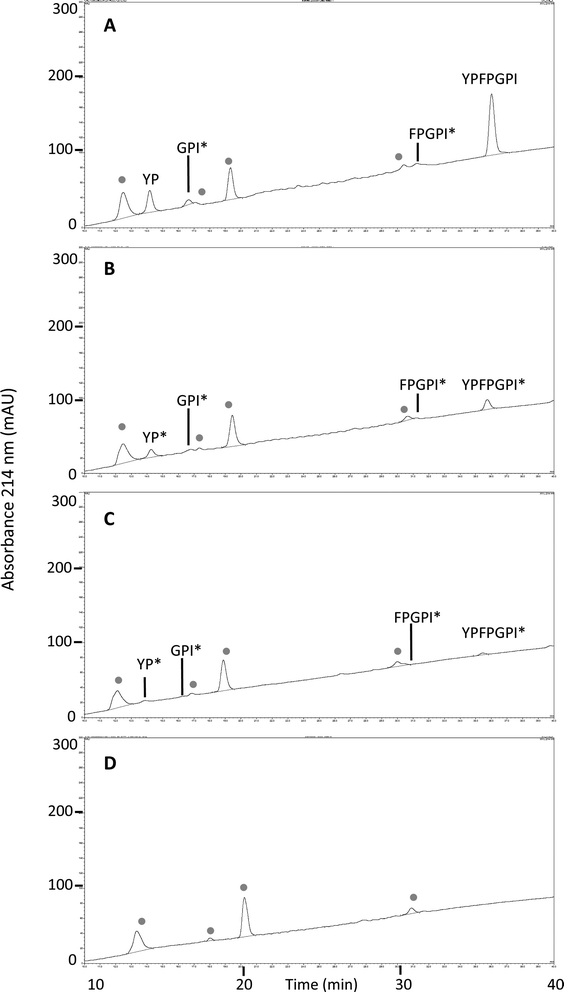
To further investigate the fate of β-CM7 during intestinal absorption and explain the significant decrease in apical concentrations that did not correlate with transport rate, apical and basolateral samples following 2000 μM β-CM7 were analysed by RP-HPLC. Several additional peaks were observed in the apical (Fig. 3A) and basolateral (Fig. 3B) transport chromatograms and were compared to a β-CM7 RP-HPLC standard (Fig. 3C) and HBSS control apical (Fig. 3D) and basolateral (Fig. 3E) samples obtained following transport of HBSS only. These comparisons revealed the presence of intact β-CM7 along with several distinguishable peaks. RP-HPLC fractions containing intact β-CM7 and several other peaks were selected for identification by MALDI-TOF MS analysis. In total, eight different fractions were chosen from duplicate 2000 μM β-CM7 apical and basolateral transport samples.MALDI-TOF analysis revealed the presence of intact β-CM7 and fragments of β-CM7 along with two unknown peaks. The masses in the spectra from fractions 1–4 collected from the 2000 μM β-CM7 apical sample (Fig. 3A) correlated with the masses for intact β-CM7 (YPFPGPI) and the three β-CM7 fragments YP, GPI and FPGPI (ESI† and Table 2). The masses from fractions 6 and 8 collected from the 2000 μM β-CM7 basolateral sample (Fig. 3B) correlated with the masses for YP and intact β-CM7 (YPFPGPI). Peptide sequences were also confirmed for all β-CM7 fragments by MS/MS. No peptide peaks were identified by MALDI-TOF MS in samples 5 and 7. This confirmed transport of intact β-CM7 whilst identifying three β-CM7 metabolites in apical samples. Of the three metabolites, YP was identified in the basolateral samples confirming its transport. To determine if the FPGPI or GPI metabolites were transported, RP-HPLC was used to compare each β-CM7 apical (Fig. 4) and basolateral transport sample (Fig. 5) indicating the presence of FPGPI and GPI fragments in the basolateral samples. On the basis of the MALDI-TOF MS spectra and on the common peaks in the RP-HPLC chromatograms, it was assumed that FPGPI and GPI were also transported into the basolateral samples. Synthetic YP, GPI and FPGPI peptides were then used to construct standard curves for MRM-MS to quantitate the levels of β-CM7 metabolites in all apical and basolateral samples.
| Fraction number (apical/basolateral) | MALDI-TOF mass | Identified peptides |
|---|---|---|
| a No unique peaks were identified in MALDI-TOF MS spectra. | ||
| Fraction 1 (apical) | 279.3 | YP |
| Fraction 2 (apical) | 286.5 | GPI |
| Fraction 3 (apical) | 530.3 | FPGPI |
| Fraction 4 (apical) | 790.4 | YPFPGPI |
| Fraction 5 (basolateral) | No unique peaksa | — |
| Fraction 6 (basolateral) | 279.3 | YP |
| Fraction 7 (basolateral) | No unique peaksa | — |
| Fraction 8 (basolateral) | 790.4 | YPFPGPI |
In vitro transport of β-CM7 metabolites
Apical and basolateral concentrations of the β-CM7 metabolites YP, GPI and FPGPI were measured by MRM-MS revealing significant differences between the appearance of these metabolites in the apical samples and transport across the Caco-2 monolayer. In the apical samples the dipeptide YP was the most abundant metabolite across all β-CM7 transport concentrations (Fig. 6A), however no significant difference in YP concentration was observed between the 1000 and 2000 μM β-CM7 transport concentrations. The next most abundant metabolite was the tripeptide GPI following the same trend as YP. The pentapeptide FPGPI was the least abundant β-CM7 metabolite in all apical samples, however it did increase significantly with β-CM7 transport concentrations. The basolateral β-CM7 metabolite concentrations followed the same trends to those observed in the apical samples (Fig. 6B) with the dipeptide YP concentration being significantly higher than GPI and FPGPI at both the 1000 and 2000 μM transport concentrations. Again the pentapeptide FPGPI was the least abundant metabolite, with no significant increase across the β-CM7 transport concentrations.The transport rate of each β-CM7 metabolite was calculated using the initial concentration of β-CM7 in the apical chamber (Table 3). Accordingly, the most permeable metabolite was YP with a transport rate of 0.35 × 10⁻⁶ cm s−1 following transport of 2000 μM β-CM7. The tripeptide GPI was the next most permeable metabolite with a transport rate of 0.28 × 10⁻⁶ cm s−1 following transport of 2000 μM β-CM7. The transport rate of FPGPI however remained low at 0.02 × 10⁻⁶ cm s−1 and did not significantly change across the increasing β-CM7 transport concentrations.
| Initial apical concentration of β-CM7 (μM) | Calculations based on initial apical β-CM7 concentration | ||
|---|---|---|---|
| YP Papp (×10−6 cm s−1) | GPI Papp (×10−6 cm s−1) | FPGPI Papp (×10−6 cm s−1) | |
| a Data expressed as the mean ± standard error of duplicate experiments conducted in replicates of six (n = 12). Data with different letters a and b display significant statistical differences (one way ANOVA with Tukey multiple comparisons, p < 0.05). | |||
| 500 | 0.18 ± 0.03ab | 0.11 ± 0.02bc | 0.02 ± 0.002c |
| 1000 | 0.32 ± 0.03de | 0.22 ± 0.02be | 0.02 ± 0.001c |
| 2000 | 0.35 ± 0.05d | 0.28 ± 0.03ade | 0.03 ± 0.004c |
In vitro satiety of selected dairy peptides
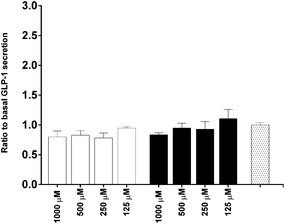
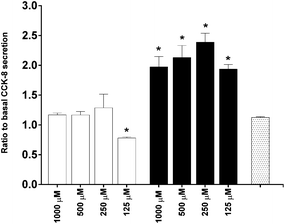
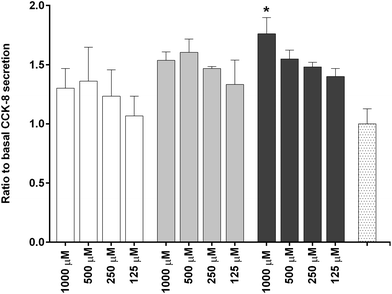
To investigate the in vitro satiety of β-CM7 and YL during intestinal absorption, the STC-1 mouse enteroendocrine cell line was used to measure in vitro satiety through the secretion of CCK-8 and GLP-1 in response to 1000, 500, 250 and 125 μM YL and β-CM7. Serum peptides were depleted by incubating the STC-1 cells in phenol red free and serum free DMEM for 3 h prior to application of the dairy peptides. Toxicity of these peptide concentrations was assessed following each experiment using a cell viability assay. No significant cell toxicity was observed following any of the peptide concentrations. Secretion of GLP-1 was not stimulated by YL or β-CM7 (Fig. 7) however CCK secretion significantly increased in response to all β-CM7 treatments (Fig. 8). To further investigate the CCK response to β-CM7, secretion of CCK was measured following application of the β-CM7 metabolites YP, GPI and FPGPI (Fig. 9). The amount of CCK-8 secretion in response to GPI and YP were similar and not significantly above basal levels, however a significant increase in CCK-8 secretion was observed following treatment with 1000 μM FPGPI.Discussion
The results from this study confirm the low in vitro transport rates and rapid hydrolysis of bovine β-CM7 (YPFPGPI) previously observed in studies involving the Caco-2 transwell model of the intestinal epithelium.21,22 Furthermore, this study revealed the outcomes of the in vitro hydrolysis in terms of three newly identified β-CM7 peptide metabolites FPGPI (62–66), GPI (64–66) and YP (60–61). The concentration of the three peptide fragments accounted for the decrease in apical β-CM7 concentration observed after 30 min in vitro. The resulting peptide fragments suggest the action of the brush border hydrolase, dipeptidyl peptidase IV (DPPIV), due to the liberation of X–P dipeptides from the N-terminus,62 however future experiments involving DPPIV antagonists are needed to confirm this. The in vivo functions of DPPIV have not been fully elucidated however it is known to play a key role in the hydrolysis and inactivation of numerous peptides, including β-CM7. The levels and enzyme activity of DPPIV have previously been measured in Caco-2 cells and correlate with a differentiated phenotype.63 In recent Caco-2 studies, the DPPIV inhibitor diprotin was used to block hydrolysis and enhance uptake of β-CM7.22It is suggested that the action of Caco-2 DPPIV facilitated the hydrolysis of β-CM7 observed in this study, however the resulting decrease in β-CM7 apical concentrations may not have been the only factor limiting transport of intact β-CM7 across the Caco-2 monolayer. Recently two oligopeptide transporters were identified in Caco-2 cells, sodium-coupled oligopeptide transporters 1 and 2 (SOPT1 and SOPT2).64 These transporters accept oligopeptides consisting of five or more amino acids and are inhibited by the presence of di- and tripeptides. Studies in retinal and neuronal cells suggest that opioid peptides are preferentially transported through SOPT2.65,66 The production of β-CM7 metabolites YP and GPI in the apical chamber may limit Caco-2 transport of intact β-CM7 through inhibition of SOPT2-mediated transport. Similarly, this could account for the very low transport rates associated with permeability of the β-CM7 metabolite FPGPI. However, further studies are required to elucidate the precise transport mechanism involved in the in vitro permeability of β-CM7.
In this study, transport of di- and tripeptides was significantly higher than transport of larger oligopeptides. The highest transport rates measured were following application of 1000 and 2000 μM β-Lg dipeptide YL. The transport rates of the β-CM7 peptide metabolites YP and GPI were also 2–3 times higher than the transport rate of intact β-CM7, and 5–15 times higher than the β-CM7 metabolite FPGPI. Intestinal transport of di- and tripeptides can occur through several mechanisms including proton coupled membrane transporters like Peptide Transporters 1 and 2 (PepT1 and PepT2), paracellular transport and transcytosis.67 PepT1 is generally considered a degradative pathway68 hydrolysing the di- and tripeptides into their constituent amino acids. PepT1 is expressed in Caco-2 cells69 and has been well characterised. The in vitro transport of the intact tripeptide GPI observed in this study concurs with transport previously reported for the tripeptides VPP70 and YPI67 suggesting a mechanism different to PepT1. According to previous studies paracellular diffusion70 could be the transport pathway preventing degradation of the peptides by intracellular peptidases. Alternatively the pathway may be intracellular whereby GPI was resistant to the endogenous enzymes.
The concentration of β-Lg dipeptide YL in the apical and basolateral chambers accounted for almost all of the dipeptide initially applied to the apical chambers. Only 6% of β-Lg dipeptide YL was unaccounted for following transport of 1000 μM β-Lg YL, otherwise it appeared as though the dipeptide remained intact throughout the 30 min in vitro transport. This suggests YL may also transport paracellularly, or that it's not only resistant to DPPIV but also other intracellular enzymes produced by Caco-2. Similarly the β-CM7 metabolite YP also transported across Caco-2 monolayer intact – with no apparent loss in β-CM7 concentration when the sum of all detectable β-CM7 metabolites was considered. However it is important to note that this investigation was not targeted to individual amino acid analysis, therefore it is possible that amino acids may have been released undetected. Regardless of the di- and tripeptide transport routes YL, YP and GPI transported intact, indicating that these peptides may persist beyond the intestinal epithelium in vivo.
In terms of biological activity of these peptides at the intestinal epithelium, satiety (indicated by the secretion of CCK-8 and GLP-1 by STC-1 cells) was measured in response to the β-Lg dipeptide YL, intact β-CM7 and its metabolites (YP, GPI and FPGPI). No significant GLP-1 secretion was observed in response to the β-Lg dipeptide YL or intact β-CM7. This is consistent with previous in vitro studies where the application of peptides, including β-CM7, to STC-1 cells did not induce GLP-1 secretion above basal levels.71 Other in vitro studies suggest that protein hydrolysates71 and larger peptides,35 as well as alternative protein sources like meat and eggs, significantly induce GLP-1 secretion.72 CCK-8 secretion however was significantly induced in response to intact β-CM7 and its metabolite FPGPI. No significant CCK secretion was observed in response to the tri- or dipeptides, however a significant decrease in CCK-8 secretion was observed following treatment with 125 μM YL. Cell numbers were maintained during this treatment, however decreased metabolic activity within the cells may be the cause of the decreased CCK-8 secretion. Future studies are required to confirm this observation.
The highest induction of CCK-8 secretion was observed in response to intact β-CM7, followed by the β-CM7 metabolite FPGPI. The levels of CCK-8 secretion induced by intact β-CM7 at all concentrations were comparable to 1 mg mL−1 commercial whey hydrolysate (data not shown) suggesting that β-CM7 was as effective at inducing CCK-8 secretion as a pool of different peptides. Additionally, recent studies have also reported the STC-1 secretion of CCK-8 in response to a quadrapeptide (IHRF)73 with a similar fold-induction to that observed in this study in response to GPI and FPGPI. Previous studies reported CCK-8 secretion in response to di- (RF)36 and tripeptides,37 however the concentrations of peptides applied to the STC-1 cells were three to ten-fold higher than those applied in this study. It is possible that higher non-toxic concentrations of YL and YP might stimulate CCK-8 secretion above basal levels.
Studies involving the siRNA inhibition of the heteromeric amino acid (umami) taste receptor (T1R1–T1R3) in the STC-1 cell line indicate that T1R1–T1R3 acts as a luminal sensor for F, L and E amino acid induced CCK-8 secretion.37 Other studies involving calcium-sensing receptor (CaSR) linked CCK-8 secretion in STC-1 cells provide further evidence of F as an intraluminal CCK stimulator.74 These studies applied considerably (five to fifty-fold) higher concentrations of amino acids than the concentrations of peptides applied in this study. However, in this study significant CCK-8 secretion was induced in response to peptides containing F amino acids. Thus further experiments are required to determine whether peptide size, amino acid composition or concentration was the determining factor in CCK-8 secretion by the STC-1 cells.
Conclusions
This study confirmed the relatively low transport and rapid hydrolysis of β-CM7 by Caco-2 cells previously reported, and has further revealed the outcome of this hydrolysis by identifying three peptide β-CM7 metabolites. These previously unreported β-CM7 peptides, YP, GPI and FPGPI, were found to transport across the Caco-2 monolayer at variable rates and differentially induce CCK-8 secretion by STC-1 cells. The YP and GPI peptide metabolites transported at the highest rates, however the longer FPGPI peptide metabolite induced the most CCK-8 secretion. These in vitro results suggest that the fate and low transport rate of β-CM7 at the intestinal epithelium is most likely determined by brush border hydrolases rather than limited transport routes, providing a possible explanation for the lack of β-CM7 in adult blood and urine following consumption of casein. In summary, this study has investigated the in vitro transport and satiety of dairy di-, tri-, penta- and heptapeptides, indicating that peptide size limits transport across Caco-2 monolayers, whilst enhancing CCK-8 secretion by STC-1 cells. Future studies are needed to investigate the digestive behavior and fate of other dairy peptides at the intestinal epithelium, so as to identify specific peptides that may be useful for designing dairy products with enhanced satiety and other targeted health outcomes.References
- B. Chabance, P. Marteau, J. C. Rambaud, D. Migliore-Samour, M. Boynard, P. Perrotin, R. Guillet, P. Jolles and A. M. Fiat, Biochimie, 1998, 80, 155–165 CrossRef CAS.
- R. A. McGregor and S. D. Poppitt, Nutr. Metab., 2013, 10, 46 CAS.
- H. Korhonen and A. Pihlanto, Curr. Pharm. Des., 2007, 13, 829–843 CrossRef CAS.
- R. Nagpal, P. Behare, R. Rana, A. Kumar, M. Kumar, S. Arora, F. Morotta, S. Jain and H. Yadav, Food Funct., 2011, 2, 18–27 CAS.
- M. Phelan and D. Kerins, Food Funct., 2011, 2, 153–167 CAS.
- M. Kumar, V. Verma, R. Nagpal, A. Kumar, P. V. Behare, B. Singh and P. K. Aggarwal, Br. J. Nutr., 2012, 107, 1006–1016 CrossRef CAS PubMed.
- O. Power, P. Jakeman and R. J. FitzGerald, Amino Acids, 2013, 44, 797–820 CrossRef CAS PubMed.
- R. B. Kreider, M. Iosia, M. Cooke, G. Hudson, C. Rasmussen, H. Chen, O. Mollstedt and M. H. Tsai, Nutr. J., 2011, 10, 99 CrossRef CAS PubMed.
- H. J. Korhonen, Cell. Mol. Biol., 2013, 59, 12–24 CAS.
- B. Hernandez-Ledesma, I. Recio and L. Amigo, Amino Acids, 2008, 35, 257–265 CrossRef CAS PubMed.
- R. Boutrou, C. Gaudichon, D. Dupont, J. Jardin, G. Airinei, A. Marsset-Baglieri, R. Benamouzig, D. Tome and J. Leonil, Am. J. Clin. Nutr., 2013, 97, 1314–1323 CrossRef CAS PubMed.
- V. Brantl, H. Teschemacher, A. Henschen and F. Lottspeich, Hoppe Seylers Z Physiol Chem, 1979, vol. 360, pp. 1211–1216 Search PubMed.
- M. Kurek, B. Przybilla, K. Hermann and J. Ring, Int. Arch. Allergy Immunol., 1992, 97, 115–120 CrossRef CAS PubMed.
- W. Zhang, J. Miao, S. Wang and Y. Zhang, PLoS One, 2013, 8, e63472 CAS.
- S. Kaminski, A. Cieslinska and E. Kostyra, J. Appl. Genet., 2007, 48, 189–198 CrossRef PubMed.
- A. Cieslinska, E. Kostyra, H. Kostyra, K. Olenski, E. Fiedorowicz and S. Kaminski, Int. J. Food Sci. Nutr., 2012, 63, 426–430 CrossRef CAS PubMed.
- R. A. Clemens, Nestle Nutr. Inst. Workshop Ser., Pediatr. Program, 2011, 67, 187–195 CAS.
- N. V. Kost, O. Y. Sokolov, O. B. Kurasova, A. D. Dmitriev, J. N. Tarakanova, M. V. Gabaeva, Y. A. Zolotarev, A. K. Dadayan, S. A. Grachev, E. V. Korneeva, I. G. Mikheeva and A. A. Zozulya, Peptides, 2009, 30, 1854–1860 CrossRef CAS PubMed.
- M. Singh, C. L. Rosen, K. J. Chang and G. G. Haddad, Pediatr. Res., 1989, 26, 34–38 CrossRef CAS PubMed.
- DATEX-Working-Group-on-β-casomorphins, Review of the potential health impact of β-casomorphins and related peptides, 2009, vol. 231, pp. 1–107 Search PubMed.
- M. Iwan, B. Jarmolowska, K. Bielikowicz, E. Kostyra, H. Kostyra and M. Kaczmarski, Peptides, 2008, 29, 1042–1047 CrossRef CAS PubMed.
- B. Jarmolowska, M. Teodorowicz, E. Fiedorowicz, E. Sienkiewicz-Szlapka, M. Matysiewicz and E. Kostyra, Peptides, 2013, 49, 59–67 CrossRef CAS PubMed.
- S. V. Silva and F. X. Malcata, Int. Dairy J., 2005, 15, 1–15 CrossRef CAS PubMed.
- D. A. Clare and H. E. Swaisgood, J. Dairy Sci., 2000, 83, 1187–1195 CrossRef CAS.
- A. Dougkas, A. M. Minihane, D. I. Givens, C. K. Reynolds and P. Yaqoob, Br. J. Nutr., 2012, 108, 2274–2285 CrossRef CAS PubMed.
- L. Q. Bendtsen, J. K. Lorenzen, N. T. Bendsen, C. Rasmussen and A. Astrup, Adv. Nutr., 2013, 4, 418–438 CrossRef CAS PubMed.
- A. Dougkas, C. K. Reynolds, I. D. Givens, P. C. Elwood and A. M. Minihane, Nutr. Res. Rev., 2011, 24, 72–95 CrossRef PubMed.
- I. Ricci-Cabello, M. O. Herrera and R. Artacho, Nutr. Rev., 2012, 70, 241–255 CrossRef PubMed.
- G. J. Dockray, Regul. Pept., 2009, 155, 6–10 CrossRef CAS PubMed.
- R. A. Liddle, Annu. Rev. Physiol., 1997, 59, 221–242 CrossRef CAS PubMed.
- A. I. Sayegh, Prog. Mol. Biol. Transl. Sci., 2013, 114, 277–316 CAS.
- J. Yoon and M. C. Beinfeld, J. Biol. Chem., 1997, 272, 9450–9456 CrossRef CAS PubMed.
- G. A. Bray, Proc. Nutr. Soc., 2000, 59, 373–384 CrossRef CAS PubMed.
- S. Nakajima, T. Hira and H. Hara, Mol. Nutr. Food Res., 2012, 56, 753–760 CAS.
- J. S. Wattez, R. Ravallec, B. Cudennec, C. Knauf, P. Dhulster, P. Valet, C. Breton, D. Vieau and J. Lesage, Peptides, 2013, 48, 134–136 CrossRef CAS PubMed.
- T. Kagebayashi, N. Kontani, Y. Yamada, T. Mizushige, T. Arai, K. Kino and K. Ohinata, Mol. Nutr. Food Res., 2012, 56, 1456–1463 CAS.
- K. Daly, M. Al-Rammahi, A. Moran, M. Marcello, Y. Ninomiya and S. P. Shirazi-Beechey, Am. J. Physiol.: Gastrointest. Liver Physiol., 2013, 304, G271–G282 CrossRef CAS PubMed.
- D. Staljanssens, J. Van Camp, A. Billiet, T. De Meyer, N. Al Shukor, W. H. De Vos and G. Smagghe, Peptides, 2012, 34, 226–231 CrossRef CAS PubMed.
- R. L. Smeets, K. M. Garner, M. Hendriks, S. E. van Emst-de Vries, M. D. Peacock, W. Hendriks, J. J. de Pont and P. H. Willems, Cell Calcium, 1996, 20, 1–9 CrossRef CAS.
- L. Lin, M. Umahara, D. A. York and G. A. Bray, Peptides, 1998, 19, 325–331 CrossRef CAS.
- C. L. White, G. A. Bray and D. A. York, Peptides, 2000, 21, 1377–1381 CrossRef CAS.
- L. Lin, S. R. Thomas, G. Kilroy, G. J. Schwartz and D. A. York, Am. J. Physiol.: Regul., Integr. Comp. Physiol., 2003, 285, R321–R328 CAS.
- A. Jahan-Mihan, B. L. Luhovyy, D. El Khoury and G. H. Anderson, Nutrients, 2011, 3, 574–603 CrossRef CAS PubMed.
- H. Meisel and R. J. FitzGerald, Br. J. Nutr., 2000, 84(suppl. 1), S27–S31 CAS.
- J. Pupovac and G. H. Anderson, J. Nutr., 2002, 132, 2775–2780 CAS.
- M. A. Froetschel, M. J. Azain, G. L. Edwards, C. R. Barb and H. E. Amos, J. Nutr., 2001, 131, 3270–3276 CAS.
- A. B. Nongonierma, H. Schellekens, T. G. Dinan, J. F. Cryan and R. J. FitzGerald, Food Funct., 2013, 4, 728–737 CAS.
- O. Y. Sokolov, N. A. Pryanikova, N. V. Kost, Y. A. Zolotarev, E. N. Ryukert and A. A. Zozulya, Bull. Exp. Biol. Med., 2005, 140, 582–584 CrossRef CAS PubMed.
- T. A. Zafar, C. Waslien, A. AlRaefaei, N. Alrashidi and E. AlMahmoud, Nutr. Res., 2013, 33, 303–310 CrossRef CAS PubMed.
- T. Akhavan, B. L. Luhovyy, P. H. Brown, C. E. Cho and G. H. Anderson, Am. J. Clin. Nutr., 2010, 91, 966–975 CrossRef CAS PubMed.
- S. D. Poppitt, C. M. Strik, B. H. McArdle, A. T. McGill and R. S. Hall, J. Am. Coll. Nutr., 2013, 32, 177–186 CrossRef PubMed.
- A. Mansour, S. Hosseini, B. Larijani, M. Pajouhi and M. R. Mohajeri-Tehrani, Nutrition, 2013, 29, 813–820 CrossRef CAS PubMed.
- C. F. Deacon and J. J. Holst, Best Pract. Res., Clin. Endocrinol. Metab., 2009, 23, 425–432 CrossRef CAS PubMed.
- R. E. Kuhre, N. W. Albrechtsen, J. A. Windelov, B. Svendsen, B. Hartmann and J. J. Holst, Peptides, 2014, 55C, 52–57 CrossRef PubMed.
- E. P. Rafferty, A. R. Wylie, C. T. Elliott, O. P. Chevallier, D. J. Grieve and B. D. Green, Sci. Pharm., 2011, 79, 615–621 CrossRef CAS PubMed.
- Q. Chen and R. A. Reimer, Nutrition, 2009, 25, 340–349 CrossRef CAS PubMed.
- S. Tavelin, J. Grasjo, J. Taipalensuu, G. Ocklind and P. Artursson, Methods Mol. Biol., 2002, 188, 233–272 CAS.
- C. Cakir-Kiefer, L. Miclo, F. Balandras, A. Dary, C. Soligot and Y. Le Roux, J. Agric. Food Chem., 2011, 59, 11956–11965 CrossRef CAS PubMed.
- F. J. Moreno, L. A. Rubio, A. Olano and A. Clemente, J. Agric. Food Chem., 2006, 54, 8631–8639 CrossRef CAS PubMed.
- Z. Sarwar, F. Annaba, A. Dwivedi, S. Saksena, R. K. Gill and W. A. Alrefai, Am. J. Physiol.: Gastrointest. Liver Physiol., 2009, 297, G532–G538 CrossRef CAS PubMed.
- M. V. Chandra-Hioe, R. Addepalli, S. A. Osborne, I. Slapetova, R. Whan, M. P. Bucknall and J. Arcot, Food Res. Int., 2013, 53, 104–109 CrossRef CAS PubMed.
- R. Mentlein, Regul. Pept., 1999, 85, 9–24 CrossRef CAS.
- D. Darmoul, M. Lacasa, L. Baricault, D. Marguet, C. Sapin, P. Trotot, A. Barbat and G. Trugnan, J. Biol. Chem., 1992, 267, 4824–4833 CAS.
- P. Chothe, N. Singh and V. Ganapathy, Am. J. Physiol.: Cell Physiol., 2011, 300, C1260–C1269 CrossRef CAS PubMed.
- P. P. Chothe, S. V. Thakkar, J. P. Gnana-Prakasam, S. Ananth, D. R. Hinton, R. Kannan, S. B. Smith, P. M. Martin and V. Ganapathy, Invest. Ophthalmol. Visual Sci., 2010, 51, 413–420 Search PubMed.
- S. Ananth, S. V. Thakkar, J. P. Gnana-Prakasam, P. M. Martin, P. S. Ganapathy, S. B. Smith and V. Ganapathy, J. Pharm. Sci., 2012, 101, 154–163 CrossRef CAS PubMed.
- M. Miguel, A. Davalos, M. A. Manso, G. de la Pena, M. A. Lasuncion and R. Lopez-Fandino, Mol. Nutr. Food Res., 2008, 52, 1507–1513 CAS.
- D. M. Matthews, Beitr Infusionther Klin Ernahr, 1987, 17, 6–53 CAS.
- W. Tai, Z. Chen and K. Cheng, Mol. Pharm., 2013, 10, 477–487 CrossRef CAS PubMed.
- M. Satake, M. Enjoh, Y. Nakamura, T. Takano, Y. Kawamura, S. Arai and M. Shimizu, Biosci., Biotechnol., Biochem., 2002, 66, 378–384 CrossRef CAS.
- M. C. Geraedts, F. J. Troost, M. A. Fischer, L. Edens and W. H. Saris, Mol. Nutr. Food Res., 2011, 55, 476–484 CAS.
- M. Cordier-Bussat, C. Bernard, F. Levenez, N. Klages, B. Laser-Ritz, J. Philippe, J. A. Chayvialle and J. C. Cuber, Diabetes, 1998, 47, 1038–1045 CrossRef CAS.
- N. Kontani, R. Omae, T. Kagebayashi, K. Kaneko, Y. Yamada, T. Mizushige, R. Kanamoto and K. Ohinata, Mol. Nutr. Food Res., 2013, 58, 359–364 Search PubMed.
- T. Hira, S. Nakajima, Y. Eto and H. Hara, FEBS J., 2008, 275, 4620–4626 CrossRef CAS PubMed.
Footnote |
| † Electronic supplementary information (ESI) available. See DOI: 10.1039/c4fo00164h |
| This journal is © The Royal Society of Chemistry 2014 |

