 Open Access Article
 This Open Access Article is licensed under a
 Creative Commons Attribution 3.0 Unported Licence
A standardised static in vitro digestion method suitable for food – an international consensus†
M.
Minekus‡
a,
M.
Alminger‡
b,
P.
Alvito‡
c,
S.
Ballance‡
d,
T.
Bohn‡
e,
C.
Bourlieu‡
fh,
F.
Carrière§
g,
R.
Boutrou‡
fh,
M.
Corredig‡
i,
D.
Dupont§
fh,
C.
Dufour‡
j,
L.
Egger‡
k,
M.
Golding¶
l,
S.
Karakaya‡
m,
B.
Kirkhus§
n,
S.
Le Feunteun‡
o,
U.
Lesmes‡
p,
A.
Macierzanka‡
q,
A.
Mackie‡
r,
S.
Marze§
s,
D. J.
McClements¶
t,
O.
Ménard‡
fh,
I.
Recio‡
u,
C. N.
Santos‡
vw,
R. P.
Singh¶
x,
G. E.
Vegarud‡
y,
M. S. J.
Wickham‡
z,
W.
Weitschies‡
aa and
A.
Brodkorb‡
*ab
aTNO, PO BOX 360, 3700AJ Zeist, The Netherlands. E-mail: Mans.Minekus@tno.nl
bChalmers University of Technology, Department of Chemical and Biological Engineering, SE-412 96 Gothenburg, Sweden. E-mail: Marie.Alminger@chalmers.se
cNational Institute of Health Doutor Ricardo Jorge, I.P., Food and Nutrition Department, Av. Padre Cruz, 1649-016 Lisboa, Portugal. E-mail: Paula.Alvito@insa.min-saude.pt
dNofima AS, Osloveien 1, NO-1430 Ås, Norway. E-mail: Simon.Ballance@nofima.no
eCentre de Recherche Public - Gabriel Lippmann, 41 rue du Brill, 4422 Belvaux, Luxembourg. E-mail: Bohn@lippmann.lu
fINRA, UMR1253 Science et Technologie du Lait et de l’Oeuf, F-35042 Rennes, France. E-mail: Claire.Bourlieu@rennes.inra.fr; Didier.Dupont@rennes.inra.fr
gCNRS-Aix Marseille University, UMR7282, 31 Chemin Joseph-Aiguier, F-13402 Marseilles Cedex 20, France. E-mail: carriere@imm.cnrs.fr
hAGROCAMPUS OUEST, UMR1253 Science et Technologie du Lait et de l’Oeuf, F-35042 Rennes, France. E-mail: Rachel.Boutrou@rennes.inra.fr; olivia.menard@rennes.inra.fr
iUniversity of Guelph, Department of Food Science, Ontario N1G 2W1, Canada. E-mail: Mcorredi@uoguelph.ca
jINRA, UMR SQPOV, Domaine Saint-Paul - Site Agroparc 84914, Avignon Cedex 9, France. E-mail: Claire.dufour@avignon.inra.fr
kAgroscope Liebefeld-Posieux Research Station ALP, Schwarzenburgstrasse 161, CH-3003 Berne, Switzerland. E-mail: Carlotte.Eger@agroscope.admin.ch
lInstitute of Food, Nutrition and Human Health, Riddet Institute, Massey University, Private Bag 11 222, Palmerston North 4442, New Zealand. E-mail: M.Golding@massey.ac.nz
mEge University, Engineering Faculty Department of Food Engineering, 35100 Izmir, Turkey. E-mail: Sibel.Karakaya@ege.edu.tr
nNofima, Osloveien 1, NO-1430 Ås, Norway. E-mail: Bente.Kirkhus@nofima.no
oINRA AgroParisTech, UMR GMPA 782, 78850 Thiverval grignon, France. E-mail: Steven.Le-Feunteun@grignon.inra.fr
pDepartment of Biotechnology and Food Engineering,Technion - Israel Institute of Technology, Haifa 32000, Israel. E-mail: lesmesu@tx.technion.ac.il
qInstitute of Food Research, Norwich Research Park, Colney, NR4 7UA Norwich, UK. E-mail: Adam.Macierzanka@ifr.ac.uk
rInstitute of Food Research, Norwich, NR4 7UA Norfolk, UK. E-mail: Alan.Mackie@ifr.ac.uk
sUR1268 Biopolymères Interactions Assemblages, INRA, F-44300, Nantes, France. E-mail: Sebastien.Marze@nantes.inra.fr
tDepartment of Food Science, University of Massachusetts, Chenoweth Lab., Amherst, MA 01003, USA. E-mail: mcclements@foodsci.umass.edu
uInstituto de Investigación en Ciencias de la Alimentación (CIAL, CSIC-UAM), Nicolás Cabrera 9, 28049 Madrid, Spain. E-mail: i.recio@csic.es
vInstituto de Biologia Experimental e Tecnológica, Apartado 12, 2781-901 Oeiras, Portugal
wInstituto de Tecnologia Química e Biológica, Universidade Nova de Lisboa, Av. da República, EAN, 2781-901 Oeiras, Portugal. E-mail: csantos@ibet.pt
xDepartment of Biological and Agricultural Engineering, Department of Food Science and Technology, University of California, Davis, CA 95616, USA. E-mail: rpsingh@ucdavis.edu
yDepartment of Chemistry, Biotechnology and Food Science, Norwegian University of Life Sciences, 1432 Aas, Norway. E-mail: Gerd.Vegarud@umb.no
zLeatherhead Food Research, Randalls Road, Leatherhead, Surrey KT22 7RY, UK. E-mail: MWickham@leatherheadfood.com
aaErnst Moritz Arndt University of Greifswald, D-17487 Greifswald, Germany. E-mail: Werner.Weitschies@uni-greifswald.de
abTeagasc Food Research Centre, Moorepark, Fermoy, County Cork, Ireland. E-mail: Andre.Brodkorb@teagasc.ie
First published on 7th April 2014
Abstract
Simulated gastro-intestinal digestion is widely employed in many fields of food and nutritional sciences, as conducting human trials are often costly, resource intensive, and ethically disputable. As a consequence, in vitro alternatives that determine endpoints such as the bioaccessibility of nutrients and non-nutrients or the digestibility of macronutrients (e.g. lipids, proteins and carbohydrates) are used for screening and building new hypotheses. Various digestion models have been proposed, often impeding the possibility to compare results across research teams. For example, a large variety of enzymes from different sources such as of porcine, rabbit or human origin have been used, differing in their activity and characterization. Differences in pH, mineral type, ionic strength and digestion time, which alter enzyme activity and other phenomena, may also considerably alter results. Other parameters such as the presence of phospholipids, individual enzymes such as gastric lipase and digestive emulsifiers vs. their mixtures (e.g. pancreatin and bile salts), and the ratio of food bolus to digestive fluids, have also been discussed at length. In the present consensus paper, within the COST Infogest network, we propose a general standardised and practical static digestion method based on physiologically relevant conditions that can be applied for various endpoints, which may be amended to accommodate further specific requirements. A frameset of parameters including the oral, gastric and small intestinal digestion are outlined and their relevance discussed in relation to available in vivo data and enzymes. This consensus paper will give a detailed protocol and a line-by-line, guidance, recommendations and justifications but also limitation of the proposed model. This harmonised static, in vitro digestion method for food should aid the production of more comparable data in the future.
Introduction
In vitro methods simulating digestion processes are widely used to study the gastro-intestinal behaviour of food or pharmaceuticals. Although human nutritional studies are still being considered the “gold standard” for addressing diet related questions, in vitro methods have the advantage of being more rapid, less expensive, less labour intensive, and do not have ethical restrictions. This allows a relatively large number of samples to be measured in parallel for screening purposes. Reproducibility, choice of controlled conditions and easy sampling at the site of interest make in vitro models very suitable for mechanistic studies and hypothesis building.Simulated digestion methods typically include the oral, gastric and small intestinal phases, and occasionally large intestinal fermentation. These methods try to mimic physiological conditions in vivo, taking into account the presence of digestive enzymes and their concentrations, pH, digestion time, and salt concentrations, among other factors. Some computerized sophisticated models such as the Dutch TNO gastrointestinal tract model,1 the model by the English Institute of Food Research2 or by the French INRA3 allowing the simulation of dynamic aspects of digestion, such as transport of digested meals, variable enzyme concentrations and pH changes over time. However, the majority of models reported in literature are static ones,4i.e. models with constant ratios of meal to enzymes, salt, bile acids etc. at each step of digestion.
Static models of human digestion have been used to address such diverse scientific questions as the digestibility and bioaccessibility (i.e. the amount of a compound that is released from the matrix and is considered to be available for absorption through the gut wall) of pharmaceuticals,5 mycotoxins,6 and macronutrients such as proteins,7,8 carbohydrates9 and lipids.10,11 They have also been used to study matrix release of micronutrients such as minerals and trace elements,12 and secondary plant compounds including carotenoids13 and polyphenols.14,15 Some digestion methods are used to produce bioaccessible fractions that can be used to address further mechanistic questions, such as intestinal transport by employing Caco-2 cells.16 Although many in vitro methods are derived from earlier reported methods, there is significant variation in the use of in vitro digestion parameters between the individual models described in literature,17–19 impeding the possibility to compare results across research-groups and to deduce general findings. While altering some of these parameters may have a limited impact on the matrix release or digestibility of some compounds, there could be a large impact for other ingredients. Enzyme activity is also altered by pH and the concentration of salts such as calcium. The applied gastric pH may vary greatly between the models, i.e. from pH 220 to pH 4.21 The COST action INFOGEST22 is an international network joined by more than 200 scientists from 32 countries working in the field of digestion. One aim of the network is to consolidate conditions for simulated digestion of food and find a consensus, if possible, for a digestion model. The group is aware that no conditions outlined will be suited for all underlying research questions. However, the authors of this manuscript strived to describe a “smallest common denominator”, i.e. a set of conditions that are close to the physiological situation, are practical, and can be seen as a basic suggestion to address various research questions. Further amendments of these suggested conditions may be needed, for example to simulate digestion in infants or the elderly, which may differ considerably in enzyme concentration.23–25 For more accurate simulation of in vivo conditions, dynamic models should be used. In the next sections, we describe our recommendations for a standardised digestion method which is based on the current state of knowledge on in vivo digestion conditions, and employs widely available instrumentation and chemicals.
Experimental – in vitro digestion protocol
This section describes a detailed line-by-line protocol, which is also summarised in Fig. 1. Further information and justification on the choice and concentration of chemicals, inclusion or omission of certain steps are discussed in greater detail in the following section “In vitro digestion parameters – recommendation and justification”.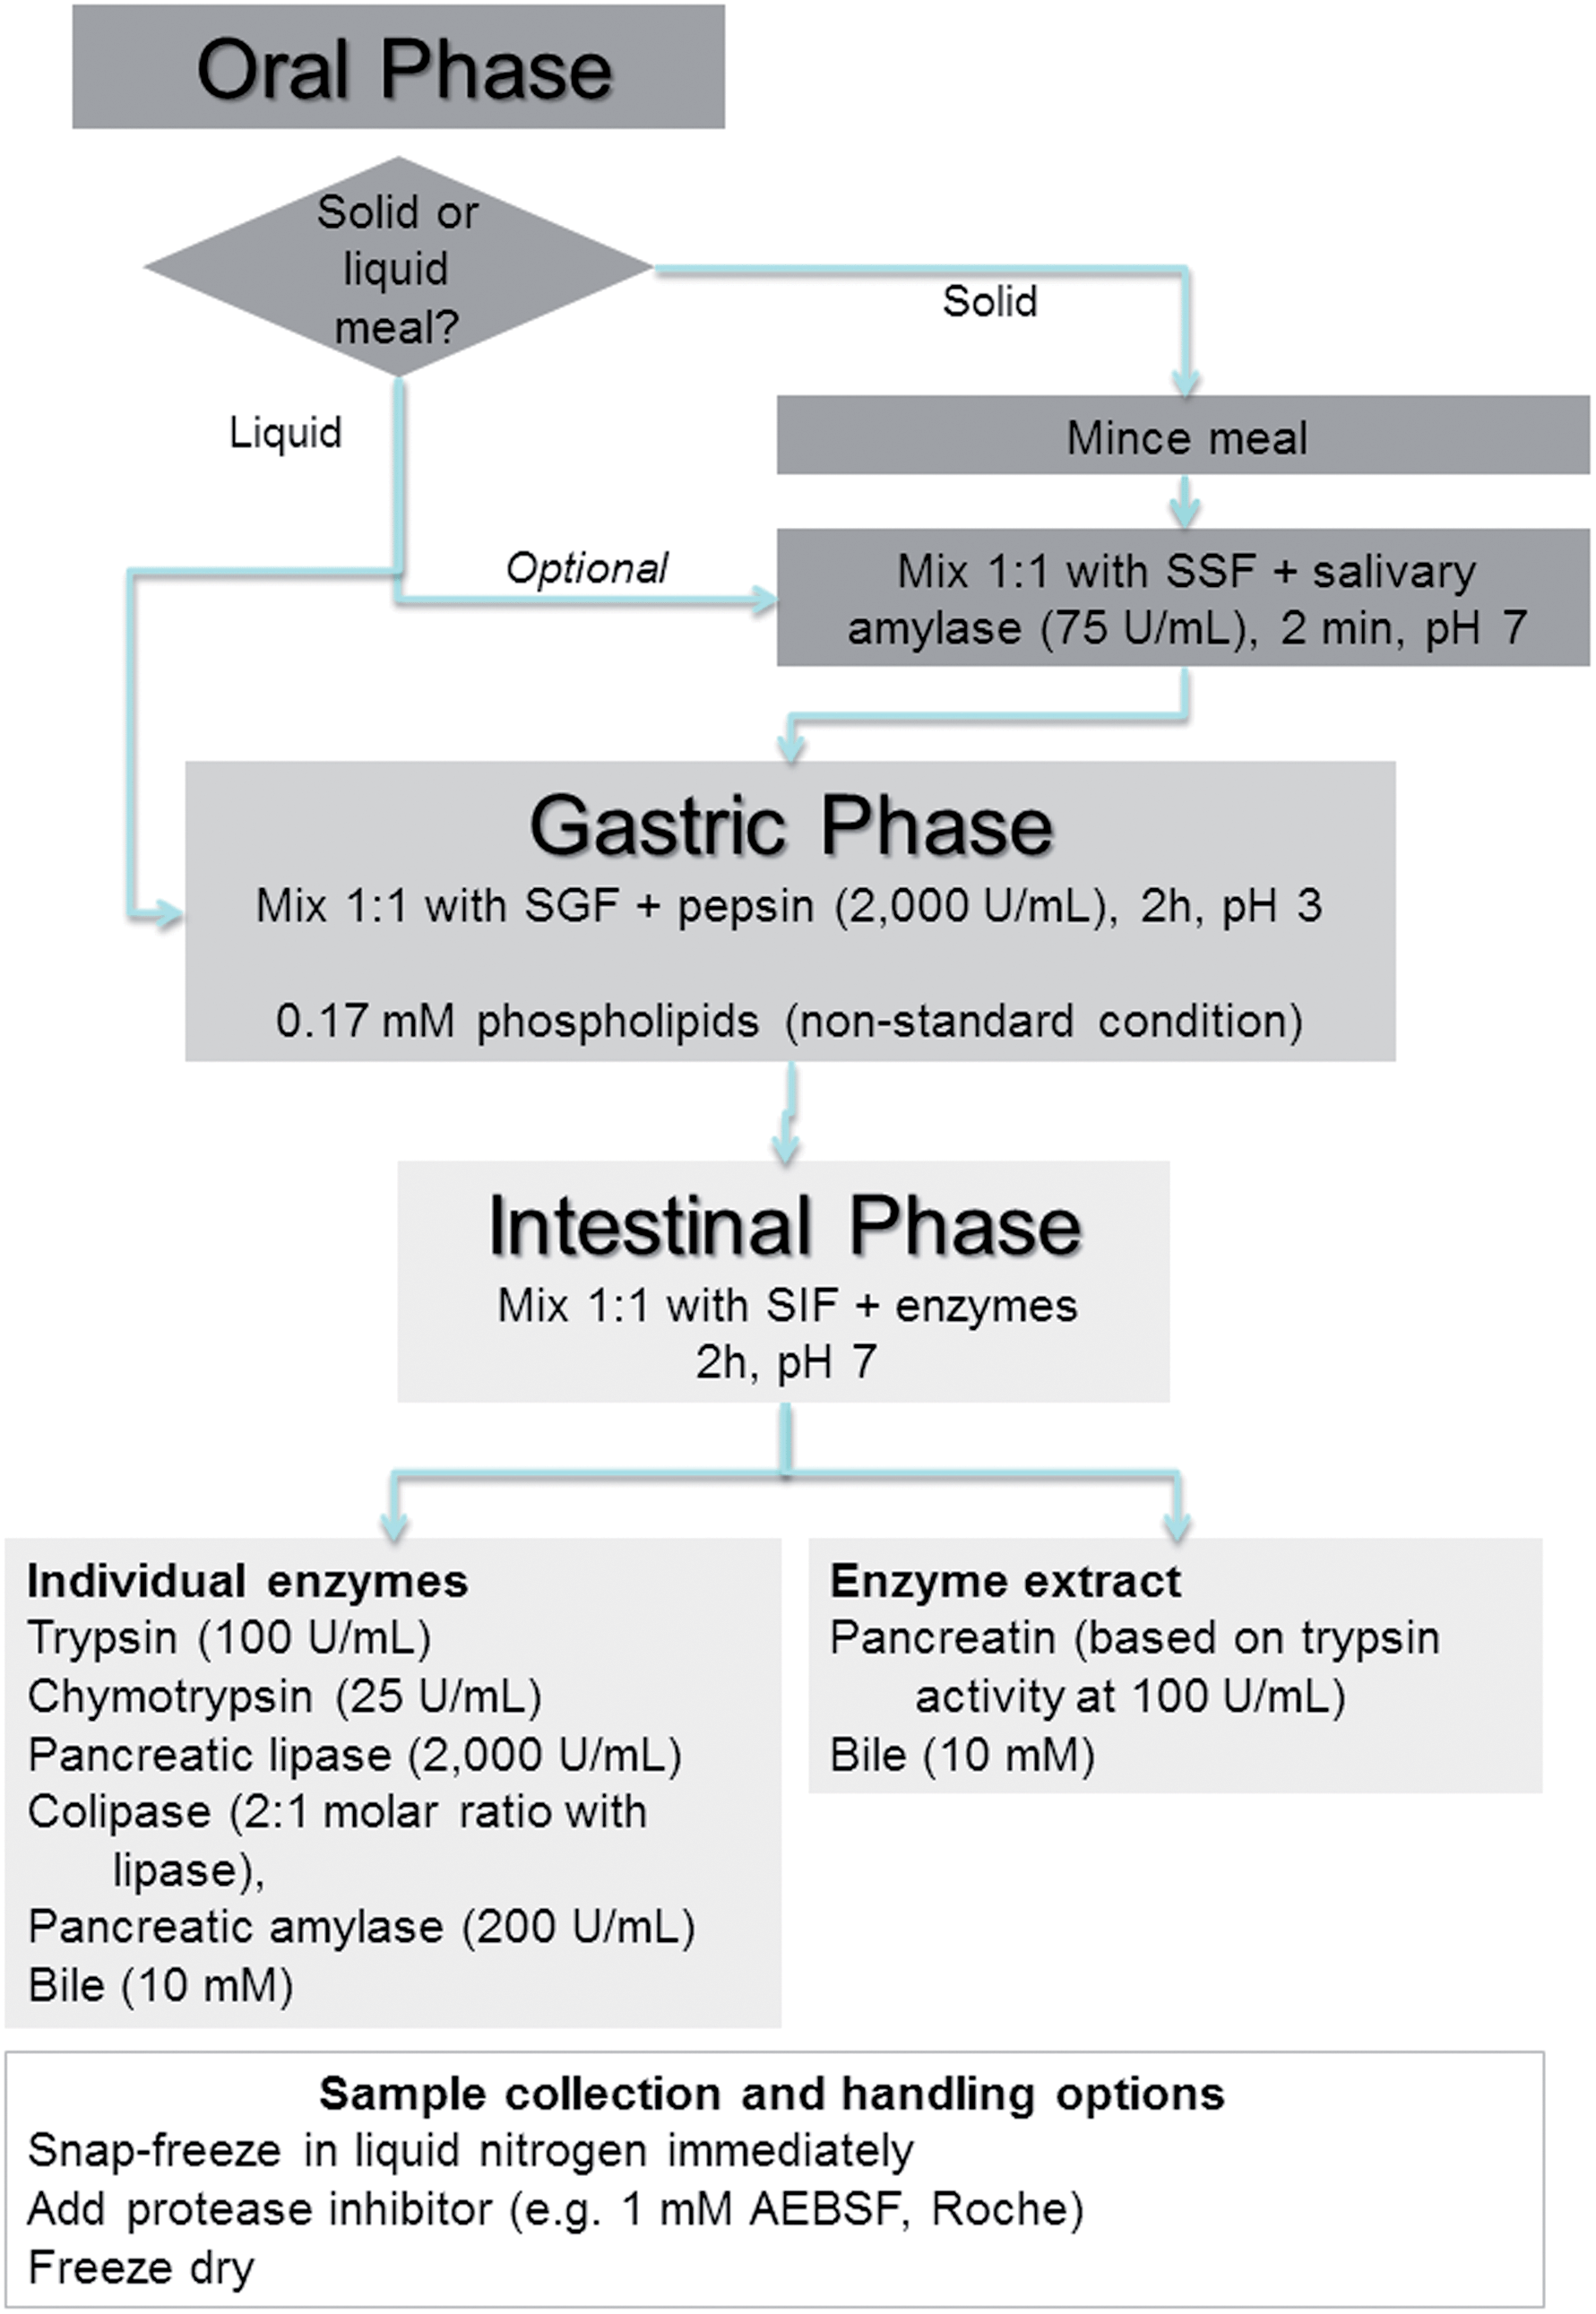 | ||
| Fig. 1 Overview and flow diagram of a simulated in vitro digestion method. SSF, SGF and SIF are Simulated Salivary Fluid, Simulated Gastric Fluid and Simulated Intestinal Fluid, respectively. Enzyme activities are in units per mL of final digestion mixture at each corresponding digestion phase. | ||
Materials
All materials are standard analytical grade. Sodium bicarbonate (0.5 M) should be filtered through a 0.22 μm filter under vacuum. It can be stored at 2–5 °C for approximately one month. The type of enzyme products, mostly provided by Sigma Aldrich (St Louis, Mo), is only a recommendation and similar products of comparable quality from other providers can be used. Enzyme activities are based on commonly used assays. Detailed protocols of the enzyme assays are outlined in the ESI.† α-Amylase (EC 3.2.1.1) activity is based on soluble potato starch: one unit liberates 1.0 mg of maltose from starch in 3 minutes at pH 6.9 at 20 °C. Porcine Pepsin (EC 3.4.23.1) activity is based on bovine blood haemoglobin as a substrate: one unit will produce a ΔA280 of 0.001 per minute at pH 2.0 and 37 °C, measured as TCA-soluble products. Porcine trypsin (EC 3.4.21.4) activity is based on p-toluene-sulfonyl-L-arginine methyl ester (TAME): one unit hydrolyses 1 μmol of TAME per minute at 25 °C, pH 8.1. Bovine chymotrypsin (EC 3.4.21.1) activity is based on N-benzoyl-L-tyrosine ethyl ester (BTEE): one unit hydrolyses 1.0 μmol of BTEE per minute at pH 7.8 at 25 °C. Porcine pancreatic lipase (EC 3.1.1.3) activity is based on tributyrin as a substrate: one unit liberates 1 μmol butyric acid per minute at 37 °C and at pH 8.0. Bile salt concentrations are measured using a commercial kit (e.g. bile acid kit, ref. 1 2212 99 90 313, DiaSys Diagnostic System GmbH, Germany or similar).Simulated digestion fluids
Simulated Salivary Fluid (SSF), Simulated Gastric Fluid (SGF) and Simulated Intestinal Fluid (SIF) are made up of the corresponding electrolyte stock solutions (Tables 1 and 2), enzymes, CaCl2 and water. The electrolyte stock solutions are 1.25× concentrated i.e. 4 parts of electrolyte stock solution + 1 part water give the correct ionic composition in the simulated digestion fluids. For example 3.8 mL SGF electrolyte stock solution + 0.2 mL pepsin (made up in SGF electrolyte stock solution) + 25 μL 0.3 M CaCl2 + 975 μL water = 5 mL SGF. Enzyme activities are in units per mL of final digestion mixture rather than secretion activity, unless stated otherwise.| Constituent | SSF | SGF | SIF | |||
|---|---|---|---|---|---|---|
| mmol L−1 | Ref. | mmol L−1 | Ref. | mmol L−1 | Ref. | |
| K+ | 18.8 | 26, 27 | 7.8 | 27, 28 | 7.6 | 27, 28 |
| Na+ | 13.6 | 27 | 72.2 | 27–29 | 123.4 | 27, 28 |
| Cl− | 19.5 | 26, 27 | 70.2 | 27, 28 | 55.5 | 27 |
| H2PO4− | 3.7 | 30 | 0.9 | 27 | 0.8 | 27 |
| HCO3−, CO32− | 13.7 | 27 | 25.5 | 27 | 85 | 27 |
| Mg2+ | 0.15 | 26, 27 | 0.1 | 27 | 0.33 | 27 |
| NH4+ | 0.12 | 27 | 1.0 | 27 | — | |
| Ca2+ | 1.5 | 26, 27 | 0.15 | 27, 28 | 0.6 | 27, 28 |
| Constituent | Stock conc. | SSF | SGF | SIF | ||||
|---|---|---|---|---|---|---|---|---|
| pH 7 | pH 3 | pH 7 | ||||||
| Vol. of stock | Conc. in SSF | Vol. of stock | Conc. in SGF | Vol. of stock | Conc. in SIF | |||
| a * in brackets is the corresponding Ca2+ concentration in the final digestion mixture. | ||||||||
| g L −1 | mol L −1 | mL | mmol L −1 | mL | mmol L −1 | mL | mmol L −1 | |
| KCl | 37.3 | 0.5 | 15.1 | 15.1 | 6.9 | 6.9 | 6.8 | 6.8 |
| KH2PO4 | 68 | 0.5 | 3.7 | 3.7 | 0.9 | 0.9 | 0.8 | 0.8 |
| NaHCO3 | 84 | 1 | 6.8 | 13.6 | 12.5 | 25 | 42.5 | 85 |
| NaCl | 117 | 2 | — | — | 11.8 | 47.2 | 9.6 | 38.4 |
| MgCl2(H2O)6 | 30.5 | 0.15 | 0.5 | 0.15 | 0.4 | 0.1 | 1.1 | 0.33 |
| (NH4)2CO3 | 48 | 0.5 | 0.06 | 0.06 | 0.5 | 0.5 | — | — |
| For pH adjustment | ||||||||
| mol L −1 | mL | mmol L −1 | mL | mmol L −1 | mL | mmol L −1 | ||
| NaOH | 1 | — | — | — | — | — | — | |
| HCl | 6 | 0.09 | 1.1 | 1.3 | 15.6 | 0.7 | 8.4 | |
| CaCl 2 (H 2 O) 2 is not added to the simulated digestion fluids, see details in legend | ||||||||
| g L −1 | mol L −1 | mmol L −1 | mmol L −1 | mmol L −1 | ||||
| CaCl2(H2O)2 | 44.1 | 0.3 | 1.5 (0.75*) | 0.15 (0.075*) | 0.6 (0.3*) | |||
Oral phase
Mastication of solid food is simulated by mincing an appropriate amount of food using a commercially available manual or electric mincer, such as the Eddingtons Mincer Pro (Product Code 86002, Berkshire, UK) or similar, commonly used in kitchens to mince meat. SSF electrolyte stock solution is added to create a thin paste-like consistency, similar to that of tomato paste or mustard. If necessary, the electrolyte stock solution can also be added during mincing. A final ratio of food to SSF of 50![[thin space (1/6-em)]](https://www.rsc.org/images/entities/char_2009.gif) :50 (w/v) is targeted. For liquid food an oral phase can be included, especially if the meal contains starch. In this case a final ratio of 50:50 (v/v) is targeted. Human salivary α-amylase (EC 3.2.1.1) is added to achieve 75 U mL−1 in the final mixture, followed by CaCl2 to achieve 0.75 mM in the final mixture and the necessary amount of water to dilute the stock solution of SSF. The recommended time of contact with the enzyme is 2 minutes at 37 °C, which requires pre-warming of all reagents to 37 °C.
:50 (w/v) is targeted. For liquid food an oral phase can be included, especially if the meal contains starch. In this case a final ratio of 50:50 (v/v) is targeted. Human salivary α-amylase (EC 3.2.1.1) is added to achieve 75 U mL−1 in the final mixture, followed by CaCl2 to achieve 0.75 mM in the final mixture and the necessary amount of water to dilute the stock solution of SSF. The recommended time of contact with the enzyme is 2 minutes at 37 °C, which requires pre-warming of all reagents to 37 °C.
In a typical example: 5 g of solid or 5 mL of liquid food is mixed with 3.5 mL of SSF electrolyte stock solution and minced together. 0.5 mL salivary α-amylase solution of 1500 U mL−1 made up in SSF electrolyte stock solution (α-amylase from human saliva Type IX-A, 1000–3000 U mg−1 protein, Sigma) is added followed by 25 μL of 0.3 M CaCl2 and 975 μL of water and thoroughly mixed.
Gastric phase
Liquid food can be exposed to the oral phase (optional) or directly to gastric phase, as further discussed in the main section of the manuscript. Five parts of liquid food or oral bolus, is mixed with 4 parts of SGF stock electrolyte solution to obtain a final ratio of food to SGF of 50:50 (v/v) after addition of other recipients and water. Porcine pepsin (EC 3.4.23.1) is added to achieve 2000 U mL−1 in the final digestion mixture, followed by CaCl2 to achieve 0.075 mM in the final digestion mixture. 1 M HCl is added to reduce the pH to 3.0; it is recommended to determine the amount of required acid in a test experiment prior to digestion, hence acid can be added more rapidly and followed by verification of the pH. Finally, the necessary amount of water is added to the mixture to dilute the stock solution of SGF. The use of gastric lipase is not recommended at this time because it is not commercially available (further discussed in the main text). The recommended time of digestion is 2 hours at 37 °C. The pH may have to be re-adjusted with 1 M HCl during digestion. Sufficient mixing during digestion is recommended, for example by placing the reaction vessel into a shaking incubator, water bath with integrated shaker or a rotator in a 37 °C room.
In a typical example: 10 mL of liquid sample or oral bolus is mixed with 7.5 mL of SGF electrolyte stock solution, 1.6 mL porcine pepsin stock solution of 25000 U mL−1 made up in SGF electrolyte stock solution (pepsin from porcine gastric mucosa 3200–4500 U mg−1 protein, Sigma), 5 μL of 0.3 M CaCl2, 0.2 mL of 1 M HCl to reach pH 3.0 and 0.695 μL of water.
Non-standard gastric condition
In the absence of phospholipids or other low molecular weight surfactants in the tested food, it is recommended to include phospholipids (0.17 mM in the final digestion mixture) in the gastric step. In this case freshly prepared SGF containing phospholipids is used instead of SGF. All other steps are as outlined above. For non-standard gastric condition using phospholipids, the following procedure is recommended. Prepare a stock solution of 50 mg mL−1 egg lecithin (Lipid Products, Redhill UK, 500 mg egg lecithin, approx. 63.5 mM, assuming mean Mw: 787 g mol−1) by adding 1 vial containing 500 μL egg lecithin into a 10 mL volumetric flask wrapped in aluminium foil and filling with chloroform–methanol (1:1) solution up to the 10 mL mark; mix until dissolved. This can be stored for a several days at −20 °C until required. Gastric liposomes (phospholipids) are prepared the day of usage: a 1 mL aliquot of the 50 mg mL−1 phospholipid stock solution is dried using a rotary evaporator until solvent is removed or dry remaining solvent under inert gas if no rotary evaporator is available, leaving 50 mg of dry phospholipids. Add 5 mL warm SGF to reach final concentration of 10 mg mL−1 phospholipids in SGF. Incubate at 37 °C, shaking at 170 rpm, for 10 min. Sonicate the solution in an ice bath until clear to the eye. Filter the sample through a 0.22 μm nylon syringe filter (Thermo Scientific™ Nalgene Syringe Filters or similar products) to remove any debris deposited by sonicator. The solution should be stored at 4 °C and used the same day.
Intestinal phase
Five parts of gastric chyme is mixed with 4 parts of SIF electrolyte stock solution to obtain a final ratio of gastric chyme to SIF of 50:50 (v/v) after additions of other recipients and water. The gastric samples–chyme is mixed with SIF electrolyte stock electrolyte solution. Addition of base (1 M NaOH) will be required to neutralise the mixture to pH 7.0. Digestive enzymes can be added as either pancreatin from porcine pancreas or individual enzymes. In the case of pancreatin, proteolytic, lipolytic and amylolytic activity of the extract should be determined using the assays outlined in Enzyme assays section. The amount of pancreatin added is based on the trypsin activity (100 U mL−1 in the final mixture). If the food contains high amounts of fat or the fat digestion is at the centre of the study, pancreatin concentration should be either based on the lipase activity or additional porcine pancreatic lipase and colipase should be added to achieve 2000 U mL−1 lipase activity in the final mixture. This is further discussed in the main section of the paper. Alternatively, individual enzymes can be added to the digestion mixture to achieve the following activities in the final mixture: porcine trypsin (EC 3.4.21.4) (100 U mL−1), bovine chymotrypsin (EC 3.4.21.1) (25 U mL−1), porcine pancreatic α-amylase (EC 3.2.1.1) (200 U mL−1), porcine pancreatic lipase (EC 3.1.1.3) (2000 U mL−1) and porcine pancreatic colipase (2:1 colipase to lipase molar excess, equivalent to a mass ratio of roughly 1:2 co-lipase to lipase as the mass of human pancreatic lipase is 51.2 kDa and the mass of human co-lipase is 10 kDa). Bile salts are added to give a final concentration of 10 mM in the final mixture. There are two options for bile; in both cases the concentration of bile salts needs to be determined, (see assay in Enzyme assays section): bile extract such as B8631 (porcine) or B3883 (bovine) from Sigma-Aldrich or fresh (frozen) porcine bile. CaCl2 is added to reach 0.3 mM in the final digestion mixture. It is recommended to assay the Ca2+ content in pancreatin, if used, and take this into account when adding Ca2+ to the digestive mixture. The pH may need re-adjustment before finally adding water to the mixture to dilute the stock solution of SIF. The recommended time of intestinal digestion is 2 hours at 37 °C. The pH may need re-adjustment during digestion. This can be achieved either manually or by automated laboratory titrator.
In a typical example, 20 mL of gastric chyme is mixed with 11 mL of SIF electrolyte stock solution, 5.0 mL of a pancreatin solution 800 U mL−1 made up in SIF electrolyte stock solution based on trypsin activity (pancreatin from porcine pancreas, Sigma), 2.5 mL fresh bile (160 mM in fresh bile), 40 μL of 0.3 M CaCl2, 0.15 mL of 1 M NaOH to reach pH 7.0 and 1.31 mL of water. It is recommended to verify the pH and determine the amount of NaOH–HCl required in a test experiment prior digestion, hence base–acid can be added more rapidly and followed by verification of the pH.
Sampling during digestion
Sample conservation depends on the study focus (food structure, bioaccessibility, enzymatic digestion product etc.), and should be carefully considered for each study. It may be advisable to have individual sample tubes for each time point rather than withdrawing samples from the reaction vessel. Here are some recommendations to inhibit or slow down further enzymatic action on the food sample:(i) Snap freezing of samples is recommended in liquid nitrogen immediately after the reaction for further analysis. (ii) If samples are sent to other labs, i.e. by courier or by post, the digestion has to be stopped completely; the following procedures are recommended: (a) neutralization of pH in the gastric phase by adding 0.5 M sodium bicarbonate before snap-freezing in liquid nitrogen and subsequent freeze drying of the samples or (b) addition of protease inhibitor (e.g. 1 mM 4-(2-aminoethyl) benzenesulfonyl fluoride hydrochloride [AEBSF], Roche or similar), snap freezing in liquid nitrogen and subsequent freeze drying of samples.
In vitro digestion parameters – recommendation and justification
Oral phase
Gastric phase
The primary purpose of the stomach is to deliver digesta to the duodenum in a regulated manner to optimize intestinal digestion. In the lower part of the stomach (antrum), the meal is mixed and digested with secreted enzymes and hydrochloric acid, ground by antral movements, and gradually emptied into the duodenum. The significance of physiological and simulated gastric parameters will be discussed.Small intestine
Once the food has been through the simulated gastric phase of digestion it is transferred to a simulation of the digestion that occurs in the small intestine. It is reasonable to assume that this part of the simulation should be well mixed. Once again we suggest that the gastric contents should be diluted 50:50 v/v with simulated intestinal fluid (SIF) as given in Table 2. There are many variables that have an impact on transit time through the small intestine but we suggest the time of simulated intestinal digestion should be 2 hours.6,7,80 After emptying from the gastric compartment chyme is normally neutralised by the secretion of carbonate. Consequently the duodenal pH is around pH 6.5 depending on such factors as meal type and gastric emptying rate. The pH then increases slightly over its length to a value of around 7.5 in the distal ileum. Thus, in order to mimic the pH in the entire passage through the small intestinal phase in static conditions, we recommend using an average value of 7.06,7,62 through the addition of SIF and sodium hydroxide.
The most important components of the simulated small intestinal digestion are the pancreatic enzymes and the bile. In both cases we suggest that there are essentially two options offering differences in specificity, ease of use and cost of each experiment. For the enzymes we recommend either individual enzymes or porcine pancreatin and for bile we recommend the use of either bile extract or frozen porcine bile. There are some guiding principles that should be considered when deciding what approach to use. In the case of the bile, if the proposed experiment involves accurately following lipid hydrolysis in detail then frozen porcine bile should be used, otherwise the bile extract should suffice. The same argument could be used for the use of individual enzymes in that for a detailed analysis of lipid hydrolysis individual enzymes should be used or indeed if the system contains only protein, lipid or starch then the use of only proteases, lipases or amylase respectively may be appropriate. However, the cost and availability of enzymes should also be considered. In both cases the selection of the amount to use in a static model is difficult to assess as physiological measurements refer more to secretion rates rather than specific amounts.
:1 trypsin to chymotrypsin and this corresponds to a 4:1 activity ratio. This is based on the activity of trypsin being 135 TAME U mg−1 and the activity of chymotrypsin being 64 BTEE U mg−1. The main carbohydrate hydrolysing agent is pancreatic amylase that should be added at 200 U mL−1 final concentration85 where one unit will liberate 1.0 mg of maltose from corn starch in 3 min at pH 6.9 at 20 °C.86 The most difficult enzymes to accurately quantify in terms of activity are the lipases. We recommend using porcine pancreatic lipase at 2000 U mL−1 (ref. 87) where 1 unit will release 1 μmol of free fatty acid per minute from a substrate of tributyrin at 37 °C, pH 8.0, in the presence of 2 mM calcium ions and 4 mM sodium taurodeoxycholate and excess colipase. This amount is based on the mean detection of 0.25 mg mL−1 pancreatic lipase in duodenal aspirates and the activity of the pure enzyme being 8000 U mg−1. The assay should be conducted according to the recommendations of Carrière and co-workers,88,89 also available at the CNRS website (http://eipl.cnrs-mrs.fr/assay.php?module=voir%26id=1). In the presence of bile, the rate of lipolysis is significantly improved by the presence of co-lipase, which facilitates the binding of the lipase to the substrate. The co-lipase binds to the lipase in order to enable the lipase to adsorb to the oil–water interface. Thus, it is important to ensure that the co-lipase is added in a 2:1 molar excess with the lipase. This is equivalent to a mass ratio of roughly 1:2 co-lipase–lipase as the mass of the similar human pancreatic lipase is 51.2 kDa and the mass of human co-lipase is 10 kDa. Commercially available pancreatin usually contains enough colipase for maximum lipase activity, which can be verified, if necessary, by adding additional colipase in the course of the lipase assay and record changes in lipase activity.
Suitability of static digestion models
In vitro digestion studies are widely used with the aim of predicting the behaviour of food components in the digestive tract. Most of these studies are performed in static models where gastric and small intestinal digestion is mimicked in two consecutive steps. During each step, the substrate is incubated for a specific time with simulated gastric and small intestinal digestive fluids, respectively. The pH is generally maintained at a fixed value by using a pH-stat or a buffer. This approach allows methods that are relatively simple to perform and permit high throughput testing. However, the simplicity of static models narrows the range of applicability, which drives the need for adapting a previously described method for a specific research question. This, and the lack of consensus on relevant physiological conditions, has led to a proliferation of different methods. In our consortium we aim to harmonize in vitro systems that simulate digestive processes by defining key parameters and conditions that need to be included to study a specific food or substrate and to measure a specific endpoint. As a starting point, we present in this paper a protocol with a set of standard conditions to be used in a simple static model. These standard conditions are based on relevant in vivo data and supported by rationale and source of data. This discussion focuses on the use and limitation of such a simple static model in relation to mimicking in vivo conditions.Static models in relation to in vivo conditions
Static models use a relatively dilute digestive mixture that is well homogenised using a stirrer, shaker or impeller. Although this does not reflect the mixing of gastric content in vivo, it exposes all substrates to the set point pH and related enzyme activities, and allows representative samples to be taken.
The complete meal with simulated gastric digestive fluid is exposed to a fixed pH during a fixed period. Generally the gastric pH is maintained around 2, which may be the right value for the fasting state but does not reflect the pH after intake of a meal. Whether or not a static gastric digestion is adequate depends on the effect of each physiological parameter on the digestion and intended endpoint. In some cases a gastric step could even be omitted since the gastric digestion is completely overruled by the small intestinal digestion. On the other hand, the omission of gastric lipase during the gastric step, as chosen here, might not be fully adequate for mimicking the complete process of gastrointestinal lipolysis as for example preliminary digestion of dietary triglycerides by gastric lipase is known to further trigger pancreatic lipase activity on lecithin-stabilized emulsions in vitro.98 In other cases incubation at pH 2 during 1 hour might lead to a complete peptic digestion, while this is not the case during a much milder exposure in vivo.
Use and validation of static models
As with all models, digestive models are a simplification of reality and should be as simple as possible. However, as Albert Einstein stated, “we should make things as simple as possible, but not simpler”. This also applies to designing model systems to study the behaviour of compounds in the gastro-intestinal tract. A digestion model should include all relevant parameters to predict the endpoint intended. The more relevant the parameters included are, the wider the applicability but also the higher the complexity.An accurate prediction of the in vivo bio-accessibility (availability for absorption through the gut wall) is limited since static models lack the simulation of realistic enzyme substrate ratios, pH profiles, transit times and removal of digested products, in time and place. Ranking of the digestion of different products is more feasible, provided that the set conditions are adequate for the variation in characteristics of the products. Static models might also be appropriate for mechanistic studies, where the digestion of a substrate under specific conditions is aimed for. The matrix composition of the different products should not differ too much and should be limited in complexity. In other words, static models are useful to study the digestion of single substrates or simple meals under specific conditions.
In addition to the limitations caused by the applied conditions, the assessment of digestion is strongly affected by the analysis of the digested fraction. The fraction of product released should be adequately separated from the undigested fraction. A centrifugation step will only separate insoluble undigested material with sufficient density. Undigested compounds might also be colloidal dispersions. Therefore, ultra-filtration or dialysis may be the better choice. Analysing free glucose, amino acids or fatty acids to determine the digestibility of macro-nutrients is not appropriate, since the pancreatic digestion is not complete. Therefore an additional step with brush border enzymes such as amylo-glucosidase or peptidase is required to complete starch and protein digestion, respectively. Analysis of lipid digestion in a static model is generally performed in a pH stat where the produced fatty acids are assumed to be equivalent to the amount of neutralizing alkali. Product inhibition can be overcome by continuous addition of Ca2+ ions to precipitate free fatty acids as calcium soaps.99
In contrast to the more holistic dynamic models that should be validated for their ability to reproduce the conditions in the gut, a static model should be validated against their intended use. In this paper we have described a protocol with conditions and composition of digestive fluids that have a broad consensus in terms of physiological relevance. This protocol will be tested and validated by different research groups for a variety of applications to determine its use and limitations. This process will lead to the establishment of key parameters and settings for specific applications and endpoints. This allows model systems to be adapted and validated for specific applications and endpoints by choosing the physiological relevant parameters that have consensus in a big scientific community. This might lead to also using more complex systems but we should “make things as simple as possible, but not simpler”.
Acknowledgements
COST action FA1005 Infogest22 (http://www.cost-infogest.eu/) is acknowledged for providing funding for travel, meetings and conferences. The many other researchers, mostly associated to the above COST action, which have contributed to the discussion on digestion parameters are also acknowledged.References
- M. Minekus, PhD thesis, University of Utrecht, The Netherlands, 1998.
- M. Wickham, R. Faulks and C. Mills, Mol. Nutr. Food Res., 2009, 53, 952–958 CAS.
- O. Ménard, T. Cattenoz, H. Guillemin, I. Souchon, A. Deglaire, D. Dupont and D. Picque, Food Chem., 2014, 145, 1039–1045 CrossRef PubMed.
- S. J. Hur, B. O. Lim, E. A. Decker and D. J. McClements, Food Chem., 2011, 125, 1–12 CrossRef CAS PubMed.
- A. M. Kaukonen, B. J. Boyd, W. N. Charman and C. J. Porter, Pharm. Res., 2004, 21, 254–260 CrossRef CAS.
- C. H. Versantvoort, A. G. Oomen, E. Van de Kamp, C. J. Rompelberg and A. J. Sips, Food Chem. Toxicol., 2005, 43, 31–40 CrossRef CAS PubMed.
- K. A. Kopf-Bolanz, F. Schwander, M. Gijs, G. Vergères, R. Portmann and L. Egger, J. Nutr., 2012, 142, 245–250 CrossRef CAS PubMed.
- J. Maldonado-Valderrama, A. P. Gunning, P. J. Wilde and V. J. Morris, Soft Matter, 2010, 6, 4908–4915 RSC.
- J. Hasjim, G. C. Lavau, M. J. Gidley and R. G. Gilbert, Biomacromolecules, 2010, 11, 3600–3608 CrossRef CAS PubMed.
- K. Larsson, L. Cavonius, M. Alminger and I. Undeland, J. Agric. Food Chem., 2012, 60, 7556–7564 CrossRef CAS PubMed.
- B. Lorrain, O. Dangles, M. Loonis, M. Armand and C. Dufour, J. Agric. Food Chem., 2012, 60, 9074–9081 CrossRef CAS PubMed.
- D. D. Miller, B. R. Schricker, R. R. Rasmussen and D. Van Campen, Am. J. Clin. Nutr., 1981, 34, 2248–2256 CAS.
- E. Biehler and T. Bohn, Curr. Nutr. Food Sci., 2010, 6, 44–69 CrossRef CAS.
- L. Tavares, I. Figueira, G. J. McDougall, H. L. Vieira, D. Stewart, P. M. Alves, R. B. Ferreira and C. N. Santos, Eur. J. Nutr., 2013, 52, 225–236 CrossRef CAS PubMed.
- J. Bouayed, L. Hoffmann and T. Bohn, Food Chem., 2011, 128, 14–21 CrossRef CAS PubMed.
- C. Vors, P. Capolino, C. Guerin, E. Meugnier, S. Pesenti, M.-A. Chauvin, J. Monteil, N. Peretti, M. Cansell, F. Carriere and M.-C. Michalski, Food Funct., 2012, 3, 537–546 CAS.
- H. D. Williams, M. U. Anby, P. Sassene, K. Kleberg, J.-C. Bakala-N'Goma, M. Calderone, V. Jannin, A. Igonin, A. Partheil, D. Marchaud, E. Jule, J. Vertommen, M. Maio, R. Blundell, H. Benameur, F. Carrière, A. Müllertz, C. W. Pouton and C. J. H. Porter, Mol. Pharm., 2012, 9, 3286–3300 CrossRef CAS PubMed.
- H. D. Williams, P. Sassene, K. Kleberg, J.-C. Bakala-N'Goma, M. Calderone, V. Jannin, A. Igonin, A. Partheil, D. Marchaud, E. Jule, J. Vertommen, M. Maio, R. Blundell, H. Benameur, F. Carrière, A. Müllertz, C. J. H. Porter and C. W. Pouton, J. Pharm. Sci., 2012, 101, 3360–3380 CrossRef CAS PubMed.
- D. J. McClements and Y. Li, Food Funct., 2010, 1, 32–59 CAS.
- E. Biehler, L. Hoffmann, E. Krause and T. Bohn, J. Nutr., 2011, 141, 1769–1776 CrossRef CAS PubMed.
- E. Reboul, M. Richelle, E. Perrot, C. Desmoulins-Malezet, V. Pirisi and P. Borel, J. Agric. Food Chem., 2006, 54, 8749–8755 CrossRef CAS PubMed.
- D. Dupont, A. Bordoni, A. Brodkorb, F. Capozzi, T. Cirkovic Velickovic, M. Corredig, P. Cotter, I. De Noni, C. Gaudichon, M. Golding, T. Lea, I. Le Huërou-Luron, A. Mackie, C. Madsen, B. De Meulenaer, Y. Nys, A. Pihlanto, I. Recio, D. Rémond, T. Requena, I. Souchon, D. Swiatecka, S. Turgeon, G. Vegarud, R. Vreeburg, W. Weitschies and M. Wickham, Food Dig., 2011, 2, 23–25 CrossRef PubMed.
- S. Lindquist and O. Hernell, Curr. Opin. Clin. Nutr. Metab. Care, 2010, 13, 314–320 CrossRef CAS PubMed.
- M. Grassi, L. Petraccia, G. Mennuni, M. Fontana, A. Scarno, S. Sabetta and A. Fraioli, Nutr. Hosp., 2011, 26, 659–668 CAS.
- C. Bourlieu, O. Ménard, K. Bouzerzour, G. Mandalari, A. Macierzanka, A. R. Mackie and D. Dupont, Crit. Rev. Food Sci. Nutr., 2013, 1427–1457 Search PubMed.
- M. Jakob, Normalwerte pocket, Börm Bruckmeier Verlag, 2008 Search PubMed.
- C. Lentner, Geigy Scientific tables. Vol. 1, Units of measurement, body fluids, composition of the body, nutrition, Ciba-Geigy Basel, Switzerland, 1981 Search PubMed.
- A. Lindahl, A.-L. Ungell, L. Knutson and H. Lennernäs, Pharm. Res., 1997, 14, 497–502 CrossRef CAS.
- M. J. Riddell, J. A. Strong and D. Cameron, Exp. Physiol., 1960, 45, 1–11 CAS.
- P. Anderson, M. Hector and M. Rampersad, Int. J. Paediatr. Dent., 2001, 11, 266–273 CrossRef CAS.
- F. Fontijn-Tekamp, A. Slagter, A. Van Der Bilt, M. V. T. Hof, D. Witter, W. Kalk and J. Jansen, J. Dent. Res., 2000, 79, 1519–1524 CrossRef CAS PubMed.
- L. Engelen, A. Fontijn-Tekamp and A. v. d. Bilt, Arch. Oral Biol., 2005, 50, 739–746 CrossRef PubMed.
- P. Lucas, R. Ow, G. Ritchie, C. Chew and S. Keng, J. Dent. Res., 1986, 65, 400–404 CrossRef CAS PubMed.
- E. Helkimo, G. E. Carlsson and M. Helkimo, Acta Odontol. Scand., 1978, 36, 33–41 CrossRef CAS.
- K. R. Agrawal, P. W. Lucas, J. F. Prinz and I. C. Bruce, Arch. Oral Biol., 1997, 42, 1–9 CrossRef CAS.
- M.-A. Peyron, A. Mishellany and A. Woda, J. Dent. Res., 2004, 83, 578–582 CrossRef PubMed.
- M.-L. Jalabert-Malbos, A. Mishellany-Dutour, A. Woda and M.-A. Peyron, Food Quality and Preference, 2007, 18, 803–812 CrossRef PubMed.
- S. P. Humphrey and R. T. Williamson, J. Prosthet. Dent., 2001, 85, 162–169 CrossRef CAS PubMed.
- P. D. V. de Almeida, A. Gregio, M. Machado, A. De Lima and L. R. Azevedo, J. Contemp. Dent. Pract., 2008, 9, 72–80 Search PubMed.
- M. B. D. Gaviao, L. Engelen and A. Van Der Bilt, Eur. J. Oral Sci., 2004, 112, 19–24 CrossRef.
- L. Engelen, R. A. de Wijk, J. F. Prinz, A. van der Bilt and F. Bosman, Physiol. Behav., 2003, 78, 165–169 CrossRef CAS.
- A. Pedersen, A. Bardow, S. B. Jensen and B. Nauntofte, Oral Dis., 2002, 8, 117–129 CrossRef CAS.
- L. A. Tabak, Crit. Rev. Oral Biol. Med., 1990, 1, 229–234 CAS.
- A. Sarkar, K. K. Goh and H. Singh, Food Hydrocolloids, 2009, 23, 1270–1278 CrossRef CAS PubMed.
- G. A. van Aken, M. H. Vingerhoeds and E. H. de Hoog, Curr. Opin. Colloid Interface Sci., 2007, 12, 251–262 CrossRef CAS PubMed.
- C. Hoebler, A. Karinthi, M. Devaux, F. Guillon, D. Gallant, B. Bouchet, C. Melegari and J. Barry, Br. J. Nutr., 1998, 80, 429–436 CrossRef CAS PubMed.
- G. M. Bornhorst, H. Hivert and R. P. Singh, LWT–Food Sci. Technol., 2014, 55, 27–33 CrossRef CAS PubMed.
- A. Okada, M. Honma, S. Nomura and Y. Yamada, Physiol. Behav., 2007, 90, 172–179 CrossRef CAS PubMed.
- H. N. Nguyen, J. Silny, D. Albers, E. Roeb, C. Gartung, G. Rau and S. Matern, Am. J. Physiol.: Gastrointest. Liver Physiol., 1997, 273, G958–G964 CAS.
- J. D. Gardner, A. A. Ciociola and M. Robinson, J. Appl. Physiol., 2002, 92, 427–434 CAS.
- J. B. Dressman, R. R. Berardi, L. C. Dermentzoglou, T. L. Russell, S. P. Schmaltz, J. L. Barnett and K. M. Jarvenpaa, Pharm. Res., 1990, 7, 756–761 CrossRef CAS.
- V. Tyssandier, E. Reboul, J.-F. Dumas, C. Bouteloup-Demange, M. Armand, J. Marcand, M. Sallas and P. Borel, Am. J. Physiol.: Gastrointest. Liver Physiol., 2003, 284, G913–G923 CAS.
- D. D. Burton, H. J. Kim, M. Camilleri, D. A. Stephens, B. P. Mullan, M. K. O'Connor and N. J. Talley, Am. J. Physiol.: Gastrointest. Liver Physiol., 2005, 289, G261–G266 CrossRef CAS PubMed.
- J. R. Malagelada, G. F. Longstreth, W. H. Summerskill and V. L. Go, Gastroenterology, 1976, 70, 203–210 CAS.
- J. R. Malagelada, V. L. W. Go and W. H. J. Summerskill, Dig. Dis. Sci., 1979, 24, 101–110 CrossRef CAS.
- H. C. Lin, C. Prather, R. S. Fisher, J. H. Meyer, R. W. Summers, M. Pimentel, R. W. Mccallum and V. Loening-Baucke, Dig. Dis. Sci., 2005, 50, 989–1004 CrossRef PubMed.
- O. Goetze, A. Steingoetter, D. Menne, I. R. van der Voort, M. A. Kwiatek, P. Boesiger, D. Weishaupt, M. Thumshirn, M. Fried and W. Schwizer, Am. J. Physiol.: Gastrointest. Liver Physiol., 2007, 292, G11–G17 CrossRef CAS PubMed.
- L. Marciani, P. A. Gowland, R. C. Spiller, P. Manoj, R. J. Moore, P. Young and A. J. Fillery-Travis, Am. J. Physiol.: Gastrointest. Liver Physiol., 2001, 280, G1227–G1233 CAS.
- F. Carrière, C. Renou, E. Ville, P. Grandval and R. Laugier, Digestion, 2001, 64, 46–53 Search PubMed.
- J.-R. Malagelada, V. W. Go and W. H. J. Summerskill, Dig. Dis. Sci., 1979, 24, 101–110 CrossRef CAS.
- O. Wisén and C. Johansson, Metabolism, 1992, 41, 390–395 CrossRef.
- L. Kalantzi, K. Goumas, V. Kalioras, B. Abrahamsson, J. B. Dressman and C. Reppas, Pharm. Res., 2006, 23, 165–176 CrossRef CAS PubMed.
- L. Y. Rios, R. N. Bennett, S. A. Lazarus, C. Rémésy, A. Scalbert and G. Williamson, Am. J. Clin. Nutr., 2002, 76, 1106–1110 CAS.
- F. Carrière, H. Moreau, V. Raphel, R. Laugier, C. Benicourt, J. L. Junien and R. Verger, Eur. J. Biochem., 1991, 202, 75–83 CrossRef.
- E. K. Ulleberg, I. Comi, H. Holm, E. B. Herud, M. Jacobsen and G. E. Vegarud, Food Dig., 2011, 2, 52–61 CrossRef CAS PubMed.
- M. Armand, M. Hamosh, J. S. DiPalma, J. Gallagher, S. B. Benjamin, J. R. Philpott, D. Lairon and P. Hamosh, Am. J. Clin. Nutr., 1995, 62, 74–80 CAS.
- J. DiPalma, C. L. Kirk, M. Hamosh, A. R. Colon, S. B. Benjamin and P. Hamosh, Gastroenterology, 1991, 101, 116–121 CAS.
- M. L. Anson and A. E. Mirsky, J. Gen. Physiol., 1932, 16, 59–63 CrossRef CAS.
- M. L. Anson, J. Gen. Physiol., 1938, 22, 79–89 CrossRef CAS.
- M. Fujinaga, M. M. Chernaia, S. C. Mosimann, M. N. James and N. I. Tarasova, Protein Sci., 1995, 4, 960–972 CrossRef CAS PubMed.
- M. Armand, Curr. Opin. Clin. Nutr. Metab. Care, 2007, 10, 156–164 CrossRef CAS PubMed.
- F. Carrière, P. Grandval, C. Renou, A. Palomba, F. Priéri, J. Giallo, F. Henniges, S. Sander-Struckmeier and R. Laugier, Clin. Gastroenterol. Hepatol., 2005, 3, 28–38 CrossRef.
- S. Blanquet-Diot, M. Soufi, M. Rambeau, E. Rock and M. Alric, J. Nutr., 2009, 139, 876–883 CrossRef CAS PubMed.
- G. A. van Aken, E. Bomhof, F. D. Zoet, M. Verbeek and A. Oosterveld, Food Hydrocolloids, 2011, 25, 781–788 CrossRef CAS PubMed.
- P. L. Zentler-Munro, B. A. Assoufi, K. Balasubramanian, S. Cornell, D. Benoliel, T. C. Northfield and M. E. Hodson, Pancreas, 1992, 7, 311–319 CrossRef CAS PubMed.
- M. Armand, P. Borel, B. Pasquier, C. Dubois, M. Senft, M. Andre, J. Peyrot, J. Salducci and D. Lairon, Am. J. Physiol.: Gastrointest. Liver Physiol., 1996, 271, G172–G183 CAS.
- J. Wenner, T. Gunnarsson, H. Graffner and G. Lindell, Dig. Dis. Sci., 2000, 45, 1648–1652 CrossRef CAS.
- G. Mandalari, A. M. Mackie, N. M. Rigby, M. S. J. Wickham and E. N. C. Mills, Mol. Nutr. Food Res., 2009, 53, S131–S139 Search PubMed.
- A. Macierzanka, A. I. Sancho, E. N. C. Mills, N. M. Rigby and A. R. Mackie, Soft Matter, 2009, 5, 538–550 RSC.
- E. L. McConnell, H. M. Fadda and A. W. Basit, Int. J. Pharm., 2008, 364, 213–226 CrossRef CAS PubMed.
- A. Vandermeers, M.-C. Vandermeers-Piret, J. Rathé and J. Christophe, Clin. Chem., 1972, 18, 1514–1517 CAS.
- K. A. Walsh and P. E. Wilcox, in Methods Enzymol., ed. L. L. Gertrude and E. Perlmann, Academic Press, 1970, vol. 19, pp. 31–41 Search PubMed.
- D. M. Goldberg and K. G. Wormsley, Gut, 1970, 11, 859–866 CrossRef CAS.
- H. U. Bergmeyer, K. Gawehn, D. H. Williamson and P. Lund, Methods of Enzymatic Analysis: Vol. 1, Academic Press, 1974 Search PubMed.
- J. Keller and P. Layer, Gut, 2005, 54, 1–28 CrossRef PubMed.
- P. Bernfeld, in Methods Enzymol., Academic Press, 1955, vol. 1, pp. 149–158 Search PubMed.
- F. Carrière, C. Renou, V. Lopez, J. De Caro, F. Ferrato, H. Lengsfeld, A. De Caro, R. Laugier and R. Verger, Gastroenterology, 2000, 119, 949–960 CrossRef PubMed.
- Y. Gargouri, L. Sarda, G. Pieroni, C. Riviere, P. Lowe, F. Ferrato and R. Verger, in Enzymes of lipid metabolism II, Springer, 1986, pp. 19–22 Search PubMed.
- F. Carrière, J. Barrowman, R. Verger and R. Laugier, Gastroenterology, 1993, 105, 876–888 Search PubMed.
- P. Capolino, C. Guérin, J. Paume, J. Giallo, J.-M. Ballester, J.-F. Cavalier and F. Carrière, Food Dig., 2011, 2, 43–51 CrossRef CAS PubMed.
- B. J. Collins, P. Watt, T. O'Reilly, R. J. McFarland and A. H. Love, J. Clin. Pathol., 1984, 37, 313–316 CrossRef CAS.
- K. Schulze, Neurogastroenterol. Motil., 2006, 18, 172–183 CrossRef CAS PubMed.
- L. Marciani, M. S. J. Wickham, D. Bush, R. Faulks, J. Wright, A. J. Fillery-Travis, R. C. Spiller and P. A. Gowland, Br. J. Nutr., 2006, 95, 331–339 CrossRef CAS.
- W. Schwizer, A. Steingoetter and M. Fox, Scand. J. Gastroenterol., 2006, 41, 1245–1260 CrossRef PubMed.
- J. A. Calbet and D. A. MacLean, J. Physiol., 1997, 498, 553–559 CAS.
- D. W. Piper and B. H. Fenton, Gut, 1965, 6, 506–508 CrossRef CAS.
- M. Hamosh, H. L. Klaeveman, R. O. Wolf and R. O. Scow, J. Clin. Invest., 1975, 55, 908 CrossRef CAS PubMed.
- Y. Gargouri, G. Pieroni, C. Rivière, P. A. Lowe, J.-F. Saunière, L. Sarda and R. Verger, Biochim. Biophys. Acta, Lipids Lipid Metab, 1986, 879, 419–423 CrossRef CAS.
- N. H. Zangenberg, A. Müllertz, H. Gjelstrup Kristensen and L. Hovgaard, Eur. J. Pharm. Sci., 2001, 14, 237–244 CrossRef CAS.
Footnotes |
| † Electronic supplementary information (ESI) available. See DOI: 10.1039/c3fo60702j |
| ‡ These authors contributed to the definition of digestion parameters and the writing/editing of the manuscript. |
| § These authors contributed to the definition of digestion parameters and the revision of the manuscript. |
| ¶ These authors contributed to the manuscript by critical revision of digestion parameters and manuscript. |
| This journal is © The Royal Society of Chemistry 2014 |