 Open Access Article
 This Open Access Article is licensed under a
 Creative Commons Attribution 3.0 Unported Licence
Xylooligosaccharide increases bifidobacteria but not lactobacilli in human gut microbiota
Sydney M.
Finegold
*abcd,
Zhaoping
Li
bde,
Paula H.
Summanen
b,
Julia
Downes
b,
Gail
Thames
de,
Karen
Corbett
b,
Scot
Dowd
f,
Michael
Krak
de and
David
Heber
de
aInfectious Diseases Section, VA Medical Center West Los Angeles, 11301 Wilshire Blvd., Los Angeles, CA 90073, USA. E-mail: sidfinegold@gmail.com; Fax: +1 310 268 3594; Tel: +1 310 268 3678
bResearch Service, VA Medical Center West Los Angeles, 11301 Wilshire Blvd., Los Angeles, CA 90073, USA
cDepartment of Microbiology, Immunology and Molecular Genetics, UCLA School of Medicine, 405 Hilgard Ave., Los Angeles, CA 90095, USA
dDepartment of Medicine, UCLA School of Medicine, 405 Hilgard Ave., Los Angeles, CA 90095, USA
eUCLA Center for Human Nutrition, UCLA School of Medicine, 405 Hilgard Ave., Los Angeles, CA 90095, USA
fMR DNA Molecular Research LP, 503 Clovis Road, Shallowater, Texas 79363, USA
First published on 29th January 2014
Abstract
This study was conducted to determine the tolerance and effects of the prebiotic xylooligosaccharide (XOS) on the composition of human colonic microbiota, pH and short chain fatty acids (SCFA) in order to determine whether significant changes in the microbiota would be achievable without side effects. Healthy adult subjects (n = 32) were recruited in a double-blind, randomized, placebo-controlled study. Subjects received 1.4 g XOS, 2.8 g XOS or placebo in daily doses. The study consisted of a 2 week run-in, an 8 week intervention, and a 2 week washout phase. Stool samples were collected at baseline, after 4 and 8 weeks of intervention and 2 weeks after cessation of intervention. Samples were subjected to culture, pyrosequencing of community DNA, pH and SCFA analyses. Tolerance was evaluated by daily symptom charts. XOS was tolerated without significant gastrointestinal side effects. Bifidobacterium counts increased in both XOS groups compared to the placebo subjects, the 2.8 g per day group showed significantly greater increases than the 1.4 g per day group. Total anaerobic counts and Bacteroides fragilis group counts were significantly higher in the 2.8 g per day XOS group. There were no significant differences in the counts of Lactobacillus, Enterobacteriaceae and Clostridium between the three groups. XOS intervention had no significant effect on stool pH, SCFA or lactic acid. Pyrosequencing showed no notable shifts in bacterial diversity. XOS supplementation may be beneficial to gastrointestinal microbiota and 2.8 g per day may be more effective than 1.4 g per day. The low dose required and lack of gastrointestinal side effects makes the use of XOS as a food supplement feasible.
Introduction
The gastrointestinal microbiota is important in human gastrointestinal and general health. Adding a prebiotic to the diet can increase beneficial gut bacteria, thus generating benefits to overall health. These benefits include improved digestion and gut function, potential protection from colon cancer,1 reduced symptoms of irritable bowel syndrome,2 immune regulation,3 and possible management of obesity.4 Prebiotics are not absorbed or digested by humans, but can have a significant effect on the human gut microbiota which digest them, favoring proliferation of some species over others. Studies of the gut microbiota have shown that the Firmicutes/Bacteroidetes (F/B) ratio differed in obese and lean human subjects, mainly due to a reduced Bacteroidetes proportion in obese subjects, suggesting that modulating the abundance of specific bacterial communities might be beneficial in the treatment of obesity.5,6 Similar changes in the F/B ratio have been demonstrated in mice with varying genetic susceptibility to weight gain on a high fat/high sucrose diet.7 Recent human studies have linked increased Lactobacillus counts8,9 and decreased Bifidobacterium counts to obesity.10–12Lactobacillus may promote obesity based on their impact on food conversion and weight gain, which has been demonstrated in farm animals.13When prebiotics were compared, Bifidobacterium spp. favored xylooligosaccharides (XOS), raffinose and fructooligosaccharides (FOS) over hexoses (such as glucose) in in vitro growth experiments.14 Rycroft et al. also evaluated the fermentative properties of some prebiotics in vitro and found that XOS and lactulose produced the highest increases in bifidobacteria, while FOS led to the promotion of the growth of lactobacilli.15 Human and animal studies demonstrate that XOS is a efficacious prebiotic that can change the microbiota at a level as low as 1.4 g per day in adults,16 which is much lower than levels required by FOS (≥10 g per day)17 or galactooligosaccharides (GOS, ≥10 g per day).18 At these lower doses, we reasoned that gastrointestinal side effects with XOS might be less common.
The xylooligosaccharides are oligomers of unconventional sugars, formed by xylose units, which are non-caloric and not digestible by humans. They are found in fruits, vegetables, milk and honey. The production of XOS for human consumption occurs through the industrial production of lignocellulosic materials (LCMs), obtained from a variety of forest residues (eucalyptus wood) or agro-industries (corn cob, almond, olive, rice hulls, oats, barley).19–21 The aim of the present study was to determine the effects of XOS on the composition of human colonic microbiota, pH, fecal short chain fatty acids (SCFA) and lactic acid, and to determine the tolerance of XOS by healthy adult subjects.
Materials and methods
Subjects
A double blind, randomized, placebo-controlled study design was carried out with 32 subjects who were recruited based on inclusion and exclusion criteria. The study population consisted of 21 healthy adult women ranging from 21 to 49 years of age (mean age 33.6 years, mean BMI 24.1) and 11 healthy adult men ranging from 23 to 34 years of age (mean age 30.1 years, mean BMI 25.6). Subjects with a history of cigarette smoking in the past 5 years, history of bleeding disorders, inflammatory bowel diseases (Crohn's/ulcerative colitis), irritable bowel syndrome, gastrointestinal surgery within the past 2 years, diabetes, cardiovascular disease, hypertension, regular intake of nonsteroidal anti-inflammatory drugs (NSAIDs), steroids, or other anti-inflammatory medications, use of antibiotics (other than topical) in the past 2 months and current use of dietary supplements, including probiotics and prebiotics were excluded.Study protocol
Subjects were randomly assigned to take daily capsule supplements containing either 1.4 g XOS, 2.8 g XOS, or placebo. The XOS supplements and placebo were provided by Life Bridge, International (Riverside, CA). XOS was manufactured by Shandong Longlive Bio-Technology Co., Ltd., China. Each 1.4 g XOS supplement capsule contained white or off-white crystalline substance (175 mg XOS) and the 2.8 g XOS supplement capsule contained white or off-white crystalline substance (350 mg XOS). The placebo capsules were identical in appearance to the XOS capsules and contained maltodextrin. The supplements were stored (room temperature) at the UCLA Center for Human Nutrition. The study consisted of three phases: a 2 week run-in phase, an 8 week intervention phase, and a 2 week washout phase. During the 2 week run-in phase all subjects were instructed to maintain their usual diet but to restrict consumption of products containing high levels of XOS or other oligosaccharides (soybean, onion, asparagus, wheat, rye, triticale, and chicory) and fermented dairy products containing viable bifidobacteria or lactobacilli. All subjects were instructed to continue these dietary guidelines throughout the 8 week intervention and 2 week washout phase. A 24 hour dietary recall was performed at baseline (i.e., at the end of the 2 week run-in phase at week 0), week 4, week 8, and week 10 (i.e., at the end of the 2 week washout phase) for calculation of total energy intake and the amount of carbohydrates, fiber, fat and protein. This dietary inquiry was also used to assess dietary compliance of subjects. Tolerance was evaluated by using a daily chart where the symptoms (excess flatus, borborygmi, bloating, abdominal pain) were graded from 0 (no symptoms) to 3 (severe symptoms). Frequency and consistency of stools were also noted with diarrhea defined as one or more liquid stools or more than 3 stools per day.Stool collection and processing
A total of four stools were collected from each subject: at baseline, after 4 weeks, and 8 weeks of intervention with XOS or placebo, and at 2 weeks after cessation of XOS or placebo intervention (week 10). Each time the entire stool specimen was obtained. The specimen was placed in a large, zip-lock freezer bag and all air was pushed out of the bag as the zip lock was closed. The specimen was delivered on ice to the UCLA Center for Human Nutrition within 24 hours of collection where it was immediately stored at −20 °C. At the VA Medical Center laboratory, the specimens were weighed and placed into an anaerobic chamber for processing. Approximately 1 g of the stool was weighed and dried in a vacuum drying oven (15 in Hg) at 80 °C for 48 hours, then weighed again to establish the moisture content so that all counts could be corrected to dry weight. The stool samples were diluted in pre-reduced phosphate buffered saline (PBS) in appropriate amounts to allow mixing and then homogenized in a Waring blender.Pyrosequencing
DNA was extracted from 200 μg of stool homogenate using the commercial extraction system QIAamp® Stool DNA Extraction Kit (Qiagen, Valencia, CA), and sent to Dr Dowd at MR DNA Molecular Research laboratory for pyrosequencing. The quality of the DNA samples was confirmed using a Bio-Rad Experion system (Bio-Rad Laboratories, CA, USA). Bacterial tag-encoded FLX-titanium amplicon pyrosequencing (bTEFAP) was performed as described previously.22–24 This approach utilizes GS FLX Titanium series reagents and procedures (454 Life Sciences, CT, USA) and a one-step PCR, mixture of Hot Start and Hot Start high fidelity taq polymerases, and amplicons originating from the 27F region numbered in relation to E. coli rRNA. Statistical analysis was performed using a variety of computer packages including XLstat, NCSS 2007, “R” and NCSS 2010. Alpha diversity analysis was conducted as described previously.22–24 Beta diversity analysis was performed by creating individual phylogenetic trees, without regard for taxonomy, for each sample then statistically evaluating each tree among each sample. A principal coordinate analysis was then performed to allow for visualization of 10 separate jackknife iterative comparisons. The multidimensional space was then described within the 3 primary vectors.Stool pH and SCFA
1 g of the stool was used to make a 1![[thin space (1/6-em)]](https://www.rsc.org/images/entities/char_2009.gif) :5 dilution in sterile distilled water. The pH was measured using a pH meter (Corning). Gas liquid chromatography (GLC) for short-chain volatile and non-volatile fatty acid analyses was then performed as described previously.25–27 Total SCFA were expressed as micromoles per gram of dry weight stool.
:5 dilution in sterile distilled water. The pH was measured using a pH meter (Corning). Gas liquid chromatography (GLC) for short-chain volatile and non-volatile fatty acid analyses was then performed as described previously.25–27 Total SCFA were expressed as micromoles per gram of dry weight stool.
Stool microbiology
Specimens were cultured for total bacterial flora and total anaerobic and aerobic counts were recorded. Selective and differential media were used as indicated to grow and enumerate Enterobacteriaceae, Bacteroides fragilis group, Clostridium, Bifidobacterium, and Lactobacillus. Aliquots of the homogenized specimens were diluted in pre-reduced PBS appropriately and plated (100 μl per plate) onto Brucella blood agar (BD BBL, Sparks, MD) for total anaerobic count, Trypticase Soy blood agar (TSA, BD BBL) for total aerobic count, Bacteroides-bile-esculin agar (BBE; BD BBL) to enumerate Bacteroides fragilis group and MacConkey agar plates (BD BBL) to enumerate Enterobacteriaceae. The Bifidobacterium medium consisted of 42.5 g Columbia agar base (BD BBL), 5 g glucose, 0.4 g cysteine, 0.01 g riboflavin, and 0.8 ml propionic acid in 1 liter dH2O. The Lactobacillus medium consisted of 84 g LBS agar (BD BBL) and 1.32 ml glacial acetic acid in 1 liter dH2O. For the selective isolation of Clostridium, diluted aliquots of the stool specimens were incubated in 50% ethanol for 30 min, and subsequently plated onto Brucella agar plates. Brucella agar plates for total anaerobic count and the Bifidobacterium medium and Lactobacillus medium plates were incubated under anaerobic conditions at 37 °C for 7 days; BBE and Brucella plates for Clostridium enrichment were incubated under anaerobic conditions at 37 °C for 5 days. Anaerobic conditions consisted of a gas mixture of 5% CO2, 5% H2, and 90% N2; the residual oxygen was removed by palladium catalysts. TSA blood agar plates were incubated under 10% CO2 for 72 hours and MacConkey agar plates aerobically at 37 °C for 24 hours. Characteristic colony types on various selective media were counted and the counts were adjusted to dry weight of stool. The identity of all colony types on the Lactobacillus and Bifidobacterium selective media were confirmed to the species level by 16S rRNA gene sequencing. Details of the culture techniques are described in the Wadsworth-KTL Anaerobic Bacteriology Manual.2516S rRNA gene sequencing
Genomic DNA was extracted and purified from bacterial cells using a QIAamp DNA Mini Kit (Qiagen). The 16S rRNA gene fragments were amplified using universal primers 8UA and 907B as previously described.28 The purified PCR products were sequenced directly with a Biotech Diagnostic Big Dye sequencing kit (Biotech Diagnostics, CA) on an ABI 3130 Avant sequencer (Applied Biosystems, Foster City, CA). The sequencing data was analyzed by comparison of the consensus sequences with GenBank sequences by using Ribosomal Database Project (RDP-II) (Michigan State University, East Lansing),29 and Basic Local Alignment Search Tool (BLAST).30 Analysis of the isolates was performed by comparing with the sequences of the type strains retrieved from GenBank by using the program Clustal W.31Ethics
The study was carried out in accordance with the guidelines of the Office for Protection of Research Subjects of the University of California, Los Angeles and the Institutional Review Board of the VA Greater LA Health Center. All subjects provided written informed consent before the study began.Statistics
The treatment effect for all the variables was determined by comparing mean changes from baseline across dose groups and within groups across time using a (time × dose) repeated measure analysis of variance (ANOVA) model. For pyrosequencing analyses, Kruskal–Wallis with multiple pairwise comparisons using the Steel–Dwass–Critchlow–Fligner procedure and two-tailed test was utilized to evaluate the differences among each study group. Repeated measures ANOVA were also performed and for variables which did not follow normal distribution (lots of zero's) the medians were reported and compared using Kruskal–Wallis (Wilcoxon Rank Sum) test. Significance reported for any analysis was defined as p ≤ 0.05.Results
Subjects
A total of 32 subjects were enrolled into the study. One subject from the placebo group and one from the low dose group dropped out of the study for non specific gastrointestinal complaints. One placebo group subject, two high dose group subjects, and two low dose group subjects were excluded from the analyses because of compromised specimen quality. Analysis was performed on 100 samples consisting of 7 high dose group, 9 low dose group, and 9 placebo group subjects.Stool microbiology
The 16S rRNA gene sequencing revealed that Bifidobacterium longum was the most commonly isolated Bifidobacterium sp. (found in 81% of the specimens) followed by Bifidobacterium pseudocatenulatum/catenulatum (45%), Bifidobacterium bifidum (29%) and Bifidobacterium adolescentis (28%). Various Lactobacillus species were identified, most commonly Lactobacillus casei/paracasei (29%), Lactobacillus gasseri (22%), and Lactobacillus acidophilus (15%) (Table 1). The mean counts (cfu g−1 dry weight stool), standard deviations and p-values (for comparison to baseline) of the different groups of bacteria are presented in Table 2. Table 3 presents the p-values of the mean change in counts in comparison to the baseline values comparing the three study groups against each other at weeks 4, 8 and 10. The Bifidobacterium counts of the subjects after high dose (2.8 g per day) XOS intervention was significantly higher than the values at the baseline at 4, 8, and 10 weeks (Table 2). Similarly, the increase of Bifidobacterium counts was significantly higher in the high dose XOS group at 4 weeks compared to the low dose (1.4 g per day) XOS group (Table 3). The low dose XOS group had significantly higher Bifidobacterium counts compared to the placebo group subjects at 8 and 10 weeks (Table 3). The total anaerobic flora counts of the subjects after high dose XOS intervention were significantly higher than the baseline at 4 and 8 weeks (Table 2). The mean changes of total anaerobic flora counts were significantly higher in the high XOS dose group at 4, 8, and 10 weeks compared to the placebo group (Table 3). B. fragilis group counts of the subjects after high dose XOS intervention were significantly higher from the baseline at 4, 8, and 10 weeks (Table 2) and the mean changes were significantly higher in the high XOS dose group compared to the low and placebo groups at 4, 8, and 10 weeks (Table 3). There were no significant differences in the Lactobacillus and Clostridium counts between the three study groups evaluated, whereas the Enterobacteriaceae count was significantly lower at week 10 in the placebo group (Tables 2 and 3).| % | % | ||
|---|---|---|---|
| a Lactobacillus ruminis (8), Lactobacillus mucosae (6), Lactobacillus parabuchneri (6), Lactobacillus vaginalis (5), Lactobacillus salivarius (4), Lactobacillus johnsonii (3), Lactobacillus graminis (1), Lactobacillus hilgardii (1), Lactobacillus lactis (1), Lactobacillus species (1). | |||
| Bifidobacterium longum | 81 | Lactobacillus casei/paracasei | 29 |
| Bifidobacterium pseudocatenulatum/catenulatum | 45 | Lactobacillus gasseri | 22 |
| Bifidobacterium bifidum | 29 | Lactobacillus acidophilus | 15 |
| Bifidobacterium adolescentis | 28 | Lactobacillus fermentum | 12 |
| Bifidobacterium animalis | 6 | Lactobacillus plantarum | 12 |
| Bifidobacterium stercoris | 4 | Lactobacillus brevis | 10 |
| Bifidobacterium breve | 3 | Lactobacillus rhamnosus | 10 |
| Bifidobacterium dentium | 1 | Lactobacillus crispatus | 9 |
| Bifidobacterium species | 1 | Lactobacillus reuteri | 9 |
| Lactobacillus speciesa | 38 | ||
| Time | Dosea | n | Bifidobacterium | Anaerobes-total | Aerobes-total | Bacteroides fragilis group | ||||||||
|---|---|---|---|---|---|---|---|---|---|---|---|---|---|---|
| Mean | SD | p Valueb | Mean | SD | p Value | Mean | SD | p Value | Mean | SD | p Value | |||
| a High dose (2.8 g per day), low dose (1.4 g per day). b p Value for comparison to baseline. SD = standard deviation. | ||||||||||||||
| Baseline | High | 7 | 7.48 | 0.64 | 9.14 | 0.63 | 7.56 | 0.96 | 6.62 | 2.16 | ||||
| Low | 9 | 8.20 | 1.33 | 9.86 | 0.87 | 8.00 | 0.85 | 8.51 | 1.73 | |||||
| Placebo | 9 | 7.97 | 1.88 | 9.89 | 0.44 | 7.78 | 1.19 | 8.54 | 0.57 | |||||
| Week 4 | High | 7 | 9.03 | 0.86 | 0.001 | 9.95 | 0.53 | 0.008 | 8.33 | 0.89 | 0.056 | 7.94 | 1.63 | 0.014 |
| Low | 9 | 8.49 | 1.36 | 0.466 | 10.11 | 0.60 | 0.352 | 8.33 | 0.29 | 0.350 | 8.13 | 0.82 | 0.409 | |
| Placebo | 9 | 7.52 | 1.93 | 0.266 | 9.79 | 0.35 | 0.711 | 7.81 | 0.89 | 0.933 | 8.12 | 0.69 | 0.364 | |
| Week 8 | High | 7 | 8.77 | 0.86 | 0.007 | 9.84 | 0.69 | 0.020 | 8.34 | 0.68 | 0.053 | 8.50 | 0.81 | 0.001 |
| Low | 9 | 8.95 | 0.60 | 0.068 | 9.86 | 0.62 | 1.000 | 8.19 | 1.01 | 0.583 | 8.05 | 1.16 | 0.323 | |
| Placebo | 9 | 7.59 | 1.89 | 0.347 | 9.70 | 0.58 | 0.473 | 7.74 | 1.13 | 0.927 | 8.04 | 0.61 | 0.283 | |
| Week 10 | High | 7 | 8.62 | 1.07 | 0.017 | 9.66 | 0.36 | 0.087 | 8.26 | 0.96 | 0.082 | 8.30 | 0.62 | 0.002 |
| Low | 9 | 8.68 | 0.56 | 0.241 | 9.88 | 0.70 | 0.955 | 8.59 | 1.08 | 0.097 | 8.45 | 0.74 | 0.893 | |
| Placebo | 9 | 7.27 | 1.78 | 0.087 | 9.54 | 0.46 | 0.180 | 8.09 | 0.73 | 0.381 | 7.94 | 0.62 | 0.198 | |
| Time | Dose | n | Lactobacillus | Enterobacteriaceae | Clostridium | ||||||
|---|---|---|---|---|---|---|---|---|---|---|---|
| Mean | SD | p Value | Mean | SD | p Value | Mean | SD | p Value | |||
| Baseline | High | 7 | 4.75 | 2.08 | 6.29 | 1.59 | 6.33 | 0.51 | |||
| Low | 9 | 5.33 | 1.60 | 7.02 | 1.29 | 6.83 | 1.32 | ||||
| Placebo | 9 | 5.08 | 1.12 | 6.48 | 1.52 | 6.28 | 0.82 | ||||
| Week 4 | High | 7 | 4.13 | 1.33 | 0.431 | 6.27 | 1.51 | 0.979 | 6.06 | 0.60 | 0.525 |
| Low | 9 | 5.22 | 1.21 | 0.881 | 6.94 | 0.99 | 0.875 | 6.52 | 1.20 | 0.402 | |
| Placebo | 9 | 5.66 | 1.96 | 0.398 | 6.50 | 1.21 | 0.977 | 6.67 | 1.02 | 0.309 | |
| Week 8 | High | 7 | 4.66 | 1.38 | 0.908 | 6.45 | 1.44 | 0.764 | 6.37 | 1.00 | 0.921 |
| Low | 9 | 5.43 | 1.74 | 0.879 | 6.19 | 1.51 | 0.087 | 6.14 | 0.91 | 0.068 | |
| Placebo | 9 | 5.22 | 1.31 | 0.834 | 6.83 | 1.35 | 0.463 | 6.63 | 1.17 | 0.352 | |
| Week 10 | High | 7 | 4.79 | 1.85 | 0.962 | 6.81 | 1.14 | 0.333 | 6.27 | 0.40 | 0.879 |
| Low | 9 | 4.28 | 1.93 | 0.134 | 7.45 | 0.81 | 0.371 | 6.53 | 0.95 | 0.421 | |
| Placebo | 9 | 4.96 | 2.10 | 0.872 | 5.34 | 1.31 | 0.020 | 6.60 | 0.90 | 0.398 | |
| Time | Doseavs. dose | p Value | |||||||
|---|---|---|---|---|---|---|---|---|---|
| Bifidobacterium | Lactobacillus | Anaerobes-total | Aerobes-total | Enterobacteriaceae | B. fragilis | Clostridium | |||
| a High dose (2.8 g per day), low dose (1.4 g per day). | |||||||||
| Week 4 | High | Low | 0.047 | 0.623 | 0.155 | 0.406 | 0.933 | 0.017 | 0.938 |
| High | Placebo | 0.002 | 0.252 | 0.024 | 0.166 | 0.969 | 0.015 | 0.251 | |
| Low | Placebo | 0.194 | 0.481 | 0.358 | 0.547 | 0.896 | 0.953 | 0.191 | |
| Week 8 | High | Low | 0.395 | 0.851 | 0.079 | 0.271 | 0.174 | 0.001 | 0.198 |
| High | Placebo | 0.009 | 0.821 | 0.027 | 0.129 | 0.794 | 0.001 | 0.587 | |
| Low | Placebo | 0.052 | 0.967 | 0.611 | 0.650 | 0.085 | 0.952 | 0.053 | |
| Week 10 | High | Low | 0.294 | 0.302 | 0.210 | 0.833 | 0.892 | 0.015 | 0.676 |
| High | Placebo | 0.004 | 0.887 | 0.031 | 0.461 | 0.024 | 0.002 | 0.501 | |
| Low | Placebo | 0.043 | 0.341 | 0.322 | 0.573 | 0.023 | 0.413 | 0.245 | |
Microbiome
A total of 997322 sequences were derived from the 100 samples in the study. One sample was excluded (baseline) due to low sequence counts. After stringent quality sequence curation and rarification a total of 460727 sequences classified within the bacterial kingdom were utilized for final microbiota analyses with an average of 4607 sequences per sample. The number of operational taxonomic units (OTU) at the species level was evaluated to define alpha diversity among the different groups. Based upon temporal and dosage compound variables there were no significant differences in the observed OTUs (Table 4). Similarly the Shannon index (Table 4) did not indicate significant differences among the groups. This indicates there were no notable shifts in the diversity of the bacterial communities due to the treatments. Similarly, in the current analysis we did not see appreciable clustering of the data based upon ongoing treatments compared to subjects not receiving treatment (Fig. 1). When adding the high and low after washout there was still no notable clustering of samples. A dendrogram created utilizing Wards clustering and Manhattan distances to illustrate potential shifts at the genus taxonomic level showed that the samples had no notable separation related to the treatment and that the samples from individual subjects tended to cluster together indicating that the microbiome of each individual tended to be more similar to the original microbiome regardless of treatment (data not shown). Finally, repeated measures ANOVA analyses of possible individual genera that were altered related to the treatment revealed that the proportion of Faecalibacterium of the subjects after high dose XOS intervention was significantly higher than the baseline at 4 weeks (p = 0.019) (Table 5). Non-parametric p-value obtained using Kruskal–Wallis (Wilcoxon Rank Sum) test showed significant increase in the proportion of Akkermansia from the baseline in the high XOS group compared to the placebo group subjects at 8 weeks (p = 0.041), and in the high XOS group compared to the low XOS group subjects at 10 weeks (p = 0.055).
| Variable | Dosea | n | Rarefaction analysis | Shannon diversity index | ||||||
|---|---|---|---|---|---|---|---|---|---|---|
| Minimum | Maximum | Mean | SD | Minimum | Maximum | Mean | SD | |||
| a High dose (2.8 g per day), low dose (1.4 g per day). SD = standard deviation. | ||||||||||
| Baseline | High | 6 | 269 | 468 | 360.7 | 77.9 | 4.66 | 6.45 | 5.5 | 0.67 |
| Week 4 | High | 7 | 275 | 451 | 370.6 | 61.9 | 5.19 | 6.6 | 6 | 0.55 |
| Week 8 | High | 7 | 216 | 466 | 333.1 | 82.4 | 4.87 | 5.95 | 5.44 | 0.37 |
| Week 10 | High | 7 | 242 | 514 | 371.3 | 107.1 | 4.72 | 6.67 | 5.58 | 0.68 |
| Baseline | Low | 9 | 195 | 435 | 370.3 | 73.2 | 4.58 | 6.72 | 5.98 | 0.62 |
| Week 4 | Low | 9 | 236 | 439 | 307.9 | 64.9 | 4.41 | 6.51 | 5.36 | 0.67 |
| Week 8 | Low | 9 | 311 | 597 | 393 | 100 | 4.87 | 7.11 | 5.84 | 0.69 |
| Week 10 | Low | 9 | 271 | 607 | 401.6 | 121.8 | 5.09 | 7.17 | 5.96 | 0.72 |
| Baseline | Placebo | 9 | 177 | 536 | 341.6 | 104.6 | 3.07 | 6.97 | 5.48 | 1.2 |
| Week 4 | Placebo | 9 | 132 | 519 | 332 | 139.9 | 3.51 | 6.95 | 5.5 | 1.02 |
| Week 8 | Placebo | 9 | 285 | 481 | 361.1 | 76.4 | 4.41 | 6.68 | 5.75 | 0.71 |
| Week 10 | Placebo | 9 | 290 | 504 | 403.1 | 75.5 | 5.4 | 6.91 | 6.09 | 0.53 |
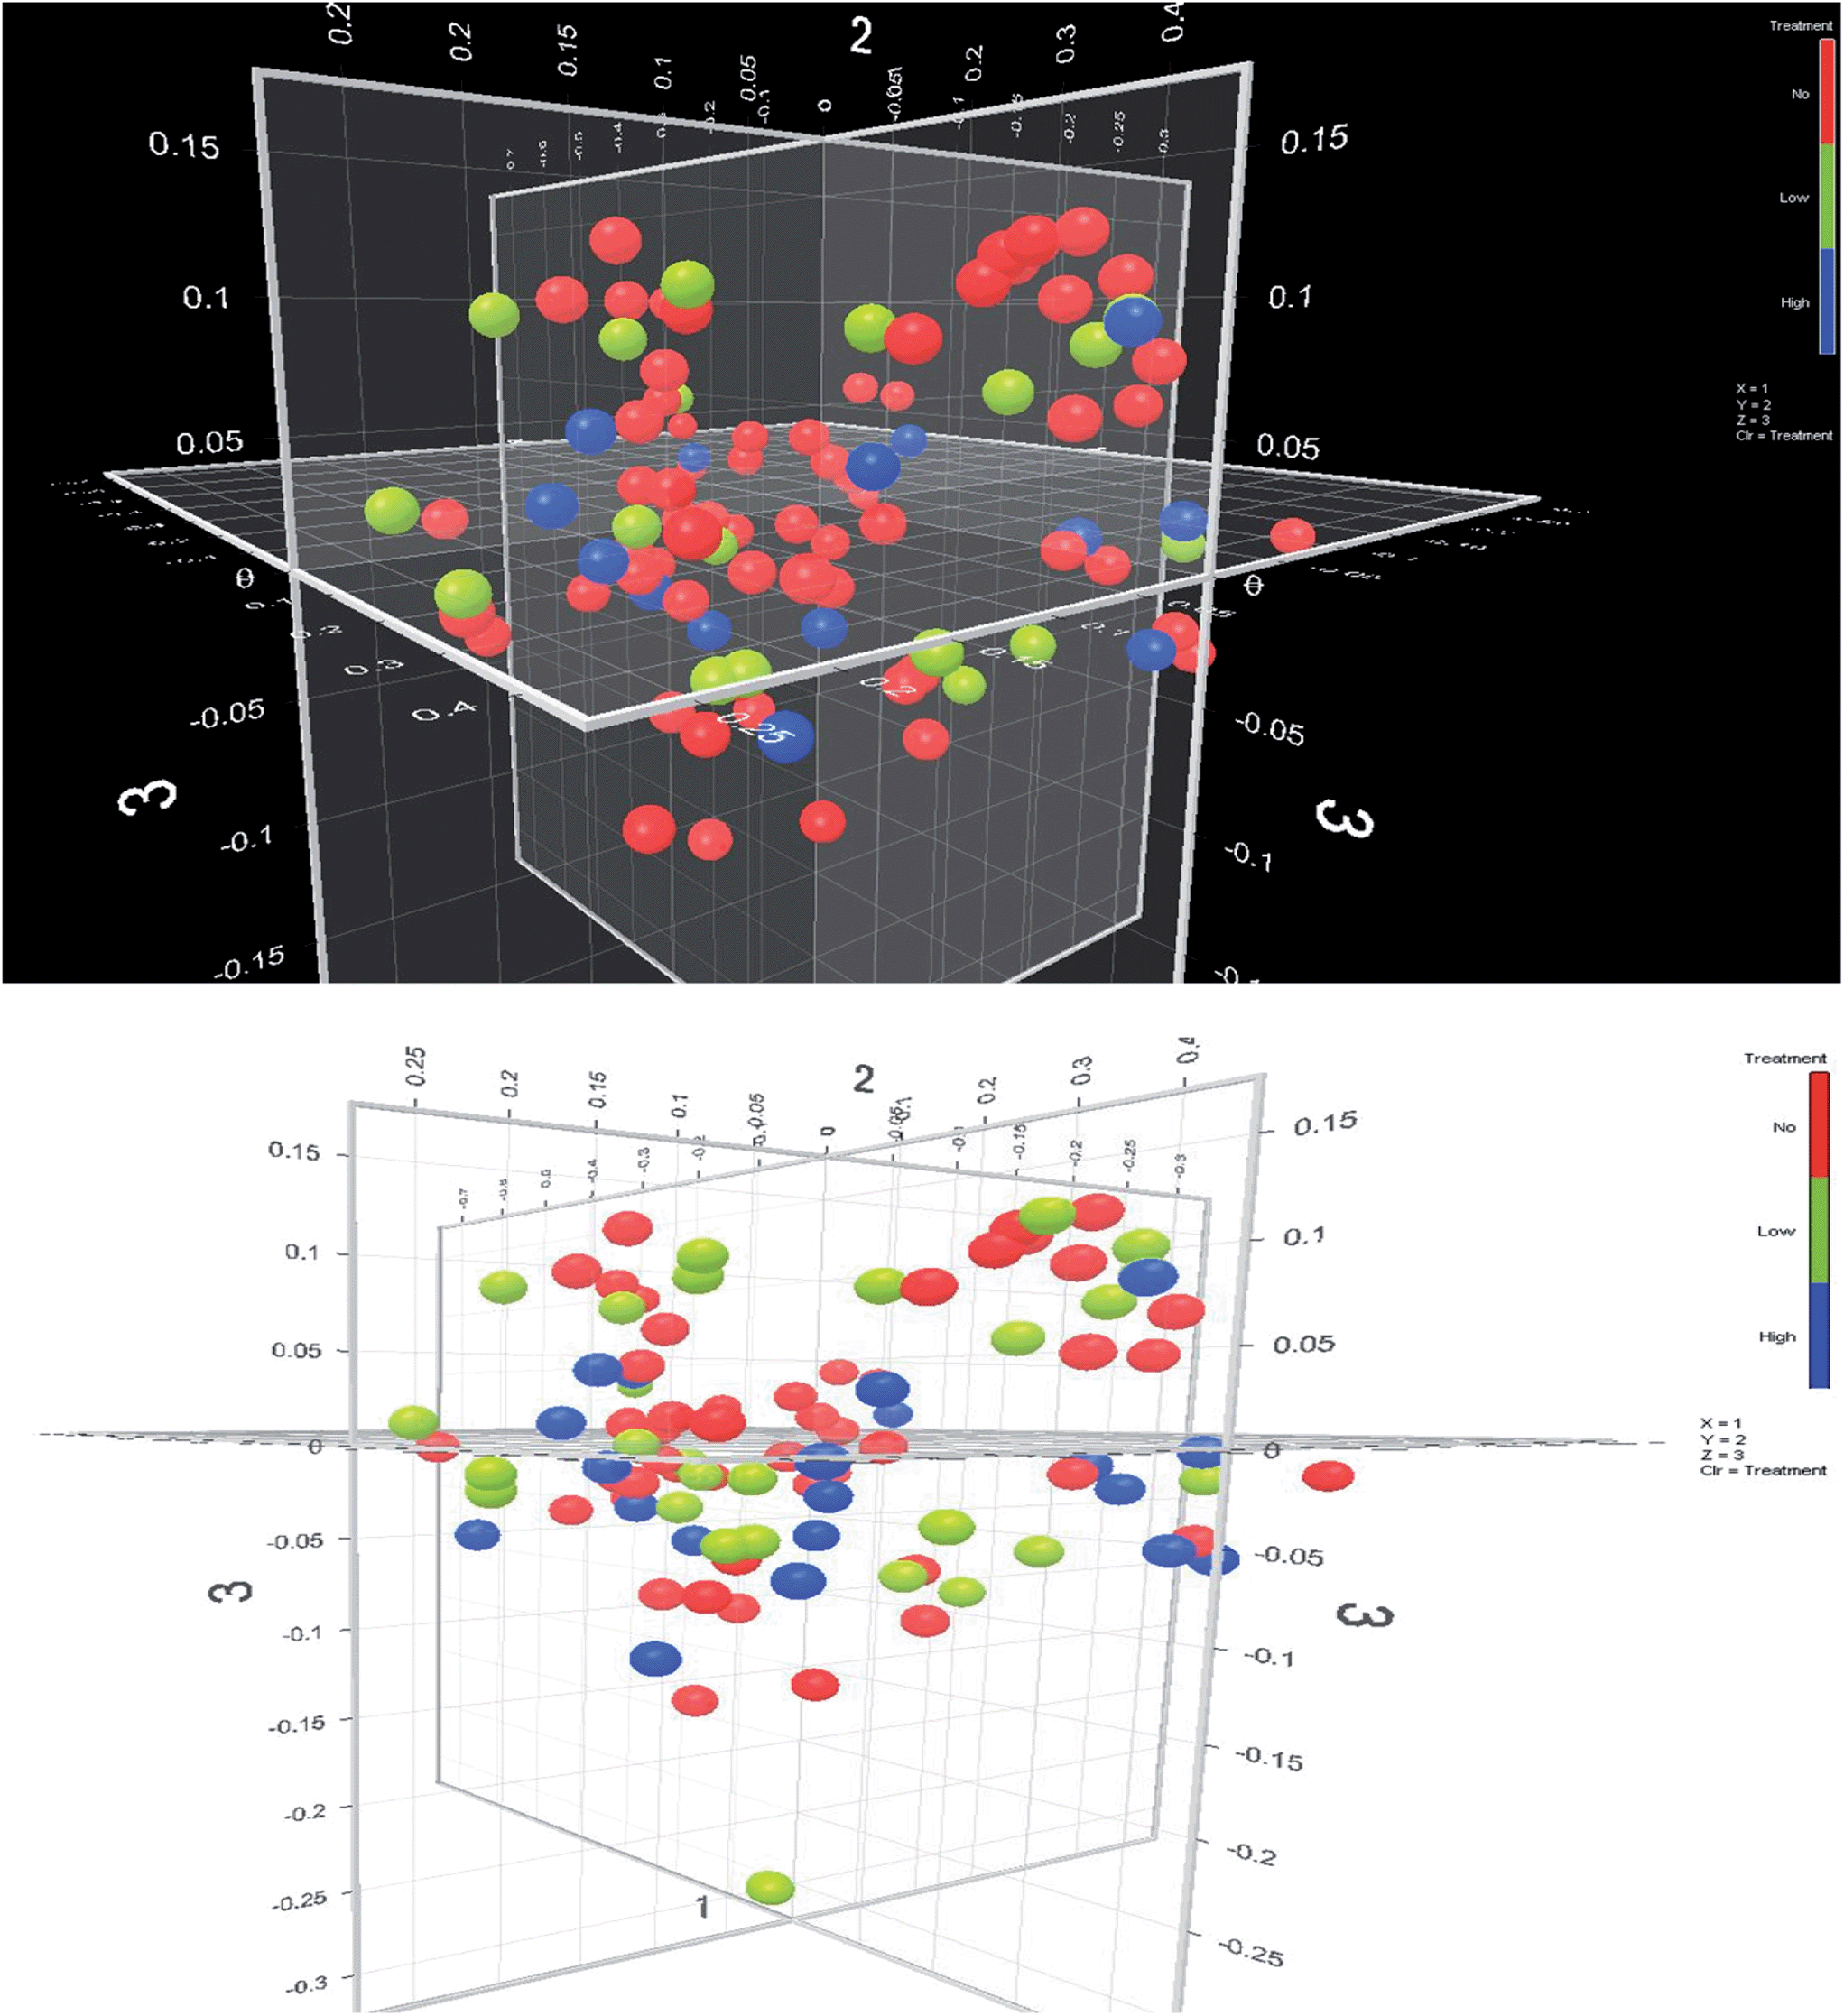 | ||
| Fig. 1 Beta diversity analysis. The no designations include all subjects prior to receiving supplement, subjects receiving placebo, and subjects after washout period. The high and low indicate those subjects receiving the indicated dosage at those periods when they were actively receiving treatment. | ||
| Time | Dosea | n | Mean | SD | p Valueb |
|---|---|---|---|---|---|
| a High dose (2.8 g per day), low dose (1.4 g per day). b p Value for comparison to baseline. SD = standard deviation. | |||||
| Baseline | High | 7 | 8.82 | 5.69 | |
| Low | 9 | 15.88 | 7.53 | ||
| Placebo | 9 | 9.77 | 13.65 | ||
| Week 4 | High | 7 | 17.99 | 4.96 | 0.019 |
| Low | 9 | 10.90 | 8.89 | 0.142 | |
| Placebo | 9 | 12.37 | 13.36 | 0.441 | |
| Week 8 | High | 7 | 11.72 | 7.09 | 0.448 |
| Low | 9 | 20.14 | 19.46 | 0.209 | |
| Placebo | 9 | 15.90 | 13.89 | 0.072 | |
| Week 10 | High | 7 | 11.59 | 3.73 | 0.469 |
| Low | 9 | 21.20 | 19.79 | 0.117 | |
| Placebo | 9 | 13.87 | 12.26 | 0.226 | |
Stool pH and SCFA
At baseline, the mean stool pH was 6.9. No significant, intervention-related differences in stool pH, mass, or total SCFA were observed (Table 6). Similarly, no significant, intervention-related differences in the individual SCFA were observed. Low levels of lactic acid (≤50 μM) were detected in only three of 100 samples.| Time | Dosea | n | Short chain fatty acids (μmol g−1) | Weight (g) | pH | ||||||
|---|---|---|---|---|---|---|---|---|---|---|---|
| Mean | SD | p Valueb | Mean | SD | p Value | Mean | SD | p Value | |||
| a High dose (2.8 g per day), low dose (1.4 g per day). b p Value for comparison to baseline. SD = standard deviation. | |||||||||||
| Baseline | High | 7 | 4.02 | 0.39 | 111.3 | 91.1 | 6.72 | 0.77 | |||
| Low | 9 | 4.06 | 0.18 | 94.6 | 102.4 | 6.96 | 0.34 | ||||
| Placebo | 9 | 3.96 | 0.22 | 117.3 | 76.4 | 7.01 | 0.39 | ||||
| Week 4 | High | 7 | 4.08 | 0.25 | 0.475 | 105.5 | 46.4 | 0.840 | 6.73 | 0.40 | 0.956 |
| Low | 9 | 4.03 | 0.16 | 0.675 | 101.3 | 74.5 | 0.793 | 6.99 | 0.43 | 0.875 | |
| Placebo | 9 | 4.01 | 0.21 | 0.529 | 127.6 | 94.0 | 0.684 | 6.89 | 0.25 | 0.519 | |
| Week 8 | High | 7 | 4.03 | 0.27 | 0.921 | 96.1 | 60.8 | 0.598 | 6.82 | 0.43 | 0.637 |
| Low | 9 | 4.06 | 0.15 | 0.969 | 98.1 | 70.9 | 0.892 | 6.90 | 0.33 | 0.717 | |
| Placebo | 9 | 3.91 | 0.29 | 0.438 | 139.4 | 114.1 | 0.385 | 7.03 | 0.27 | 0.923 | |
| Week 10 | High | 7 | 4.01 | 0.12 | 0.842 | 108.5 | 73.1 | 0.922 | 6.89 | 0.41 | 0.416 |
| Low | 9 | 4.00 | 0.19 | 0.426 | 94.2 | 93.5 | 0.986 | 6.86 | 0.48 | 0.559 | |
| Placebo | 9 | 3.90 | 0.18 | 0.363 | 101.9 | 86.9 | 0.548 | 7.02 | 0.34 | 0.947 | |
Tolerance
The gastrointestinal symptom results are shown in Table 7. No subjects had severe symptoms during the study period and no subjects had diarrhea by definition of liquid stool or more than 3 stools a day.| Placebo | Low dosea | High dosea | ||||||||||
|---|---|---|---|---|---|---|---|---|---|---|---|---|
| Run-in | Week 1–4 | Week 5–8 | Washout | Run-in | Week 1–4 | Week 5–8 | Washout | Run-in | Week 1–4 | Week 5–8 | Washout | |
| a High dose (2.8 g per day), low dose (1.4 g per day). b Mean value of symptoms graded from 0 (no symptoms) to 3 (severe symptoms) ± standard deviation. | ||||||||||||
| Excess flatus | 0.07 ± 0.08b | 0.36 ± 0.35 | 0.26 ± 0.36 | 0.31 ± 0.33 | 0.26 ± 0.34 | 0.51 ± 0.58 | 0.52 ± 0.61 | 0.19 ± 0.21 | 0.33 ± 0.43 | 0.68 ± 1.04 | 0.60 ± 0.95 | 0.31 ± 0.39 |
| Borborygmi | 0.17 ± 0.24 | 0.22 ± 0.34 | 0.19 ± 0.32 | 0.09 ± 0.13 | 0.25 ± 0.39 | 0.39 ± 0.41 | 0.36 ± 0.63 | 0.13 ± 0.20 | 0.21 ± 0.42 | 0.27 ± 0.34 | 0.47 ± 0.96 | 0.26 ± 0.34 |
| Bloating | 0.19 ± 0.38 | 0.38 ± 0.45 | 0.25 ± 0.42 | 0.21 ± 0.28 | 0.24 ± 0.32 | 0.29 ± 0.39 | 0.46 ± 0.62 | 0.21 ± 0.22 | 0.23 ± 0.45 | 0.47 ± 0.96 | 0.51 ± 0.94 | 0.12 ± 0.33 |
| Abdominal pain | 0.07 ± 0.11 | 0.26 ± 0.41 | 0.17 ± 0.29 | 0.08 ± 0.15 | 0.03 ± 0.08 | 0.06 ± 0.09 | 0.30 ± 0.59 | 0.07 ± 0.06 | 0.03 ± 0.10 | 0.02 ± 0.07 | 0.02 ± 0.07 | 0.01 ± 0.03 |
| Number of stools | 1.38 ± 0.54 | 1.35 ± 0.58 | 1.38 ± 0.60 | 1.32 ± 0.59 | 1.23 ± 0.74 | 1.35 ± 0.58 | 1.53 ± 0.67 | 1.19 ± 0.57 | 1.03 ± 0.52 | 1.04 ± 0.61 | 1.21 ± 0.89 | 1.08 ± 0.66 |
Discussion
The potential for prebiotics to be effective in the treatment of metabolic disorders and obesity is an area of potentially great significance. Studies have shown a decreased number of Bifidobacterium in the stools of obese subjects,10–12 and that administration of a Bifidobacterium breve to mice with high-fat diet-induced obesity led to a significant weight decrease.32 In the present study, both high and low dose XOS groups showed significantly higher counts of Bifidobacterium species than the placebo group, with the higher dose group showing significantly greater increases than the lower dose group. The Bifidobacterium count increased 21% from the baseline at 4 weeks and 17% from the baseline at 8 weeks in the high dose group. In addition to increasing the number of Bifidobacterium, this study also found a significant increase in the B. fragilis group (a member of the Bacteroidetes) for the high dose XOS group, and that XOS supplementation did not increase Lactobacillus (a member of the Firmicutes). Recent human studies have suggested that obesity-associated gut microbiota has increased numbers of Lactobacillus8,9 and an increased Firmicutes/Bacteroidetes ratio.5,6 Our findings suggest that XOS supplementation may be useful in the management of obesity. The increase in the counts of the “total anaerobes” in the high dose group reflects the increased counts in the Bifidobacterium and B. fragilis group, both of which are anaerobic. Some Bifidobacterium species may grow aerobically as well, which may be reflected in the modest increase of the aerobic counts in the high dose XOS group.To our knowledge, this is the first study examining the effect of prebiotics on the human intestinal bifidobacteria and lactobacilli where the identity of these organisms was confirmed by 16S rRNA sequencing. Only confirmed colonies were utilized in the final counts, thereby yielding more accurate counts than just relying on typical colony morphologies on selective media. While selective media are an invaluable tool in culturing stool samples, other organisms besides bifidobacteria and lactobacilli do grow on these media and not all target colonies are necessarily “typical”. By verifying the species identification, we also obtained valuable information on the Bifidobacterium and Lactobacillus species distribution in normal human intestinal flora. Turroni et al. studied the distribution of bifidobacteria in normal human gut by selective culture combined with 16S rRNA gene and16S–23S internally transcribed spacer [ITS] sequencing, and found a similar species distribution to that found in this study.33L. casei/paracasei was the most commonly isolated Lactobacillus species in our study, similar to another recent culture-based study,34 whereas a non-culture based study on a Japanese population found L. fermentum as the most predominant Lactobacillus species.35 In our study, the mean count of Bifidobacterium at baseline was 8.8 × 10⁸ cfu g−1 and Lactobacillus 2.4 × 10⁶ cfu g−1 dry weight stool. Similar numbers have been reported in previous studies33–35 indicating that bifidobacteria outnumber lactobacilli in the human gut.
The pyrosequencing results in this study indicate that the XOS supplementation did not result in significant shifts in the diversity of the bacterial communities. The 16S rRNA gene-based pyrosequencing approach has been shown to underestimate Bifidobacterium,24,36 which might account for the difference between the pyrosequencing and the culture results in this study. At genus level pyrosequencing analysis, the genera that were significantly increased were Faecalibacterium sp. and Akkermansia sp. in subjects on high dose XOS supplementation. Faecalibacterium sp. is a butyrate-producer with known anti-inflammatory effects in the gut, and low fecal concentrations of Faecalibacterium sp. have been reported in IBD and Crohn's disease.37Akkermansia is a mucin-degrading gut bacterium associated with gut health.38 It has recently been reported that the counts of Akkermansia decreased in obese and type 2 diabetic mice, and that a prebiotic (oligofructose) feeding normalized the Akkermansia numbers correlating with improved metabolic profile.39 Our results suggest that XOS may be a suitable prebiotic for the promotion of Akkermansia in the human gut.
Na and Kim investigated the effects of 1.4 g per day and 2.8 g per day doses of XOS on stool bifidobacteria proliferation, lactic acid concentration and lipid metabolism in healthy Korean women, and as in this study, they found that the number of Bifidobacterium increased significantly in both XOS groups.16 They also found that serum triglyceride, cholesterol and glucose concentrations were significantly decreased in the 2.8 g per day intake group; while there were significant increases in concentrations of stool cholesterol in both groups, and stool triglycerides in the 2.8 g per day group. In their study the stool lactic acid concentration was significantly increased and the fecal pH significantly decreased in the 2.8 g per day intake group.16 In the present study, however, the XOS supplementation had no significant effect on stool pH or SCFA, with low levels of lactic acid (≤50 μM) detected in only three samples. Other studies have similarly shown no significant increases in fecal pH and SCFA in subjects on prebiotic supplementation; this is probably due to the metabolism of SCFA by the host.40,41 Another study assessing the effects of a 4 g per day dose of XOS on the intestinal microbiota, gastrointestinal function and nutritional parameters in elderly patients over a 21 day period concluded that XOS supplementation promoted intestinal health and showed no adverse effects on the elderly study population.42
A requirement for an effective prebiotic would be the absence of gastrointestinal side effects. In the current study, both 1.4 g per day and 2.8 g per day doses of XOS were tolerated well by normal healthy adults without any gastrointestinal side effects above those observed in the placebo group. The dose of FOS required to significantly increase the Bifidobacterium counts in the human gut is in the range of 10 to 20 grams.17 In a threshold study evaluating symptomatic response to varying levels of FOS ingested regularly, excessive flatus and borborygmi were recorded by about 10% of volunteers at 10 g per day of FOS and excessive flatus, borborygmi and bloating by about 20–30% of volunteers at 20 g per day.43 In another study in which 10 volunteers ingested 15 g per day FOS for 12 days, gaseous symptoms such as abdominal cramps, excess flatus and bloating were significantly more severe in subjects ingesting the FOS than in sucrose-fed control subjects.44 A dose-effect relationship was previously found using another bifidogenic substrate, GOS, but the minimal dose that significantly increased fecal bifidobacteria counts was 10 g per day, and the maximal well-tolerated dose was 15 g per day.18 In the present study, XOS increased bifidobacteria count in a dose–response manner at much lower doses than FOS or GOS, without any significant increase of gastrointestinal symptoms compared to subjects on placebo. The lower effective dose of XOS by comparison to FOS and GOS, makes XOS incorporation into food products or capsules more feasible.
Based on the findings of the current study, XOS dietary supplementation may be beneficial to gastrointestinal microbiota and a dose of 2.8 g per day maybe more effective at producing these outcomes than a lower dose of 1.4 g per day. This study demonstrated that XOS increases the counts of Bifidobacterium without increasing the counts of Lactobacillus in healthy adults. Further clinical studies will determine whether XOS may have utility in the prevention and treatment of metabolic disorders including obesity.
Acknowledgements
This work was supported by Life Bridge International Corporation.References
- J. Rafter, M. Bennett, G. Caderni, Y. Clune, R. Hughes, P. C. Karlsson, A. Klinder, M. O'Riordan, G. C. O'Sullivan, B. Pool-Zobel, G. Rechkemmer, M. Roller, I. Rowland, M. Salvadori, H. Thijs, L. J. Van, B. Watzl and J. K. Collins, Dietary synbiotics reduce cancer risk factors in polypectomized and colon cancer patients, Am. J. Clin. Nutr., 2007, 85, 488–496 CAS.
- D. B. Silk, A. Davis, J. Vulevic, G. Tzortzis and G. R. Gibson, Clinical trial: the effects of a trans-galactooligosaccharide prebiotic on faecal microbiota and symptoms in irritable bowel syndrome, Aliment. Pharmacol. Ther., 2009, 29, 508–518 CrossRef CAS PubMed.
- M. B. Roberfroid, Prebiotics and probiotics: are they functional foods?, Am. J. Clin. Nutr., 2000, 71, 1682S–1687S CAS.
- N. M. Delzenne, A. M. Neyrinck and P. D. Cani, Gut microbiota and metabolic disorders: How prebiotic can work?, Br. J. Nutr., 2013, 109(suppl. 2), S81–S85 CrossRef CAS PubMed.
- R. E. Ley, P. J. Turnbaugh, S. Klein and J. I. Gordon, Microbial ecology: human gut microbes associated with obesity, Nature, 2006, 444, 1022–1023 CrossRef CAS PubMed.
- P. J. Turnbaugh, M. Hamady, T. Yatsunenko, B. L. Cantarel, A. Duncan, R. E. Ley, M. L. Sogin, W. J. Jones, B. A. Roe, J. P. Affourtit, M. Egholm, B. Henrissat, A. C. Heath, R. Knight and J. I. Gordon, A core gut microbiome in obese and lean twins, Nature, 2009, 457, 480–484 CrossRef CAS PubMed.
- B. W. Parks, E. Nam, E. Org, E. Kostem, F. Norheim, S. T. Hui, C. Pan, M. Civelek, C. D. Rau, B. J. Bennett, M. Mehrabian, L. K. Ursell, A. He, L. W. Castellani, B. Zinker, M. Kirby, T. A. Drake, C. A. Drevon, R. Knight, P. Gargalovic, T. Kirchgessner, E. Eskin and A. J. Lusis, Genetic control of obesity and gut microbiota composition in response to high-fat, high-sucrose diet in mice, Cell Metab., 2013, 17, 141–152 CrossRef CAS PubMed.
- F. Armougom, M. Henry, B. Vialettes, D. Raccah and D. Raoult, Monitoring bacterial community of human gut microbiota reveals an increase in Lactobacillus in obese patients and methanogens in anorexic patients, PLoS One, 2009, 4, e7125 Search PubMed.
- M. Million, M. Maraninchi, M. Henry, F. Armougom, H. Richet, P. Carrieri, R. Valero, D. Raccah, B. Vialettes and D. Raoult, Obesity-associated gut microbiota is enriched in Lactobacillus reuteri and depleted in Bifidobacterium animalis and Methanobrevibacter smithii, Int. J. Obes., 2012, 36, 817–825 CrossRef CAS PubMed.
- A. Schwiertz, D. Taras, K. Schafer, S. Beijer, N. A. Bos, C. Donus and P. D. Hardt, Microbiota and SCFA in lean and overweight healthy subjects, Obesity, 2010, 18, 190–195 CrossRef PubMed.
- M. Kalliomaki, M. C. Collado, S. Salminen and E. Isolauri, Early differences in fecal microbiota composition in children may predict overweight, Am. J. Clin. Nutr., 2008, 87, 534–538 CAS.
- M. C. Collado, E. Isolauri, K. Laitinen and S. Salminen, Distinct composition of gut microbiota during pregnancy in overweight and normal-weight women, Am. J. Clin. Nutr., 2008, 88, 894–899 CAS.
- M. Khan, D. Raoult, H. Richet, H. Lepidi and S. B. La, Growth-promoting effects of single-dose intragastrically administered probiotics in chickens, Br. Poult. Sci., 2007, 48, 732–735 CrossRef CAS PubMed.
- J. Jaskari, P. Kontula, A. Siitonen, H. Jousimies-Somer, T. Mattila-Sandholm and K. Poutanen, Oat beta-glucan and xylan hydrolysates as selective substrates for Bifidobacterium and Lactobacillus strains, Appl. Microbiol. Biotechnol., 1998, 49, 175–181 CrossRef CAS.
- C. E. Rycroft, M. R. Jones, G. R. Gibson and R. A. Rastall, A comparative in vitro evaluation of the fermentation properties of prebiotic oligosaccharides, J. Appl. Microbiol., 2001, 91, 878–887 CrossRef CAS.
- M. H. Na and W. K. Kim, Effects of xylooligosaccharide intake on fecal bifidobacteria, lactic acid and lipid metabolism in Korean young women, Korean J. Nutr., 2013, 40, 154–161 Search PubMed.
- Y. Bouhnik, K. Vahedi, L. Achour, A. Attar, J. Salfati, P. Pochart, P. Marteau, B. Flourie, F. Bornet and J. C. Rambaud, Short-chain fructo-oligosaccharide administration dose-dependently increases fecal bifidobacteria in healthy humans, J. Nutr., 1999, 129, 113–116 CAS.
- M. Ito, Y. Deguchi, A. Miyamori, K. Matsumoto, H. Kikuchi, Y. Kobayashi, T. Yajima and T. Kan, Effects of administration of galactooligosaccharides on the human faecal microflora, stool weight and abdominal sensation, Microb. Ecol. Health Dis., 1990, 3, 285–292 CrossRef.
- D. V. Evtuguin, J. L. Tomas, A. M. Silva and C. P. Neto, Characterization of an acetylated heteroxylan from Eucalyptus globulus Labill, Carbohydr. Res., 2003, 338, 597–604 CrossRef CAS.
- P. Moura, R. Barata, F. Carvalheiro, F. Girio, M. C. Loureiro-Dias and M. P. Esteves, In Vitro fermentation of xylooligosaccharides from corn cobs autohydrolysis by Bifidobacterium and Lactobacillus strains, LWT--Food Sci. Technol., 2007, 40, 963–972 CrossRef CAS PubMed.
- D. Nabarlatz, A. Ebringerova and D. Montane, Autohydrolysis of agricultural byproducts for the production of xylo-oligosaccharides, Carbohydr. Polym., 2007, 69, 20–28 CrossRef CAS PubMed.
- S. M. Finegold, S. E. Dowd, V. Gontcharova, C. Liu, K. E. Henley, R. D. Wolcott, E. Youn, P. H. Summanen, D. Granpeesheh, D. Dixon, M. Liu, D. R. Molitoris and J. A. Green III, Pyrosequencing study of fecal microflora of autistic and control children, Anaerobe, 2010, 16, 444–453 CrossRef CAS PubMed.
- S. E. Dowd, R. D. Wolcott, Y. Sun, T. McKeehan, E. Smith and D. Rhoads, Polymicrobial nature of chronic diabetic foot ulcer biofilm infections determined using bacterial tag encoded FLX amplicon pyrosequencing (bTEFAP), PLoS One, 2008, 3, e3326 Search PubMed.
- S. Hooda, B. M. Boler, M. C. Serao, J. M. Brulc, M. A. Staeger, T. W. Boileau, S. E. Dowd, G. C. Fahey Jr and K. S. Swanson, 454 pyrosequencing reveals a shift in fecal microbiota of healthy adult men consuming polydextrose or soluble corn fiber, J. Nutr., 2012, 142, 1259–1265 CrossRef CAS PubMed.
- H. R. Jousimies-Somer, P. Summanen, D. Citron, E. Baron, H. M. Wexler and S. M. Finegold, Wadsworth-KTL Anaerobic Bacteriology Manual, Star publishing, Belmont, 2002 Search PubMed.
- G. Zhao, M. Nyman and A. Jonsson, Rapid determination of short-chain fatty acids in colonic contents and faeces of humans and rats by acidified water-extraction and direct injection chromatography, Biomed. Chromatogr., 2006, 20, 674–682 CrossRef CAS PubMed.
- C. Andrieux, J. M. Membre, C. Cayuela and J. M. Antoine, Metabolic characteristics of the faecal microflora in humans from three age groups, Scand. J. Gastroenterol., 2002, 37, 792–798 CrossRef CAS.
- J. Brosius, M. Palmer, P. J. Kennedy and H. F. Noller, Complete nucleotide sequence of a 16S ribosomal RNA gene from E. coli, Proc. Natl. Acad. Sci. U. S. A., 1978, 75, 4801–4805 CrossRef CAS.
- B. L. Maidak, J. R. Cole, T. G. Lilburn, C. T. Parker, P. R. Saxman, R. J. Farris, G. M. Garrity, G. J. Olsen, T. M. Schmidt and J. M. Tiedje, The RDP-II (Ribosomal Database Project), Nucleic Acid Res, 2001, 29, 173–174 CrossRef CAS PubMed.
- D. A. Benson, I. Kars, D. J. Lipman, J. Ostell, B. A. Rapp and D. L. Wheeler, GenBank, Nucleic Acids Res., 2002, 30, 17–20 CrossRef CAS.
- D. Higgins, J. Thompson, T. Gibson, J. D. Thompson, D. G. Higgins and T. J. Gibson, CLUSTAL W: improving the sensitivity of progressive multiple sequence alignment through sequence weighting, position-specific gap penalties and weigh matrix choice, Nucleic Acids Res., 1994, 22, 4673–4680 CrossRef PubMed.
- S. Kondo, J. Z. Xiao, T. Satoh, T. Odamaki, S. Takahashi, H. Sugahara, T. Yaeshima, K. Iwatsuki, A. Kamei and K. Abe, Antiobesity effects of Bifidobacterium breve strain B-3 supplementation in a mouse model with high-fat diet-induced obesity, Biosci., Biotechnol., Biochem., 2010, 74, 1656–1661 CrossRef CAS.
- F. Turroni, E. Foroni, P. Pizzetti, V. Giubellini, A. Ribbera, P. Merusi, P. Cagnasso, B. Bizzarri, G. L. De'Angelis, F. Shanahan, S. D. van and M. Ventura, Exploring the diversity of the bifidobacterial population in the human intestinal tract, Appl. Environ. Microbiol., 2009, 75, 1534–1545 CrossRef CAS PubMed.
- E. Lonnermark, F. Nowrouzinan, I. Adlerberth, S. Ahrne, A. Wold and V. Friman, Oral and faecal lactobacilli and their expression of mannose-specific adhesins in individuals with and without IgA deficiency, Int. J. Med. Microbiol., 2012, 302, 53–60 CrossRef PubMed.
- K. Matsuda, H. Tsuji, T. Asahara, K. Matsumoto, T. Takada and K. Nomoto, Establishment of an analytical system for the human fecal microbiota, based on reverse transcription-quantitative PCR targeting of multicopy rRNA molecules, Appl. Environ. Microbiol., 2009, 75, 1961–1969 CrossRef CAS PubMed.
- L. Dethlefsen, S. Huse, M. L. Sogin and D. A. Relman, The pervasive effects of an antibiotic on the human gut microbiota, as revealed by deep 16S rRNA sequencing, PLoS Biol., 2008, 6, e280 Search PubMed.
- H. Sokol, B. Pigneur, L. Watterlot, O. Lakhdari, L. G. Bermudez-Humaran, J. J. Gratadoux, S. Blugeon, C. Bridonneau, J. P. Furet, G. Corthier, C. Grangette, N. Vasquez, P. Pochart, G. Trugnan, G. Thomas, H. M. Blottiere, J. Dore, P. Marteau, P. Seksik and P. Langella, Faecalibacterium prausnitzii is an anti-inflammatory commensal bacterium identified by gut microbiota analysis of Crohn disease patients, Proc. Natl. Acad. Sci. U. S. A., 2008, 105, 16731–16736 CrossRef CAS PubMed.
- M. C. Collado, M. Derrien, E. Isolauri, W. M. de Vos and S. Salminen, Intestinal integrity and Akkermansia muciniphila, a mucin-degrading member of the intestinal microbiota present in infants, adults, and the elderly, Appl. Environ. Microbiol., 2007, 73, 7767–7770 CrossRef CAS PubMed.
- A. Everard, C. Belzer, L. Geurts, J. P. Ouwerkerk, C. Druart, L. B. Bindels, Y. Guiot, M. Derrien, G. G. Muccioli, N. M. Delzenne, W. M. de Vos and P. D. Cani, Cross-talk between Akkermansia muciniphila and intestinal epithelium controls diet-induced obesity, Proc. Natl. Acad. Sci. U. S. A., 2013, 110, 9066–9071 CrossRef CAS PubMed.
- D. L. Worthley, R. K. Le Leu, V. L. Whitehall, M. Conlon, C. Christophersen, D. Belobrajdic, K. A. Mallitt, Y. Hu, N. Irahara, S. Ogino, B. A. Leggett and G. P. Young, A human, double-blind, placebo-controlled, crossover trial of prebiotic, probiotic, and synbiotic supplementation: effects on luminal, inflammatory, epigenetic, and epithelial biomarkers of colorectal cancer, Am. J. Clin. Nutr., 2009, 90, 578–586 CrossRef CAS PubMed.
- D. L. Topping and P. M. Clifton, Short-chain fatty acids and human colonic function: roles of resistant starch and nonstarch polysaccharides, Phys. Rev., 2001, 81, 1031–1064 CAS.
- Y. Chung, C. Hsu, C. Ko and Y. Chan, Dietary intake of xylooligosaccharides improves the intestinal microbiota, fecal moisture, and pH value in the elderly, Nutr. Res., 2007, 27, 756–761 CrossRef CAS PubMed.
- F. Briet, L. Achour, B. Flourie, L. Beaugerie, P. Pellier, C. Franchisseur, F. Bornet and J. C. Rambaud, Symptomatic response to varying levels of fructo-oligosaccharides consumed occasionally or regularly, Eur. J. Clin. Nutr., 1995, 49, 501–507 CAS.
- T. Stone-Dorshow and M. D. Levitt, Gaseous response to ingestion of a poorly absorbed fructo-oligosaccharide sweetener, Am. J. Clin. Nutr., 1987, 46, 61–65 CAS.
| This journal is © The Royal Society of Chemistry 2014 |