 Open Access Article
 This Open Access Article is licensed under a
 Creative Commons Attribution 3.0 Unported Licence
Reduced graphene oxide and graphene composite materials for improved gas sensing at low temperature†
Alexander
Zöpfl
a,
Michael-Maximilian
Lemberger
a,
Matthias
König
b,
Guenther
Ruhl
b,
Frank-Michael
Matysik
a and
Thomas
Hirsch
*a
aInstitute of Analytical Chemistry, Chemo- and Biosensors, University of Regensburg, Universitaetsstrasse 31, 93053 Regensburg, Germany. E-mail: alexander.zoepfl@ur.de; michael.lemberger@ur.de; frank-michael.matysik@ur.de; thomas.hirsch@ur.de
bInfineon Technologies AG, 93049 Regensburg, Germany. E-mail: Guenther.Ruhl@infineon.com; Matthias.Koenig@infineon.com
First published on 27th June 2014
Abstract
Reduced graphene oxide (rGO) was investigated as a material for use in chemiresistive gas sensors. The carbon nanomaterial was transferred onto a silicon wafer with interdigital gold electrodes. Spin coating turned out to be the most reliable transfer technique, resulting in consistent rGO layers of reproducible quality. Fast changes in the electrical resistance at a low operating temperature of 85 °C could be detected for the gases NO2, CH4 and H2. Especially upon adsorption of NO2 the high signal changes allowed a minimum detection of 0.3 ppm (S/N = 3). To overcome the poor selectivity, rGO was chemically functionalized with octadecylamine, or modified by doping with metal nanoparticles such as Pd and Pt, and also metal oxides such as MnO2, and TiO2. The different response patterns for six different materials allowed the discrimination of all of the test gases by pattern recognition based on principal component analysis.
1 Introduction
The simple and reliable monitoring of gas concentrations is important in everyday-life. In industrial processes hazardous gases need to be controlled to guarantee safety. Controlling air quality can save energy in automated air conditioning. Also the detection of environmental pollution (like NOx) is of great interest.1 Up to now, solid-state gas sensors based on metal oxide chemiresistors are well established and widely used in detecting gases.2,3 They are operated at high temperatures,4 which consumes excessive energy and limits their long-term stability, thus leading to the development of new gas sensor concepts which overcome these drawbacks. In the last decade carbon nanomaterials, like carbon nanotubes5,6 or graphene,7–10 were shown to be capable of gas detection due to their high sensitivity to various gases even at low operating temperatures. Especially graphene has recently attracted intense attention because of its high charge carrier mobility (15![[thin space (1/6-em)]](https://www.rsc.org/images/entities/char_2009.gif) 000 cm2 V−1 s−1 under ambient conditions) and large surface area as a consequence of having a thickness of only one atom and the absence of any bulk phase.11,12
000 cm2 V−1 s−1 under ambient conditions) and large surface area as a consequence of having a thickness of only one atom and the absence of any bulk phase.11,12
Many different preparation methods for graphene are known so far, but only a few of them are applicable in terms of sensor preparation. Chemically derived graphene obtained by the reduction of graphene oxide (GO)13,14 is inexpensive and the synthesis is easily scalable. Due to a more defective structure its electrical properties are not as outstanding as those of pristine graphene,15,16 but are still suitable for sensitive gas detection.17 It has also been described that graphene with a more defective structure shows an improved adsorption of gas molecules.18 Furthermore, reduced graphene oxide (rGO) can be dispersed in solutions, simplifying the transfer to a sensor set-up by e.g. spraying, printing and casting methods.19,20
Similar to solid state gas sensors, gas adsorption on graphene leads to a change in its electrical resistance (Fig. 1). Therefore, any kind of interaction between graphene sheets and adsorbates influences the electronic structure of the graphene, leading to an altered charge carrier concentration or electrical conductance of the material, respectively.17,21 Nevertheless, up to now most of such sensor concepts have been demonstrated only in inert gas mixtures or at elevated temperatures. For any practical application it is necessary to overcome the limitations of poor selectivity.7 Many works address this issue by chemically modifying the carbon material with functional groups or doping with metals and metal oxides. Graphene composite materials have been used in many different sensing applications and can be easily produced either by simply mixing two different materials together or by in situ nanoparticle growth on graphene in a suspension.22–24
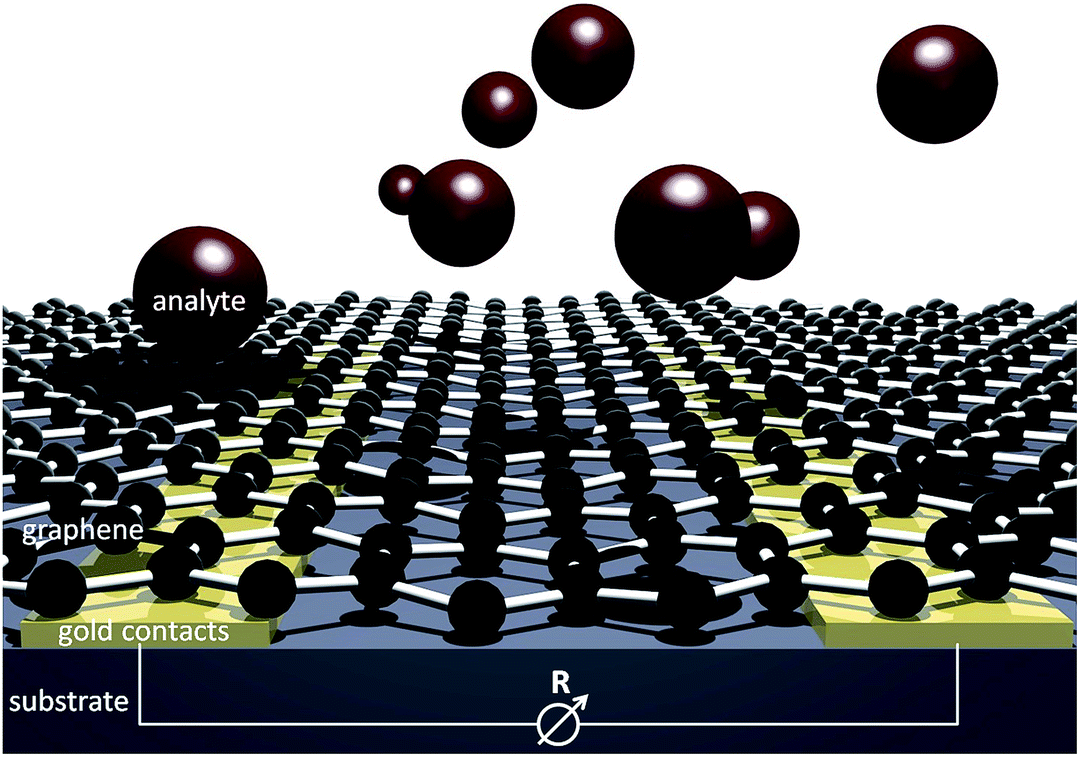 | ||
| Fig. 1 Scheme of the principle of chemiresistor gas sensors based on graphene. | ||
Here we report on rGO as a sensitive material for gas detection and the possibilities of functionalization to introduce selectivity. Reduced graphene oxide was prepared by the chemical reduction of GO, which was obtained from the oxidation of graphite. The resulting product can be dispersed in water, enabling an easy transfer to pre-structured microelectrodes comprising an interdigital structure. Application of rGO via spin coating was optimized and resulted in consistent layers of reproducible quality in terms of the electrical properties. The conductance of such modified electrodes was measured in the presence of various gases diluted in synthetic air (NO2, CH4, and H2) at moderate temperatures (85 °C). Chemical modifications were applied by the insertion of functional groups and by doping with metals and metal oxides. The resulting materials were characterized and tested for their gas sensing behaviour. It was demonstrated that a combination of simple modifications of rGO can lead to sensors with different characteristics, allowing a pattern detection of various gases.
2 Experimental
2.1 Materials and instrumentation
Unless otherwise stated, all chemicals were purchased from Merck (Darmstadt, Germany) or Sigma-Aldrich (Steinheim, Germany) and used without further purification. Ultra-pure water (0.055 μS cm−1) was used in all experiments. All gases and mixtures were purchased from Linde AG.Raman spectra were recorded on a Thermo Scientific DXR Raman microscope with a 532 nm excitation laser (10 mW). Scanning electron microscopy (SEM) was performed with a Zeiss Ultra 55, EDX on a JOEL JSM-6700F and TGA-FTIR with a Netzsch Iris TG209 connected to a Bruker Equinox 55, all at Infineon Technologies AG Regensburg. Transmission electron microscopy (TEM) was performed using a 120 kV Philips CM12 microscope.
2.2 Synthesis of reduced graphene oxide and modifications
GO was synthesized using a slightly modified Hummers method.13 Briefly, 100 mg graphite (China flake graphite, K. W. Thielmann & Cie KG) was mixed with 75 mg NaNO3, 7.5 mL conc. H2SO4 and 450 mg KMnO4. The mixture was sonicated for 3 h and stirred for 3 days at room temperature. Subsequently, 7.5 mL of 5% H2SO4 was added and the mixture was stirred under reflux for 2 h at 100 °C, followed by the addition of 1.5 mL of 30% H2O2 under constant stirring for 1 h at room temperature. For purification the obtained GO was washed with the following solutions: four times in 3% H2SO4 with 0.5% H2O2; two times in 3% HCl; and three times in water. The product was dialyzed against water (14 kDa cut-off) for 10 days.To obtain rGO,14 7 mL of a GO suspension (0.5 mg mL−1) was mixed with 31 μL NH3 (32% in water). After adding 5 μL of 98% hydrazine hydrate the reaction mixture was refluxed for 1 h at 100 °C. Finally the resulting black suspension was washed with water.
Modification with octadecylamine
To modify rGO with octadecylamine (ODA), the synthesis of surface functionalized graphene by Wang et al. was adapted.25 5 mg GO was suspended in 5 mL dichlorobenzene. After adding 50 mg ODA, the reaction mixture was sonicated for 24 h at 80 °C. To get rid of excess ODA and dichlorobenzene, the reaction mixture was treated with 40 mL ethanol resulting in a black precipitate. The mixture was centrifuged and the resulting solid was washed twice with ethanol and toluene. This washing step was repeated once more and the product (rGO–ODA) was dried in air.Modification with MnO2
A synthesis for GO–MnO2 nano composites was adapted.26 5.1 mg GO and 21 mg MnCl2·4H2O were dispersed in 5 mL isopropanol and sonicated for 30 min. The reaction mixture was refluxed at 83 °C under vigorous stirring. Afterwards a solution of 12 mg KMnO4 in 0.4 mL water was added and the slurry was refluxed at 83 °C for another 30 min before it was cooled to room temperature. The nano composite was then centrifuged and washed twice with water. The resulting brown product (rGO–MnO2) was dried at 60 °C overnight.Modification with TiO2
For the functionalization of carbon nanomaterials Li et al. have reported the modification of single-walled carbon nanotubes with TiO2.27 In an analogous way rGO was modified with TiO2 (rGO–TiO2): 1 mg of TiO2 with an average particle size of 1 μm was ground thoroughly. Subsequently the powder was dispersed in 2 mL water, sonicated for 1 h and 1 mL of an aqueous rGO suspension (0.5 mg mL−1) was added. After another sonication for 1 h a grey suspension was formed where the modified rGO flakes tended to aggregate.Modification with Pd and Pt nanoparticles
Both approaches were adapted from the preparation of graphene–metal nanocomposites by Xu et al. and modified slightly.28 5 mL of a GO suspension (1 mg mL−1) was mixed with 10 mL ethylene glycol. Afterwards 0.5 mL of a 0.01 M solution of a metal precursor (K2PtCl4 or PdCl2) in water was added and the mixture was first stirred for 30 min at room temperature and then for 6 h at 100 °C. During the heating in both cases the colour became black indicating that the GO had been reduced by ethylene glycol. The resulting suspensions containing the metal doped carbon nanomaterials (rGO–Pd and rGO–Pt) were centrifuged for 5 min at 3000 rpm and washed three times with water.2.3 Electrode preparation
Suspensions of rGO and the modifications were deposited on gold microelectrodes (Fig. 2) via spin coating. The respective suspensions in a 1:1-mixture of water and isopropanol (0.25 mg mL−1) were sonicated for 10 min before 2 μL of each was spin coated onto the interdigital electrode structure with a Laurell WS-400BZ-6NPP/LITE spin coater (5 s at 500 rpm and 20 s at 3000 rpm). Afterwards the electrodes were heated to approximately 230 °C for 30 s on a hot plate.
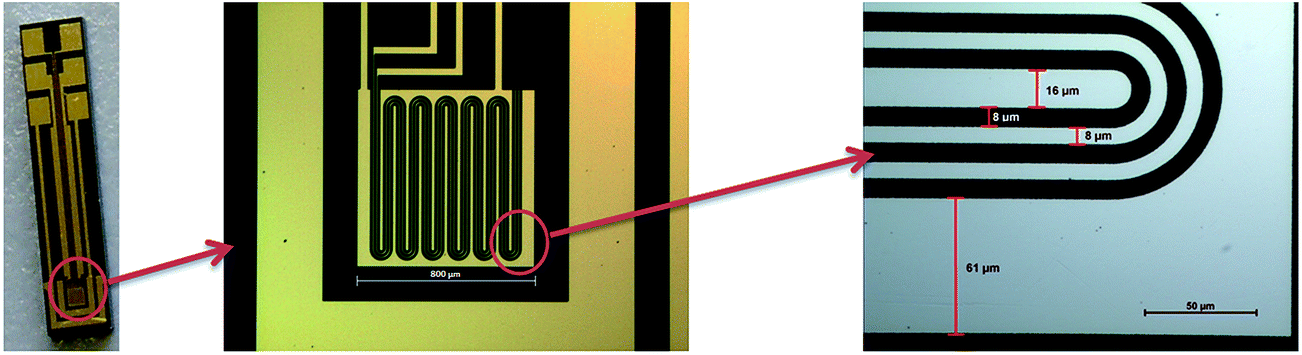 | ||
| Fig. 2 Microelectrodes with an interdigital structure consisting of gold conducting paths on a Si/SiO2 wafer substrate. | ||
2.4 Gas measurements
Gas measurements were performed on a homemade gas mixing device, consisting of mass flow controllers (UFC-8160A and UFC-1660 from Unit Instruments Inc.), a flow cell with temperature control by two heating elements, and a Pt-100 temperature sensor (Fig. SI 1†).Measurement of the electrical resistance was accomplished by contacting the two gold conducting paths in the mid-position of the interdigital electrode structure (Fig. 2) using a Keithley 2400 sourcemeter at a constant bias voltage of 50 mV. Synthetic air (N2: 80%, O2: 20%) was used as the carrier gas and was mixed with 300 ppm NO2, 1% H2 or 1% CH4. The test gases were all diluted by the synthetic air. Furthermore the gas adsorption tests were accomplished at a constant gas flow of 100 sccm (300 sccm for the concentration dependency of NO2) and a constant temperature of 85 °C. It was also necessary to heat the electrodes for 20 s at 230 °C before each measurement, ensuring that no analyte gas had been previously adsorbed by reaching the initial resistance. For measuring the influence of air humidity, the gas flow was piped through the head space of a flask containing water.
3 Results and discussion
3.1 Choice of materials and sensor fabrication
The transfer of graphene materials is still the most critical step in sensor preparation using this type of carbon nanomaterial. Graphene prepared by e.g. the CVD technique29 requires a sophisticated transfer method of the carbon nanomaterial from the metallic substrate to the substrate of choice. This can be done e.g. by a transfer with stamping methods,30 which leads to contamination of the graphene and therefore such processes lack reproducibility. In contrast, rGO suspensions can be easily processed. Reduced graphene is usually transferred to electrodes by drop casting, which results in layers of inhomogeneous thickness and low reproducibility. The sensitivity of chemoresistors strongly depends on the thickness of the conductive layer. Therefore we used an interdigital electrode structure which was covered with a thin layer of rGO via spin coating. Parameters affecting the spin coating, such as the concentration of rGO, the rotation speed and time, as well as the usage of certain additives like isopropanol for improving the spreading of the suspension were optimized to obtain consistent layers with reproducible total resistance.3.2 Characterization of the microelectrodes modified with reduced graphene oxide and composite materials
Graphene oxide was prepared by a modified Hummers method and reduced with hydrazine as reported previously.14 The size of the graphene flakes ranged from 100 nm to about 1 μm as indicated by SEM studies (Fig. SI 2a†). The Raman spectrum of rGO (Fig. 3a) exhibits the typical broad D and G bands at 1342 cm−1 and 1602 cm−1.31 The D/G ratio and position of the G band indicates crystalline domains of several nanometers in size.32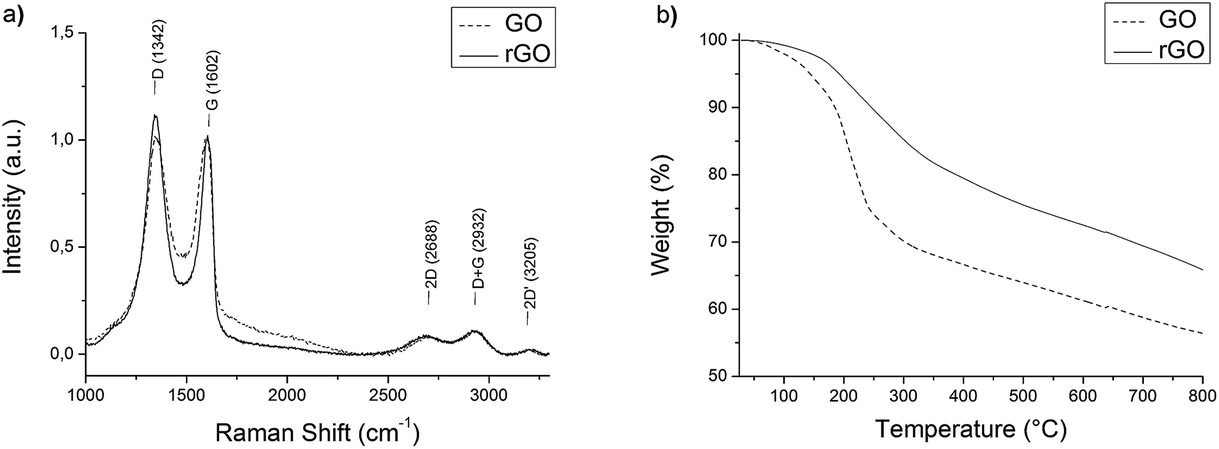 | ||
| Fig. 3 (a) Raman spectra and (b) thermogravimetric analysis of GO and rGO. | ||
Regarding the thermogravimetric analysis (TGA) of GO and rGO (Fig. 3b), a loss of mass can be observed at temperatures of about 200 °C. In FTIR-TGA (Fig. SI 3†) this effect can be ascribed to a thermal reduction, where CO and CO2 are released.33 Graphene oxide loses about 25% of its mass, while rGO loses around 15%, which shows that the reduction by hydrazine is incomplete.
Further, the rGO modified electrodes were heated to 230 °C to guarantee a thermal reduction. During this step the electrical resistance dropped from about 8.0 ± 3.8 MΩ to 180 ± 78 kΩ. The oxidation process of graphite introduces many defects into the sp2 structure which act like a barrier for the electron flux, resulting in better conductance at higher levels of reduction.34
Functionalization of rGO was performed by wet chemical methods before the composite material was also transferred to the microelectrodes. Generally all dopants primarily bind/coordinate with the oxygen functionalities of rGO. Whereas ODA reacts most probably with the epoxy groups of GO,25 doping with metals and metal oxides usually includes the interaction of a precursor metal ion with the carboxyl groups of rGO.28,35 The successful modification of rGO was revealed by Raman studies. Peaks at 1125 and 1489 cm−1 (ODA), 140, 392, 510 and 644 cm−1 (TiO2), and 579 and 633 cm−1 (MnO2) were found (Fig. SI 4†). Graphene composites with conductive Pt- and Pd-nanoparticles could be observed on distinct regions of rGO in SEM and TEM images. The average particle size was below 20 nm (Fig. SI 5 and SI 6†). The elemental composition of the different modified materials was confirmed using energy-dispersive X-ray spectroscopy (EDS) (Fig. SI 7†).
Covalent attachment of functional groups36 or doping with metals and metal oxides37 may change the electronic structure and level of n-/p-doping within the material, but may also increase the sensor surface or have a catalytic effect on gas adsorption.
3.3 Gas sensor response
To assess the effect of gas adsorption on the conductance of rGO, the electrical resistance of the coated microelectrodes was measured for different gases of various concentrations. To ensure realistic conditions, a test gas was mixed with a constant flow of synthetic air. An operating temperature of 85 °C was chosen to exclude the influence of humidity on the response of the sensor (Fig. SI 8†). Furthermore, heating to 85 °C improved the response time (<1 min), and an increase in the signal change and recovery rate was found. Fig. 4 displays the change of the relative resistance (R/R0) in the presence of different concentrations of NO2. R0 is hereby the initial resistance right before the addition of a test gas.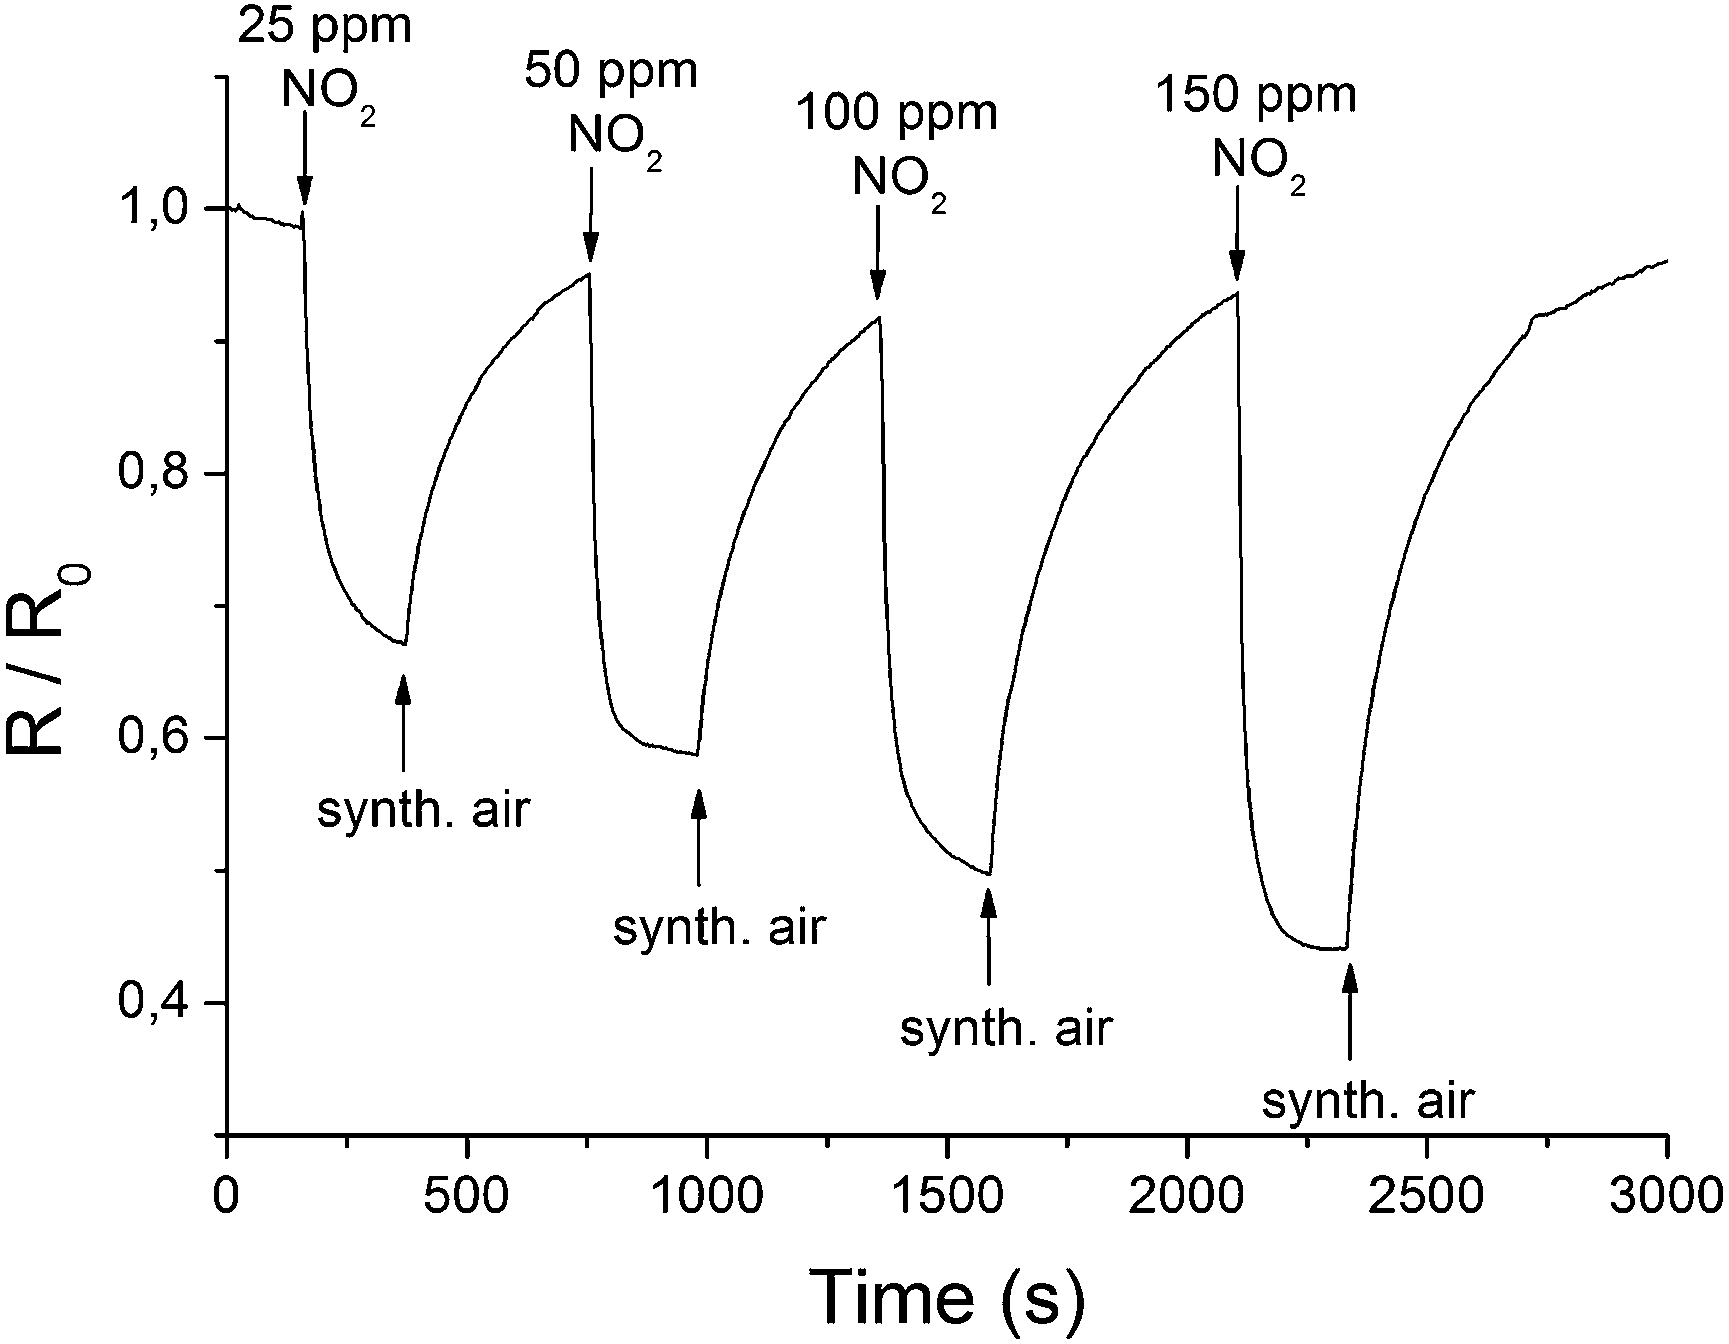 | ||
| Fig. 4 Changes in the electrical resistance of a rGO layer at 85 °C in the presence of different concentrations of NO2. | ||
The reversibility and concentration dependence of the sensor was evaluated by continuous adsorption and desorption of the different gases. The results for NO2 are shown in Fig. 4, and the changes in conductivity for other gases are listed in Table 1. A linear behaviour within the applied concentration range (25–150 ppm), a sensitivity of 0.56 ppm−1 and a detection limit of 0.3 ppm (S/N = 3) were observed for NO2. In contrast to the signal drop for NO2, the adsorption of H2 and CH4 led to an increase in electrical conductance. The electron withdrawing effect of the adsorbed NO2 leads to more positive charge carriers since rGO is described to show a p-type semiconducting behaviour.16,38 Gases such as H2 or CH4 cannot act as electron donors or acceptors. It can be assumed that previously physisorbed molecules from synthetic air (most probably oxygen) at the surface of the graphene are replaced by H2 or CH4, leading to an increase in electrical resistance.39,40
| Signal [R/R0] | ||||||
|---|---|---|---|---|---|---|
| Gases | rGO | rGO–ODA | rGO–TiO2 | rGO–MnO2 | rGO–Pd | rGO–Pt |
| 150 ppm NO2 | 0.419 | 0.436 | 0.718 | 0.929 | 0.358 | 0.758 |
| 125 ppm NO2 | 0.430 | 0.437 | 0.733 | 0.958 | 0.387 | 0.810 |
| 100 ppm NO2 | 0.445 | 0.442 | 0.751 | 0.959 | 0.441 | 0.840 |
| 75 ppm NO2 | 0.494 | 0.456 | 0.768 | 0.969 | 0.461 | 0.849 |
| 50 ppm NO2 | 0.545 | 0.481 | 0.773 | 0.971 | 0.489 | 0.861 |
| 25 ppm NO2 | 0.578 | 0.559 | 0.801 | 0.974 | 0.607 | 0.870 |
| 5000 ppm H2 | 1.035 | 1.037 | 1.026 | 1.017 | 1.615 | 1.135 |
| 3000 ppm H2 | 1.025 | 1.027 | 1.011 | 1.012 | 1.508 | 1.095 |
| 1000 ppm H2 | 1.012 | 1.004 | 1.004 | 1.010 | 1.188 | 1.049 |
| 500 ppm H2 | 1.005 | 1.000 | 1.001 | 1.004 | 1.114 | 1.011 |
| 10000 ppm CH4 |
1.033 | 1.069 | 1.021 | 1.022 | 1.029 | 1.023 |
| 5000 ppm CH4 | 1.023 | 1.048 | 1.012 | 1.019 | 1.019 | 1.016 |
| 3000 ppm CH4 | 1.015 | 1.021 | 1.008 | 1.010 | 1.010 | 1.010 |
| 1000 ppm CH4 | 1.006 | 1.004 | 1.000 | 1.006 | 1.005 | 1.002 |
These results clearly demonstrate that rGO on the one hand is an excellent sensor material for detecting gases. In contrast to metal oxide sensors, which are the most common gas sensors so far, sensors based on graphene can be operated at low temperatures with fast response times. On the other hand it is demonstrated that graphene based sensors lack selectivity. Nearly all adsorbates will result in signal changes, therefore they only can be used in detecting analytes in an atmosphere of inert gases.41–48 To overcome this drawback graphene itself may be doped by nitrogen, as was theoretically calculated by Ma et al.49 Another possibility is to functionalize graphene or to create graphene nanocomposites.50,51
Chemical insertion of ODA led to slightly increased signal changes towards H2 and CH4. For NO2 detection almost no influence of the modification could be found. The composite material with TiO2 showed unaffected behaviour towards H2 and CH4, but a lower response towards NO2. This indicates that the adsorption sites for NO2 may be blocked. Electrodes coated with rGO which was doped with MnO2 showed almost no signal change for all of the utilized gases. Therefore, this modification could only be used as a reference signal to compensate for small fluctuations in temperature. The most significant change in response was achieved by chemical doping with Pd- and Pt-nanoparticles. The resulting composite materials showed an increased sensitivity towards H2 (Fig. SI 9b†). The same observations with comparable results have been made with carbon nanotubes decorated with Pt and multilayered graphene nanoribbons doped with Pd.24,52 Though the composite material with rGO is easier to produce and process.
In summary, all of the composites of rGO presented here are simple to prepare and show different behaviour in their electrical conductance in the presence of various gases. The sensor responses of different functionalized rGO materials towards NO2, H2 and CH4 (Fig. 5) are summarized in Table 1.
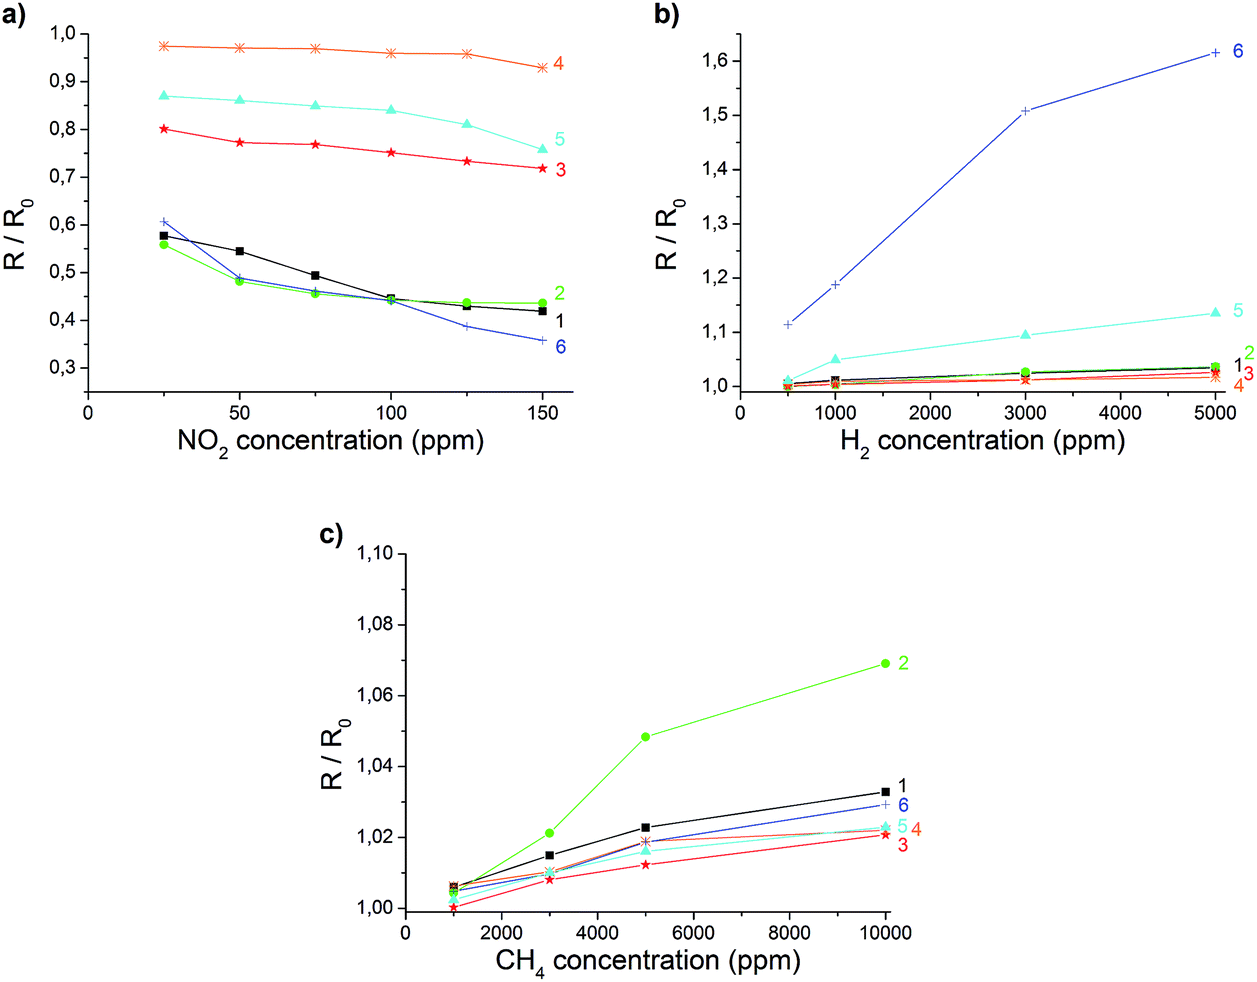 | ||
| Fig. 5 Changes in electrical resistance of rGO (1) and graphene composites (2 to 6) for different concentrations of NO2 (a), H2 (b) and CH4 (c). The composites are rGO–ODA (2), rGO–TiO2 (3), rGO–MnO2 (4), rGO–Pt (5), and rGO–Pd (6). | ||
3.4 Principal component analysis for pattern recognition of different gases
The altered sensitivity of every sensor towards different analyte gases enables pattern recognition using multivariate analysis based on principal component analysis (PCA). With this chemometric technique it is possible to simplify multidimensional datasets without crucial loss of information. Here the data matrix (Table 1) contains the normalized sensor response of each sensor material to a certain gas and concentration. This multidimensional matrix can be reduced to two principle components (PC1, PC2). The variance of PC1 (95.75%) and PC2 (2.94%) is above 98% and therefore these components already contain significant information to represent the data in two dimensions (Fig. 6). Clear separation between the clusters representing individual gases with no overlap and a recognizable trend of concentration allows the identification of all analytes with a set of six different electrodes.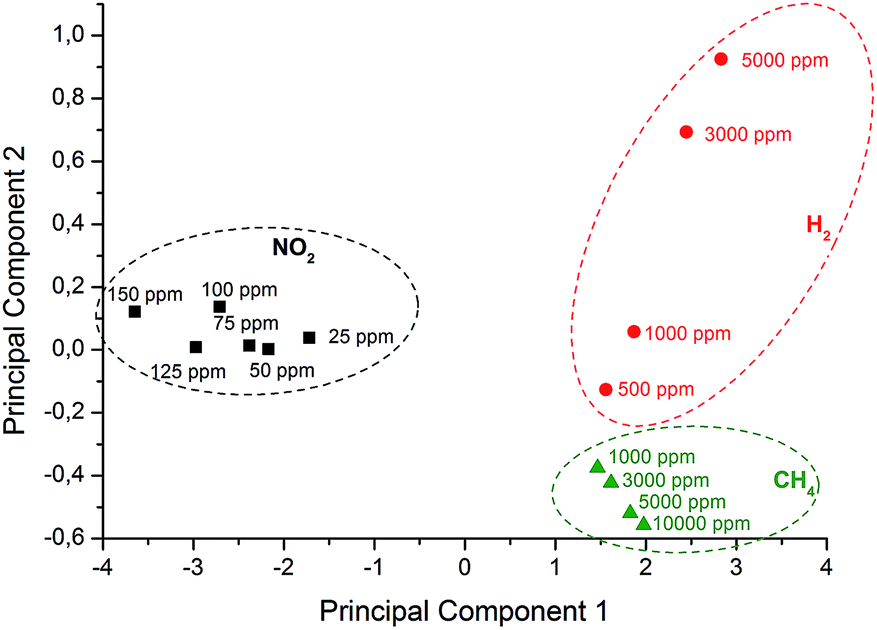 | ||
| Fig. 6 Pattern analysis based on PCA using six different sensors (modified with rGO, rGO–ODA, rGO–TiO2, rGO–MnO2, rGO–Pd, and rGO–Pt) for various concentrations of individual gases (NO2, H2, and CH4). | ||
Regeneration of the sensor material still has to be further investigated. In this study the regeneration was mostly performed by a short term heat treatment at 230 °C between measurements. Furthermore this step ensures the complete desorption of any physisorbed impurities as demonstrated by the TGA measurements. In an application this could be realized by different operation temperatures with short regeneration cycles.
4 Conclusion
Reduced graphene oxide is an ideal sensor material for chemiresistive gas sensors due to its simple preparation and functionalization enabling altered sensitivities. Compared to commercial solid state gas sensors, rGO sensors have the advantage of operating at the low temperature of 85 °C to exclude the strong influences of humidity. It was demonstrated that the spin coating of rGO composites results in reproducible sensor behaviour suitable for well established fabrication technologies. In a chemiresistor setup, unmodified rGO showed high sensitivity towards NO2 on the ppm level at ambient conditions. The sensor was rather unselective and also showed responses towards H2 and CH4. Upon different functionalizations it was possible to achieve different sensor behaviors for different gases. This can be used to apply PCA to discriminate between each individual gas. It is expected that this approach could be extended to build up sensor arrays for detecting the concentration of many individual gases in a complex matrix at low temperatures.Acknowledgements
This work has been supported by Infineon Technologies AG, Regensburg. The authors thank Stefan Wilhelm and Christoph Fenzl for TEM studies and Gerhard Poeppel for the help with PCA.References
- J. M. Samet, Inhalation Toxicol., 2007, 19, 1021–1027 CrossRef CAS PubMed.
- P. T. Moseley, Meas. Sci. Technol., 1997, 8, 223–237 CrossRef CAS.
- G. Korotcenkov, Mater. Sci. Eng., B, 2007, 139, 1–23 CrossRef CAS PubMed.
- A. Tricoli, M. Righettoni and A. Teleki, Angew. Chem., Int. Ed., 2010, 49, 7632–7659 CrossRef CAS PubMed.
- P. Bondavalli, P. Legagneux and D. Pribat, Sens. Actuators, B, 2009, 140, 304–318 CrossRef CAS PubMed.
- S. Mao, G. Lu and J. Chen, J. Mater. Chem. A, 2014, 2, 5573–5579 CAS.
- F. Schedin, A. K. Geim, S. V. Morozov, E. W. Hill, P. Blake, M. I. Katsnelson and K. S. Novoselov, Nat. Mater., 2007, 6, 652–655 CrossRef CAS PubMed.
- W. Yuan and G. Shi, J. Mater. Chem. A, 2013, 1, 10078–10091 CAS.
- S. Basu and P. Bhattacharyya, Sens. Actuators, B, 2012, 173, 1–21 CrossRef CAS PubMed.
- Q. He, S. Wu, Z. Yin and H. Zhang, Chem. Sci., 2012, 3, 1764–1772 RSC.
- A. K. Geim and K. S. Novoselov, Nat. Mater., 2007, 6, 183–191 CrossRef CAS PubMed.
- C. Soldano, A. Mahmood and E. Dujardin, Carbon, 2010, 48, 2127–2150 CrossRef CAS PubMed.
- W. S. Hummers Jr and R. E. Offeman, J. Am. Chem. Soc., 1958, 80, 1339–1339 CrossRef.
- D. Li, M. B. Müller, S. Gilje, R. B. Kaner and G. G. Wallace, Nat. Nanotechnol., 2008, 3, 101–105 CrossRef CAS PubMed.
- C. Gómez-Navarro, R. T. Weitz, A. M. Bittner, M. Scolari, A. Mews, M. Burghard and K. Kern, Nano Lett., 2007, 7, 3499–3503 CrossRef PubMed.
- S. Gilje, S. Han, M. Wang, K. L. Wang and R. B. Kaner, Nano Lett., 2007, 7, 3394–3398 CrossRef CAS PubMed.
- J. T. Robinson, F. K. Perkins, E. S. Snow, Z. Wei and P. E. Sheehan, Nano Lett., 2008, 8, 3137–3140 CrossRef CAS PubMed.
- Y.-H. Zhang, Y.-B. Chen, K.-G. Zhou, C.-H. Liu, J. Zeng, H.-L. Zhang and Y. Peng, Nanotechnology, 2009, 20, 185504 CrossRef PubMed.
- G. Eda, G. Fanchini and M. Chhowalla, Nat. Nanotechnol., 2008, 3, 270–274 CrossRef CAS PubMed.
- Y. Xu and G. Shi, J. Mater. Chem., 2011, 21, 3311–3323 RSC.
- O. Leenaerts, B. Partoens and F. M. Peeters, Phys. Rev. B: Condens. Matter Mater. Phys., 2008, 77, 125416 CrossRef.
- S. Mao, S. Cui, G. Lu, K. Yu, Z. Wen and J. Chen, J. Mater. Chem., 2012, 22, 11009–11013 RSC.
- Q. Huang, D. Zeng, H. Li and C. Xie, Nanoscale, 2012, 4, 5651–5658 RSC.
- J. L. Johnson, A. Behnam, S. J. Pearton and A. Ural, Adv. Mater., 2010, 22, 4877–4880 CrossRef CAS PubMed.
- S. Wang, P.-J. Chia, L.-L. Chua, L.-H. Zhao, R.-Q. Png, S. Sivaramakrishnan, M. Zhou, R. G.-S. Goh, R. H. Friend, A. T.-S. Wee and P. K.-H. Ho, Adv. Mater., 2008, 20, 3440–3446 CrossRef CAS.
- S. Chen, J. Zhu, X. Wu, Q. Han and X. Wang, ACS Nano, 2010, 4, 2822–2830 CrossRef CAS PubMed.
- X. Li, J. Niu, J. Zhang, H. Li and Z. Liu, J. Phys. Chem. B, 2003, 107, 2453–2458 CrossRef CAS.
- C. Xu, X. Wang and J. Zhu, J. Phys. Chem. C, 2008, 112, 19841–19845 CAS.
- S. Bae, H. Kim, Y. Lee, X. Xu, J.-S. Park, Y. Zheng, J. Balakrishnan, T. Lei, H. Ri Kim, Y. I. Song, Y.-J. Kim, K. S. Kim, B. Özyilmaz, J.-H. Ahn, B. H. Hong and S. Iijima, Nat. Nanotechnol., 2010, 5, 574–578 CrossRef CAS PubMed.
- K. S. Kim, Y. Zhao, H. Jang, S. Y. Lee, J. M. Kim, K. S. Kim, J.-H. Ahn, P. Kim, J.-Y. Choi and B. H. Hong, Nature, 2009, 457, 706–710 CrossRef CAS PubMed.
- S. Stankovich, D. A. Dikin, R. D. Piner, K. A. Kohlhaas, A. Kleinhammes, Y. Jia, Y. Wu, S. T. Nguyen and R. S. Ruoff, Carbon, 2007, 45, 1558–1565 CrossRef CAS PubMed.
- M. A. Pimenta, G. Dresselhaus, M. S. Dresselhaus, L. G. Cançado, A. Jorio and R. Saito, Phys. Chem. Chem. Phys., 2007, 9, 1276 RSC.
- I. Jung, D. A. Field, N. J. Clark, Y. Zhu, D. Yang, R. D. Piner, S. Stankovich, D. A. Dikin, H. Geisler, C. A. Ventrice and R. S. Ruoff, J. Phys. Chem. C, 2009, 113, 18480–18486 CAS.
- I. Jung, D. A. Dikin, R. D. Piner and R. S. Ruoff, Nano Lett., 2008, 8, 4283–4287 CrossRef CAS PubMed.
- J. Wöllenstein, M. Burgmair, G. Plescher, T. Sulima, J. Hildenbrand, H. Böttner and I. Eisele, Sens. Actuators, B, 2003, 93, 442–448 CrossRef.
- K. P. Loh, Q. Bao, P. K. Ang and J. Yang, J. Mater. Chem., 2010, 20, 2277–2289 RSC.
- S. Bai and X. Shen, RSC Adv., 2012, 2, 64–98 RSC.
- J. D. Fowler, M. J. Allen, V. C. Tung, Y. Yang, R. B. Kaner and B. H. Weiller, ACS Nano, 2009, 3, 301–306 CrossRef CAS PubMed.
- M. Gautam and A. H. Jayatissa, Mater. Sci. Eng., C, 2011, 31, 1405–1411 CrossRef CAS PubMed.
- Y. Dan, Y. Lu, N. J. Kybert, Z. Luo and A. T. C. Johnson, Nano Lett., 2009, 9, 1472–1475 CrossRef CAS PubMed.
- H. Y. Jeong, D.-S. Lee, H. K. Choi, D. H. Lee, J.-E. Kim, J. Y. Lee, W. J. Lee, S. O. Kim and S.-Y. Choi, Appl. Phys. Lett., 2010, 96, 213105 CrossRef PubMed.
- J. L. Johnson, A. Behnam, S. J. Pearton and A. Ural, Adv. Mater., 2010, 22, 4877–4880 CrossRef CAS PubMed.
- J. Zou, L. J. Hubble, K. S. Iyer and C. L. Raston, Sens. Actuators, B, 2010, 150, 291–295 CrossRef CAS PubMed.
- B. H. Chu, C. F. Lo, J. Nicolosi, C. Y. Chang, V. Chen, W. Strupinski, S. J. Pearton and F. Ren, Sens. Actuators, B, 2011, 157, 500–503 CrossRef CAS PubMed.
- W. Li, X. Geng, Y. Guo, J. Rong, Y. Gong, L. Wu, X. Zhang, P. Li, J. Xu, G. Cheng, M. Sun and L. Liu, ACS Nano, 2011, 5, 6955–6961 CrossRef CAS PubMed.
- V. Tjoa, W. Jun, V. Dravid, S. Mhaisalkar and N. Mathews, J. Mater. Chem., 2011, 21, 15593–15599 RSC.
- W. Yuan, A. Liu, L. Huang, C. Li and G. Shi, Adv. Mater., 2013, 25, 766–771 CrossRef CAS PubMed.
- F. Zhang, F. M. Yasin, X. Chen, J. Mo, C. L. Raston and H. Zhang, RSC Adv., 2013, 3, 25166–25174 RSC.
- C. Ma, X. Shao and D. Cao, Sci. China: Chem., 2014, 57, 911–917 CrossRef CAS.
- Y. Yang, C. Tian, J. Wang, L. Sun, K. Shi, W. Zhou and H. Fu, Nanoscale, 2014, 6, 7369–7378 RSC.
- L. Huang, Z. Wang, J. Zhang, J. Pu, Y. Lin, S. Xu, L. Shen, Q. Chen and W. Shi, ACS Appl. Mater. Interfaces, 2014, 6, 7426–7433 CAS.
- A. Kaniyoor, R. I. Jafri, T. Arockiadoss and S. Ramaprabhu, Nanoscale, 2009, 1, 382–386 RSC.
Footnote |
| † Electronic supplementary information (ESI) available. See DOI: 10.1039/c4fd00086b |
| This journal is © The Royal Society of Chemistry 2014 |