 Open Access Article
 This Open Access Article is licensed under a Creative Commons Attribution-Non Commercial 3.0 Unported Licence
In situ Raman study of lithium-ion intercalation into microcrystalline graphite
Christopher
Sole
,
Nicholas E.
Drewett
and
Laurence J.
Hardwick
*
Stephenson Institute for Renewable Energy, Department of Chemistry, University of Liverpool, L69 7ZF, UK. E-mail: laurence.hardwick@liv.ac.uk
First published on 8th May 2014
Abstract
The first and second order Raman spectra of graphite during the first lithiation and delithiation have been investigated in a typical lithium-ion battery electrolyte. In situ, real-time Raman measurements under potential control enable the probing of the graphitic negative electrode surface region during ion insertion and extraction. The experimental results reveal the staging formation of a single particle within a free standing graphitic electrode. In particular, the in situ behaviour of the double resonance 2D band during the lithiation and delithiation of graphitic carbon has not been previously reported. The 2D band was observed to shift from 2681 to 2611 cm−1 and the band shape transformed into a single Lorentzian from 0.24 to 0.15 V vs. Li/Li+, providing further information on the electronic structure and C–C bonding of stage 3 and 4 graphite intercalation compounds. The behaviour of the 2D band is in keeping with the Daumas–Hérold model of electrochemically derived intercalation, where the graphene layers are flexible and deform around domains of intercalating lithium ions.
1 Introduction
Currently, the major challenge in lithium battery research is to develop systems with even greater power and energy densities.1–4 Improvements to battery properties will not only depend on the discovery of new materials, but also advances in the understanding of the surface and interfacial region of battery electrodes. Therefore gaining insight into the structure and chemical nature of these interfaces is of major importance.Investigations into electrode reactions are considerably improved when electrode/solution interface spectra can be recorded as the electrochemical response is obtained. In situ Raman spectroscopy is a convenient and non-destructive tool for studying lithiation/delithiation processes within numerous battery electrodes, and it has been utilised to characterise a number of insertion materials over the past couple of decades, as summarised by two recent review articles.5,6
Highly crystalline graphitic materials are routinely used as the negative electrode in lithium-ion batteries. Their positive features include a high, reversible specific charge of up to the theoretical value of 372 A h kg−1 (of carbon) for the formation of the donor graphite intercalation compound (GIC) LiC6, a good cycling stability (for portable electronic applications), a high electronic conductivity and low cost. However, problems persist with insufficient rate performance and electrode degradation over time. In addition, due to the low potential of intercalation (<0.2 V vs. Li/Li+), lithium plating is a major safety risk at high charge rates.
The staging process of lithium intercalation into carbon was observed in a typical Li-ion battery electrolyte by Inaba et al.7 during their pioneering in situ Raman microscopy studies. They observed that lithium intercalation proceeds through a series of staged graphite intercalation compounds (GICs), classified by a stage index, n, which represents the number of graphene layers separating the layers of intercalated ions. The Raman spectra for GICs with stage n > 2 are known to exhibit a doublet G band. The lower (E2g2(i)) and upper (E2g2(b)) frequency components are correspondingly associated with carbon-atom vibrations in interior graphite layers (not adjacent to the intercalate layer planes) and in bounding graphite layers (adjacent to the intercalate planes). The split in the E2g2 mode upon intercalation occurs primarily from changes in symmetry at the boundary layer, and secondarily from the electronic effects of the intercalate molecule. The E2g2(i) band disappears for stage 1 and 2, where no graphite interior layer exists.
A quantitative measure of the intercalation stage index, n, can be derived from the relative intensities of the Raman doublet, R, by the following equation:8
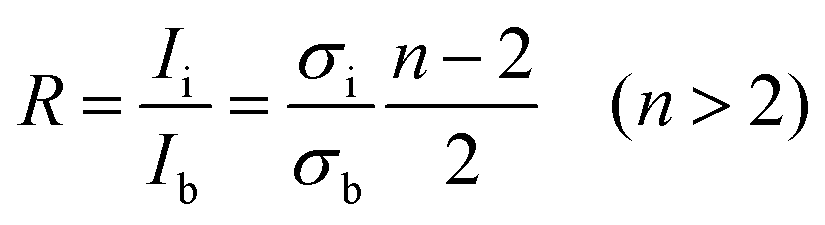 | (1) |
The staging process during lithium insertion into graphitic carbons had been previously proposed by Dahn et al.9 following detailed in situ powder X-ray diffraction (PXRD) studies. However, whilst PXRD probes the bulk electrode, Raman microscopy offers the ability to follow the processes of lithiation in individual carbon particles, or different areas of a single particle within the electrode.10–12
Improved understanding of electrochemical processes in functioning battery electrodes will require an insight into more localised lithiation mechanisms. Thus, a combination of surface and bulk characterisation is critical in realising the function of these materials under operating battery conditions.
Despite numerous in situ Raman studies of Li insertion into carbon,7,10–20 the effect on the 2D band has yet to be reported. The 2D band is the overtone of the D band. Whilst the D band requires the presence of defects for activation, the overtone originates from a process whereby momentum can always be conserved by two phonons with opposite wave vectors,21 hence the 2D band is always present. The 2D band (also referred to as G′ within the literature) has been used extensively in the research of sp2 carbons. It allows determination of the number and orientation of graphene layers in few layered graphene samples (1–5 layers),21 in addition to providing information on induced strain22–24 and charging/doping effects.25,26 In this study, we report on the behaviour of the 2D band during lithiation into microcrystalline graphite, in order to improve our understanding of both the model of Li+ intercalation and the electronic structure of GICs during lithium intercalation and extraction.
2 Experimental
2.1 Free-standing electrode film preparation
Synthetic microcrystalline graphite (6 μm average particle size), poly(vinylidene fluoride-hexafluoropropylene) co-polymeric binder (Kynar-flex, Arkema) and dibutyl phthalate (DBP, Aldrich) were dispersed in acetone and then cast onto glass at a thickness of 60 μm. Once dry, the free-standing film was removed from the glass plate with the dibutyl phthalate plasticiser extracted using diethyl ether, leaving a porous film ca. 50 μm thick, which was cut into 6 mm diameter electrodes. These were dried under vacuum at 90 °C, weighed and then transferred to an argon filled glovebox (O2, H2O < 1 ppm) for Raman cell assembly. The loadings of the electrodes were 5 mg cm−2, with a typical electrode mass being ca. 1.5 mg.2.2 In situ Raman cell
The electrodes were used as active material within an in situ Raman cell (ECC-Opto-Std, El-Cell) configured as shown in Fig. 1, and similar to cells used in previous studies.12,27 The cell is sealed to the atmosphere, enabling non-aqueous electrochemical processes to be investigated in situ. The aperture allows a Raman laser to be focussed upon the electrode's back surface during electrochemical cycling, so that Raman spectra may be obtained as a function of potential. The 3-electrode configuration was prepared by placing a small piece of Li metal at the tip of the reference electrode contact pin. Once the cell was sealed, a negative pressure was applied with an electrolyte-filled syringe in order to wet the separator with 1 M LiPF6 in EC–DMC electrolyte (BASF). The Raman cell was then hermetically sealed and removed from the glovebox, whereupon it was positioned atop the Raman microscope stage and connected to a potentiostat.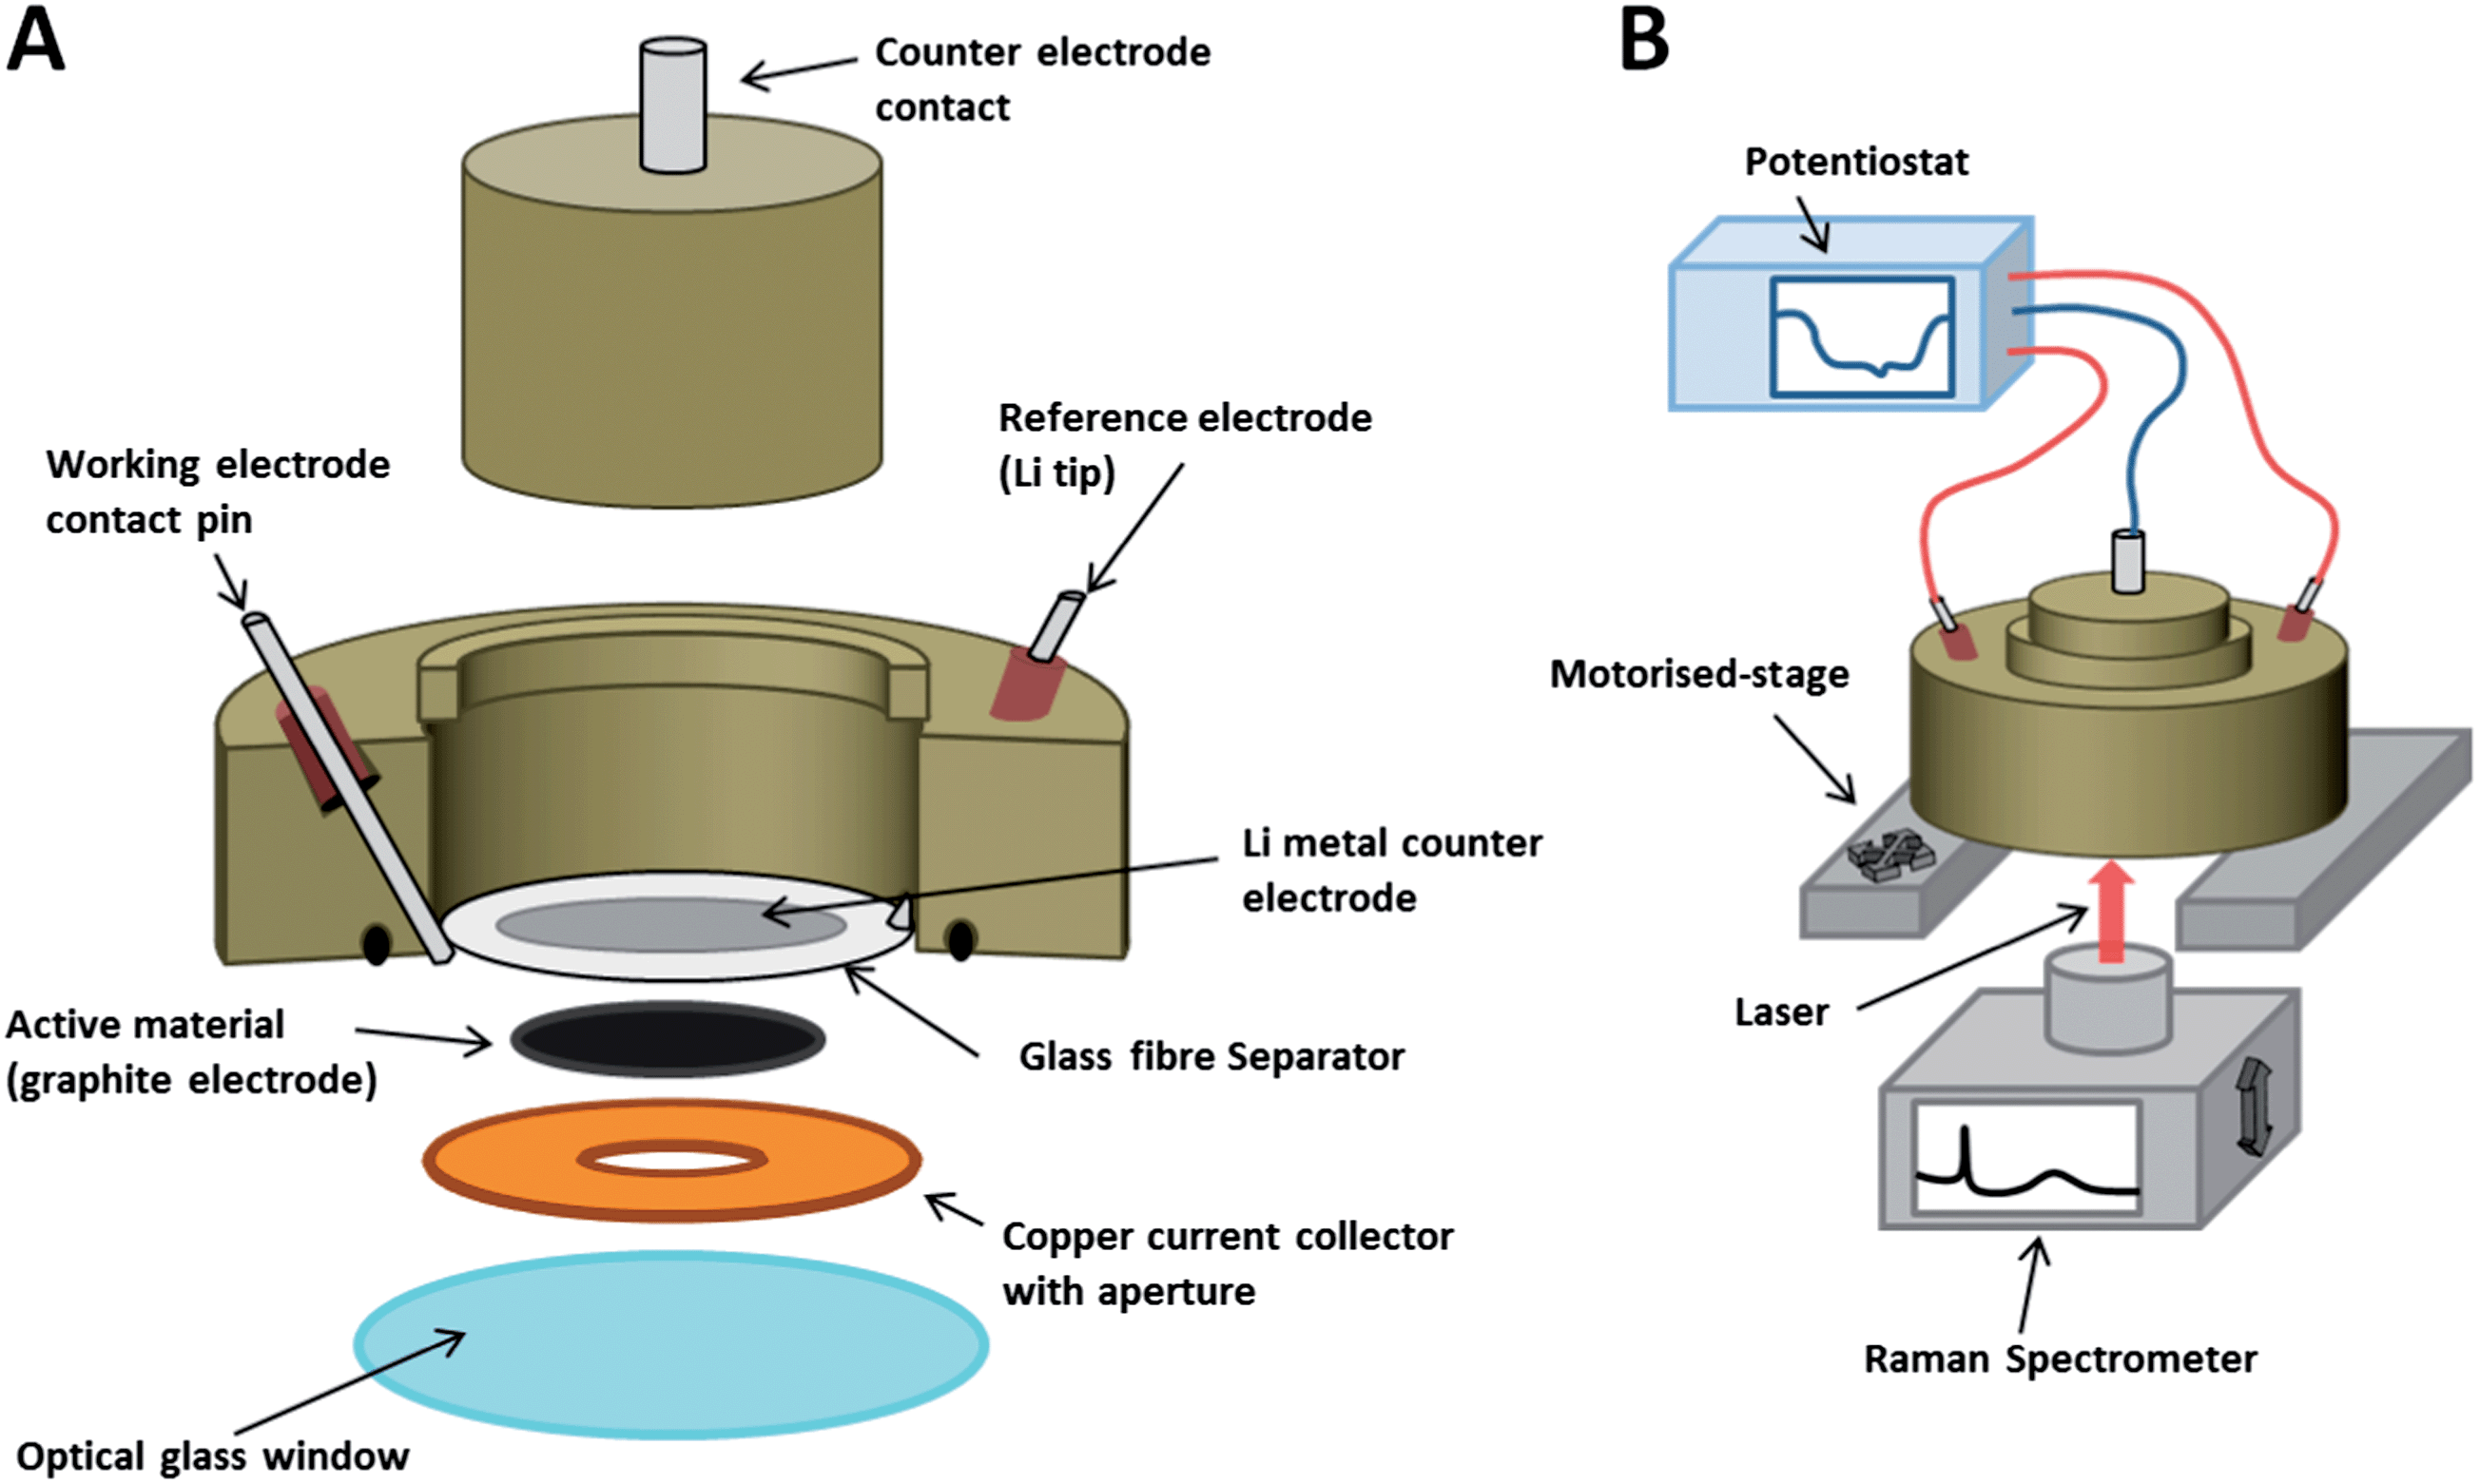 | ||
| Fig. 1 (A) A schematic of the Raman cell assembly; (B) a schematic of the Raman cell in operation. | ||
2.3 Raman spectroscopy
Raman spectra were recorded with a Raman microscope (Renishaw inVia), using a 633 nm wavelength laser focussed through an inverted microscope (Leica), via a 50× objective (Leica). The cell had an open circuit potential ca. 3.0 V (all quoted potentials are vs. Li/Li+) and was galvanostatically cycled at 20 mA g−1 carbon (equivalent to a C-rate of C/19, where 1 C = the charge required to fully lithiate graphite to LiC6 in 1 hour) between 5 mV and 1.5 V using a potentiostat (Biologic). Suitable filters were used to minimise the laser power at the surface to <1 mW cm−2. Higher laser powers should be avoided so as to prevent both heating of the sample area and laser degradation of the surrounding electrolyte (which produces fluorescing species).2.4 Scanning electron microscopy
The synthetic microcrystalline graphite particle and electrode film morphology were characterised using a scanning electron microscope (JEOL 7001F) operating at an accelerating voltage of 20.0 keV.3 Results and discussion
A SEM image of the microcrystalline graphite is displayed in Fig. 2(A), showing that a distribution of ca. 6 μm sized platelet graphitic particles is present. The free standing electrode cast used for the in situ experiments is shown in Fig. 2(B), which displays the porosity generated within the film from the DBP extraction.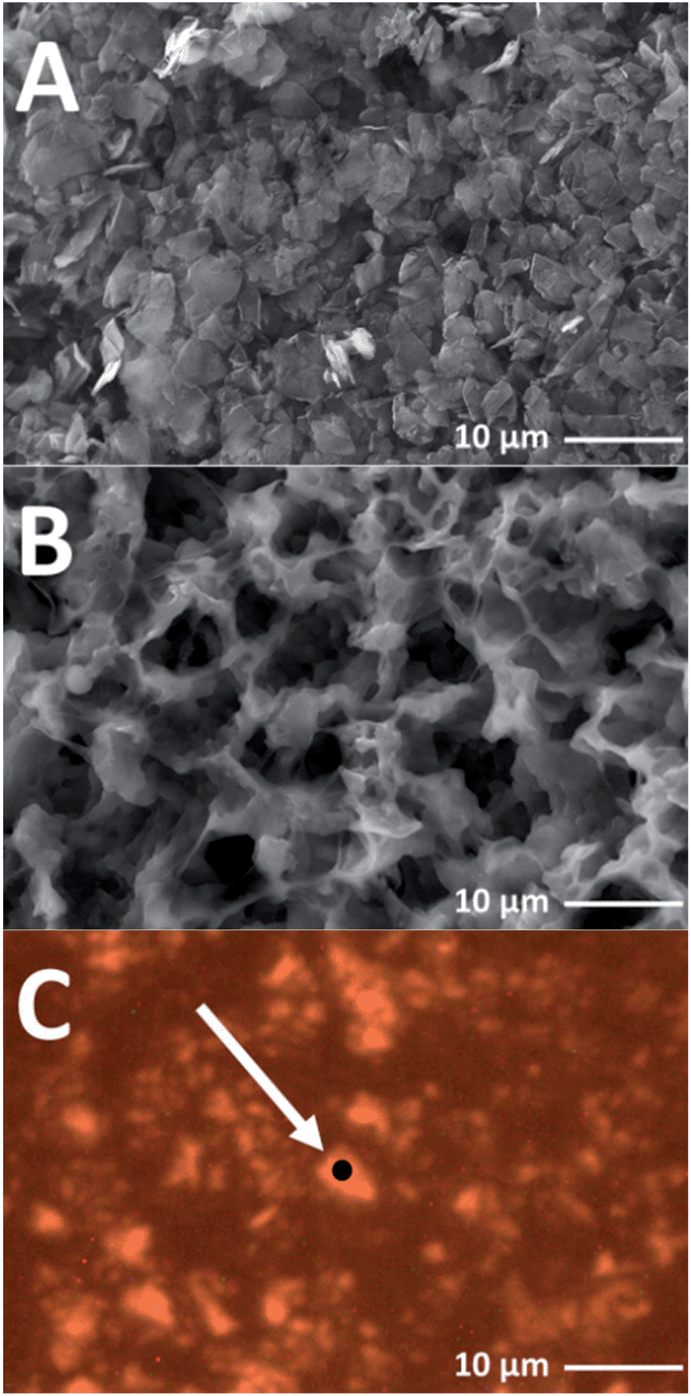 | ||
| Fig. 2 (A) A SEM image of the microcrystalline graphite powder, (B) a SEM image of the free-standing electrode cast, (C) an optical microscope image of microcrystalline graphite particles from the Raman cell working electrode, the black spot indicates the measured graphite particle. | ||
In order to acquire spectra with a good signal to noise ratio, the laser was focussed onto a suitable graphite particle as shown in Fig. 2(C), and the scattered light was collected from a volume of ca. 1–2 μm3. The point for in situ measurements is carefully designated. On certain areas of the graphite electrode there is minimal detection of Raman peaks from the electrolyte. Furthermore, to allow for the refocussing of the laser throughout the experiment, and checking that the selected measurement spot has been maintained, a particle or area of the electrode with distinguishable features must be selected.
Fig. 3 shows the first and second order Raman spectra for the pristine synthetic graphitic carbon measured in this study. The main peaks observed are the D, G and 2D bands, appearing at 1336 cm−1, 1580 cm−1 and ca. 2670 cm−1 respectively. The 1580 cm−1 peak (E2g2), called the G band after crystalline graphite, is the only easily accessible Raman active mode of the infinite lattice. There is a second Raman active mode E2g1 at (41 cm−1), but is difficult to observe due to its proximity to the Rayleigh line. The G mode is due to the relative motion of sp2 carbon atoms in rings as well as chains. The peak at 1336 cm−1 is named the D band, from disordered graphite, and can be attributed to the breathing motion of sp2 atoms in the rings at edge planes and defects in the graphene sheet. The origin of the D band has been discussed by Ferrari et al.21
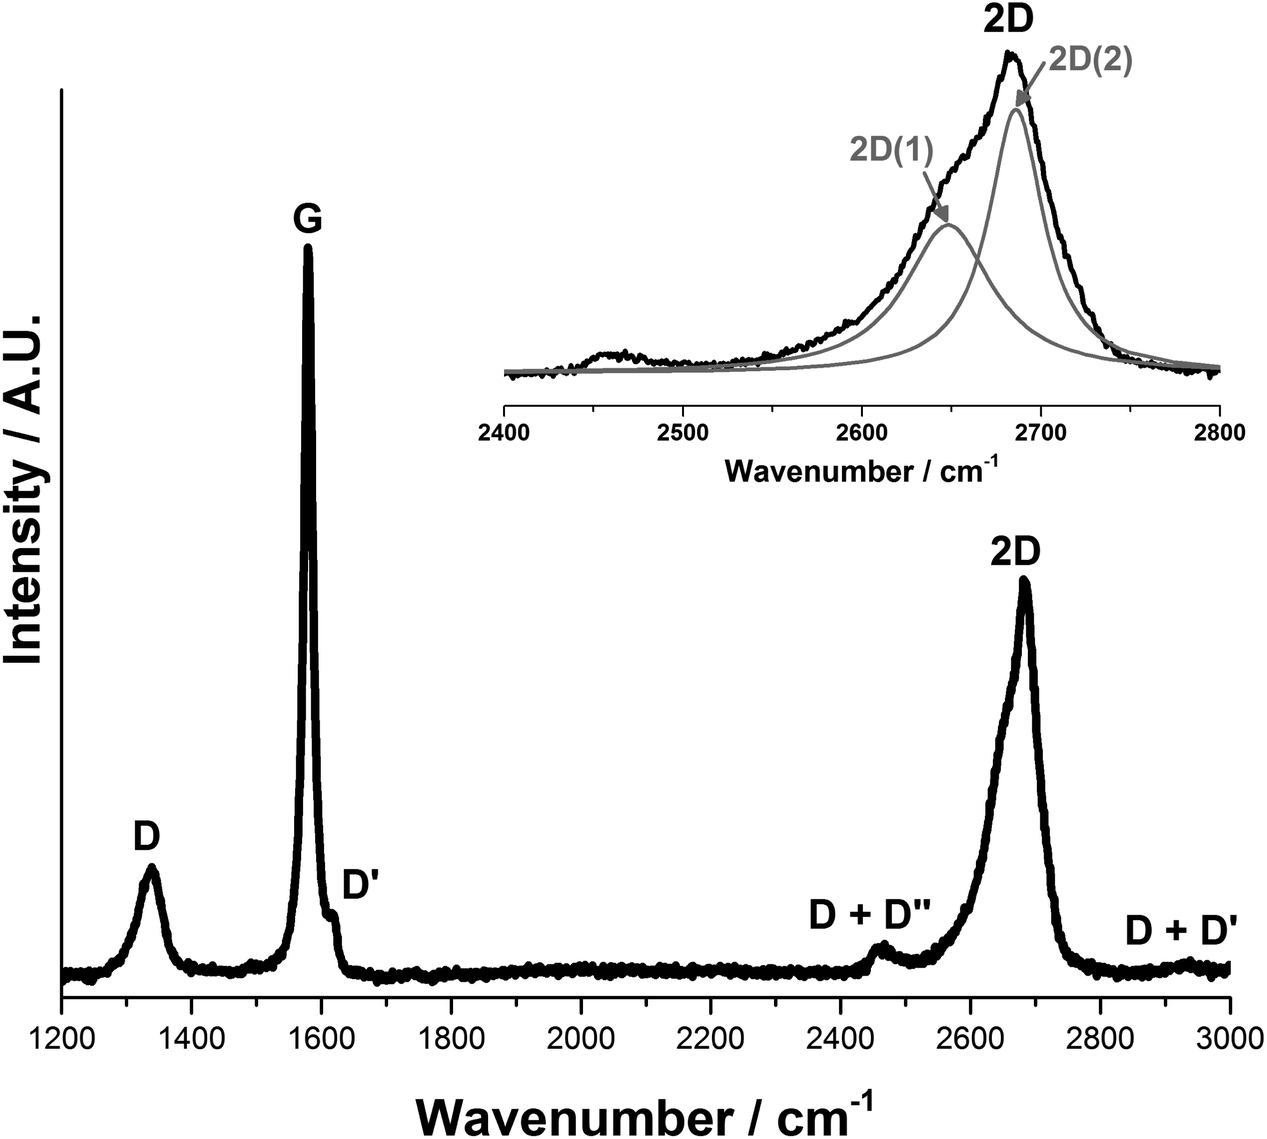 | ||
| Fig. 3 Raman spectra of 6 μm graphitic carbon. The D, G and 2D bands are observed at 1336 cm−1, 1580 cm−1 and 2670 cm−1 respectively. The 2D band can be peak fitted to give a sharp peak at 2686 cm−1 and a broad shoulder at 2649 cm−1, labelled 2D(2) and 2D(1) respectively. | ||
Peak fitting of the 2D band gives two peaks in accordance with the literature28,29 that have been designated 2D(1) and 2D(2), at 2649 cm−1 and 2686 cm−1 respectively. It should be noted that Cançado et al.30 have proposed that the two-peak shape of the 2D band in bulk graphite actually arises from the convolution of an infinite number of peaks.
The load curve showing the first discharge and charge profile is shown in Fig. 4. As with other graphitic materials, the charge consumed for the formation of LiC6 in the first cycle exceeds the theoretical maximum of 372 A h kg−1. This is due to the partial reduction of electrolyte during the formation of a passivation film called the solid electrode interphase (SEI). The electrochemical performance of the in situ Raman cell matches the performance of similar graphitic materials previously reported in the literature.31
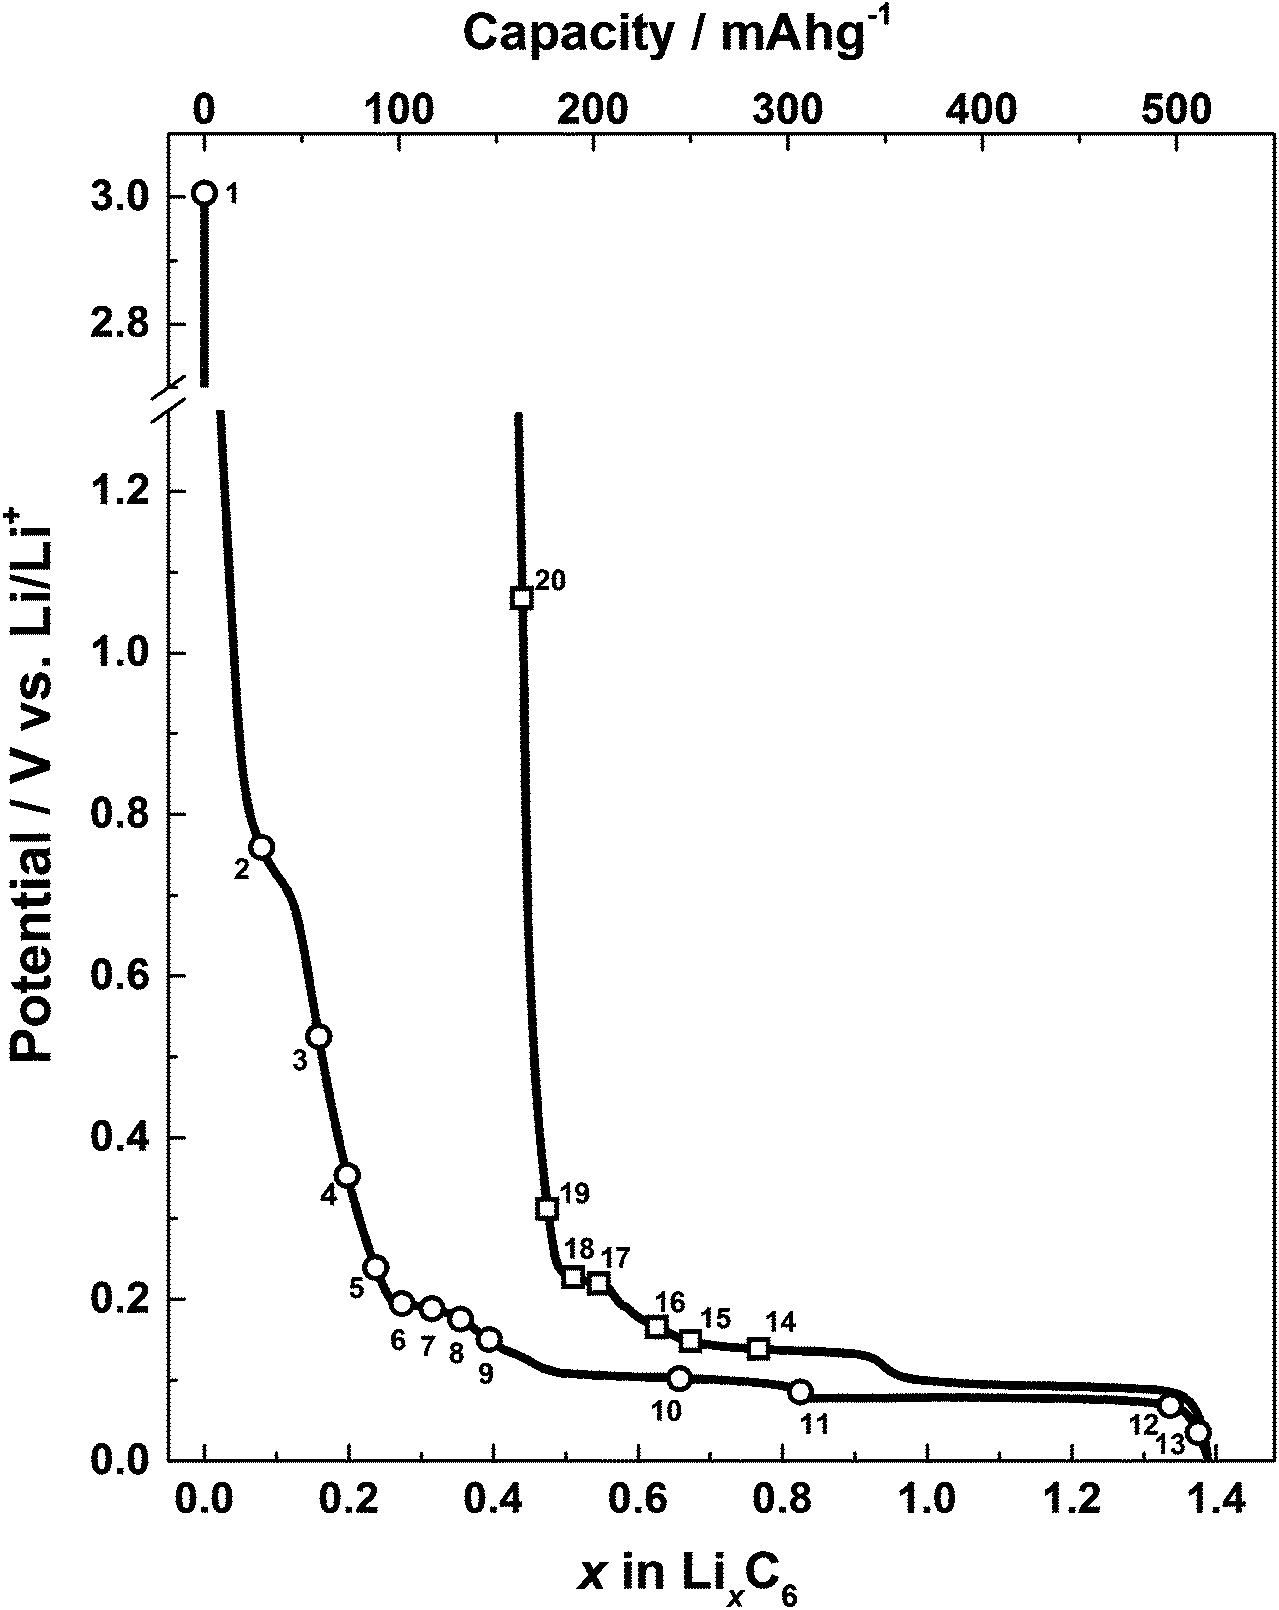 | ||
| Fig. 4 A graph showing discharge and charge profiles for the microcrystalline graphite electrode in the in situ Raman cell against a metallic lithium counter/reference. Raman spectra acquisitions are marked with numbers corresponding to those shown in Fig. 5. | ||
The results from the first lithium intercalation and de-intercalation cycle are shown in Fig. 5. The first order in situ Raman spectra compare well to the reported literature.7,12,16 The potential (V) at which each spectrum was collected is displayed. All the spectra are base-line corrected and stacked arbitrarily up the y-axis to allow for clear visualisation. Bands due to the electrolyte are either not detected or negligible because of the employed confocal set-up, which allows a confocal resolution of 1–2 μm.3
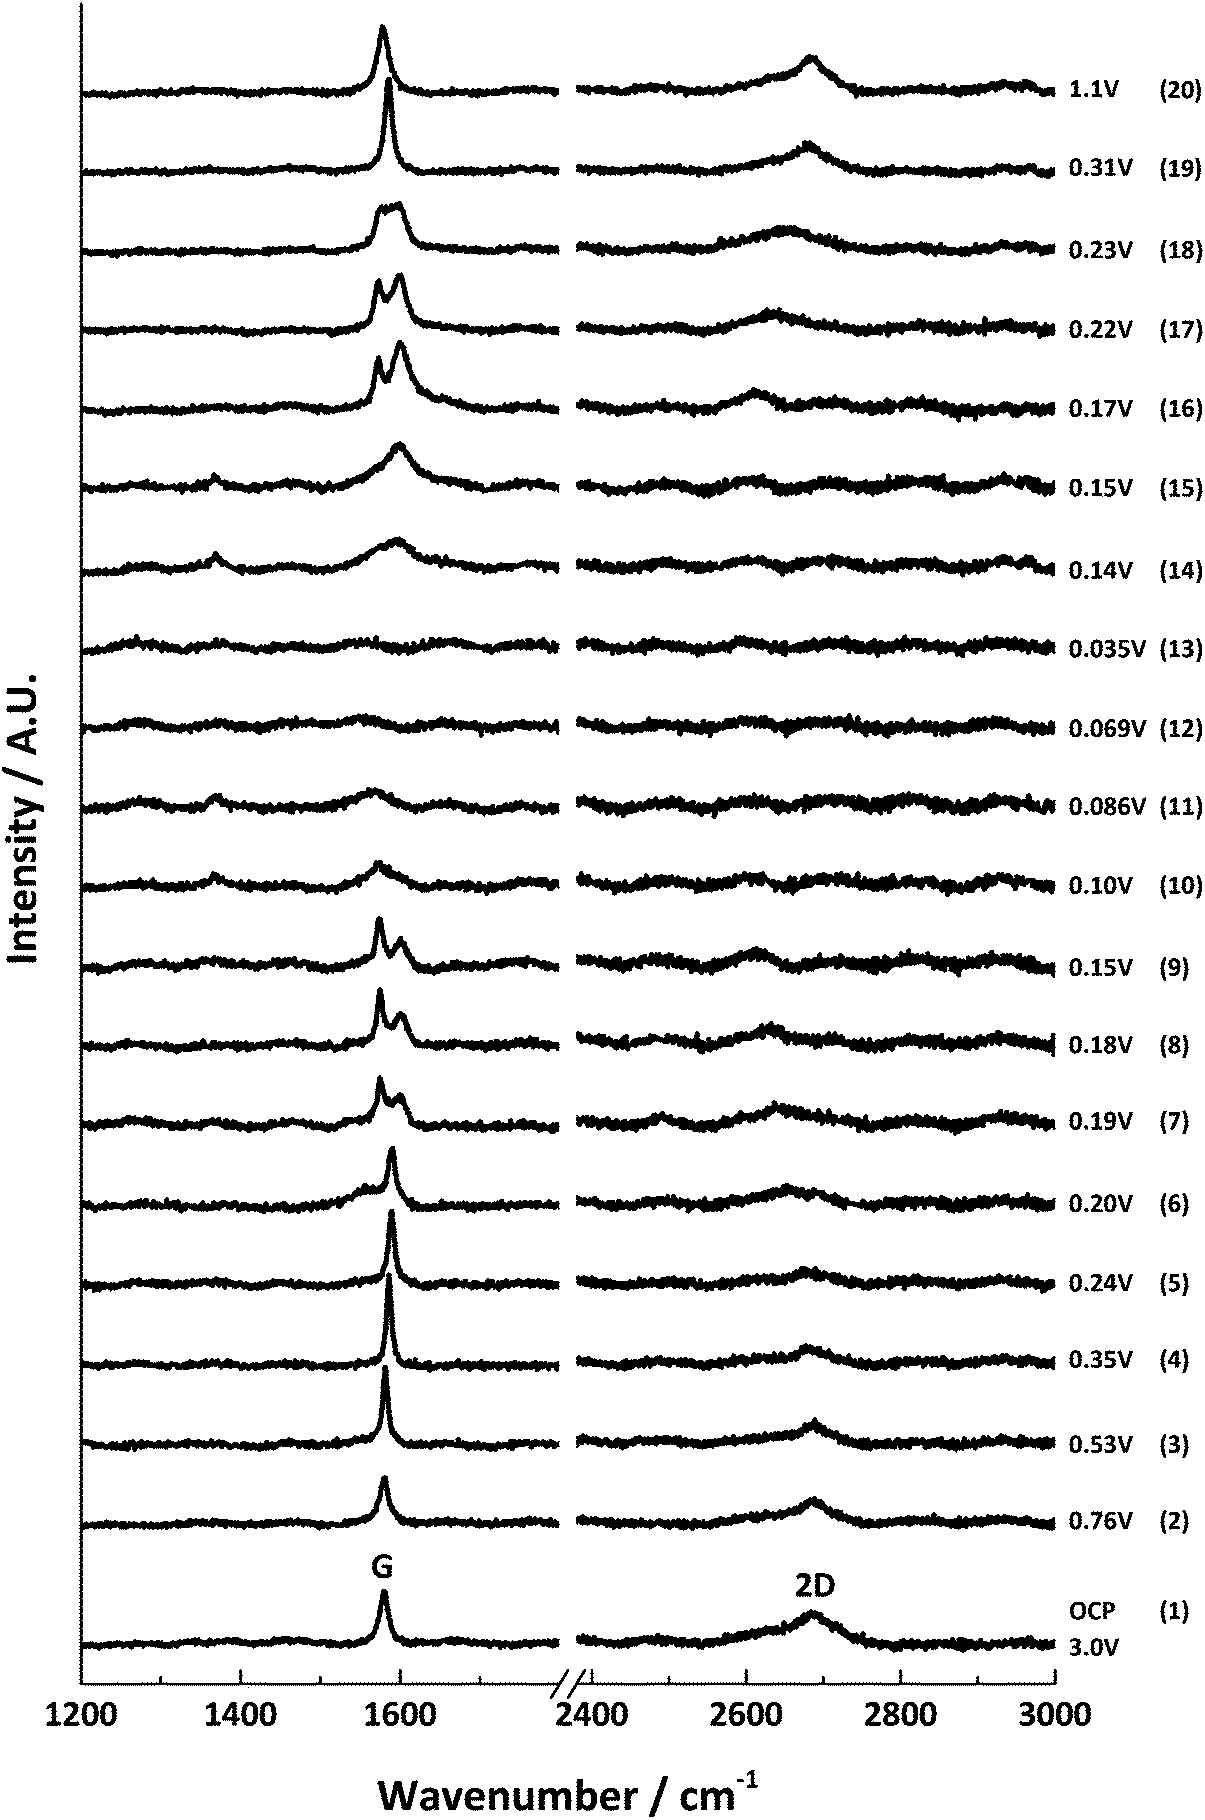 | ||
| Fig. 5 In situ Raman spectral series for the first lithium insertion and extraction into 6 μm graphitic carbon; the potential at each spectral acquisition is labelled to the right. | ||
At the open circuit potential (ca. 3.0 V vs. Li/Li+), three main bands are observed in the region between 1000–3000 cm−1: the G band at 1580 cm−1 and the 2D band at 2670 cm−1. A weak D band is noted at 1330 cm−1.
During lithiation, the series of first and second order band spectra may be divided into four stages of specific interest: the initial loss of D band intensity between potentials ca. 3.0–0.6 V; blue-shifting of the G band from 1580 cm−1 to 1590 cm−1, accompanied by the gradual weakening (and eventual disappearance) of the 2D(1) band intensity between ca. 0.6–0.2 V; splitting of the G band into the E2g2(i) (1575 cm−1) and E2g2(b) (1601 cm−1) bands ca. 0.20–0.15 V, along with a major red-shift of the 2D(2) band; and finally the appearance of a weak peak around 1370 cm−1 and the gradual loss of all distinct Raman peaks below ca. 0.10 V, associated with the formation of highly conductive, low stage number GICs.
The reverse spectral series (lithium de-intercalation) may also be split into four stages of specific interest: the weak band at 1370 cm−1 reappears from ca. 0.14 V along with a broad G band at 1592 cm−1; a weakening of the 1370 cm−1 band accompanies the growth, sharpening and blue-shift of the G band from 1592 to 1598 cm−1 to form the E2g2(b) band of the stage 2 GIC at ca. 0.15 V; the return of the G band doublet, E2g2(i) (1573 cm−1) and E2g2(b) (1601 cm−1), as well as the returning 2D(2) band, between ca. 0.17–0.22 V; and eventually, the reappearance of a sharp singlet G band at 1586 cm−1 and the 2D(1) band, and subsequent band shifting back to the original OCP band positions between ca. 0.3–1.5 V.
3.1 The loss of the D band
During the galvanostatic first lithium intercalation, the first change observed in the Raman spectrum is the weakening and broadening of the D band. The spot measured in this graphitic material was highly ordered, resulting in a weak D band, which was consequently difficult to observe in situ. The loss of intensity of the D band is generally first observed to occur below 1.0 V,12 which coincides with the formation of a SEI layer. It steadily decreases with potential until the band is lost into the signal noise below 0.6 V.3.2 The shift and sharpening of the G band
The position of the G band is observed to shift from 1580 cm−1 to 1590 cm−1. The frequency shift can be attributed to the increase of the force constants of the in-plane C–C bonds of the dilute stage 1 GICs. Within the region 0.6–0.2 V the G band shifted linearly with a potential slope of −28 ± 1 cm−1 V−1 (Fig. 6) which is close to the value of −29 cm−1 V−1 determined by Shi et al.32 for graphite KS44. The peak shape first narrows and then widens over the potential range (Table 1). The narrowing and shift of the G band both begin below a potential of 0.6 V. This can be attributed to the beginning of lithium insertion at ca. 0.55 V.14 The dilute stage 1 continues until 0.2 V, below which the formation of low stage number compounds begins. This causes the broadening of the G band as it also consists of weak signals from the emerging E2g2(i) (1575 cm−1) and E2g2(b) (1601 cm−1) bands.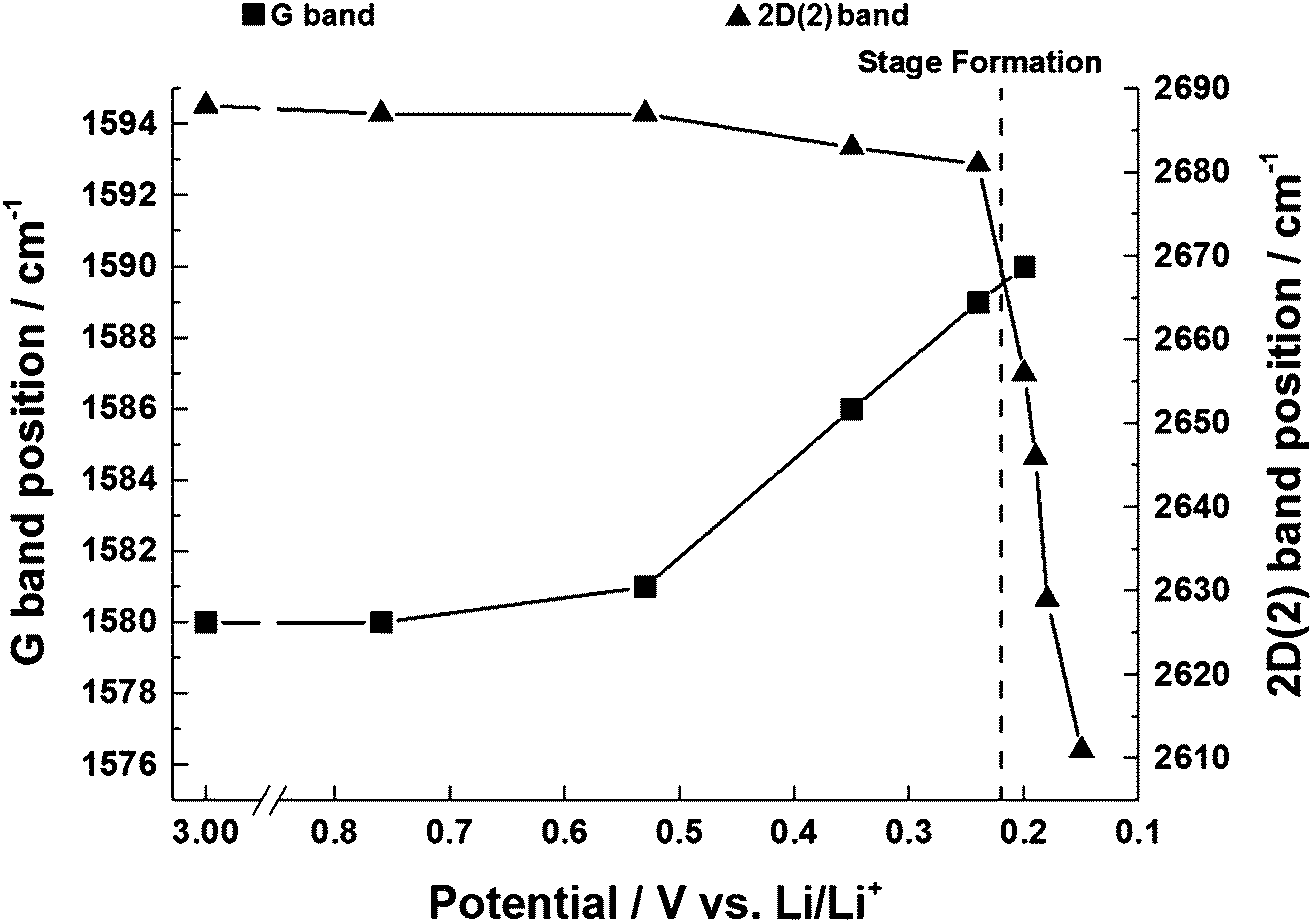 | ||
| Fig. 6 The shift in G band and 2D(2) position within the potential range 3.0–0.15 V vs. Li/Li+ for the first lithiation of graphite. Within the region 0.53–0.20 V the G band shifted linearly with potential (slope −27 cm−1 V−1). Within the region 0.24–0.15 V the 2D(2) band also shifted linearly with potential (slope 802 cm−1 V−1). | ||
| E (V) | G | E2g2(i) | E2g2(b) | 2D(1) | 2D(2) | |||||
|---|---|---|---|---|---|---|---|---|---|---|
| ω (cm−1) | FWHM (cm−1) | ω (cm−1) | FWHM (cm−1) | ω (cm−1) | FWHM (cm−1) | ω (cm−1) | FWHM (cm−1) | ω (cm−1) | FWHM (cm−1) | |
| 3.00 | 1580 | 12 | — | — | — | — | 2625 | 61 | 2688 | 53 |
| 0.76 | 1580 | 14 | — | — | — | — | 2625 | 57 | 2687 | 50 |
| 0.53 | 1581 | 9 | — | — | — | — | 2632 | 68 | 2687 | 36 |
| 0.35 | 1586 | 7 | — | — | — | — | 2622 | 30 | 2683 | 35 |
| 0.24 | 1589 | 9 | — | — | — | — | 2615 | 27 | 2681 | 45 |
| 0.2 | 1590 | 11 | — | — | — | — | — | — | 2656 | 75 |
| 0.19 | — | — | 1576 | 12 | 1599 | 15 | — | — | 2646 | 73 |
| 0.18 | — | — | 1575 | 9 | 1600 | 15 | — | — | 2629 | 59 |
| 0.15 | — | — | 1574 | 11 | 1601 | 15 | — | — | 2611 | 31 |
| 0.1 | — | — | — | — | — | — | — | — | — | — |
| 0.086 | — | — | — | — | — | — | — | — | — | — |
| 0.069 | — | — | — | — | — | — | — | — | — | — |
| 0.035 | — | — | — | — | — | — | — | — | — | — |
| 0.14 | — | — | — | — | 1592 | 57 | — | — | — | — |
| 0.15 | — | — | — | — | 1598 | 44 | — | — | — | — |
| 0.17 | — | — | 1573 | 8 | 1601 | 30 | — | — | 2614 | 51 |
| 0.22 | — | — | 1573 | 11 | 1598 | 22 | — | — | 2636 | 73 |
| 0.23 | — | — | 1577 | 16 | 1597 | 23 | — | — | 2649 | 90 |
| 0.31 | 1586 | 11 | — | — | — | — | 2630 | 48 | 2682 | 45 |
| 1.1 | 1579 | 15 | — | — | — | — | 2635 | 60 | 2685 | 39 |
3.3 The shift and shape change of the 2D band
The in situ behaviour of the double resonance 2D band during the lithiation and delithiation of graphitic carbon in a typical Li-ion battery electrolyte has not been previously reported. In contrast to the D band, which is widely reported to lose signal intensity between ca. 1–0.6 V,12 the 2D band remains visible until below ca. 0.15 V, when the high conductivity of low stage number GICs makes band observation difficult. As mentioned previously, no defects are required for activation of the 2D band and so it may be proposed that, whilst surface passivation/lithiation of defects may lead to the weakening and eventual disappearance of the D band, the 2D band remains visible. The 2D band position remains fairly constant until 0.53 V, including during the formation of the solid electrolyte interphase (below 1.0 V). Between 0.53 V and 0.24 V there is a gradual red-shift of the 2D(2) peak position of 21 ± 1 cm−1 V−1 accompanying the formation of the dilute stage 1 GIC signalled by the blue-shift of the G band. Between these potentials, the fitted 2D(1) peak intensity falls, making fitting difficult (due to the high background) and causing some uncertainty in the assigned position. Below 0.24 V the 2D(1) peak is no longer discernible.At ca. 0.20 V, accompanying the onset of stage 4 GIC formation, the gradient of the 2D(2) peak red-shift increases significantly to a rate of 802 ± 87 cm−1 V−1 (Fig. 6, Table 1). A similar red-shift in the 2D position has previously been observed during the n-type doping of, and the intercalation of other metal ions into GICs.24,26 This shift may be attributed to electronic doping and the increased in-plane (biaxial) lattice strain accompanying Li+ insertion. The linear nature of this shift between 0.24–0.15 V, and the biaxial nature of the attributed lattice strain, implies that the graphene layers in the graphitic carbon are becoming increasingly distorted on lithium intercalation. This is in keeping with the Daumas–Hérold model of intercalation, where the graphene layers are flexible and deform around the intercalating lithium ions, and contrary to the Rüdorff model, which proposes a sequential filling up of alternating graphene interlayer spaces with no structural distortions induced within the individual graphene sheets, as seen in Fig. 7.
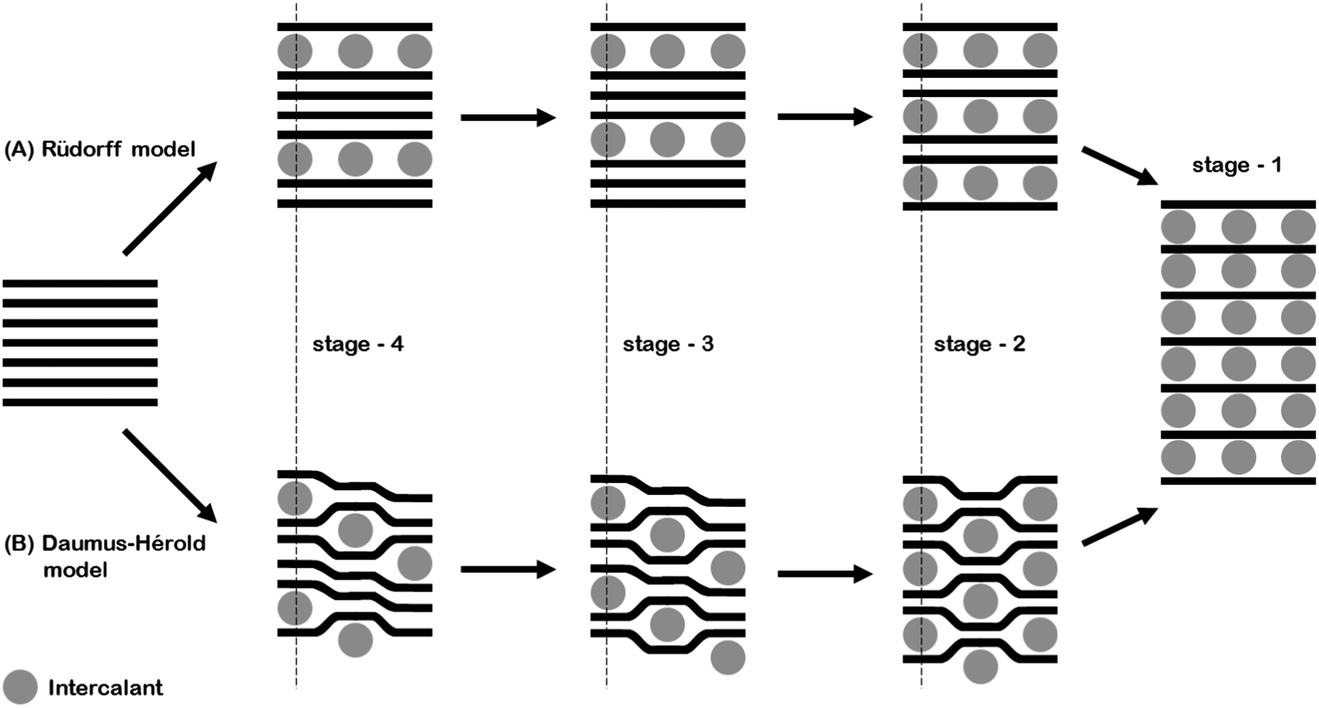 | ||
| Fig. 7 A schematic of the (A) Rüdorff and (B) Daumas–Hérold models of ion intercalation into graphite. | ||
The apparent shape change of the 2D band towards a single Lorentzian peak suggests the graphene layers in the stage 4 GIC have become electronically similar to single layer graphene, most likely due to electronic decoupling resulting from the transfer of charge from the electron from the external circuit to the bounding layers.24 The 2D band is no longer observable below 0.10 V. This suggests that stage 2 and stage 1 GIC are not visible in the Raman spectra as all graphene layers of the GIC are charged, and thus no longer give a Raman signal.
3.4 The splitting of the G band
As the potential continues to decrease below 0.20 V, the G band continues to broaden, with two side bands beginning to grow and become distinct bands. These peaks can be assigned to the intensities of the interior E2g2(i) (1575 cm−1) and bounding E2g2(b) (1601 cm−1) bands. These two bands quickly become prominent to the detriment of the dilute stage 1 band. This transformation points towards a phase transition from the dilute stage 1 to a staged phase with n > 2. Using eqn (1)7 and the intensities of the bands from the peak fitting, the ratio R is calculated to be ca. 1.0, which signifies the establishment of a stage 4 lithium GIC at 0.19 V (spectrum number 7).The phase transition is related to the change from a random distribution of lithium ions to a more compact distribution in the staged compound. The shift of the E2g2(b) band to 1601 cm−1 is due to a further increase of the C–C bond force constants.
3.5 The formation of the stage 2 GIC
The reduction and eventual disappearance of the E2g2(i) band is observed between 0.10 V and 0.069 V. However, the E2g2(b) band at 1601 cm−1 is also seen to disappear. Based on past reports of stage 2 GIC materials that have been produced from chemical synthesis, it is expected that the Raman spectrum should display a single band at ca. 1601 cm−1.33 This is clearly not the case and instead a broad band at 1550 cm−1 is seen. This is tentatively assigned as the blue-shifted E2g2(b) band of a stage 2 liquid GIC, where there is no longer an ordered distribution of lithium within the planes. However, a recent article by Zabel et al.34 on graphene sheets under strain shows a similar G-band shift for graphene sheets under ca. 1 bar of pressure, perhaps as a result of the contortion of graphene sheets seen from the Daumas–Hérold model of intercalation.This shift can then be explained by charge transfer effects during intercalation of a donor species where electrons occupy the π* orbital and thus weaken the C–C bond strength. Such an effect has been seen for the intercalation of donor species into less ordered carbon materials.13,35,36 This broad band continues to blue-shift and broadens until it disappears into the noise at ca. 1540 cm−1. Raman bands are thought to be no longer visible because of the increase of electrical conductivity of these low stage GICs, which leads to a reduction in optical skin depth, and results in a low Raman scattering intensity.7
3.6 The first de-lithiation
During the first de-lithiation, the reverse trend for the Raman spectra is seen, as shown in Fig. 5, as the potential is increased from 0.005 to 1.5 V. At 0.14 V, two bands are observed at 1370 cm−1 and 1592 cm−1. The band at 1592 cm−1 is seen to shift and grow in intensity to 1601 cm−1 as the potential is increased. This indicates the formation of the E2g2(b) band and thus the formation of a pure stage 2 GIC. The 1370 cm−1 band is absent by 0.17 V. At 0.17 V a second peak emerges at 1573 cm−1, the E2g2(i) band, which grows at the expense of the E2g2(b) band. This marks the return to a stage 3 GIC, and then to a stage 4 by ca. 0.17 V.From 0.22 to 0.24 V there is a mixture of stage 4 and dilute stage 1, and the doublet G band returns again to the single E2g2 band at 1586 cm−1, which then blue-shifts back to 1579 cm−1, showing the passage from dilute stage 1 to fully de-intercalated graphite. The shift in G band position is shown clearly between 0.31–1.1 V vs. Li/Li+.
The Raman spectra before and after lithiation are shown in Fig. 8. Both show very similar features, and the relative intensities of the G and 2D bands remain the same. Both spectra display a weak D band, indicating that the area measured did not become further disordered during the first Li+ insertion/extraction cycle. The lack of change in the spectra indicates that the measured graphite particle has experienced no significant structural change.
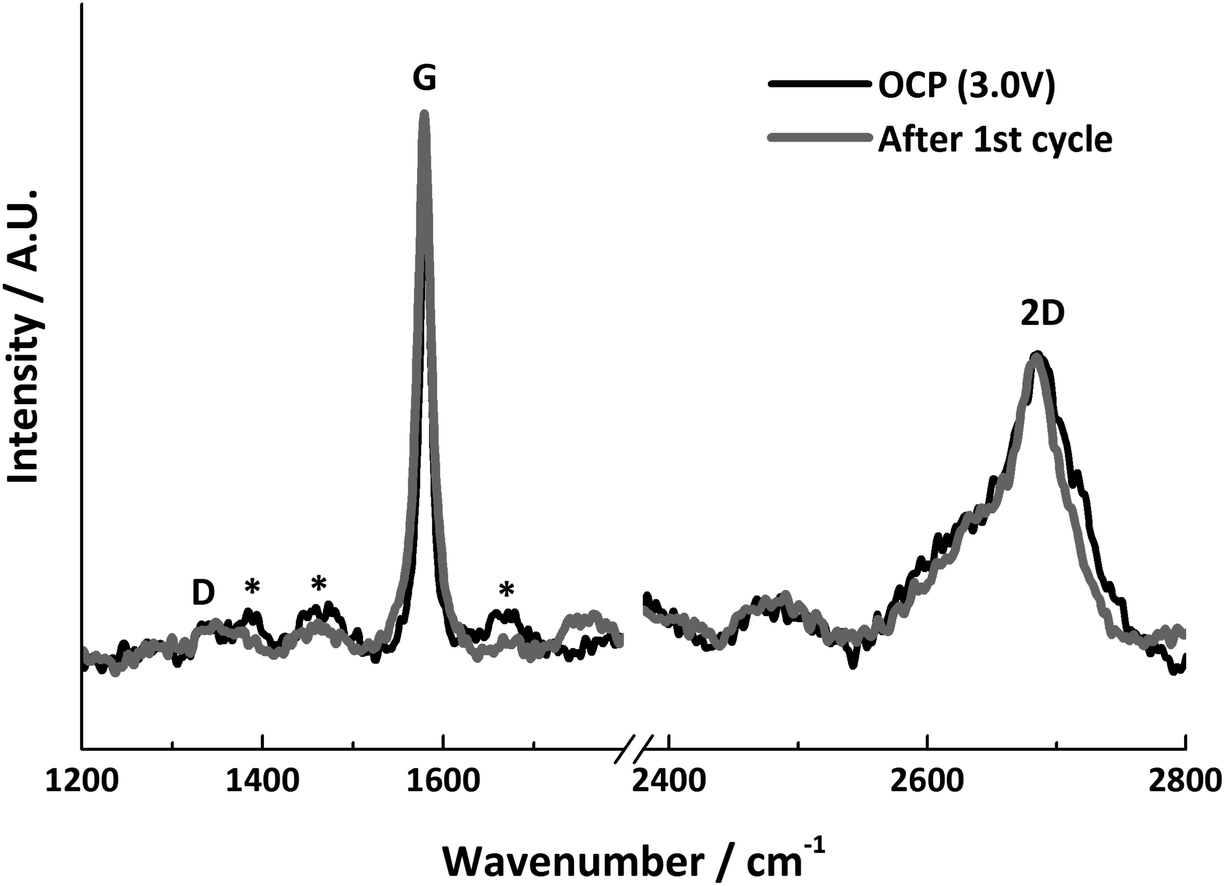 | ||
| Fig. 8 In situ Raman spectra before and after lithiation, * indicates signals from electrolyte bands. | ||
The reappearance of the 2D band is discernible at 0.17 V at 2614 cm−1 with a single Lorentzian fit that we have ascribed to the returning 2D(2) peak. This is a similar position to the last observable position during lithiation (2611 cm−1 at 0.15 V) suggesting the return of the stage 3 GIC. The 2D(2) peak red-shifts and broadens between ca. 0.17 V to 0.23 V until an eventual reforming of the low energy 2D(1) peak at 0.31 V. This splitting of the 2D band marks the renewed electronic coupling between the graphene layers and suggests the formation of the dilute stage 1 GIC. Both 2D(1) and 2D(2) peaks shift back towards their OCP positions.
4 Summary and conclusions
Graphitic carbon remains the dominant active material used within lithium-ion negative electrodes. Understanding the mechanics of Li+ intercalation into actual practical graphitic anodes is important in optimising this material in terms of performance, lifetime and safety. In situ Raman spectra of the first electrochemical lithiation and de-lithiation cycle at a single point on a graphite electrode were obtained with a good signal to noise ratio and minimal detection of electrolyte bands.The obtained first order spectra agree with previous reports, in particular with the observation of the G-band splitting, indicating the formation of a staged GIC. The behaviour of the second order in situ Raman spectra was reported for the first time during the first lithium insertion and extraction cycle. The 2D band was observed to shift to lower wavenumbers (2681 to 2611 cm−1) when stage 4 and 3 graphite intercalation compounds were formed. The shift of the 2D band supports the Daumas–Hérold model of electrochemically derived intercalation, where the graphene layers are flexible and deform around domains of ordered intercalated lithium ions. The opposite trends were observed in the Raman spectra during lithium extraction, indicating the lithium is removed in a reversible manner, with comparable initial and final spectra. This demonstrates that, at this particular point of the graphite electrode, no disordering of the structure resulted from a single cycle of lithium insertion and extraction.
Acknowledgements
We acknowledge the Engineering and Physical Sciences Research Council (EPSRC) for the funding of this research under grant number EP/K016954. The Nanoinvestigation Centre at Liverpool (NiCaL) and the assistance with the SEM measurements from Stephen Hughes are also gratefully acknowledged.References
- A. S. Aricò, P. Bruce, B. Scrosati, J.-M. Tarascon and W. V. Schalkwijk, Nat. Mater., 2005, 4, 366 CrossRef PubMed
.
- P. G. Bruce, B. Scrosati and J.-M. Tarascon, Angew. Chem., Int. Ed., 2008, 47, 2930 CrossRef CAS PubMed
- P. G. Bruce, S. A. Freunberger, L. J. Hardwick and J.-M. Tarascon, Nat. Mater., 2012, 11, 19 CrossRef CAS PubMed
- J. B. Goodenough and K.-S. Park, J. Am. Chem. Soc., 2013, 135, 1167 CrossRef CAS PubMed
- R. Baddour-Hadjean and J. P. Pereira-Ramos, Chem. Rev., 2010, 110, 1278 CrossRef CAS PubMed
- V. Stancovski and S. Badilescu, J. Appl. Electrochem., 2014, 44, 23 CrossRef CAS
- M. Inaba, H. Yoshida, Z. Ogumi, T. Abe, Y. Mizutani and M. Asano, J. Electrochem. Soc., 1995, 142, 20 CrossRef CAS PubMed
-
S. A. Solin, Graphite Intercalation Compounds, Springer-Verlag, Berlin, 1990 Search PubMed
- R. Fong, U. Vonsacken and J. R. Dahn, J. Electrochem. Soc., 1990, 137, 2009 CrossRef CAS PubMed
- K. Dokko, Q. F. Shi, I. C. Stefan and D. A. Scherson, J. Phys. Chem. B, 2003, 107, 12549 CrossRef CAS
- Y. Luo, W. B. Cai and D. A. Scherson, J. Electrochem. Soc., 2002, 149, A1100 CrossRef CAS PubMed
- L. J. Hardwick, H. Buqa and P. Novak, Solid State Ionics, 2006, 177, 2801 CrossRef CAS PubMed
- M. Inaba, H. Yoshida and Z. Ogumi, J. Electrochem. Soc., 1996, 143, 2572 CrossRef CAS PubMed
- W. W. Huang and R. Frech, J. Electrochem. Soc., 1998, 145, 765 CrossRef CAS PubMed
- J. C. Panitz, F. Joho and P. Novak, Appl. Spectrosc., 1999, 53, 1188 CrossRef CAS
- S. Migge, G. Sandmann, D. Rahner, H. Dietz and W. Plieth, J. Solid State Electrochem., 2005, 9, 132 CrossRef CAS
- P. Novak, D. Goers, L. Hardwick, M. Holzapfel, W. Scheifele, J. Ufhiel and A. Wursig, J. Power Sources, 2005, 146, 15 CrossRef CAS PubMed
- L. J. Hardwick, H. Buqa, M. Holzapfel, W. Scheifele, F. Krumeich and P. Novak, Electrochim. Acta, 2007, 52, 4884 CrossRef CAS PubMed
- L. J. Hardwick, P. W. Ruch, M. Hahn, W. Scheifele, R. Kotz and P. Novak, J. Phys. Chem. Solids, 2008, 69, 1232 CrossRef CAS PubMed
- V. Baranchugov, E. Markevich, G. Salitra, D. Aurbach, G. Semrau and M. A. Schmidt, J. Electrochem. Soc., 2008, 155, A217 CrossRef CAS PubMed
- A. C. Ferrari and D. M. Basko, Nat. Nanotechnol., 2013, 8, 235 CrossRef CAS PubMed
- T. M. G. Mohiuddin, A. Lombardo, R. R. Nair, A. Bonetti, G. Savini, R. Jalil, N. Bonini, D. M. Basko, C. Galiotis and N. Marzari, Phys. Rev. B: Condens. Matter Mater. Phys., 2009, 79, 205433 CrossRef
- C. Metzger, S. Remi, M. Liu, S. V. Kusminskiy, A. H. Castro Neto, A. K. Swan and B. B. Goldberg, Nano Lett., 2010, 10, 6 CrossRef CAS PubMed
- J. C. Chacón-Torres, L. Wirtz and T. Pichler, ACS Nano, 2013, 7, 9249 CrossRef PubMed
- W. Zhao, P. H. Tan, J. Liu and A. C. Ferrari, J. Am. Chem. Soc., 2011, 133, 5941 CrossRef CAS PubMed
- R. Parret, M. Paillet, J.-R. Huntzinger, D. Nakabayashi, T. Michel, A. Tiberj, J.-L. Sauvajol and A. A. Zahab, ACS Nano, 2013, 7, 165 CrossRef CAS PubMed
- L. J. Hardwick, M. Hahn, P. Ruch, M. Holzapfel, W. Scheifele, H. Buqa, F. Krumeich, P. Novák and R. Kötz, Electrochim. Acta, 2006, 52, 675 CrossRef CAS PubMed
- J. Nemanich and S. A. Solin, Phys. Rev. B: Condens. Matter Mater. Phys., 1979, 20, 392 CrossRef
- R. P. Vidano, O. B. Fischbach, L. J. Willis and T. M. Loehr, Solid State Commun., 1981, 39, 341 CrossRef CAS
- L. G. Cançado, A. Reina, J. Kong and M. S. Dresselhaus, Phys. Rev. B: Condens. Matter Mater. Phys., 2008, 77, 245408 CrossRef
- H. Buqa, A. Wursig, A. Goers, L. J. Hardwick, M. Holzapfel, P. Novak, F. Krumeich and M. E. Spahr, J. Power Sources, 2005, 146, 134 CrossRef CAS PubMed
- Q. F. Shi, K. Dokko and D. A. Scherson, J. Phys. Chem. B, 2004, 108, 4789 CrossRef CAS
- M. S. Dresselhaus and G. Dresselhaus, Adv. Phys., 2002, 51, 1 CrossRef CAS
- J. Zabel, R. R. Nair, A. Ott, T. Georgiou, A. K. Geim, K. S. Novoselov and C. Casiraghi, Nano Lett., 2012, 12, 617 CrossRef CAS PubMed
- M. Endo, C. Kim, T. Karaki, T. Fujino, M. J. Matthews, S. D. M. Brown and M. S. Dresselhaus, Synth. Met., 1998, 98, 17 CrossRef CAS
- Z. X. Wang, X. J. Huang, R. J. Xue and L. Q. Chen, Carbon, 1999, 37, 685 CrossRef CAS
| This journal is © The Royal Society of Chemistry 2014 |