 Open Access Article
Creative Commons Attribution 3.0 Unported Licence
Reaction kinetics and isotope effect of water formation by the surface reaction of solid H2O2 with H atoms at low temperatures
Yasuhiro
Oba
*,
Kazuya
Osaka
,
Naoki
Watanabe
,
Takeshi
Chigai
and
Akira
Kouchi
N19W8, Kita-ku, Sapporo, Hokkaido, Japan. E-mail: oba@lowtem.hokudai.ac.jp; Fax: +81 11 706 7142; Tel: +81 11 706 5477
First published on 22nd May 2014
Abstract
We performed laboratory experiments on the formation of water and its isotopologues by surface reactions of hydrogen peroxide (H2O2) with hydrogen (H) atoms and their deuterated counterparts (D2O2, D) at 10–30 K. High-purity H2O2 (>95%) was prepared in situ by the codeposition of molecular oxygen and H atoms at relatively high temperatures (45–50 K). We determined that the high-purity H2O2 solid reacts with both H and deuterium (D) atoms at 10–30 K despite the large activation barriers (∼2000 K). Moreover, the reaction rate for H atoms is approximately 45 times faster than that for D atoms at 15 K. Thus, the observed large isotope effect indicates that these reactions occurred through quantum tunneling. We propose that the observed HDO/H2O ratio in molecular clouds might be a good tool for the estimation of the atomic D/H ratio in those environments.
Introduction
Water (H2O) is the predominant solid constituent of icy layers of submicron-sized interstellar grains. Because of the potential importance of H2O for chemical evolution in molecular clouds (MCs), elucidating the formation mechanism of H2O in those environments is important. Although H2O formation is possible by gas phase reactions at low temperatures,1 the observed large abundance of H2O cannot be explained only by the gas-phase synthesis.2 Therefore, it is generally accepted that grain-surface reactions are crucial for producing H2O in MCs.Tielens and Hagen3 proposed that H2O formation is initiated by hydrogenation of atomic oxygen (O), molecular oxygen (O2), and ozone (O3), and is completed by the following reactions:
| OH + H → H2O, | (1) |
| OH + H2 → H2O + H, | (2) |
| H2O2 + H → H2O + OH. | (3) |
Since reaction (1) is a radical–radical reaction, it should proceed immediately once reactants encounter each other on the surface. This reaction has been studied experimentally by several groups.4–7 In contrast to reaction (1), reactions (2) and (3) have large activation barriers (>2000 K) in the gas phase.8,9 However, despite such a large barrier, these two reactions were proposed to contribute significantly to H2O formation in dense MCs.10 Since reactions having such large barriers do not occur thermally in MCs, reactions (2) and (3) require quantum tunneling. The quantum tunneling rate kq is expressed by the following equation, assuming a rectangular activation barrier with a height Ea and width a:11
| kq ≈ ν0exp[−(2a/ħ)(2mEa)1/2], | (4) |
We have recently studied reaction (2) experimentally by the codeposition of nonenergetic OH with H2 and isotopologues such as OD, HD, and D2 on a substrate and determined that the reactions occur at 10 K.14 In addition, significant isotope effects were observed, and reactions of OH and OD abstracting a D atom from HD and D2 were approximately ten times slower than those abstracting an H atom from H2 and HD. This isotope effect can be explained by the difference in the effective mass of tunneling reactions.14
A number of research studies have been conducted on reaction (3). In these previous studies, O2 was used as an initial reactant rather than hydrogen peroxide (H2O2), which was produced by the successive hydrogenation of O2 as follows:
| O2 + H → HO2, | (5) |
| HO2 + H → H2O2. | (6) |
For example, Miyauchi et al.15 exposed solid O2 layers to H or D atoms at 10 K and determined that (i) the rate of O2 hydrogenation (reaction (5)) is equal to that of O2 deuteration, (ii) the rate of reaction (3) is slower than that of reaction (5), and (iii) the rate of reaction (3) is eight times faster than that of the following isotopically substituted reaction (7):
| D2O2 + D → D2O + OD. | (7) |
Miyauchi et al. considered that the rate difference between reactions (3) and (7) would be due to the isotope effect of quantum tunneling.15 However, in the O2 hydrogenation experiments, the formation of both H2O2 and H2O occurs in the sample solid. Furthermore, the parent O2 molecule is IR-inactive. Thus, multi-parameter fittings, which often cause significant errors, are necessary to obtain the rates for reactions (3) and (5). Moreover, recent studies suggested that H2O may form by another exothermic reaction in typical experimental conditions for O2 hydrogenation:16,17
| OH + OH → H2O + O. | (8) |
In addition to reaction (3), OH is expected to form by the following pathway:
| HO2 + H → H2O2* → 2OH, | (9) |
| OH + OH → H2O2. | (10) |
The branching ratio of barrierless reactions (8) to (10) was determined experimentally17 to be 1 to 4 at 40 K and theoretically18 to be 1 to 9 on a cold substrate. In any case, reactions (8) and (10) may compete during O2 hydrogenation experiments to some extent, making it more difficult to obtain reliable kinetic parameters for reaction (3). In the case of CO hydrogenation experiments, a similar problem occurred because both formaldehyde (H2CO) and methanol (CH3OH) were produced in a single experiment.19–23 However, additional experiments using H2CO as an initial reactant have enabled us to better understand the reaction kinetics and isotope effects of CO and H2CO hydrogenation.13,24 Similarly, the use of H2O2 as an initial reactant is desirable for studying the kinetics and isotope effects of reaction (3). However, because of difficulty in using pure H2O2, to date such an experiment has not been performed.
In the present study, we performed experimental studies on the formation of H2O via reaction (3) and its isotope effect using high-purity (>95%) solid H2O2 and D2O2.
Experimental
Apparatus and experimental conditions for water formation
All experiments were performed using the Apparatus for SUrface Reaction in Astrophysics (ASURA) system. The ASURA primarily comprises a main chamber and an atomic source. An aluminum (Al) substrate was mounted at the center of the main chamber and all reactions were performed on the substrate at 10–30 K. Hydrogen (H) and deuterium (D) atoms were produced by the dissociation of H2 and D2 molecules, respectively, in a microwave discharge plasma, and were cooled by multiple interactions with the inner wall of the aluminum pipe, which was cooled to 100 K. We confirmed that the formed H and D atoms were well thermalized to the pipe temperature.25 Further details of the ASURA have been described elsewhere.25,26The fluxes of H and D atoms were not directly measured in the present experimental setup; they were estimated by comparing the effective rates of CO hydrogenation and deuteration with those reported by Hidaka et al.,27 which were obtained under the same experimental conditions. Briefly, amorphous H2O ice (a-H2O) with a thickness of approximately ten monolayers (ML; ∼1015 molecules cm−2) was produced by vapor deposition on the substrate at 15 K, followed by the deposition of CO with a thickness of ∼0.8 ML. The column density of H2O and CO was calculated from the peak area and the previously published band strengths, as described by Hidaka et al.27 The band strengths for the CO stretching of CO and OH stretching of H2O are 2.0 × 10⁻¹⁶ and 1.1 × 10⁻¹⁷ cm molecules−1, respectively.28 The obtained effective rates were 1.4 and 0.21 min−1 for the hydrogenation and deuteration of CO, respectively (see Results section below for the determination of effective rate constants). These values are a factor of 3.3 and 6.4 larger than the effective rates of CO hydrogenation and deuteration, respectively, compared to those reported by Hidaka et al.,27 whose fluxes of both H and D atoms were 2.6 × 10¹⁴ atoms cm−2 s−1. Assuming that the surface density of H and D atoms correlates linearly with their fluxes, the fluxes of H and D atoms in the present study were estimated to be 8.7 × 10¹⁴ and 1.7 × 10¹⁵ atoms cm−2 s−1, respectively, which corresponds to a D and H atom flux ratio of ∼2. The variations in the H and D fluxes are expected to be less than 10% during and between each experiment.
Approximately 1 ML of solid H2O2 or its deuterated counterpart D2O2 was produced on the substrate by the procedures shown in the next section. H2O2 and D2O2 were exposed to H (D) atoms at 10–30 K. Reaction products were monitored in situ by a reflection absorption Fourier Transform Infrared (FTIR) spectrometer with a resolution of 4 cm−1 in the spectral range from 700 to 4000 cm−1. The column density of H2O2 and D2O2 was calculated from the peak area and previously published band strengths.15 The band strengths used were 2.1 × 10⁻¹⁷ and 1.5 × 10⁻¹⁷ cm molecule−1 for the OH and OD bending bands at 1385 and 1039 cm−1, respectively.
Experiments were also performed on an amorphous D2O ice (a-D2O; ∼30 ML) vapor-deposited at 10 K. The band strength used was 1.3× 10⁻¹⁶ cm molecule−1 for the OD stretching band.15
Preparation of high-purity solid hydrogen peroxide
In previous studies,29,30 high-purity H2O2 (>97%) has been prepared by distilling commercially available H2O2 solution under vacuum. The distilled H2O2 was introduced into a reaction substrate through a transfer line made with nonreactive materials such as glass to avoid the catalytic decomposition of H2O2 on metal surfaces. However, in a typical apparatus, which comprises a stainless steel chamber and gas lines, it is not easy to obtain pure H2O2 using this procedure without significant modification.Thus, we produced high-purity solid H2O2in situ by the codeposition of H atoms with O2 molecules on a substrate at relatively high temperatures. In our previous study, we determined that H2O2-rich ice tends to form by the O2/H codeposition at high temperatures (>30 K) and with an increasing proportion of O2 relative to H atoms.31 For example, when O2 and H were codeposited with an O2/H ratio of ∼2 × 10⁻³ at 20 K, the main product was H2O with a small amount of H2O2 (H2O/H2O2 ∼ 5). When the same experiment was performed with an O2/H ratio of ∼9 × 10⁻³ at 40 K, the main product was H2O2 with ∼15% contamination of H2O. We further extended this experiment for the production of solid H2O2 with higher purity suitable for studying the kinetics and the isotope effect of reaction (3). One of the major advantages of this sample preparation method is that it is possible to study the isotope effect of reaction (3) using different isotopes (i.e., H and D), which was not possible in previous studies.15,32
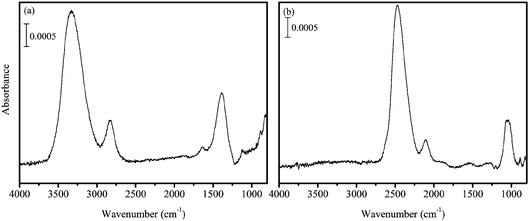
Gaseous O2 was introduced into the main chamber through a capillary plate. From the pressure inside the main chamber, the O2 flux was estimated to be 1.0 × 10¹⁴ molecules cm−2 s−1, which is two to four orders of magnitude larger than that used by Oba et al.31 The H atoms were codeposited with O2 onto the substrate at 45–50 K. In the present experiments, pure H2O2 solid and the solid on a-D2O were used as reactants. The amount of solid H2O2 was ∼1 ML. After the formation of solid H2O2, the microwave was switched off, the supply of all gases (H2 and O2) was stopped, and the substrate temperature was raised to 70 K to remove residual O2 from the sample solid. H2O contamination in the solid H2O2 was <5%, which was confirmed by the IR spectrum of the product (Figure 1a). We believe that this small amount of contamination does not significantly impact the kinetics of reaction (3). We confirmed this by a temperature-programmed desorption experiment wherein little O2 remained on the substrate after the sample treatment. The produced H2O2 was then cooled to the desired temperatures (10–30 K) for hydrogenation or deuteration experiments. Moreover, when D atoms were used, high-purity D2O2 was formed (Figure 1b).
Results
H2O2 + H and H2O2 + D
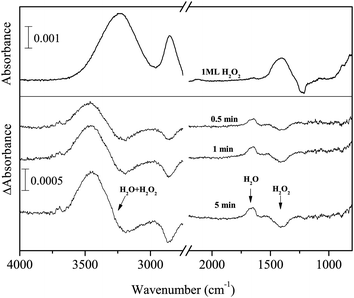
Figure 2 shows IR absorption spectra of solid H2O2 (top) and H2O (bottom) for comparison and the difference spectra of 1 ML pure solid H2O2 after H atom exposure for up to 10 min at 15 K (middle). In the difference spectra, the peaks below and above the baseline represent decreases of initial reactant and increase of reaction products, respectively. With increasing H atom fluence, the peak intensity for the OH bending of H2O2 at 1385 cm−1 decreased, and new peaks appeared at 3000–3600, 2850, and 1660 cm−1. The peak at 1660 cm−1 is attributable to the OH bending of H2O formed by reaction (3). Based on the peak position of OH stretching bands of solid H2O2 and H2O (Figure 2), the H2O band at 3000–3600 cm−1 has a substantial overlap with that of H2O2, and the peak shape would be attributable to the sum of H2O2 decrease and H2O increase. In addition, H2O2 has another strong peak at 2827 cm−1, which is often assigned to the ν2 + ν6 combination band.33 If the amount of H2O2 decreases after H atom exposure, the intensity of the peak should also decrease. However, a peak was observed slightly above the baseline at 2850 cm−1 after H atom exposure, unlike other peaks at ∼3300 and 1385 cm−1 (Figure 2). These apparently contradictory observations will be discussed later in the Discussion section. Two small peaks appeared at 3697 and 3721 cm−1 after H atom exposure (Figure 2), which are attributed to the 3- and 2-coordinated water molecules, respectively.34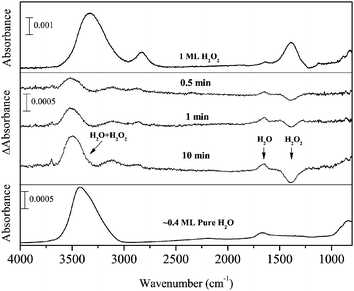 | ||
| Fig. 2 FTIR spectra of H2O2 (top) and pure H2O (bottom) and the variations in the difference spectra of H2O2 after exposure to H atoms for up to 10 min at 15 K (middle). | ||
Figure 3 shows the difference spectra of 1 ML H2O2 after D atom exposure for up to 120 min at 15 K. If H2O2 reacts with D atoms, HDO is expected to form as a main product by the following reaction:
| H2O2 + D → HDO + OH. | (11) |
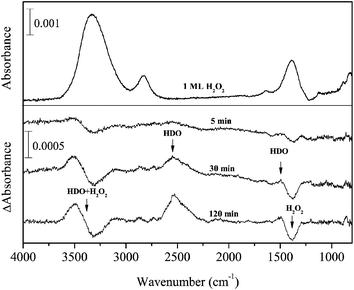 | ||
| Fig. 3 Variations in the difference spectra of H2O2 after exposure to D atoms for up to 120 min at 15 K. | ||
After D atom exposure to H2O2, the peak area for OH stretching and bending bands decreased. New peaks appeared at 3490, 2527, and 1492 cm−1, which are typically observed for solid HDO at low temperatures.35,36 This result clearly indicates that HDO was formed by reaction (11) at 15 K. Although the peak area for OH stretching and bending bands decreased after D atom exposure, the ν2 + ν6 combination band at 2860 cm−1 increased slightly. Very small peaks appeared at 2722 and 3693 cm−1 after D atom exposure (Figure 3), the former of which is probably derived from the dangling OD bond of HDO.37 The latter peak could be the dangling OH bond of HDO; however, the assignment is uncertain because of low S/N.
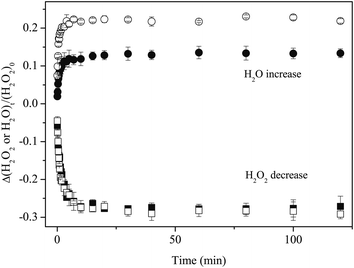
Figure 4 plots variations in the column density of solid H2O2 normalized to the unexposed initial amount after exposure to H or D atoms. We fitted the plots in Figure 4 to the following single-exponential decay function to obtain the kinetic parameters for reactions (3) and (11):
| Δ[H2O2]t/[H2O2]0 = A(e−kn[X]t − 1), | (12) |
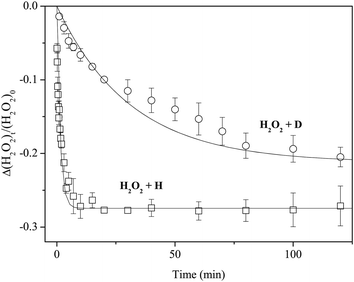 | ||
| Fig. 4 Variations in the column density of H2O2 normalized to the initial amount as a function of exposure time of H or D atoms at 15 K. Solid lines are single-exponential decay fits to the plots. | ||
In the present study, we do not determine the absolute yields of reaction products with the decrease in the column density of reactants, because the band strengths of the products (H2O or HDO) have been reported only for a transmission method. Using these reported values may cause a large error (<50%)31 when those band strengths are used in a reflection method. However, it does not affect the values of effective rate constants because the term of band strength is not included in equation (12). In addition, a portion of the reaction products could desorb from the substrate upon formation,38,39 making the interpretation of the yields of products more difficult.
D2O2 + H and D2O2 + D
Figure 5 shows variations in the difference spectra of pure solid D2O2 after exposure to H atoms on the Al substrate at 15 K. With increasing D atom fluence, the peak intensity of OD stretching and bending bands at 2467 and 1045 cm−1, respectively, decreased, and new peaks appeared at 3455, 2587, and 1477 cm−1. By comparing the peak positions with those given in the literature,36 we determined that these new peaks are attributable to HDO, indicating that solid D2O2 reacted with H atoms to yield HDO at 15 K:| D2O2 + H → HDO + OD. | (13) |
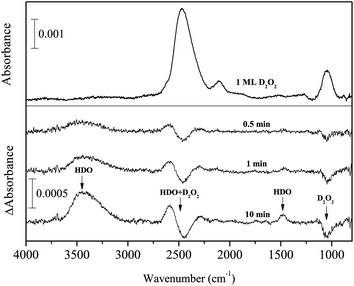 | ||
| Fig. 5 Variations in the difference spectra of D2O2 after exposure to H atoms for up to 10 min at 15 K. | ||
The peak intensity of the ν2 + ν6 combination band for D2O2 (2126 cm−1)33 increased slightly, which is opposite to the behavior that would be observed if D2O2 was consumed by reaction (13). The dangling OH band of HDO was observed at 3694 cm−1 while the dangling OD band was not confirmed probably due to low S/N (Figure 5).
Figure 6 shows variations in the difference spectra after D atom exposure to D2O2 for up to 120 min at 15 K. This experiment was performed to study reaction (7):
| D2O2 + D → D2O + OD. | (7) |
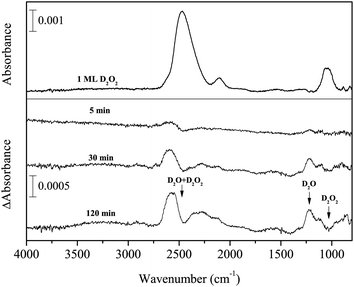 | ||
| Fig. 6 Variations in the difference spectra of D2O2 after exposure to D atoms for up to 120 min at 15 K. | ||
This reaction has been studied in previous O2 deuteration experiments.15,32 In the present study, with increasing D atom fluence, new peaks appeared at 2562 and 1220 cm−1, concurrent with the decrease of D2O2 (Figure 6). The new peaks can be attributed to the OD stretching and bending of D2O, which clearly indicates that reaction (7) occurred to yield D2O on the surface at 15 K. A small peak was observed after exposure to D atoms at 2727 cm−1, which is assigned to the 3-coordinated dangling OD band of D2O.34 A 2-coordinated dangling OD band (at 2748 cm−1)34 was not firmly identified, probably due to the low S/N of the spectrum. The peak intensity of the ν2 + ν6 combination band for D2O2 increased as well (Figure 6).
Figure 7 shows variations in the column density of solid D2O2 normalized to the unexposed initial amount after H or D atom exposure at 15 K. The relative abundance of D2O2 by reaction (13) reaches a saturation value of approximately −0.2 after a few minutes. In contrast, the decrease of D2O2 by reaction (7) was much slower, reaching the almost same saturation value after 150 min. By fitting the plots in Figure 7 into single exponential decay function (12) where [H2O2] is replaced with [D2O2], we obtained k13′ = 8.9 × 10⁻¹ and k7′ = 2.3 × 10⁻² min−1, and the k13′/k7′ ratio was 38.
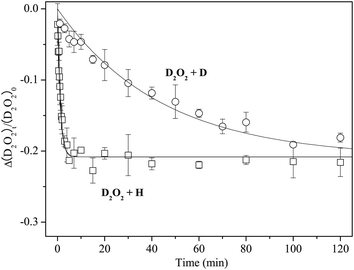 | ||
| Fig. 7 Variations in the column density of D2O2 normalized to the initial amount as a function of H or D atom exposure times at 15 K. Solid lines are single-exponential decay fits to the plots. | ||
Reactions on amorphous D2O ice
Hydrogenation and deuteration of solid H2O2 and D2O2 were also performed on vapor-deposited a-D2O with a thickness of ∼30 ML at 15 K. Figure 8 shows an IR spectrum of 1 ML solid H2O2 produced on a-D2O and the difference spectra after H atom exposure for up to 5 min. The peak area of the ν2 + ν6 combination band before H atom exposure was larger by a factor of two than that on the Al substrate, although the peak area of other bands (OH stretching and bending) was almost equal.With increasing H atom fluence, the intensities of peaks at 3233, 2852, and 1392 cm−1 decreased and new peaks appeared at 3422 and 1635 cm−1. These observations clearly indicate that H2O was formed by reaction (13). Notably, the peak intensity for the ν2 + ν6 combination band at 2852 cm−1 decreased after H atom exposure. This behavior is straightforward since H2O2 was consumed by reaction (13); however, interestingly, this is opposite to the result for the same reactions of pure H2O2 on the Al substrate described above. In addition to reaction (13), we confirmed in separate experiments that reactions (11), (13), and (7) occur on a-D2O at 15 K. Two small peaks appeared at 3697 and 3719 cm−1 after exposure to H atoms (Figure 8), which are attributed to the 3- and 2-coordinated dangling OH bands, respectively.34
We determined the effective rate constants with statistical errors for each reaction (Table 1) by fitting the attenuation of H2O2 and D2O2 into a single exponential decay function (12). As a general trend, values of k′ are larger for reactions on a-D2O.
| Reaction | Reaction number | Substrate | Effective rate (min−1) | E a (K)a | Reduced mass (u) |
|---|---|---|---|---|---|
| a Taquet et al.40 | |||||
| H2O2 + H | 3 | Al | 7.2 ± 0.6 × 10⁻¹ | 2508 | 0.97 |
| a-D2O | 9.9 ± 0.6 × 10⁻¹ | ||||
| H2O2 + D | 11 | Al | 3.2 ± 0.1 × 10⁻² | 2355 | 1.89 |
| a-D2O | 4.0 ± 0.6 × 10⁻² | ||||
| D2O2 + H | 13 | Al | 8.9 ± 1.1 × 10⁻¹ | 2540 | 0.97 |
| a-D2O | 9.2 ± 0.6 × 10⁻¹ | ||||
| D2O2 + D | 7 | Al | 2.3 ± 0.2 × 10⁻² | 2384 | 1.89 |
| a-D2O | 2.2 ± 0.8 × 10⁻² | ||||
The column densities of H2O formed on the Al and a-D2O by reaction (3) were calculated using the band strength of the OH-bending at 1635 cm−1 (1.2 × 10⁻¹⁷ cm molecule−1).28 We determined that the H2O yield on a-D2O was approximately two orders of magnitude larger than that on the Al at the same H fluence, although the amount of H2O2 consumption on H atom exposure was identical for a-D2O and Al (Figure 9).
Temperature dependence of reaction kinetics
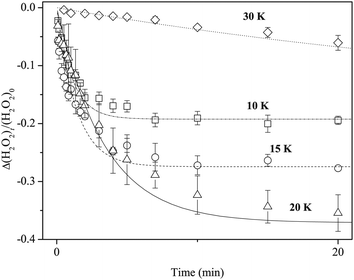
Reaction (3) was studied using pure H2O2 at 10, 20, and 30 K as well as at 15 K. Reaction (3) occurred at all temperatures. We obtained kinetic parameters for reaction (3) (k3′) at each temperature following the procedures described above. Figure 10 shows variations in the relative abundance of pure H2O2 after H atom exposure at 10–30 K. The temperature dependence shows that the saturation value of H2O2 becomes larger with increasing temperature up to 20 K; however, at 30 K, the reaction is very slow and the saturation value is much less than that below 20 K. The effective rate constant is the largest at 10 K and decreases with increasing temperature. These features were also obtained for reactions on a-D2O ice (Figure 11).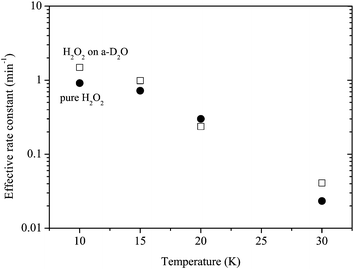 | ||
| Fig. 11 Temperature dependence of the effective rate constant for reaction (3): filled circle and open square symbols represent the rate for pure H2O2 and H2O2 on a-D2O, respectively. | ||
Discussion
Quantum tunneling and isotope effect
The reaction of H2O2 with H atoms and that of their deuterated counterparts has a large activation barrier (>2000 K) in the gas phase.9,40,41 Therefore, these reactions are expected to proceed through quantum tunneling at 10–30 K even on the surface, as mentioned earlier. A tunneling reaction strongly depends on the transmission mass of the activation barrier of reaction, as can be seen in equation (4). Theoretical studies proposed that H2O formation by reaction (3) initiates from the formation of an intermediate by H atom addition to one O atom in H2O2, followed by the cleavage of the O–O bond.9,41 In general, the tunneling mass in the two-body addition reaction is described by the reduced mass μ.12,13 As shown in Table 1, the mass dependence of the reaction rate is evident; the lighter mass results in a faster reaction rate. Thus, we conclude that the reactions of H2O2/D2O2 with H/D atoms proceed by quantum tunneling.The ratios of the effective rate constants between reactions (3) and (11) (k3′/k11′) are 23 and 25 for pure H2O2 and H2O2 on a-D2O, respectively. Since the effective rate constant kn′ is expressed as kn[X] where X = H or D, the ratio of the effective rate constants is not equal to the ratio of the actual reaction rate constants if [H] ≠ [D]. Assuming that the value of [X] has a linear correlation with the flux of X atoms in the present experiment, the ratios of k3 to k11 (k3/k11) become 44 and 48 for pure H2O2 and H2O2 on a-D2O, respectively, because the D atom flux is approximately twice that of the H atom flux. Similarly, the k13/k7 ratio was calculated to be 75 and 81 for pure D2O2 and D2O2 on a-D2O, respectively. Taquet et al.40 calculated a tunneling probability Pn through an Eckart potential barrier for reaction (n). In the present study, if we compare the P3/P11 ratio with the k3/k11 and the P13/P7 ratio with the k13/k7, we obtain k3/k11 = ∼2 × P3/P11 and k13/k7 = ∼3 × P13/P7. These differences are not surprising because the tunneling probability is significantly affected by the shape of the potential barrier, and it is very difficult to determine the tunneling rate with an accurate barrier for surface reactions. In fact, Taquet et al.40 noted that, although the Eckart model provides a significant improvement over square barriers, which were typically used for this type of calculation, the tunneling probabilities of some reactions at low temperatures can be underestimated (or overestimated).
We obtained the k3/k7 ratios of 61 and 88 for pure H2O2/D2O2 and H2O2/D2O2 on a-D2O, respectively. These values are about one order of magnitude larger than those reported by Miyauchi et al., who determined the k3′/k7′ ratio to be 8 in their O2 hydrogenation/deuteration experiments at 10 K. Since the flux of H atoms was the same with that of D atoms in the previous experiment,15 the k3′/k7′ ratio is certainly equal to the k3/k7 ratio on the assumption that the ratio of surface number densities between H and D atoms is same as that of the fluxes. The large difference may arise for several reasons. First, multi-parameter fittings may cause significant errors of k3 and k7 in their work. Second, H2O and D2O would form in O2 hydrogenation/deuteration via separate pathways: OH + OH → H2O + O and OD + OD → D2O + O, respectively, which are both barrierless reactions. This would lead to an overestimation of the k3/k7 ratio. In the present study, these uncertainties are removed because H2O2 or D2O2 are used as the initial reactants. Thus, we believe that our calculated value of k3/k7 is more reliable than that obtained in O2 hydrogenation/deuteration experiments.
Next, we compare the rates of reactions (3) and (5). The k5/k3 ratio in the O2 hydrogenation experiment was reported to be 3.3.15 Based on the fact that reaction (5) is barrierless and reaction (3) has a large barrier (>2000 K),9 the value obtained by Miyauchi et al. seems to be rather small. Subsequently, we calculated the k5/k3 ratio using k3′ obtained in the present study. The value of k5′ reported by Miyauchi et al. (12.8 min−1)15 was not used for this calculation because their conditions such as atom fluxes and sample amounts were significantly different from ours. Instead, we used the value of k5′ (5.2 min−1) obtained in the following experiment: solid O2 (∼3 ML) on an amorphous D2O ice (30 ML) was exposed to H atoms (flux: 2 × 10¹⁴ atoms cm−2 s−1) at 10 K.42 After the correction of the flux difference, we obtained the k5/k3 ratio of ∼15, which is approximately five times larger than that reported by Miyauchi et al.15 Although the sample compositions and the fluxes of H atoms in these two experiments do not exactly match, we believe that the present result would better represent the k5/k3 ratio compared to previous studies.
Notably, the observed isotope effect in the hydrogen/deuterium addition to H2O2 (k3/k11) is much larger than that for one of the astrochemically-important tunneling surface reactions: the hydrogenation/deuteration of CO. Hidaka et al.27 reported that the rate of CO hydrogenation (kH) was larger than CO deuteration (kD), with a kH/kD ratio of 12.5. This isotope effect is approximately four times smaller than that of the hydrogenation/deuteration of H2O2 observed in the present study. This large difference is rather surprising because the barrier height for the hydrogenation/deuteration of H2O2 is similar to that of CO.40,43 We believe that the difference might have been due to accumulation of multiple factors such as differences in residence time of H/D atoms on H2O2 and CO and the shape of the potential barriers.
As mentioned previously, we assume that the surface density of H atoms is the same as that of D atoms when the flux is equal. However, in a series of experiments under high H and D flux conditions, this may not always be true. Even under the same flux conditions for H and D atoms, the surface density of D atoms ([D]) may become larger than that of H atoms ([H]). Since H atoms can diffuse faster on the surface than D atoms, the recombination probability for H atoms is higher than that for D atoms,12 resulting in a lower value of [H] than that of [D] even under the same fluxes. In that case, the ratio of [H]/[D] becomes smaller than 0.5, yielding larger values of k3/k11 and k13/k7 than those reported in the present study. Further studies related to the surface densities of H and D atoms are necessary.
Dependence of reaction efficiency on temperature and type of substrate
The effective rate constants for reaction (3) decrease with increasing substrate temperature (Figure 11). This is opposite to the typical Arrhenius-type behavior where the reaction rate has a positive correlation with temperature. In addition, because reaction (3) occurred through quantum tunneling, the reaction rate should have lesser dependence on the surface temperatures. The decrease of the effective rate can be explained well by the decrease in the number density of H atoms on the surface with increasing temperature because the effective rate k3′ is expressed by k3[H]. This trend was also observed in CO hydrogenation and deuteration, H2CO hydrogenation, H–D substitution of CH3OH, and O2 hydrogenation on low-temperature surfaces.11,42The difference of the effective rate constant between reactions of pure H2O2 and H2O2 on a-D2O is the largest at 10 K and decreases with increasing temperature (Figure 11). The large difference observed at lower temperatures (<15 K) may be explained by the difference in the number density of H atoms on the surface because a-D2O would have a much larger surface area compared to planar Al substrate, as reported for CO hydrogenation by Hidaka et al.44 who determined that the surface area for a-H2O with thickness equivalent to ∼17 ML is approximately nine times larger than that for crystalline H2O. In contrast, at elevated temperatures where the residence time of H atoms on the surface is very short even on a-D2O, the difference could little be affected by the density of H atoms, which can lead to similar effective rate constant values under both conditions (Figure 11).
In Figure 9, H2O yield for the sample of pure H2O2 on Al substrate is lower than that for H2O2 on a-D2O, although the decrease of H2O2 is approximately the same for both samples. This difference may be partly explained by immediate desorption of H2O formed as a product at the reaction preferentially occurred on the Al substrate. This behavior is also observed in O2 + D experiments on amorphous silicates and a-H2O, where the yield of D2O is higher for reactions on a-H2O.39 The heat of reaction (3) (285 kJ mol−1 = 2.9 eV) is partly partitioned to the reaction product H2O and OH. This energy would be sufficient for H2O to desorb from the substrate (Al or a-D2O). For the H2O2 on a-D2O sample, interaction of H2O2 and H2O product with the a-D2O surface is much stronger than that with the Al surface because of hydrogen bonding. Therefore, the reaction heat can dissipate into a-D2O more easily, and desorption at the reaction surface may be reduced. Furthermore, since a-D2O has a large surface area because of pores and cracks, the desorbed H2O can be retrapped on the surface of a-D2O. This type of H2O relaxation and trap has been demonstrated both experimentally45–47 and theoretically48,49 to occur during the photodesorption of H2O from bulk a-H2O. In addition to H2O, OH should also form by reaction (3) and can be the source of another H2O formation. Accordingly, H2O and OH trapped on the surface of a-D2O may explain the larger column density of the formed H2O than that on the Al substrate (Figure 9).
As shown in Figure 1, solid H2O2 produced on the Al substrate has representative strong absorptions at three positions: 1385 (ν2), 2827 (ν2 + ν6), and 3326 cm−1 (ν1).33 Similarly, for solid H2O2 on a-D2O, these three peaks are slightly shifted on the spectrum at 1392, 2852, and 3233 cm−1 (Figure 8). The difference in the peak position for each band is not very large (<25 cm−1). However, the peak area of the ν2 + ν6 combination band was larger by a factor of two for the sample on a-D2O, although the peak area of other bands (ν1 and ν2) was identical on both substrates. A relatively strong peak at ∼2850 cm−1 for solid H2O2 is typically assigned to the ν2 + ν6 combination band;33,50 however, some studies considered that this assignment is disputable.51,52 Ignatov et al.51 proposed that this peak is attributable to an OH valence band of the H2O2 molecule placed in the unusual surface environment. The present results imply that the peak intensity at ∼2850 cm−1 might correlate with the configuration of H2O2 on the substrate. In addition, the fact that H2O2 forms hydrogen bonds more on a-D2O than on Al could result in the different IR features at ∼2850 cm−1. In other words, the number of hydrogen bonds between H2O2 and surrounding H2O may constrain the peak intensity at ∼2850 cm−1. If this is the case, it could explain the contradictory behavior of the peak intensity after exposure to atoms (e.g.Figures 2 and 8). More detailed experimental and theoretical studies are necessary for the precise peak assignment. Thus, we propose that care should be taken when this IR peak is used for quantification of solid H2O2 in various environments.
Dangling OH (OD) bands of reaction products
We confirmed that the formed solid H2O and its isotopologues (HDO and D2O) show the dangling OH (OD) bands (e.g., Figure 2). The presence of dangling OH bands in the IR spectrum of solid H2O typically indicates that it is amorphous and has a microporous structure.34 However, we have reported that dangling OH bands are not observed in solid H2O formed by codeposition of O2 and H atoms at 10 K and that the formed ice is amorphous but has a compact structure.31 These different results suggest that the formed ice structure depends on experimental conditions and that the properties of the reaction products are strikingly different between each study (multilayers with O2 contaminants vs. very thin layers with little contaminants).Astrophysical implication
Deuterated water (HDO and D2O) has been identified in the gas phase with HDO/H2O and D2O/H2O ratios up to the order of 10−2 and 10−3, respectively, toward protostars.53–57 In contrast, deuterated water was not clearly identified in the solid phase; only the upper limit of HDO was determined (HDO/H2O < 0.2%–2%).58,59 Despite the detection of deuterated water in the gas phase only, it is reasonable to consider that deuterated water is also produced by surface reactions on interstellar grains at very low temperatures.The following reactions are possible to yield water isotopologues from H2O2 and its isotopologues:
| H2O2 + H → H2O + OH, | (3) |
| H2O2 + D → HDO + OH, | (11) |
| D2O2 + H → HDO + OD, | (13) |
| D2O2 + D → D2O + OD, | (7) |
| HDO2 + H → HDO + OH, | (14a) |
| HDO2 + H → H2O + OD, | (14b) |
| HDO2 + D → HDO + OD, | (15a) |
| HDO2 + D → D2O + OH. | (15b) |
We did not study reactions (14) and (15) because of difficulty in producing high-purity HDO2. Two types of reaction products are possible for reactions (14) and (15). Since the reduced mass of a reaction to produce the intermediate does not depend on the type of products, we expect that reactions (14a) and (14b) occur to the same extent statistically. In fact, the tunneling probability for reaction (14a) is calculated to be identical with that of reaction (14b).40 The same is true for reactions (15a) and (15b). Thus, for simplicity, we made a rough assumption based on the obtained results that H atom addition reactions such as reactions (3) and (13) occur faster by a factor of 50 than D atom addition reactions such as reactions (7) and (11). In addition, we assume that the atomic D/H ratio is constant and the surface diffusion rates of H and D atoms are the same. Under these assumptions, we determined that the HDO/H2O ratio was almost identical to the atomic D/H ratio, while the D2O formation was negligible (∼10−6 that of H2O). On the other hand, assuming no isotope effect on the reactions, the HDO/H2O ratio becomes twice as large as the atomic D/H ratio; thus, quantum tunneling would cause a decrease of the HDO/H2O ratio in this reaction pathway. In other words, if quantum tunneling corrections are not included in a chemical model, the obtained result should overestimate the value of the HDO/H2O ratio.
We extend this discussion to other water formation pathways, i.e., reactions (1) (OH + H → H2O) and (2) (OH + H2 → H2O + H). For reaction (2), we have experimentally determined the relative efficiency of reactions for all possible isotopologues;14 H atom abstraction reactions are approximately ten times more efficient than D atom abstraction reactions. Assuming that OH and OD are formed by surface reactions O + H and O + D, respectively, HD/H2 ratio is 10−5, and no D2 is present, the HDO/H2O ratio was very much consistent with the atomic D/H ratio.
In contrast to the former two reaction pathways, the reactions of OH or OD with H or D atoms do not have an activation barrier. Thus, the product ratio would strongly depend on the atomic D/H ratio. Since there are two possible reactions to yield HDO (OH + D → HDO and OD + H → HDO), statistically the HDO/H2O ratio is twice as large as the atomic D/H ratio. With regard to the formation of D2O, this reaction pathway is the most favorable among the three reaction pathways; the D2O/H2O ratio is statistically the square of the value of the D/H ratio. For example, the D2O/H2O ratio is 10−4 if the atomic D/H is 10−2. This value is two to four orders of magnitude higher than that estimated by other pathways under the same assumptions. Therefore, the OD + D reaction is the only possible pathway to effectively yield D2O in MCs.
Moreover, it is important to note that, on grain surfaces, the deuterium fractionation of water occurs only during the formation by surface reactions at the typical temperature of MCs (∼10 K). This is supported by the fact that H2O does not react with D atoms at <15 K60 and thermal H–D exchange does not occur at <100 K,61 which prevents the D-enrichment by H–D substitution with other deuterium-enriched species after the formation of H2O on the grains. The reactivity of water with D atoms at low temperatures differs from that of organic species such as CH3OH,25,60 H2CO,13,27 and CH3NH262 where H–D exchange occurs for these molecules by reacting with D atoms at temperatures as low as 10 K.
Based on the present and previous experimental results for water formation, we suggest that the HDO/H2O ratio might be a key parameter to estimate the atomic D/H ratio during the formation of water. Namely, the following relationship is roughly derived from experimental studies: (D/H)atom ≤ (HDO/H2O) ≤ 2(D/H)atom or 1/2(HDO/H2O) ≤ (D/H)atom ≤ (HDO/H2O), where (D/H)atom and (HDO/H2O) represent the atomic D/H on grains and the HDO/H2O ratio formed by surface reactions, respectively. Note that these relationships were derived with reference to experimental studies for surface reactions. In addition to surface reactions, deuterium fractionation of water by gas phase reactions may also be possible.63 Moreover, energetic processes induced by UV and cosmic rays might cause hydrogen isotopic fractionation of water during its decomposition and interactions with other ice components, both of which may modify the HDO/H2O ratio. Therefore, we propose that further collaborative theoretical and experimental studies on surface and gas phase chemistries are necessary to construct a complete chemical model regarding the evolution of the water D/H ratio in MCs.
Acknowledgements
The authors thank Drs H. Hidaka and T. Hama for fruitful discussions at the earlier stages of manuscript preparation. We also thank an anonymous referee for providing constructive comments. This work is partly supported by a Grant-in-Aid for Scientific Research from the Japan Society for the Promotion of Science. Y.O. has received funding from the Kurita Water and Environment Foundation.References
- E. Herbst and W. Klempere, Astrophys. J., 1973, 185, 505–533 CrossRef CAS.
- T. I. Hasegawa, E. Herbst and C. M. Leung, Astrophys. J. Suppl., 1992, 82, 167–195 CrossRef CAS.
- A. Tielens and W. Hagen, Astron. Astrophys., 1982, 114, 245–260 CAS.
- F. Dulieu, L. Amiaud, E. Congiu, J. H. Fillion, E. Matar, A. Momeni, V. Pirronello and J. L. Lemaire, Astron. Astrophys., 2010, 512, 5 CrossRef PubMed.
- K. Hiraoka, T. Miyagoshi, T. Takayama, K. Yamamoto and Y. Kihara, Astrophys. J., 1998, 498, 710–715 CrossRef CAS PubMed.
- D. P. Jing, J. He, M. Bonini, J. R. Brucato and G. Vidali, J. Phys. Chem. A, 2013, 117, 3009–3016 CrossRef CAS PubMed.
- D. P. Jing, J. He, J. Brucato, A. De Sio, L. Tozzetti and G. Vidali, Astrophys. J., 2011, 741, 5 CrossRef.
- R. Atkinson, D. L. Baulch, R. A. Cox, J. N. Crowley, R. F. Hampson, R. G. Hynes, M. E. Jenkin, M. J. Rossi and J. Troe, Atmos. Chem. Phys., 2004, 4, 1461–1738 CrossRef CAS.
- H. Koussa, M. Bahri, N. Jaidane and Z. Ben Lakhdar, THEOCHEM, 2006, 770, 149–156 CrossRef CAS PubMed.
- H. M. Cuppen and E. Herbst, Astrophys. J., 2007, 668, 294–309 CrossRef CAS.
- N. Watanabe and A. Kouchi, Prog. Surf. Sci., 2008, 83, 439–489 CrossRef CAS PubMed.
- T. Hama and N. Watanabe, Chem. Rev., 2013, 113, 8783–8839 CrossRef CAS PubMed.
- H. Hidaka, M. Watanabe, A. Kouchi and N. Watanabe, Astrophys. J., 2009, 702, 291–300 CrossRef CAS.
- Y. Oba, N. Watanabe, T. Hama, K. Kuwahata, H. Hidaka and A. Kouchi, Astrophys. J., 2012, 749 Search PubMed.
- N. Miyauchi, H. Hidaka, T. Chigai, A. Nagaoka, N. Watanabe and A. Kouchi, Chem. Phys. Lett., 2008, 456, 27–30 CrossRef CAS PubMed.
- H. M. Cuppen, S. Ioppolo, C. Romanzin and H. Linnartz, Phys. Chem. Chem. Phys., 2010, 12, 12077–12088 RSC.
- Y. Oba, N. Watanabe, A. Kouchi, T. Hama and V. Pirronello, Phys. Chem. Chem. Phys., 2011, 13, 15792–15797 RSC.
- T. Lamberts, H. M. Cuppen, S. Ioppolo and H. Linnartz, Phys. Chem. Chem. Phys., 2013, 15, 8287–8302 RSC.
- G. W. Fuchs, H. M. Cuppen, S. Ioppolo, C. Romanzin, S. E. Bisschop, S. Andersson, E. F. van Dishoeck and H. Linnartz, Astron. Astrophys., 2009, 505, 629–639 CrossRef CAS PubMed.
- C. Pirim and L. Krim, Chem. Phys., 2011, 380, 67–76 CrossRef CAS PubMed.
- N. Watanabe and A. Kouchi, Astrophys. J., 2002, 571, L173–L176 CrossRef CAS.
- N. Watanabe, T. Shiraki and A. Kouchi, Astrophys. J., 2003, 588, L121–L124 CrossRef CAS.
- N. Watanabe, A. Nagaoka, T. Shiraki and A. Kouchi, Astrophys. J., 2004, 616, 638–642 CrossRef CAS.
- H. Hidaka, N. Watanabe, T. Shiraki, A. Nagaoka and A. Kouchi, Astrophys. J., 2004, 614, 1124–1131 CrossRef CAS.
- A. Nagaoka, N. Watanabe and A. Kouchi, J. Phys. Chem. A, 2007, 111, 3016–3028 CrossRef CAS PubMed.
- N. Watanabe, A. Nagaoka, H. Hidaka, T. Shiraki, T. Chigai and A. Kouchi, Planet. Space Sci., 2006, 54, 1107–1114 CrossRef CAS PubMed.
- H. Hidaka, A. Kouchi and N. Watanabe, J. Chem. Phys., 2007, 126 Search PubMed.
- P. A. Gerakines, W. A. Schutte, J. M. Greenberg and E. F. van Dishoeck, Astron. Astrophys., 1995, 296, 810–818 CAS.
- M. J. Loeffler and R. A. Baragiola, J. Phys. Chem. A, 2011, 115, 5324–5328 CrossRef CAS PubMed.
- R. G. Smith, S. B. Charnley, Y. J. Pendleton, C. M. Wright, M. M. Maldoni and G. Robinson, Astrophys. J., 2011, 743, 13 CrossRef.
- Y. Oba, N. Miyauchi, H. Hidaka, T. Chigai, N. Watanabe and A. Kouchi, Astrophys. J., 2009, 701, 464–470 CrossRef CAS.
- S. Ioppolo, H. M. Cuppen, C. Romanzin, E. F. van Dishoeck and H. Linnartz, Astrophys. J., 2008, 686, 1474–1479 CrossRef CAS.
- J. A. Lannon, F. D. Verderam and R. W. Anderson, J. Chem. Phys., 1971, 54, 2212–2223 CrossRef CAS PubMed.
- V. Buch and J. P. Devlin, J. Chem. Phys., 1991, 94, 4091–4092 CrossRef CAS PubMed.
- J. P. Devlin, J. Mol. Struct., 1990, 224, 33–43 CrossRef CAS.
- D. F. Hornig, H. F. White and F. P. Reding, Spectrochim. Acta, 1958, 12, 338–349 CrossRef CAS.
- J. P. Devlin, J. Chem. Phys., 2000, 112, 5527–5529 CrossRef CAS PubMed.
- R. T. Garrod, V. Wakelam and E. Herbst, Astron. Astrophys., 2007, 467, 1103–1115 CrossRef CAS.
- H. Chaabouni, M. Minissale, G. Manico, E. Congiu, J. A. Noble, S. Baouche, M. Accolla, J. L. Lemaire, V. Pirronello and F. Dulieu, J. Chem. Phys., 2012, 137, 234706 CrossRef CAS PubMed.
- V. Taquet, P. S. Peters, C. Kahane, C. Ceccarelli, A. Lopez-Sepulcre, C. Toubin, D. Duflot and L. Wiesenfeld, Astron. Astrophys., 2013, 550, 23 CrossRef PubMed.
- B. A. Ellingson, D. P. Theis, O. Tishchenko, J. Zheng and D. G. Truhlar, J. Phys. Chem. A, 2007, 111, 13554–13566 CrossRef CAS PubMed.
- Y. Oba, N. Miyauchi, T. Chigai, H. Hidaka, N. Watanabe and A. Kouchi, in Physics and Chemistry of Ice 2010, Hokkaido University Press, 2011, Y. Furukawa, G. Sazaki, T. Uchida, and N. Watanabe, Eds., 361–368 Search PubMed.
- D. E. Woon, Astrophys. J., 2002, 569, 541–548 CrossRef CAS.
- H. Hidaka, N. Miyauchi, A. Kouchi and N. Watanabe, Chem. Phys. Lett., 2008, 456, 36–40 CrossRef CAS PubMed.
- T. Hama, M. Yokoyama, A. Yabushita, M. Kawasaki, S. Andersson, C. M. Western, M. N. R. Ashfold, R. N. Dixon and N. Watanabe, J. Chem. Phys., 2010, 132, 8 CrossRef PubMed.
- A. Yabushita, T. Hama, M. Yokoyama, M. Kawasaki, S. Andersson, R. N. Dixon, M. N. R. Ashfold and N. Watanabe, Astrophys. J., 2009, 699, L80–L83 CrossRef CAS.
- K. I. Oberg, H. Linnartz, R. Visser and E. F. van Dishoeck, Astrophys. J., 2009, 693, 1209–1218 CrossRef.
- S. Andersson and E. F. van Dishoeck, Astron. Astrophys., 2008, 491, 907–916 CrossRef CAS.
- C. Arasa, S. Andersson, H. M. Cuppen, E. F. van Dishoeck and G. J. Kroes, J. Chem. Phys., 2010, 132, 12 CrossRef PubMed.
- A. Engdahl, B. Nelander and G. Karlstrom, J. Phys. Chem. A, 2001, 105, 8393–8398 CrossRef CAS.
- S. K. Ignatov, A. G. Razuvaev, P. G. Sennikov and O. Schrems, THEOCHEM, 2009, 908, 47–54 CrossRef CAS PubMed.
- P. G. Sennikov, S. K. Ignatov and O. Schrems, ChemPhysChem, 2005, 6, 392–412 CrossRef CAS PubMed.
- H. M. Butner, S. B. Charnley, C. Ceccarelli, S. D. Rodgers, J. R. Pardo, B. Parise, J. Cernicharo and G. R. Davis, Astrophys. J., 2007, 659, L137–L140 CrossRef CAS.
- C. Ceccarelli, C. Dominik, E. Caux, B. Lefloch and P. Caselli, Astrophys. J., 2005, 631, L81–L84 CrossRef CAS.
- A. Coutens, C. Vastel, E. Caux, C. Ceccarelli, S. Bottinelli, L. Wiesenfeld, A. Faure, Y. Scribano and C. Kahane, Astron. Astrophys., 2012, 539, 12 CrossRef PubMed.
- B. Parise, E. Caux, A. Castets, C. Ceccarelli, L. Loinard, A. Tielens, A. Bacmann, S. Cazaux, C. Comito, F. Helmich, C. Kahane, P. Schilke, E. van Dishoeck, V. Wakelam and A. Walters, Astron. Astrophys., 2005, 431, 547–554 CrossRef CAS.
- C. Vastel, C. Ceccarelli, E. Caux, A. Coutens, J. Cernicharo, S. Bottinelli, K. Demyk, A. Faure, L. Wiesenfeld, Y. Scribano, A. Bacmann, P. Hily-Blant, S. Maret, A. Walters, E. A. Bergin, G. A. Blake, A. Castets, N. Crimier, C. Dominik, P. Encrenaz, M. Gerin, P. Hennebelle, C. Kahane, A. Klotz, G. Melnick, L. Pagani, B. Parise, P. Schilke, V. Wakelam, A. Baudry, T. Bell, M. Benedettini, A. Boogert, S. Cabrit, P. Caselli, C. Codella, C. Comito, E. Falgarone, A. Fuente, P. F. Goldsmith, F. Helmich, T. Henning, E. Herbst, T. Jacq, M. Kama, W. Langer, B. Lefloch, D. Lis, S. Lord, A. Lorenzani, D. Neufeld, B. Nisini, S. Pacheco, J. Pearson, T. Phillips, M. Salez, P. Saraceno, K. Schuster, X. Tielens, F. van der Tak, M. H. D. van der Wiel, S. Viti, F. Wyrowski, H. Yorke, P. Cais, J. M. Krieg, M. Olberg and L. Ravera, Astron. Astrophys., 2010, 521, 5 CrossRef PubMed.
- E. Dartois, W. F. Thi, T. R. Geballe, D. Deboffle, L. d'Hendecourt and E. van Dishoeck, Astron. Astrophys., 2003, 399, 1009–1020 CrossRef CAS.
- B. Parise, T. Simon, E. Caux, E. Dartois, C. Ceccarelli, J. Rayner and A. Tielens, Astron. Astrophys., 2003, 410, 897–904 CrossRef CAS.
- A. Nagaoka, N. Watanabe and A. Kouchi, Astrophys. J., 2005, 624, L29–L32 CrossRef CAS.
- J. P. Devlin and V. Buch, J. Chem. Phys., 2007, 127, 4 CrossRef PubMed.
- Y. Oba, T. Chigai, Y. Osamura, N. Watanabe and A. Kouchi, Meteorit. Planet. Sci., 2014, 49, 117–132 CrossRef CAS.
- H. Roberts, E. Herbst and T. J. Millar, Astron. Astrophys., 2004, 424, 905–917 CrossRef CAS.
| This journal is © The Royal Society of Chemistry 2014 |

