Bioavailability, distribution and clearance of tracheally instilled, gavaged or injected cerium dioxide nanoparticles and ionic cerium†
Ramon M.
Molina
a,
Nagarjun V.
Konduru
a,
Renato J.
Jimenez
a,
Georgios
Pyrgiotakis
a,
Philip
Demokritou
a,
Wendel
Wohlleben
b and
Joseph D.
Brain
*a
aCenter for Nanotechnology and Nanotoxicology, Molecular and Integrative Physiological Sciences Program, Department of Environmental Health, Harvard School of Public Health, 665 Huntington Avenue, Boston, MA 02115, USA. E-mail: brain@hsph.harvard.edu; Fax: +1 617 432 4710; Tel: +1 617 432 1272
bBASF SE, Material Physics, Carl-Bosch-Str. 38, 67056 Ludwigshafen, Germany
First published on 19th September 2014
Abstract
Cerium oxide nanoparticles (NPs) have wide commercial applications. Understanding their fate in the body is fundamental to toxicological evaluations. We compared bioavailability, tissue distribution, clearance and excretion of radioactive 141Ce after intratracheal instillation (IT), gavage, or intravenous (IV) injection of neutron-activated 141CeO2 NPs and 141CeCl3 (ionic 141Ce) in Wistar Han rats. First, we evaluated pulmonary responses to IT-instilled CeO2 NPs and CeCl3 and observed dose-dependent inflammatory effects. Then, groups of rats were IT-instilled with 1 mg kg−1 of 141CeO2 NPs or 0.1 mg kg−1 141CeCl3. Sequential analyses of lungs over 28 days showed slow lung clearance of 141CeO2 NPs (half-life = ~140 days) and of ionic 141Ce (half-life = ~55 days). However, less than 1% and 6% of instilled 141Ce was measured in selected extrapulmonary organs in 141CeO2 NPs and ionic 141Ce groups, respectively. Following gavage (5 mg kg−1), nearly 100% of both test materials was excreted in the feces. Since detected 141Ce activity in tissues could be in nanoparticulate or dissolved form, we also compared the 141Ce tissue distribution post-IV injection with the IT and gavage data. Both IV-injected ionic 141CeCl3 and 141CeO2 NPs were predominantly retained in the liver, bone and spleen, all organs that typically remove circulating particles. We conclude that nanoceria is slowly cleared from the lungs but has minimal extrapulmonary accumulation. Potential risks from prolonged pulmonary retention need further investigation. Risk from ingested nanoceria is likely far lower due to very low absorption and rapid elimination of ceria not absorbed from the gastrointestinal tract.
Nano impactAfter extensive physical and chemical characterization of cerium oxide nanoparticles, the pharmacokinetics of neutron-activated 141CeO2 NPs and ionic 141Ce were studied in Wistar rats. Three routes of administration were used: intratracheal instillation, gavage, or intravenous injection. The lung clearance of 141Ce had a half-life of about 140 days, while that of ionic cerium was 55 days. Both half-lives are far slower than seen in more familiar metal oxides and their ionic species. Importantly, bioavailability from the gut was orders of magnitude less than that via the lungs. We saw minimal Ce accumulation in other tissues, showing that translocation from the lungs was minimal. The mechanisms for prolonged retention of Ce need to be characterized so that risks can be better estimated. |
Introduction
Cerium oxide nanoparticles (NPs) are widely used in various nanotechnology applications such as polishing,1 solid oxide fuel cells2,3 and as a fuel additive.4,5 Owing to its inherent ability to switch oxidation states from Ce4+ to Ce3+, cerium has particular effectiveness in driving redox catalysis based applications.6–8 One biomedical application of this property is its use as an antioxidant.9,10 Cerium oxide is also a promising sunscreen component due to its ability to block broad-spectrum UV radiation.11 Because of its wide and diverse use, it is important to characterize its potential adverse health effects.Studies on nanoceria toxicity undertaken during the last decade show conflicting data on biological effects. A number of in vivo and in vitro studies evaluating their biological effects have reported toxicity and oxidative stress.12–14 However, recent reports highlight the potential antioxidant activity of nanoceria in protection against a variety of oxidative stress-related disorders.15–18 Few studies have shown the influence of particle size, synthesis protocols, and particle aging on the biological effects of nanoceria.7,19 It is possible that nanoceria particle aggregation in air and aqueous media are among the factors contributing to the discrepancies among inhalation studies versus intratracheal instillation and in vitro experiments. Nanoparticle aggregation is influenced by surface charge, material type, size, and other factors, such as the protein corona. Nanoparticle recognition and uptake by alveolar macrophages is an important mechanism of effective nanoparticle clearance and subsequent dissolution or translocation. It has been shown that particle aggregation, forming clusters of >100 nm, promotes effective phagocytosis by alveolar macrophages. Smaller (especially <20 nm) nanoparticle aggregates are more likely to evade macrophage-mediated “surveillance” and translocate across barriers.20–22
A few studies have examined pulmonary clearance of nanoceria in animal models. A recent study by He et al. investigated the fate of radiolabeled nanoceria after intratracheal instillation or gavage in rats.23 They showed that only ~35% of instilled dose was cleared from the rat lung over 28 days. The radioactive nanoceria used were 6.6 nm, synthesized by the precipitation method using 141Ce(NO3)3 as the precursor. Several studies have described the long-term biopersistence of cerium oxide and its dissolution kinetics in vivo and in vitro.23–29 A recent study by Dan et al. compared the vascular clearance of different sized nanoceria (5, 15, 30 and 55 nm primary particle sizes) and cerium chloride after intravenous infusion.30 The study employed very high doses (50 and 250 mg kg−1 body weight) and focused on the systemic clearance of nanoceria. The results showed that nanoceria pharmacokinetic behavior differs from ionic cerium. As nanoparticle clearance is also significantly influenced by administered dose, studies using a range of doses are needed. More recently, Geraets et al. described the pulmonary and extrapulmonary distribution of aerosolized nanoceria in rats.31 Animals were repeatedly exposed to nanoceria for several hours on multiple days. Although the study showed the extent of cerium accumulation in various tissues, the lung clearance was not determined.
In this study, we sought to determine whether the route of exposure (intratracheal instillation, gavage, intravenous injection) influences the distribution and clearance of cerium oxide nanoparticles. We compared the pharmacokinetics of 141Ce in rats instilled with neutron-activated 141CeO2 NPs versus141CeCl3 to differentiate the kinetics of nanoparticle-associated cerium versus free ionic cerium. These comparisons provide a better understanding of how much cerium from nanoceria are absorbed from the lungs versus the gut. To what extent does cerium translocate, and does it translocate as intact particles or as dissolved ionic cerium?
Materials and methods
Characterization of CeO2 nanoparticles
The cerium oxide used in this study was obtained from Mercator GmbH (Berlin, Germany). It is a test material assigned the specific code NM-212 by the OECD sponsored program for safety testing of manufactured nanomaterials. Extensive characterization of CeO2 NM-212 has been previously reported by the European Commission's Joint Research Centre.32 The sample used in this study was characterized based on nano specific guidelines by the European Chemicals Agency (ECHA).33 The methods employed have been published elsewhere34 and are summarized in ESI.† Anhydrous beads of cerium(III) chloride were obtained from Sigma-Aldrich (St. Louis, MO, USA).Neutron activation of CeO2 nanoparticles and CeCl3
CeO2 NPs and CeCl3 powder were neutron activated at the MIT Nuclear Reactor Laboratory (Cambridge, MA) with a thermal neutron flux of 5 × 10¹³ n cm−2 s−1 for 24 hours. The process generated the radioisotope 141Ce, which decays with a half-life of 32.5 days and emits gamma energy of 145.4 KeV. The specific activity was 4.7 μCi 141Ce per mg CeO2 and 4.3 μCi 141Ce per mg CeCl3.In vitro bioaccessibility tests
CeO2 NPs were incubated under varying pH and chemical conditions to measure bioaccessibility, which is the fraction of cerium that dissolves. The nanoparticles were incubated in different fluids at 37 °C: phosphate-buffered saline (PBS) for 28 days to simulate surface deposition in the lungs, synthetic phagolysosomal simulant fluid (PSF) for 28 days to simulate uptake and digestion in macrophages,35 0.1N HCl for 1 day to simulate oral ingestion and stomach transit time, and fasted state simulant intestinal fluid (FaSSIF) for 7 days to simulate gastrointestinal intraluminal conditions. All incubation times were chosen at or above the maximum realistic residence time of nanoceria in specific body compartments, since we expected low dissolution in these simulant fluids. We determined nanoparticle agglomeration (size and charge), release of ions in supernatant by inductively coupled mass spectroscopy (ICP-MS), structural changes of particles by scanning and transmission electron microscopy (SEM/TEM) on sediment and nanoparticle durability by selected area electron diffraction (SAD).Animals
The protocols used in this study were approved by the Harvard Medical Area Animal Care and Use Committee. Male Wistar Han rats (8 weeks old) were obtained from Charles River Laboratories (Wilmington, MA, USA) and were housed in standard microisolator cages under controlled conditions of temperature, humidity and light at the Harvard Center for Comparative Medicine. They were fed commercial chow (PicoLab Rodent Diet 5053, Framingham, MA, USA) and were provided with reverse-osmosis purified water ad libitum. The animals were acclimatized in the facility for at least 7 days before the start of experiments.Preparation of CeO2 nanoparticle suspension for animal dosing
Particle suspensions at specified concentrations were prepared in sterile distilled water in conical polyethylene tubes. A critical dispersion sonication energy (DSEcr) to achieve the smallest particle agglomerate size was used, as previously reported.36 The suspensions were sonicated at 242 J ml−1 (20 min ml−1 at 0.2 watt power output) in a cup sonicator fitted on Sonifier S-450A (Branson Ultrasonics, Danbury, CT, USA). The sample tubes were immersed in running cold water to minimize heating of the particles during sonication. The hydrodynamic diameter (HD), polydispersity index (PdI) and zeta potential (ζ) of each suspension were measured by dynamic light scattering using a Zetasizer Nano-ZS (Malvern Instruments, Worcestershire, UK).Assessment of pulmonary effects of CeO2 nanoparticles and CeCl3 – Bronchoalveolar lavage and analyses
This experiment was performed to determine the safe dose for intratracheal instillation of CeO2 NPs or CeCl3 where inflammation or injury was minimal. Twenty-four rats (wt. = 249 ± 4 g) were instilled intratracheally with CeO2 suspension at 0.2, or 1.0 mg kg−1 and 0.1 mg kg−1 CeCl3 (n = 6 rats per group). Another group of rats instilled with an equivalent volume of distilled water served as controls. The particle suspensions were delivered to the lungs through the trachea, as described earlier.37 Twenty-four hours later, rats were anesthetized and then euthanized via exsanguination, with a cut in the abdominal aorta. The trachea was exposed and cannulated. The lungs were then lavaged 12 times with 3 mL of Ca++- and Mg++-free 0.9% sterile PBS. The cells from all washes were separated from the supernatant by centrifugation (350 × g at 4 °C for 10 min). Total cell count and hemoglobin measurements were made from the cell pellets. A dilute cell suspension was cytocentrifuged, the cytospin was stained and differential cell counting was performed. The supernatant from the first two washes was clarified via centrifugation (14![[thin space (1/6-em)]](https://www.rsc.org/images/entities/char_2009.gif) 500 × g at 4 °C for 30 min), and used for standard spectrophotometric assays for lactate dehydrogenase (LDH), myeloperoxidase (MPO) and albumin.38
500 × g at 4 °C for 30 min), and used for standard spectrophotometric assays for lactate dehydrogenase (LDH), myeloperoxidase (MPO) and albumin.38
Pharmacokinetics of intratracheally-instilled, gavaged and intravenously injected 141CeO2 nanoparticles and 141CeCl3
The nanoparticle doses used were 0.1 mg kg−1 (141CeCl3) and 1 mg kg−1 (141CeO2 NPs) for IT instillation, 1 mg kg−1 for IV injection and 5 mg kg−1 for gavage administration. Neutron-activated 141CeO2 NPs were suspended in sterile distilled water at 0.67 mg ml−1 for IT instillation (1.5 ml kg−1 body weight) or at 5 mg ml−1 for gavage administration (1 ml kg−1) and sonicated as described above. Another group of rats was IT-instilled with 0.067 mg ml−1 of neutron-activated CeCl3 at the same volume dose (1.5 ml kg−1). The radioactivity in multiple aliquots of each suspension or solution was measured in a WIZARD Gamma Counter (PerkinElmer, Inc., Waltham, MA, USA).Each rat was anesthetized with isoflurane (Piramal Healthcare, Bethlehem, PA, USA). The 141CeO2 NP suspension or 141CeCl3 solution was delivered to the lungs through the trachea, into the bloodstream via the penile vein, or into the stomach via the esophagus. Each rat was then placed in a metabolic cage with food and water ad libitum for fecal and urine sample collection. Five rats from the IT group were humanely killed at 5 m, 2 d, 7 d and 28 d post-dosing. The same number of rats was analyzed at 5 m and 7 d post-gavage, and at 2 h and 2 d post-IV injection. Analysis of rats at 5 minutes post-IT instillation and post-gavage was performed to obtain an accurate measure of the initial deposited dose. Since we anticipated that clearance from the gastrointestinal tract would be faster, the gavage experiment spanned only 7 days. Since it has been shown that a small fraction of inhaled nanoparticles may translocate into the systemic circulation,39,40 we evaluated the tissue distribution of intravenously injected 141CeO2 NPs to elucidate their fate in the circulation. Twenty four-hour samples of feces and urine were collected at selected time points (0–24 hours, 2–3 days, 6–7 days, 9–10 days, 13–14 days, 20–21 days and 27–28 days post-IT instillation; 0–24 hours, 2–3 days and 6–7 days post-gavage; and 0–24 hours post-IV injection).
At each time point, rats were anesthetized and as much blood as possible was collected from the abdominal aorta. Plasma and red blood cells were separated by centrifugation at 3000 × g for 10 minutes at 4 °C. After euthanasia, the whole lungs, brain, heart, spleen, kidney, gastrointestinal tract, testes, liver, and multiple samples of skeletal muscle and bone marrow, skin, and the two femoral bones were collected and placed in pre-weighed tubes. Each sample weight was recorded. Radioactivity was measured in a WIZARD Gamma Counter (PerkinElmer, Inc., Waltham, MA, USA). Disintegrations per minute were calculated from the measured counts per minute (minus background) and the counter efficiency. Data were expressed as μCi g−1 and as a percentage of the administered dose retained in each organ. All radioactivity data were adjusted for physical decay over the entire observation period. The radioactivity in organs and tissues not measured in their entirety was estimated from measured aliquots as a percentage of total body weight as follows: skeletal muscle, 40%; bone marrow, 3.2%; peripheral blood, 7%; skin, 19%; and bone, 6%.41,42
Pulmonary distribution of 141CeO2 nanoparticles and 141CeCl3
To determine the pulmonary distribution of instilled 141CeO2 NPs and 141CeCl3 within the lungs at 1 d post-instillation, a separate cohort of rats were IT-instilled with 1 mg kg−1 141CeO2 and 0.1 mg kg−1 141CeCl3. Twenty-four hours later, the lungs were lavaged as described above. The BAL fluid was centrifuged at 350 × g for 10 m at 4 °C to separate lavaged cells from the supernatant. The cell pellets were resuspended in 0.5 ml PBS. The lavaged lungs, BAL supernatants and cell pellets were analyzed for 141Ce. The total radioactivity in each of the three lung compartments was expressed as a percentage of the total radioactivity recovered in the whole lungs.Statistical analyses
All data were analyzed using multivariate analysis of variance (MANOVA) followed by Bonferroni (Dunn) post hoc tests using SAS Statistical Analysis Software (SAS Institute, Cary, NC, USA).Results
Particle characterization
Table 1 summarizes the results of CeO2 NP characterization. We found that the average primary particle diameter was approximately 40 nm based on transmission and scanning electron microscopy (Fig. 1A, B), crystallite size derived from diffraction peak width on X-ray diffraction (Fig. 1D), and sphere-equivalent diameter derived from the specific surface area of 27 m2 g−1. The width of the peak of inter-particle pore sizes in Hg intrusion porosimetry indicated a polydispersity in primary particle diameters from 15 nm to 70 nm, consistent with electron microscopy observations. The material was crystalline with a cubic lattice characteristic for cerianite, and had irregular but roughly globular shapes. In the as-produced powder, these single particles were agglomerated to sizes that ranged from a few hundred nanometers to tens of microns.| Parameters | Results |
|---|---|
| TEM – Transmission electron microscopy. XRD – X-ray diffraction. Hg – Mercury porosimetry. BET – Brunauer–Emmett–Teller. TGA – Thermogravimetric. XPS – X-ray photoelectron spectroscopy. AAN – Average agglomeration number. | |
| Primary particle diameter(TEM) | 40 nm |
| State of agglomeration | Hg – pore sizes: 35 nm, around 7 μm |
| Crystallite size (XRD) | 40 nm |
| Crystalline phase (XRD) | Cerianite – (Ce), syn – CeO2 – Cubic |
| Specific surface area (Hg, BET) | 30 m2 g−1 (Hg), 27 m2 g−1 (BET) |
| Surface chemistry (XPS) | C 79.9 |
(C–C 62.6; C–O 7.0; C![[double bond, length as m-dash]](https://www.rsc.org/images/entities/char_e001.gif) O 3.5; COOH 6.9) O 3.5; COOH 6.9) |
|
| O 17.7 | |
(CeO2 4.3; Ce2O3 0.5; C![[double bond, length as m-dash]](https://www.rsc.org/images/entities/char_e001.gif) *O–OH 6.2 C *O–OH 6.2 C![[double bond, length as m-dash]](https://www.rsc.org/images/entities/char_e001.gif) O–O*H 6.2; H2O 0.7) O–O*H 6.2; H2O 0.7) |
|
| Ce 2.4 | |
| (CeO2 2.1; Ce2O3 0.3) | |
| Surface charge isoelectric point = IEP | IEP: > pH 10 (always cationic) 3.1 μm s−1/V cm−1 |
| Zeta potential at pH 7 | +42 mV |
| Photocatalytic activity | 0.013 ± 0.005 |
| Photon efficiency | |
| (methylene blue) | |
| Dispersability | D50 = 432 nm/AAN = 11(in water) |
| Purity | Crystalline phase is >99% pure cerianite |
| Impurities (TGA, XPS) | Total content of 0.7% organic contaminations, identified as ester + alkyl groups, found on the particle surface |
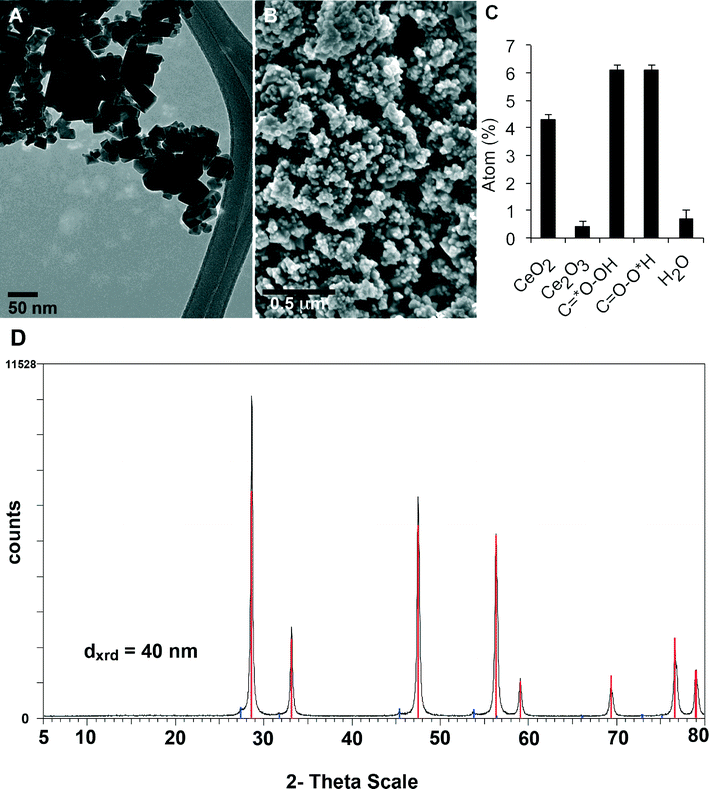 | ||
| Fig. 1 Physicochemical characterization of CeO2 NM-212. (A) TEM of primary nanoparticles. (B) SEM micrograph of dry powder. (C) XPS results of oxygen that identify organic impurities and the Ce redox state on the particle surface, in accordance with the spectra of C and Ce in Fig. S2 (ESI†). See Table 1 for size characterization by other complementary methods. (D) XRD spectrum of CeO2 NM-212. All major peaks correspond to the expected diffraction angles and intensity of cubic cerianite. The minor peaks are attributed to diffraction angles of cubic cerianite from tungsten Lα- radiation, excited as low background in the X-ray source. | ||
The surface of the CeO2 NPs contained organic contaminants (Fig. 1C). As determined by thermogravimetry (TGA), the total organic content was below 0.7%. The photoelectron signal of XPS, which has an information depth of up to 10 nm, was dominated by these organics. Hence, the organic contamination was a very thin and homogeneous layer around the pure inorganic particles. According to the fit of photoelectron energies from C(1s) atoms and O(1s) atoms, the contamination could be an ester with a long alkyl chain (Fig. S2, ESI†). The Ce atoms at crystalline edges are known to be redox-active, which was confirmed by the detection of a majority of it as Ce(IV) and 14% as Ce(III) within the XPS-accessible surface depth (Fig. 1C).
When dispersed in water, the nanoparticle surface was positively charged across the entire physiological pH range with a zeta-potential of +42 mV at pH 7. Despite the organic contaminants, the surface was reactive in a photocatalytic assay with a photon efficiency of 0.013 ± 0.005 (Fig. S3, ESI†). Dynamic light scattering analysis of CeO2 NP suspension in distilled water showed a hydrodynamic diameter of 207 ± 3.95 nm, polydispersity index of 0.196 ± 0.018, zeta potential of +37.8 ±1.85 mV and a pH of 7.85 (Fig. S4, ESI†). Hence, the instilled NPs after optimal sonication had a significant but controllable agglomeration far below the micron range.
Bioaccessibility
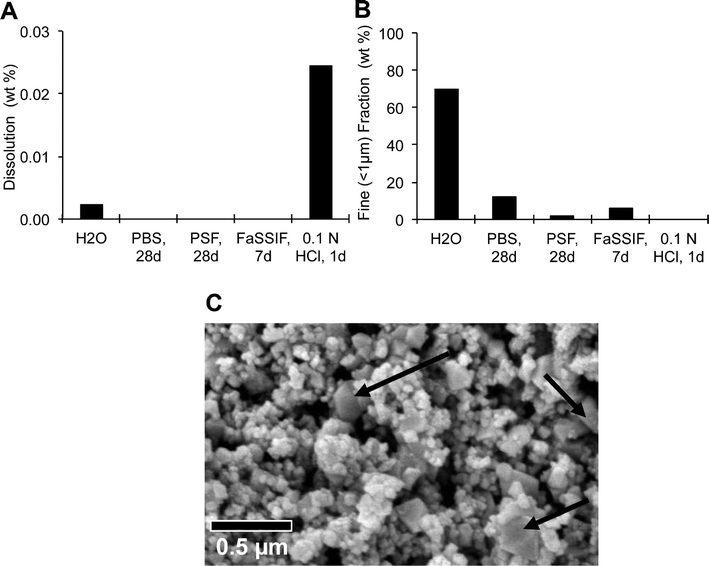
The solubility in simulated physiological fluids was measured by analyzing both the remaining nanoparticulate fraction by SEM, analytical ultracentrifugation (AUC), laser diffraction (LD) and zeta-potential, and the released metal ions in the supernatant by ICP-MS. We found that the CeO2 NPs were virtually insoluble under all conditions tested (Fig. 2A). Cerium oxide NPs formed agglomerates in most physiological simulant fluids. The fine fraction (defined as particle or agglomerate with diameter below 1 μm, determined by AUC) decreased significantly (Fig. 2B). Under all conditions, the primary particles remained recognizable in SEM scans, but in buffers with organic constituents (PSF, FaSSIF) the surface charge reversed to negative zeta-potentials, which indicates adsorption of buffer constituents to the NPs. The CeO2 NPs showed structural changes in the acidic PSF medium. The SEM scan after 28 days incubation in PSF showed micron-sized spheres and greater than 100 nm rhombohedron crystallites (Fig. 2C) that were absent in the as-produced powder (Fig. 1B). We found by SAD analysis that these structures retained the same cubic cerianite crystalline phase of the as-produced powder (Fig. S1†).Pulmonary response to intratracheally-instilled CeO2 nanoparticles and CeCl3
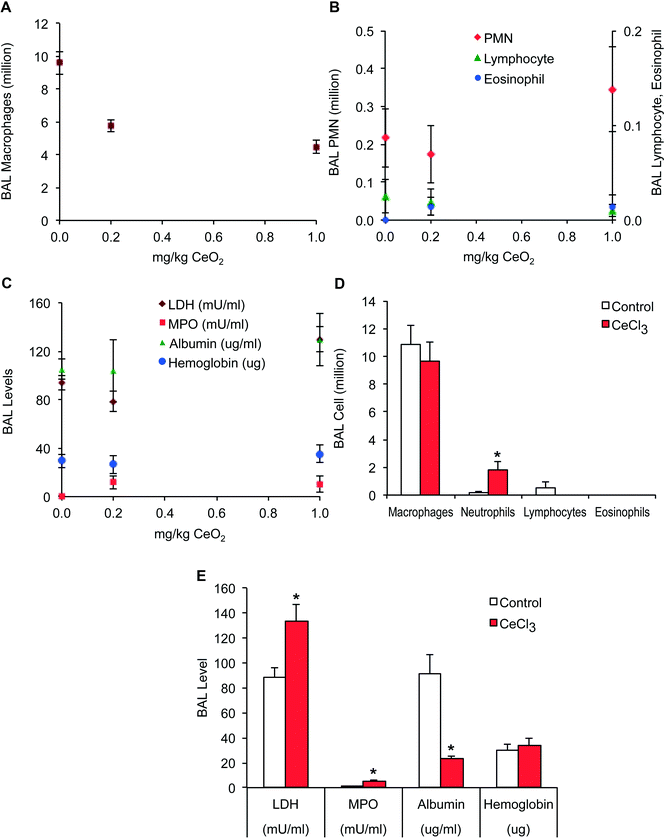
Prior to pharmacokinetic experiments, we determined a dose for IT instillation that would not cause significant pulmonary injury and inflammation. We focused on evaluation of acute effects measured at 24 h post-instillation. We found no significant increase in several endpoints measured in bronchoalveolar lavage (BAL) at 0.2 and 1 mg kg−1 of CeO2 NPs compared with vehicle control (Fig. 3A, B and C). The only parameter that significantly decreased was the macrophage number (Fig. 3A). The significant decrease in macrophages retrieved in BAL from CeO2 NP-instilled animals could have been due to macrophage toxicity or enhanced macrophage adhesion on the epithelial surface and thus reduced recovery by lavage. No significant changes in lavaged neutrophil, lymphocyte, or eosinophil numbers, and lactate dehydrogenase, myeloperoxidase, albumin and hemoglobin levels were observed following instillation of CeO2 NPs. However, pulmonary responses to instilled CeCl3 were observed at the lower 0.1 mg kg−1 dose. There were significant increases in neutrophils (Fig. 3D), myeloperoxidase and lactate dehydrogenase and a significant decrease in albumin (Fig. 3D).Lung clearance of 141CeO2 nanoparticles and 141CeCl3
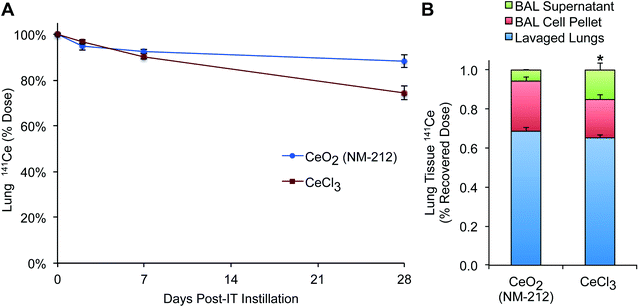
Clearance of instilled 141CeO2 NPs from the lungs is shown in Fig. 4A. Radioactive 141CeO2 was cleared slowly from the lungs with a half-life longer than 28 days, the last time point in the study. To estimate the clearance half-life, linear regression of the average lung 141Ce levels over time was performed. Correlation coefficients (R2) were 0.78 (y = −0.003x + 0.96) and 0.98 (y = −0.009x + 0.99) for 141CeO2 NPs and 141CeCl3, respectively. Extrapolated half-lives were 55 days (CeCl3) and 140 days (CeO2 NPs). Clearance of 141CeO2 NPs was biphasic with a fast component during the first 2 days, followed by a slower phase seen through 28 days when 87.5% of the 141Ce remained in the lungs. Lung clearance of ionic 141CeCl3 was more linear and was relatively faster with a clearance half-life of approximately 55 days. Still, only 26% of the dose was cleared at the end of observation period.We examined the distribution of 141Ce within the lungs at 24 hours post-instillation of CeO2 NPs (Fig. 4B). The majority (68.6%) was detected in the lavaged lungs representing adhered and tissue-associated 141Ce. Approximately 26% was measured in the cell pellet, presumably mostly in macrophages. Only 5.7% of recovered 141Ce was found in the supernatant. The lung distribution of ionic 141Ce was similar, except a larger fraction was recovered in the supernatant and to a lesser extent in the cell pellet.
Extrapulmonary retention of 141Ce post-instillation of 141CeO2 nanoparticles and 141CeCl3
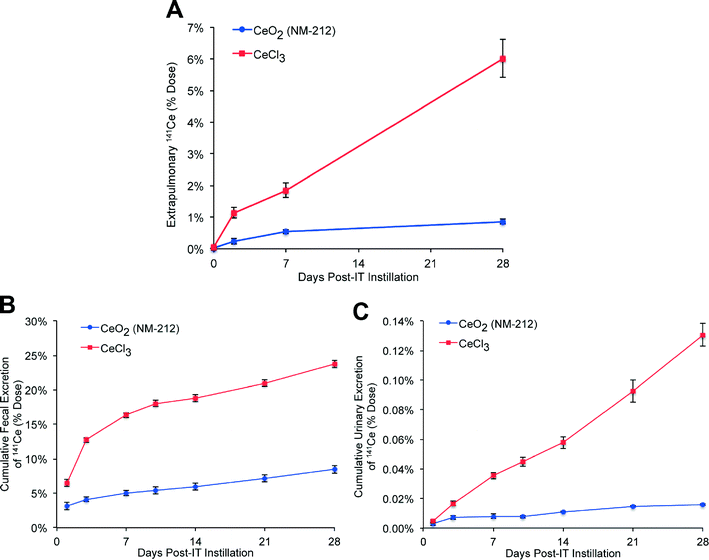
The total amount of 141Ce from 141CeO2 NPs and from ionic 141Ce retained in extrapulmonary tissues at 28 days were 0.9% and 6.0% of the total instilled dose, respectively (Fig. 5A). These were primarily detected in the liver and bone (Table 3). The higher translocation of ionic 141Ce is consistent with relatively faster lung clearance. The elimination of 141Ce from either 141CeO2 NPs or 141CeCl3 was mostly via the feces (Fig. 5B) and to a much lesser extent via the urine (Fig. 5C). The fecal and urinary elimination of 141Ce in rats instilled with 141CeCl3 was significantly higher than in the 141CeO2 NP group.Fate of 141Ce after gavage of 141CeO2 nanoparticles and 141CeCl3
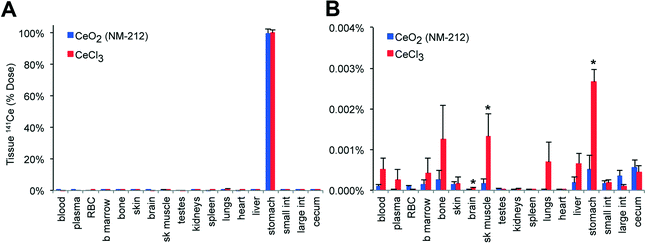
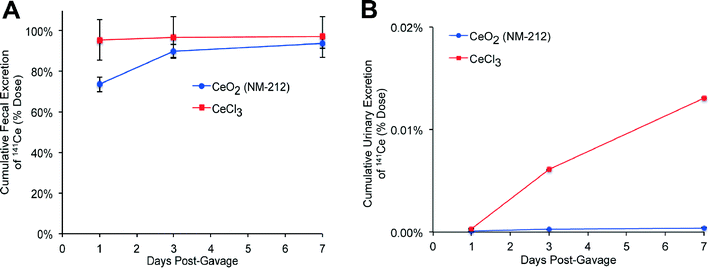
Absorption of 141Ce from the gut was studied at 5 m and 7 d post-gavage. Nearly 100% of the dose was recovered at 5 m in the stomach in both groups after gavage (Fig. 6A). Very low levels of 141Ce from NPs (0.003 ± 0.0004%) and from CeCl3 (0.009 ± 0.001%) were measured in all organs examined at 7 days (Fig. 6B). Nearly the entire 141Ce dose from both forms of cerium was excreted in the feces and urine over 7 days (Fig. 7).Tissue distribution of 141Ce after intravenous injection of 141CeO2 nanoparticles and 141CeCl3
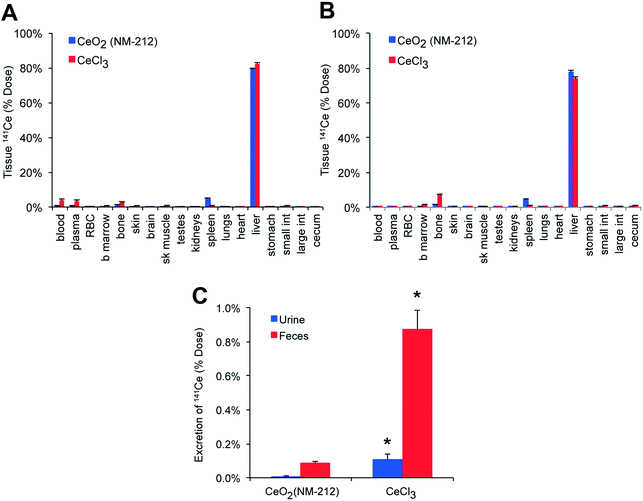
The distribution of 141Ce at 2 h and 2 d post-injection are shown in Fig. 8A and B, respectively. Both ionic and nanoparticulate 141Ce were retained in the liver, spleen and bone at 2 h (Fig. 8A). Ionic 141Ce remained in the plasma longer than the nanoparticulate 141Ce and the bone levels increased as the liver decreased (Fig. 8B). No such redistribution was observed in the 141CeO2 NP group. The fecal excretion of 141Ce in the NP group during the first 24 hours was far lower than in the ionic cerium group (0.08% v. 0.9%) (Fig. 8C).Cerium tissue concentration – influence of route of exposure
We examined whether route of exposure influences tissue retention of cerium over time. Using the measured specific activities of 141CeO2 NPs and each tissue 141Ce concentration, we estimated Ce concentration as ng Ce g−1 tissue. The Ce concentrations at 7 d post-IT and post-gavage are shown in Table 2. Our data showed that IT instillation of 141CeO2 NPs resulted in significantly higher Ce tissue concentrations despite the fact that we administered a 5-fold lower dose than in gavage (1 v. 5 mg kg−1). Significantly higher Ce concentration was measured in bone marrow, bone, skin, testes, kidneys, spleen, heart, liver, and gastrointestinal tract. The difference between IT (0.1 mg kg−1) and gavage (5 mg kg−1) was also observed with 141CeCl3 even with the dose difference. Cerium concentrations post-IT instillation of 141CeCl3 were also significantly higher than post-gavage in bone (4.29 vs. 0.39 ng g−1) and liver (8.97 vs. 0.84 ng g−1).| Tissue | IT (1 mg kg−1) | Gavage (5 mg kg−1) | ||||
|---|---|---|---|---|---|---|
| Data are mean ± SE ng g−1 cerium concentration, n = 5 per group. Ce concentration was estimated (ng/μCiionic/NPs × μCi/gtissue).a P < 0.05, IT > Gavage. | ||||||
| Lungs | 127858 | ± | 4427a | 0.16 | ± | 0.05 |
| Blood | 0.25 | ± | 0.18 | 0.04 | ± | 0.01 |
| Plasma | 0.04 | ± | 0.03 | 0.01 | ± | 0.01 |
| RBC | 0.06 | ± | 0.04 | 0.07 | ± | 0.02 |
| Bone marrow | 6.61 | ± | 0.41a | 0.12 | ± | 0.08 |
| Bone | 16.86 | ± | 0.89a | 0.11 | ± | 0.09 |
| Skin | 0.18 | ± | 0.01a | 0.02 | ± | 0.01 |
| Brain | 0.01 | ± | 0.01 | 0.05 | ± | 0.03 |
| Skeletal muscle | 1.32 | ± | 1.05 | 0.01 | ± | 0.01 |
| Testes | 0.11 | ± | 0.03a | 0.07 | ± | 0.02 |
| Kidneys | 5.45 | ± | 0.77a | 0.07 | ± | 0.02 |
| Spleen | 1.69 | ± | 0.71a | 0.17 | ± | 0.08 |
| Heart | 1.07 | ± | 0.18a | 0.12 | ± | 0.06 |
| Liver | 28.06 | ± | 2.77a | 0.14 | ± | 0.11 |
| Stomach | 9.18 | ± | 1.20a | 0.00 | ± | 0.00 |
| Small intestine | 4.70 | ± | 0.44a | 0.78 | ± | 0.54 |
| Large intestine | 12.04 | ± | 2.28a | 0.12 | ± | 0.04 |
| Cecum | 13.81 | ± | 2.59a | 0.00 | ± | 0.00 |
Cerium tissue distribution – influence of form of cerium (nanoparticulate 141CeO2versus ionic 141CeCl3)
We examined whether the form of cerium (nanoparticulate versus ionic cerium) affects tissue concentrations of cerium over time. As expected, given that the IT dose for ionic 141Ce was ten-fold lower than for 141CeO2 NPs, tissue Ce concentration in most organs (bone, bone marrow, skin, kidneys, heart, liver, and gastrointestinal tract) were significantly lower. However, the absorption percentages (Fig. 5A) and extrapulmonary uptake of ionic 141Ce was still significantly higher than those of 141CeO2 NPs (Table 3). When administered by gavage at the same dose of 5 mg kg−1, significantly higher Ce concentrations from ionic 141CeCl3 were observed in skeletal muscle (0.001% vs. 0.0002%), liver (0.001% vs. 0.0002%) and stomach (0.003% vs. 0.0005%).| Tissue | CeO2 NPs (1 mg kg−1) | CeCl3 (0.1 mg kg−1) | ||||
|---|---|---|---|---|---|---|
| Data are mean ± SE % instilled dose, n = 5 per group. GIT – gastrointestinal tract.a P < 0.05, CeCl3 > CeO2 NPs. | ||||||
| Blood | 0.00 | ± | 0.00 | 0.01 | ± | 0.005a |
| Bone marrow | 0.08 | ± | 0.01 | 0.70 | ± | 0.06a |
| Bone | 0.32 | ± | 0.04 | 2.50 | ± | 0.33a |
| Skin | 0.01 | ± | 0.001 | 0.06 | ± | 0.03 |
| Brain | 0.0002 | ± | 0.0001 | 0.001 | ± | 0.0004 |
| Skeletal muscle | 0.01 | ± | 0.0004 | 0.05 | ± | 0.02 |
| Testes | 0.0005 | ± | 0.0001 | 0.01 | ± | 0.002a |
| Kidneys | 0.01 | ± | 0.0004 | 0.09 | ± | 0.01a |
| Spleen | 0.002 | ± | 0.001 | 0.01 | ± | 0.01 |
| Heart | 0.04 | ± | 0.04 | 0.01 | ± | 0.002 |
| Liver | 0.26 | ± | 0.01 | 2.15 | ± | 0.31a |
| GIT | 0.12 | ± | 0.04 | 0.43 | ± | 0.05a |
Discussion
Our study describes the pharmacokinetics of radiolabeled 141CeO2 NPs versus ionic 141CeCl3 over time after a single IT instillation, gavage or IV injection. The use of radioactive 141Ce as tracer is a very sensitive method of measuring uptake and clearance of cerium in almost all organs, without the need for high doses that may alter cerium homeostasis or saturate transport mechanisms. Although IT instillation is not the natural route of lung exposure in humans, this technique enables us to administer the radiolabeled material precisely at a specific time point. Our instillation data show that the selected IT instillation dose of 1 mg kg−1 CeO2 NPs for PK studies did not cause injury and inflammation that might compromise our data. Similar low toxicity has been reported in previously reported inhalation studies.43,44 However, the same dose of CeCl3 elicited a higher inflammatory response. Therefore, we used 0.1 mg kg−1 for CeCl3 in the pharmacokinetic study.Retention and clearance of particles in the lungs have been extensively studied in the past. Pulmonary clearance of deposited particles is achieved by either physical translocation or chemical dissolution. Dissolution of particles in intracellular or extracellular fluids usually leads to a fast lung clearance of the resulting ions. In this study, we found that pulmonary clearance of instilled nanoceria is slow, with an estimated half-life of approximately 140 days, consistent with published data on insoluble or poorly soluble particles.22,39,44,45 In a short-term inhalation study, it was reported that approximately 5% of the initial lung burden of nanoceria was cleared by 28 days after the first exposure.44,45 Since our observation period was only 28 days, the clearance half-life estimation must be viewed with caution. The slow lung clearance correlates with very low dissolution of CeO2 NPs in simulated phagolysosomal fluid in vitro (Fig. 2A). The low in vitro dissolution was also consistent with previous data in similar simulant fluid.23,25 Our results show that 88.3% of the instilled dose remained in the lungs after 28 days. This fraction was higher than that reported previously on neutron-activated nanoceria in rats. He et al. reported that 63.9% of the nanoceria remained in the lungs at 28 days, with an estimated half-life of 103 days.23 The faster clearance might be due to smaller primary NP size (6.6 nm) and to methodological differences.
Surprisingly, the clearance of soluble ionic 141CeCl3 was not much faster than that of 141CeO2 NPs. This suggests that cerium transport through the lungs may be tightly regulated or that ionic Ce may form insoluble aggregates or may bind to lung proteins, as has been shown in case of nanoceria.46,47 It also suggests that even if deposited CeO2 NPs were dissolved, cerium would still be cleared slowly. Alternatively, both nanoparticulate and ionic Ce may be phagocytized by cells in the lower airways and alveoli, which then might influence their clearance.39 Indeed, the difference between ionic and nanoparticulate Ce lung clearance correlates with the difference in the fractions recovered in alveolar cells and in lavaged lung tissues (see Fig. 4B). Finally, perhaps the greater lung inflammation induced by ionic cerium (Fig. 3B, C) may have enhanced absorption of Ce through a compromised air-blood barrier. Further studies with lower doses of CeCl3 are necessary to explore this possibility.
Consistent with the lung clearance kinetics, the translocation and subsequent extrapulmonary retention of ionic Ce is significantly higher than Ce retention from the NPs. As previously reported, the primary extrapulmonary site of retention is the liver.48 Even though the translocated Ce from CeO2 NPs at 28 days is very low (0.86% of dose), nearly half of that (0.26%) ends up in the liver. Retention of ionic Ce is significantly higher; it is also mostly taken up in the liver. Excretion of 141Ce is predominantly in the feces.
We also investigated the translocation and subsequent distribution of the same two forms of cerium after gavage. A previous study by Park et al. showed that absorbed cerium was retained in few tissues, especially the lungs, after gavage of 30 nm CeO2 NPs at 100 mg kg−1. But by day 7, the tissue ceria levels returned to control values.27 Since we anticipated that clearance from the gastrointestinal tract would be faster, the experiment spanned only 7 days. Consistent with several studies on ingested nanoparticles, both ionic and nanoparticulate Ce are eliminated rapidly. A very low fraction (<0.009%) of the gavaged dose is detectable in all organs combined. Nearly 100% of the 141Ce dose is excreted in the feces and less than 0.02% in the urine. This means that in inhalation studies on CeO2 NPs where fur contamination and grooming is likely, the cerium detected in extrapulmonary tissues would be predominantly from lung exposure.
There are multiple factors that may promote rapid elimination of ingested Ce. It may be due to the rapid transit time of ingested nanomaterials through the gastrointestinal tract, and the rapid turnover rate of the intestinal epithelium.49 However, other metals are absorbed efficiently in the gut, such as the essential elements iron and zinc.50,51 Another possible reason may be the slow rate of dissolution of cerium oxide particles in the gastrointestinal environment, in contrast to some Zn minerals, which are more soluble.52 The influence of gastrointestinal dissolution of nanoceria does not seem to play a role in Ce absorption, since both ionic Ce and nanoceria have negligible bioavailability. Thus, a final explanation for the very low bioavailability of both soluble and particulate cerium is that transport mechanisms for cerium ions are lacking.
Finally, we also compared the tissue distributions of IV-injected nanoparticulate and ionic Ce. We hypothesized that the distribution would be markedly different between nanoparticulate and ionic Ce, as is true for iron and some other metals.53,54 We expected that these data would provide information on whether CeO2 NPs translocate as dissolved ions or as intact nanoparticulates. As anticipated for IV-injected particles, CeO2 NPs are immediately taken up in organs rich in mononuclear phagocytes with direct access to the circulating blood, such as those in the liver, spleen and bone.55 Nanoceria uptake and biopersistence in reticuloendothelial organs post-IV injection28,29 and in retinal cells post-intravitreal injection24 have been reported previously. Vascular clearance of IV-injected nanoceria was influenced by NP size; the smaller NPs persisted longer in the circulation.29 Surprisingly, we found that ionic Ce follows almost the same tissue distribution as the nanoceria. This may be due to the plasma protein interaction with ionic Ce forming aggregates, which may be recognized by phagocytes in reticuloendothelial organs. Alternatively, in the liver this may be due to the possibility that the site of Ce accumulation is the hepatocytes rather than Kupffer cells. That hepatocytes can be the target for retained cerium is consistent with a previous study showing that a high dose of instilled nanoceria causes hepatocyte toxicity.48 However, confirmation of hepatocyte localization of cerium requires ultrastructural elemental analysis.
In toto, we showed that the risk of extrapulmonary cerium tissue accumulation and potential toxicity is low when nanoceria are inhaled. The risk is even lower and probably insignificant when cerium is ingested since it is not absorbed and is rapidly excreted in the feces.
Conclusions
We conclude that inhaled cerium oxide nanoparticles are cleared slowly from the lungs with an estimated clearance half-life of 140 days. Additionally, we found that even ionic cerium is cleared slowly from the lungs, unlike most other soluble metals. This suggests that the translocation of cerium is restricted in the lungs. The slow clearance of nanoceria may be due to poor solubility of cerium oxide, as shown by the absence of dissolution in simulant phagolysosomal fluid. The significant association of nanoceria and cerium ions with alveolar cells and lung interstitial tissues may promote its biopersistence. Further studies should be done to examine the extent to which clearance mechanisms are influenced by particle load and dose rate. Our data clearly show that ingested nanoceria poses almost no risk of absorption. Ingested nanoceria are almost entirely excreted in the feces. Importantly, low fractions of inhaled nanoceria translocate to extrapulmonary tissues. The long-term effects of biopersistent inhaled nanoceria and cerium ions warrant further investigations.Acknowledgements
This study was funded by support from BASF SE (Ludwigshafen, Germany) and by the National Science Foundation (1235806) and National Institute of Environmental Health Sciences (ES000002). This work was performed in part at the Harvard Center for Nanoscale System (CNS), supported by National Science Foundation (ECS-0335765). We thank Thomas Bork for technical assistance with neutron activation, Thomas Donaghey for statistical analyses and editorial assistance, and Melissa Curran for editorial assistance.References
- V. D. Kosynkin, A. A. Arzgatkina, E. N. Ivanov, M. G. Chtoutsa, A. I. Grabko, A. V. Kardapolov and N. A. Sysina, J. Alloys Compd., 2000, 303, 421–425 CrossRef
.
- Z. Shao and S. M. Haile, Nature, 2004, 431, 170–173 CrossRef CAS PubMed
.
- A. B. Stambouli and E. Traversa, Renewable Sustainable Energy Rev., 2002, 6, 433–455 CrossRef CAS
.
- K. Nikolaou, Sci. Total Environ., 1999, 235, 71–76 CrossRef CAS
.
- B. Park, K. Donaldson, R. Duffin, L. Tran, F. Kelly, I. Mudway, J. P. Morin, R. Guest, P. Jenkinson, Z. Samaras, M. Giannouli, H. Kouridis and P. Martin, Inhalation Toxicol., 2008, 20, 547–566 CrossRef CAS PubMed
.
- A. Bumajdad, J. Eastoe and A. Mathew, Adv. Colloid Interface Sci., 2009, 147–148, 56–66 CrossRef CAS PubMed
.
- A. S. Karakoti, P. Munusamy, K. Hostetler, V. Kodali, S. Kuchibhatla, G. Orr, J. G. Pounds, J. G. Teeguarden, B. D. Thrall and D. R. Baer, Surf. Interface Anal., 2012, 44, 882–889 CrossRef CAS PubMed
.
- A. S. Karakoti, S. Singh, A. Kumar, M. Malinska, S. V. Kuchibhatla, K. Wozniak, W. T. Self and S. Seal, J. Am. Chem. Soc., 2009, 131, 14144–14145 CrossRef CAS PubMed
.
- J. Chen, S. Patil, S. Seal and J. F. McGinnis, Nat. Nanotechnol., 2006, 1, 142–150 CrossRef CAS PubMed
.
- S. Chen, Y. Hou, G. Cheng, C. Zhang, S. Wang and J. Zhang, Biol. Trace Elem. Res., 2013, 154, 156–166 CrossRef CAS PubMed
.
- N. M. Zholobak, V. K. Ivanov, A. B. Shcherbakov, A. S. Shaporev, O. S. Polezhaeva, A. Y. Baranchikov, N. Y. Spivak and Y. D. Tretyakov, J. Photochem. Photobiol., B, 2011, 102, 32–38 CrossRef CAS PubMed
.
- M. Horie, K. Nishio, H. Kato, K. Fujita, S. Endoh, A. Nakamura, A. Miyauchi, S. Kinugasa, K. Yamamoto, E. Niki, Y. Yoshida, Y. Hagihara and H. Iwahashi, J. Biochem., 2011, 150, 461–471 CrossRef CAS PubMed
.
- J. Y. Ma, R. R. Mercer, M. Barger, D. Schwegler-Berry, J. Scabilloni, J. K. Ma and V. Castranova, Toxicol. Appl. Pharmacol., 2012, 262, 255–264 CrossRef CAS PubMed
.
- A. Srinivas, P. J. Rao, G. Selvam, P. B. Murthy and P. N. Reddy, Toxicol. Lett., 2011, 205, 105–115 CrossRef CAS PubMed
.
- J. M. Dowding, T. Dosani, A. Kumar, S. Seal and W. T. Self, Chem. Commun., 2012, 48, 4896–4898 RSC
.
- R. A. Madero-Visbal, B. E. Alvarado, J. F. Colon, C. H. Baker, M. S. Wason, B. Isley, S. Seal, C. M. Lee, S. Das and R. Manon, Nanomedicine, 2012, 8, 1223–1231 CrossRef CAS PubMed
.
- F. Pagliari, C. Mandoli, G. Forte, E. Magnani, S. Pagliari, G. Nardone, S. Licoccia, M. Minieri, P. Di Nardo and E. Traversa, ACS Nano, 2012, 6, 3767–3775 CrossRef CAS PubMed
.
- M. S. Wason and J. Zhao, Am. J. Transl. Res., 2013, 5, 126–131 CAS
.
- D. R. Baer, J. Surf. Anal., 2011, 17, 163–169 CAS
.
- G. Oberdorster, E. Oberdorster and J. Oberdorster, Environ. Health Perspect., 2005, 113, 823–839 CrossRef CAS
.
- A. Peters, B. Veronesi, L. Calderon-Garciduenas, P. Gehr, L. C. Chen, M. Geiser, W. Reed, B. Rothen-Rutishauser, S. Schurch and H. Schulz, Part. Fibre Toxicol., 2006, 3, 13 CrossRef PubMed
.
- S. Takenaka, E. Karg, C. Roth, H. Schulz, A. Ziesenis, U. Heinzmann, P. Schramel and J. Heyder, Environ. Health Perspect., 2001, 109 Suppl 4, 547–551 CrossRef CAS
.
- X. He, H. Zhang, Y. Ma, W. Bai, Z. Zhang, K. Lu, Y. Ding, Y. Zhao and Z. Chai, Nanotechnology, 2010, 21, 285103 CrossRef PubMed
.
- L. L. Wong, S. M. Hirst, Q. N. Pye, C. M. Reilly, S. Seal and J. F. McGinnis, PLoS One, 2013, 8, e58431 CAS
.
- W. S. Cho, R. Duffin, F. Thielbeer, M. Bradley, I. L. Megson, W. Macnee, C. A. Poland, C. L. Tran and K. Donaldson, Toxicol. Sci., 2012, 126, 469–477 CrossRef CAS PubMed
.
- C. L. Klein, K. Wiench, M. Wiemann, L. Ma-Hock, B. van Ravenzwaay and R. Landsiedel, Arch. Toxicol., 2012, 86, 1137–1151 CrossRef CAS PubMed
.
- E.-J. Park, Y.-K. Park and K. Park, Toxicol. Res., 2009, 25, 79–84 CrossRef CAS
.
- R. A. Yokel, T. C. Au, R. MacPhail, S. S. Hardas, D. A. Butterfield, R. Sultana, M. Goodman, M. T. Tseng, M. Dan, H. Haghnazar, J. M. Unrine, U. M. Graham, P. Wu and E. A. Grulke, Toxicol. Sci., 2012, 127, 256–268 CrossRef CAS PubMed
.
- R. A. Yokel, M. T. Tseng, M. Dan, J. M. Unrine, U. M. Graham, P. Wu and E. A. Grulke, Nanomedicine, 2013, 9, 398–407 CrossRef CAS PubMed
.
- M. Dan, P. Wu, E. A. Grulke, U. M. Graham, J. M. Unrine and R. A. Yokel, Nanomedicine, 2012, 7, 95–110 CrossRef CAS PubMed
.
- L. Geraets, A. G. Oomen, J. D. Schroeter, V. A. Coleman and F. R. Cassee, Toxicol. Sci., 2012, 127, 463–473 CrossRef CAS PubMed
.
- C. Singh, S. Friedrichs, G. Ceccone, N. Gibson, K. A. Jensen, M. Levin, H. G. Infante, D. Carlander and K. Rasmussen, Cerium Dioxide, NM-211, NM-212, NM-213. Characterisation and test item preparation, European Commission Joint Research Centre Institute for Health and Consumer Protection, Ispra, Italy, 2014 Search PubMed.
- ECHA, (European Chemicals Agency), Guidance on information requirements and chemical safety assessment: Appendix R7-1 Recommendations for nanomaterials applicable to Chapter R7a - Endpoint specific guidance - ECHA-12-G-03-EN, European Chemicals Agency, 2012 Search PubMed.
- W. Wohlleben, L. Ma-Hock, V. Boyko, G. Cox, H. Egenolf, H. Freiberger, B. Hinrichsen, S. Hirth and R. Landsiedel, J. Ceram. Sci. Technol., 2013, 4, 93–104 Search PubMed
.
- A. B. Stefaniak, R. A. Guilmette, G. A. Day, M. D. Hoover, P. N. Breysse and R. C. Scripsick, Toxicol. In Vitro, 2005, 19, 123–134 CrossRef CAS PubMed
.
- J. Cohen, G. Deloid, G. Pyrgiotakis and P. Demokritou, Nanotoxicology, 2013, 7, 417–431 CrossRef CAS PubMed
.
- J. D. Brain, D. E. Knudson, S. P. Sorokin and M. A. Davis, Environ. Res., 1976, 11, 13–33 CrossRef CAS
.
- B. D. Beck, J. D. Brain and D. E. Bohannon, Toxicol. Appl. Pharmacol., 1982, 66, 9–29 CrossRef CAS
.
- C. Buzea, I. I. Pacheco and K. Robbie, Biointerphases, 2007, 2, MR17–71 CrossRef
.
- H. S. Choi, Y. Ashitate, J. H. Lee, S. H. Kim, A. Matsui, N. Insin, M. G. Bawendi, M. Semmler-Behnke, J. V. Frangioni and A. Tsuda, Nat. Biotechnol., 2010, 28, 1300–1303 CrossRef CAS PubMed
.
- R. P. Brown, M. D. Delp, S. L. Lindstedt, L. R. Rhomberg and R. P. Beliles, Toxicol. Ind. Health, 1997, 13, 407–484 CrossRef CAS PubMed
.
- D. J. Schoeffner, D. A. Warren, S. Muralidara, J. V. Bruckner and J. E. Simmons, J. Toxicol. Environ. Health, Part A, 1999, 56, 449–462 CrossRef CAS PubMed
.
- P. Demokritou, S. Gass, G. Pyrgiotakis, J. M. Cohen, W. Goldsmith, W. McKinney, D. Frazer, J. Ma, D. Schwegler-Berry, J. Brain and V. Castranova, Nanotoxicology, 2013, 7, 1338–1350 CrossRef CAS PubMed
.
- R. Landsiedel, L. Ma-Hock, A. Kroll, D. Hahn, J. Schnekenburger, K. Wiench and W. Wohlleben, Adv. Mater., 2010, 22, 2601–2627 CrossRef CAS PubMed
.
- R. Landsiedel, L. Ma-Hock, T. Hofmann, M. Wiemann, V. Strauss, S. Treumann, W. Wohlleben, S. Groters, K. Wiench and B. van Ravenzwaay, Part. Fibre Toxicol., 2014, 11, 16 CrossRef PubMed
.
- M. Geiser and W. G. Kreyling, Part. Fibre Toxicol., 2010, 7, 2 CrossRef PubMed
.
- C. Schulze, U. F. Schaefer, C. A. Ruge, W. Wohlleben and C. M. Lehr, Eur. J. Pharm. Biopharm., 2011, 77, 376–383 CrossRef CAS PubMed
.
- S. K. Nalabotu, M. B. Kolli, W. E. Triest, J. Y. Ma, N. D. Manne, A. Katta, H. S. Addagarla, K. M. Rice and E. R. Blough, Int. J. Nanomed., 2011, 6, 2327–2335 CrossRef CAS PubMed
.
- P. H. Hoet, I. Bruske-Hohlfeld and O. V. Salata, J. Nanobiotechnol., 2004, 2, 12 CrossRef PubMed
.
- D. E. Coppen and N. T. Davies, Br. J. Nutr., 1987, 57, 35–44 CrossRef CAS
.
- K. Thompson, R. M. Molina, T. Donaghey, J. D. Brain and M. Wessling-Resnick, Am. J. Physiol., 2007, 293, G640–644 CAS
.
- R. M. Molina, L. A. Schaider, T. C. Donaghey, J. P. Shine and J. D. Brain, Environ. Pollut., 2013, 182, 217–224 CrossRef CAS PubMed
.
- E. A. Heilig, K. J. Thompson, R. M. Molina, A. R. Ivanov, J. D. Brain and M. Wessling-Resnick, Am. J. Physiol., 2006, 290, L1247–1259 CAS
.
- K. Thompson, R. Molina, T. Donaghey, J. D. Brain and M. Wessling-Resnick, Toxicol. Appl. Pharmacol., 2006, 210, 17–23 CrossRef CAS PubMed
.
- J. D. Brain, R. M. Molina, M. M. DeCamp and A. E. Warner, Am. J. Physiol., 1999, 276, L146–154 CAS
.
Footnote |
| † Electronic supplementary information (ESI) available. See DOI: 10.1039/c4en00034j |
| This journal is © The Royal Society of Chemistry 2014 |

