 Open Access Article
Creative Commons Attribution 3.0 Unported Licence
Neutral polyfluoroalkyl substances in the global Atmosphere†
A.
Gawor
ab,
C.
Shunthirasingham
ab,
S. J.
Hayward
a,
Y. D.
Lei
a,
T.
Gouin
a,
B. T.
Mmereki
c,
W.
Masamba
d,
C.
Ruepert
e,
L. E.
Castillo
e,
M.
Shoeib
f,
S. C.
Lee
f,
T.
Harner
f and
F.
Wania
*a
aDepartment of Physical and Environmental Sciences, University of Toronto Scarborough, 1265 Military Trail, Toronto, Ontario, Canada M1C 1A4. E-mail: frank.wania@utoronto.ca; Tel: +1-416-287-7225
bDepartment of Chemistry, University of Toronto Scarborough, 1265 Military Trail, Toronto, Ontario, Canada M1C 1A4
cDepartment of Chemistry, University of Botswana, Gaborone, Botswana
dOkavango Research Institute, University of Botswana, Maun, Botswana
eInstituto Regional de Estudios en Sustancias Toxicas, Campus Omar Dengo, Universidad Nacional, Heredia, Costa Rica
fScience and Technology Branch, Environment Canada, 4905 Dufferin Street, Toronto, Ontario, Canada M3H 5T4
First published on 5th November 2013
Abstract
Concentrations of neutral per- and polyfluoroalkyl substances (nPFAS) in the atmosphere are of interest because nPFAS are highly mobile percursors for perfluoroalkyl acids. Two calibration studies in Ontario, Canada and Costa Rica established the feasibility of using XAD 2-resin based passive air samplers (XAD-PAS) to reliably determine long term average air concentrations of nPFAS under temperate and tropical climatic conditions. The temporal and spatial distribution of nPFAS was investigated by analyzing XAD-PAS deployed for one year at between 17 and 46 sites on six continents between 2006 and 2011 as part of the Global Atmospheric Passive Sampling (GAPS) study. Higher levels of fluorotelomer alcohols (FTOHs) compared to fluorinated sulfonamides (FOSAs), and fluorinated sulfonamidoethanols (FOSEs) were observed at all sites. Urban sites had the highest levels of nPFAS compared to rural and remote sites, which is also apparent in a positive correlation of nPFAS levels with the proximity of a sampling site to areas of high population density. Levels of FOSAs and FOSEs tended to decrease during the six years of measurements, whereas an initial decline in the concentrations of FTOHs from 2006 to 2008 did not continue in 2009 to 2011. A comparison of nPFAS levels measured in national XAD-PAS networks in Costa Rica and Botswana revealed that the GAPS sites in Tapanti and the Kalahari are representative of the more remote regions in those countries. XAD-PAS derived absolute nPFAS levels at GAPS sites are lower than those measured using another PAS, but are within the range of levels measured with active air samplers. Agreement of relative nPFAS composition is better between samplers, suggesting that the discrepancy is due to uncertain sampling rates.
Enviromental impactPerfluoroalkyl acids have been receiving widespread attention due to their persistence, ability to bioaccumulate and ubiquitous presence in the global environment. Some volatile neutral per- and polyfluoroalkyl substances (nPFAS) have been implicated in facilitating the transfer by atmospheric long range transport to remote regions, where they may degrade into the perfluoroalkyl acids. This study for the first time provides insight into interannual time trends of nPFAS in the atmosphere on a global scale and confirms their ubiquitous presence throughout the global atmosphere. |
Introduction
Over the last decade, per- and polyfluoroalkyl substances (PFAS) have been receiving widespread attention due to their persistence, leading to ubiquitous presence in the global environment and in biota.1–3 Perfluoroalkyl acids (PFAAs), such as the perfluoroalkyl carboxylic acids (PFCAs) and perfluoroalkyl sulfonic acids (PFSAs) are particularly recalcitrant and bioaccumulative. While PFAAs have been emitted directly in the environment, they can also originate from the biotic and abiotic degradation of neutral precursor compounds.4,5 PFAAs have been detected in regions far from anthropogenic sources, including the Arctic6,7 and Antarctic.8,9 There are three proposed pathways of long-range transport of PFAAs to remote regions: volatile precursor compounds are transported through the atmosphere and undergo atmospheric oxidation and deposition as PFAAs,5,10 PFAAs are directly transported by oceanic currents,11,12 and PFAAs, bound to particles, are directly transported through the atmosphere.13–15Previous atmospheric measurements of neutral PFAS (nPFAS) have primarily relied on the use of active air samplers (AASs) with polyurethane (PUF)/XAD-2 (PXP) sandwiches6,14,16–22 or solid-phase extraction (SPE) cartridges.23 A few studies have used sorbent impregnated PUFs (SIPs),24–29 activated carbon fiber felts (ACFs),30 or XAD-2 resin31 in passive air samplers (PASs). Land-based samplers were deployed at various locations including North America (e.g. Canadian Arctic,6 Eastern Canada,18 Bermuda18), Asia (e.g. South Korea,24 India,26 China and Japan22,26,30), and Europe (e.g. Germany,32 Ireland,14 Norway,14 and the United Kingdom14). Active air sampling on-board ships has covered extensive areas in the Canadian Arctic,19 the Atlantic and Southern Oceans,20 and the Northwestern Pacific.16 Although three studies20,29,32 examined nPFAS at a very large spatial scale, a truly global picture of nPFAS presence in the atmosphere is still missing. In particular, very few land-based measurements have been conducted at lower latitudes and, based on our knowledge, none in the southern hemisphere. No published study to date has covered a sufficiently long period of time to investigate interannual temporal trends of nPFAS in the atmosphere. Compiling data from different studies for time trends analysis may be problematic, especially when methods have been altered to enhance accuracy and precision in measurement (i.e. the adoption of isotope labeled nPFAS).27,33,34
In light of the above, the aims of the current study were to establish, through calibration studies conducted in temperate and tropical climates, the feasibility of XAD-2-resin based passive air samplers (XAD-PAS) to reliably determine long term average air concentrations of nPFAS.35 This sampling method was then used, within the context of the global atmospheric passive sampling (GAPS) network, to investigate the spatial distribution and interannual trends of nPFAS on a global scale.
Materials and methods
Here we report data from three regional studies and one global field sampling campaign, all of which have been described in previous publications (Table 1). In Botswana,36 Costa Rica,37,38 and Ontario,39,40 both XAD-PAS and AAS with PXP sandwiches were deployed over a one year period. As part of the GAPS project, XAD-PAS have been deployed for one year periods at a variable number of sites around the world since 2005. Sampling locations for these campaigns are shown in Fig. 1 and the sampling is described in detail in the (ESI†).| GAPS | Botswana | Costa Rica | Egbert, Ontario | |||||||
|---|---|---|---|---|---|---|---|---|---|---|
| Climate | Various | Semiarid | Tropical | Temperate | ||||||
| Year | Polar | Remote | Urban | AAS | PAS | AAS | PAS | PAS | AAS | PAS |
| Network | Network | Calibration | Calibration | |||||||
| 2005 | 8 | 7 × 2 | 5 × 2 | |||||||
| 2006 | 1 | 22 | 11 | 27 | 15 × 2 | 21 | 5 × 2 | |||
| 2007 | 4 | 31 | 11 | |||||||
| 2008 | 1 | 28 | 4 | |||||||
| 2009 | 2 | 29 | 3 | |||||||
| 2010 | 3 | 15 | 4 | |||||||
| 2011 | 2 | 13 | 2 | |||||||
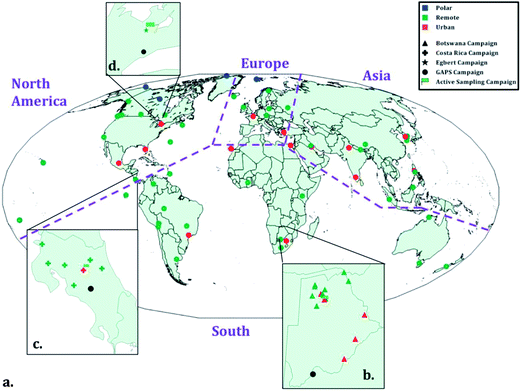 | ||
| Fig. 1 Map displaying sites for the four field sampling campaigns, where: a-d depicts the global campaign (GAPS) and national campaigns in Botswana, Costa Rica, and Egbert, Ontario, Canada, respectively. Site classification is indicated by different colors whereas campaigns are differentiated by symbols. Active sampling sites in the regional campaigns are depicted with a green flag. Purple dashed lines separate regions, where sample results were combined for geographic comparisons. Adapted from Shunthirasingham et al.41 | ||
Target analytes in these four campaigns were the following seven chemicals: three fluorotelomer alcohols (6![[thin space (1/6-em)]](https://www.rsc.org/images/entities/char_2009.gif) :
:![[thin space (1/6-em)]](https://www.rsc.org/images/entities/char_2009.gif) 2, 8
2, 8![[thin space (1/6-em)]](https://www.rsc.org/images/entities/char_2009.gif) :
:![[thin space (1/6-em)]](https://www.rsc.org/images/entities/char_2009.gif) 2, 10
2, 10![[thin space (1/6-em)]](https://www.rsc.org/images/entities/char_2009.gif) :
:![[thin space (1/6-em)]](https://www.rsc.org/images/entities/char_2009.gif) 2 FTOH), two perfluorooctane sulfonamides (MeFOSA, EtFOSA) and two perfluorooctane sulfonamidoethanols (MeFOSE, EtFOSE). Additionally, 8 isotope labeled nPFAS were analyzed for recovery and volume correction (Table S1†). Details of sample preparation, extraction and analysis are given in the ESI.†
2 FTOH), two perfluorooctane sulfonamides (MeFOSA, EtFOSA) and two perfluorooctane sulfonamidoethanols (MeFOSE, EtFOSE). Additionally, 8 isotope labeled nPFAS were analyzed for recovery and volume correction (Table S1†). Details of sample preparation, extraction and analysis are given in the ESI.†
The AAS results are presented in units of pg m−3 based on sampling volumes measured with a calibrated pump. Air concentrations were all blank corrected by field and laboratory samples. Method detection limits (MDL) were defined as 3 times the standard deviations of the sample blanks. When an analyte was not detected in any of the blanks, 3 times the instrumental detection limit (IDL) was used to calculate the MDL. When creating figures and for statistical purposes, any non-detects (i.e. below the IDL) were assigned a randomized value between 1/3 and 2/3 of the IDL.42,43 Grubbs test was performed (one way, at 5% significance level)44 on samples from the GAPS campaign to remove unusually high concentrations from the analysis. Such data are highlighted in the ESI.† One-way ANOVA was performed with post-hoc test using Tukey–Kramer's Multiple Comparison Test. 2-tailed Pearson correlations were at 95% confidence. Statistical analyses were performed using GraphPad Prism, version 5.0.
Results
Calibration of XAD-2 based passive samplers for nPFASs
Passive air samplers based on SIPs and ACFs have previously been calibrated for nPFASs using concentrations determined by AAS (PXP sandwiches).24,28,30,45 Here we report results of the first calibrations of XAD-PAS for nPFASs, using field studies conducted in Egbert, Ontario, Canada40 and San Antonio de Belen, Costa Rica37 (Table S2†). Low volume AAS (LV-AAS) and short XAD-PAS were used in Egbert; high volume AAS (HV-AAS) and long XAD-PAS in San Antonio de Belen.Uptake curves plotting the equivalent sampling volume per substance i, Vi,eq (m3), against deployment period are shown in Fig. 2. The Vi,eq values were calculated as the ratio between the mass of a nPFAS accumulated in a XAD-PAS (mi,PAS in pg PAS−1) divided by the mean air concentration during the duration of that XAD-PAS’s deployment (Ci,AAS in pg m−3):
 | (1) |
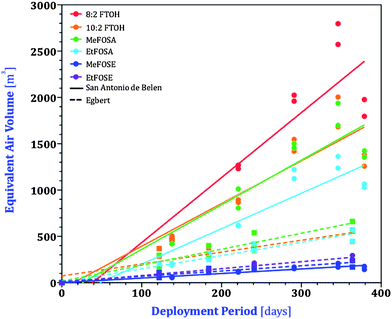 | ||
| Fig. 2 nPFAS accumulation on XAD-PAS after different deployment periods in Egbert, Ontario and San Antonio de Belen, Costa Rica, based on equivalent air volumes, Vi,eq. Plots display compounds that were detected in the XAD extracts for at least two periods. Regression parameters are listed in Table S3.† | ||
Since the PAS used in Ontario were half the size of those used in Costa Rica, the equivalent air volumes from Ontario need to be doubled to be comparable with those from Costa Rica.37 The sampling rates, (R, m3 day−1) for individual nPFAS were determined from Fig. 2 by the slopes of the linear least-squares fitting (LLSF) through all the duplicated points. nPFAS were not detected in either PAS or AAS during the first 58 days of sampling, most likely due to cold temperatures during this time. As such, these 58 days of sampling were not included in the regression. Forcing the regressions through the origin would result in poorer linearity and in sampling rates in Costa Rica that are lower by approximately 25 percent.
For both Costa Rica and Egbert, the curves in Fig. 2 appear to show a slowing of uptake at the end of the deployment period, which may be interpreted as suggesting that the nPFAS are approaching equilibrium between the atmospheric gas phase and the XAD-resin during a one-year deployment. However, the uptake curves for different nPFAS tend to have a similar shape (e.g. all nPFAS experience a slight decrease in Vi,eq at the longest deployment in Costa Rica), even though the wide range in the volatility of the nPFAS would make it unlikely that they would all approach equilibrium at the same time. Furthermore, there is no indication in the data displayed in Fig. 2 that the uptake curve becomes shallower earlier for the samplers deployed under warm tropical conditions than under cooler temperate conditions. Additionally, the end of the sampling period in Egbert was in winter, when uptake of nPFAS is slower (see below). We therefore believe it is more likely that differences in slope (and particularly the lower uptake in the samplers exposed the longest in Costa Rica) are due to slight differences in the wind exposure of the samplers.
In Egbert and Costa Rica samples, both FTOHs (8![[thin space (1/6-em)]](https://www.rsc.org/images/entities/char_2009.gif) :
:![[thin space (1/6-em)]](https://www.rsc.org/images/entities/char_2009.gif) 2 and 10
2 and 10![[thin space (1/6-em)]](https://www.rsc.org/images/entities/char_2009.gif) :
:![[thin space (1/6-em)]](https://www.rsc.org/images/entities/char_2009.gif) 2) and FOSAs (Me- and Et-) displayed similar equivalent sampling volumes onto the PAS media, whereas those for the FOSEs (Me- and Et-) were one-third to one-half lower. Conversely, when calibrating SIPs, Shoeib et al.28 observed that uptake of EtFOSA was similar to that of the FOSEs rather than the FTOHs. Another SIP calibration study by Kim et al.24 determined similar uptake rates for FTOHs, FOSAs and FOSEs. This is likely due to differences in the processes controlling the uptake kinetics, which vary between chemicals, and between different types of samplers and different types of environments (i.e. SIP calibration studies were conducted indoors, whereas XAD-PAS calibrations were conducted outdoors).27
2) and FOSAs (Me- and Et-) displayed similar equivalent sampling volumes onto the PAS media, whereas those for the FOSEs (Me- and Et-) were one-third to one-half lower. Conversely, when calibrating SIPs, Shoeib et al.28 observed that uptake of EtFOSA was similar to that of the FOSEs rather than the FTOHs. Another SIP calibration study by Kim et al.24 determined similar uptake rates for FTOHs, FOSAs and FOSEs. This is likely due to differences in the processes controlling the uptake kinetics, which vary between chemicals, and between different types of samplers and different types of environments (i.e. SIP calibration studies were conducted indoors, whereas XAD-PAS calibrations were conducted outdoors).27
Whereas FOSEs had similar sampler-length corrected sampling rates in both Egbert and Belen, those for the FTOHs and FOSAs were on average higher in Belen than in Egbert by a factor of ∼2.75. Even if regressions forced through the origin were used, sampling rates in Costa Rica are still more than double those in Ontario. Higher uptake rates at higher temperature have previously been noted for the XAD-PAS35,37 and were recently rationalized with a mechanistic model.46
Based on the results of the calibration studies in Egbert and Belen, Table 2 includes a set of recommended sampling rates to use for the uptake of nPFASs in long XAD-PAS in tropical and temperate locations. The three FTOHs and MeFOSA, and the two FOSEs are assumed to have the same sampling rates, respectively. The R for FOSEs is assumed to be the same in tropical and temperate locales, whereas the R for FTOHs and FOSAs is assumed to be ∼2.5 times higher in tropical than in temperate regions. These rates have considerable uncertainty and should be reassessed when additional calibration data should become available. The data from Egbert should be given more weight than those from Costa Rica. The Egbert study not only included a much larger set of AAS (n = 21) than Costa Rica (n = 8), but the low volume AASs in Egbert sampled continuously whereas the AAS in Costa Rica sampled only during a small fraction of time (∼24 hours every month). The fraction of the longest XAD-PAS deployment time that was covered by the AAS was 100% in Egbert, but only ∼2% in Costa Rica. More calibration studies with continuous AASs are required in different environments to reduce the uncertainty in the uptake rates.
| Compound-specific sampling rates | Selected sampling rates | |||
|---|---|---|---|---|
| Egbert, Ontario | San Antonio de Belen | Temperate | Tropical | |
8![[thin space (1/6-em)]](https://www.rsc.org/images/entities/char_2009.gif) : :![[thin space (1/6-em)]](https://www.rsc.org/images/entities/char_2009.gif) 2 FTOH 2 FTOH |
N/A | 7.02 ± 0.96 | 1.6 | 5.0 |
10![[thin space (1/6-em)]](https://www.rsc.org/images/entities/char_2009.gif) : :![[thin space (1/6-em)]](https://www.rsc.org/images/entities/char_2009.gif) 2 FTOH 2 FTOH |
1.56 ± 0.12 | 4.61 ± 0.65 | ||
| MeFOSA | 1.79 ± 0.093 | 4.82 ± 0.59 | ||
| EtFOSA | 1.46 ± 0.068 | 3.83 ± 0.49 | ||
| MeFOSE | 0.62 ± 0.041 | 0.49 ± 0.054 | 0.62 | |
| EtFOSE | 0.76 ± 0.027 | N/A | ||
Tracking the annual time series of nPFAS across three climatic regions
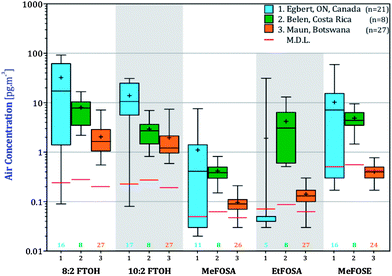
Concentrations of nPFAS in AAS deployed in Egbert, Ontario, San Antonio de Belen, Costa Rica and Maun, Botswana in units of pg m−3 are reported in Table S4† and are displayed in box-and-whiskers plots in Fig. 3.Five of the seven nPFAS were detected during all three AAS campaigns. EtFOSE was detected only in Egbert (Table S4†) and 6![[thin space (1/6-em)]](https://www.rsc.org/images/entities/char_2009.gif) :
:![[thin space (1/6-em)]](https://www.rsc.org/images/entities/char_2009.gif) 2 FTOH not at all. 8
2 FTOH not at all. 8![[thin space (1/6-em)]](https://www.rsc.org/images/entities/char_2009.gif) :
:![[thin space (1/6-em)]](https://www.rsc.org/images/entities/char_2009.gif) 2 and 10
2 and 10![[thin space (1/6-em)]](https://www.rsc.org/images/entities/char_2009.gif) :
:![[thin space (1/6-em)]](https://www.rsc.org/images/entities/char_2009.gif) 2 FTOHs were detected in most of the samples. MeFOSA, EtFOSA and MeFOSE were in most of the samples taken in Botswana and Costa Rica, but were detected in only 50% or less of the samples from Ontario. The order of highest to lowest geometric mean concentration generally was: 8
2 FTOHs were detected in most of the samples. MeFOSA, EtFOSA and MeFOSE were in most of the samples taken in Botswana and Costa Rica, but were detected in only 50% or less of the samples from Ontario. The order of highest to lowest geometric mean concentration generally was: 8![[thin space (1/6-em)]](https://www.rsc.org/images/entities/char_2009.gif) :
:![[thin space (1/6-em)]](https://www.rsc.org/images/entities/char_2009.gif) 2 FTOH > 10
2 FTOH > 10![[thin space (1/6-em)]](https://www.rsc.org/images/entities/char_2009.gif) :
:![[thin space (1/6-em)]](https://www.rsc.org/images/entities/char_2009.gif) 2 FTOH > MeFOSE > EtFOSA > MeFOSA. This order has been generally observed in other studies.16,20
2 FTOH > MeFOSE > EtFOSA > MeFOSA. This order has been generally observed in other studies.16,20
The box-and-whisker plots in Fig. 3 show the concentration variability at the three locations. In Botswana and Costa Rica, small boxes and arithmetic mean concentrations that for the most part deviate not far from the median, suggest that nPFAS concentration are relatively uniform throughout the year. In Egbert, there is larger variability in the concentrations, with arithmetic means being higher than the medians and the interquartile range (i.e. the boxes) being larger than in Costa Rica and Botswana. Concentration variability within a season, which was also observed by Dreyer et al.47 and Müller et al.48 can be attributed at least in part to variable emission rates. In Egbert, concentrations are higher during the warmer months (end of May–Sept) than in colder months (Oct–Mar) (Fig. S1†), possibly due to diffuse emissions that are dependent on temperature.47 Temperatures are much more uniform seasonally in Botswana and Costa Rica.
For the FTOHs, MeFOSE and MeFOSA, the highest mean concentrations were measured in Ontario, followed by Costa Rica and then Botswana. The differences in nPFAS concentrations between the three sites were generally significant (1-way ANOVA, p < 0.05, Table S5†) aside from the FOSAs, although post-hoc comparisons suggest that those between Costa Rica and Botswana are not as significant as those with Ontario. The higher levels at the Ontario site are consistent with the proximity to Toronto, a major population centre of 5.6 million residents with a high standard of living and thus presumably prevalent use of products containing fluorinated residuals.49 The lower nPFAS concentrations in Botswana and in Costa Rica are likely due to less use of products containing nPFAS residuals.49 Also, production of nPFAS in the southern hemisphere or at lower latitudes is believed to be insignificant,12 although it has been reported that sulfluramid (EtFOSA) is being manufactured in Brazil (∼30 tons per year in 2007).50 Additionally, the sampling location in Botswana is located outside the town of Maun, in very thinly populated savannah. The slightly (although not statistically) higher levels in Costa Rica compared to Botswana could be due to the location of San Antonio de Belen in a suburb of San Jose, a metropolitan area with a population of 1.7 million.
nPFAS in the Global Atmospheric Passive Sampling (GAPS) network
Levels of the nPFAS in GAPS samples in units of ng PAS−1, with their method detection limits, are reported in Table S7.† Site information for years 2009–2011 is listed in Table S6,† adapted from Shunthirasingham et al.41 PAS results are presented in units of ng PAS−1 to avoid unnecessarily adding uncertainty associated with the conversion to volumetric air concentration using passive sampling rates. However, the accumulated amounts were blank corrected and normalized to a sampling period of 365 days. Because sampling rates can differ by as much as a factor of 2.5 between sampling sites in different climate (see above), one has to keep in mind that differences in the accumulated amount between sites have to be larger than this factor to indicate real differences in air concentrations.The order of abundance of individual nPFAS detected in the samples is FTOHs > FOSEs > FOSAs. For the most part, 8![[thin space (1/6-em)]](https://www.rsc.org/images/entities/char_2009.gif) :
:![[thin space (1/6-em)]](https://www.rsc.org/images/entities/char_2009.gif) 2 was the most abundant FTOH, followed by 10
2 was the most abundant FTOH, followed by 10![[thin space (1/6-em)]](https://www.rsc.org/images/entities/char_2009.gif) :
:![[thin space (1/6-em)]](https://www.rsc.org/images/entities/char_2009.gif) 2 and 6
2 and 6![[thin space (1/6-em)]](https://www.rsc.org/images/entities/char_2009.gif) :
:![[thin space (1/6-em)]](https://www.rsc.org/images/entities/char_2009.gif) 2. For FOSAs and FOSEs, the abundance of methyl and ethyl compounds did not differ significantly. Fig. S2† displays the relative abundance of different nPFAS in the samples. Detection frequencies are given in Table S8.†
2. For FOSAs and FOSEs, the abundance of methyl and ethyl compounds did not differ significantly. Fig. S2† displays the relative abundance of different nPFAS in the samples. Detection frequencies are given in Table S8.†
![[thin space (1/6-em)]](https://www.rsc.org/images/entities/char_2009.gif) :
:![[thin space (1/6-em)]](https://www.rsc.org/images/entities/char_2009.gif) 2 and 10
2 and 10![[thin space (1/6-em)]](https://www.rsc.org/images/entities/char_2009.gif) :
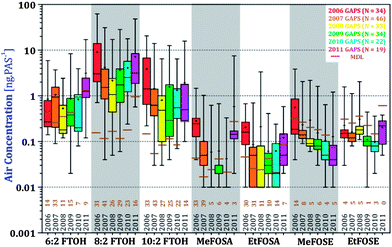
:![[thin space (1/6-em)]](https://www.rsc.org/images/entities/char_2009.gif) 2 FTOHs. Levels of FOSAs and FOSEs also decreased between 2006 and 2011, whereby after 2007, FOSAs and FOSEs were below the MDL at most sites. 1-way ANOVA tests were performed to examine the differences between the six years of sampling at a global and regional scale (Table S9†). 8
2 FTOHs. Levels of FOSAs and FOSEs also decreased between 2006 and 2011, whereby after 2007, FOSAs and FOSEs were below the MDL at most sites. 1-way ANOVA tests were performed to examine the differences between the six years of sampling at a global and regional scale (Table S9†). 8![[thin space (1/6-em)]](https://www.rsc.org/images/entities/char_2009.gif) :
:![[thin space (1/6-em)]](https://www.rsc.org/images/entities/char_2009.gif) 2 and 10
2 and 10![[thin space (1/6-em)]](https://www.rsc.org/images/entities/char_2009.gif) :
:![[thin space (1/6-em)]](https://www.rsc.org/images/entities/char_2009.gif) 2 FTOHs, MeFOSA, and MeFOSE decreased over the years, with the greatest decline occurring between 2006 and 2007 (p < 0.001). There is an observable, but not statistically significant, decrease of EtFOSA and EtFOSE. 6
2 FTOHs, MeFOSA, and MeFOSE decreased over the years, with the greatest decline occurring between 2006 and 2007 (p < 0.001). There is an observable, but not statistically significant, decrease of EtFOSA and EtFOSE. 6![[thin space (1/6-em)]](https://www.rsc.org/images/entities/char_2009.gif) :
:![[thin space (1/6-em)]](https://www.rsc.org/images/entities/char_2009.gif) 2 FTOH was consistently the same throughout the five sampling years with no observable trend.
2 FTOH was consistently the same throughout the five sampling years with no observable trend.
![[thin space (1/6-em)]](https://www.rsc.org/images/entities/char_2009.gif) :
:![[thin space (1/6-em)]](https://www.rsc.org/images/entities/char_2009.gif) 2 and 10
2 and 10![[thin space (1/6-em)]](https://www.rsc.org/images/entities/char_2009.gif) :
:![[thin space (1/6-em)]](https://www.rsc.org/images/entities/char_2009.gif) 2 FTOH, MeFOSA and EtFOSA (Fig. S4†). Correlations with 6
2 FTOH, MeFOSA and EtFOSA (Fig. S4†). Correlations with 6![[thin space (1/6-em)]](https://www.rsc.org/images/entities/char_2009.gif) :
:![[thin space (1/6-em)]](https://www.rsc.org/images/entities/char_2009.gif) 2 FTOH and the FOSEs were weak, likely due to concentrations near detection limits.
2 FTOH and the FOSEs were weak, likely due to concentrations near detection limits.
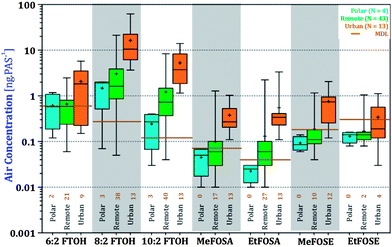
Another way of looking at this is to compare the levels of nPFAS at urban, remote, and polar sites (Fig. 5). nPFAS levels at urban locations were statistically significantly higher than at remote sites (5-fold, P < 0.0001, Table S10†). Polar sites had yet lower levels, but their small number (N = 4) and, in the case of FOSEs and FOSAs, levels below the MDL, limit the statistical power of the comparison. A discussion of differences in nPFAS levels in four different world regions is included in the ESI (Fig. S5 and S6, Tables S11 and 12†).
National atmospheric passive sampling campaigns
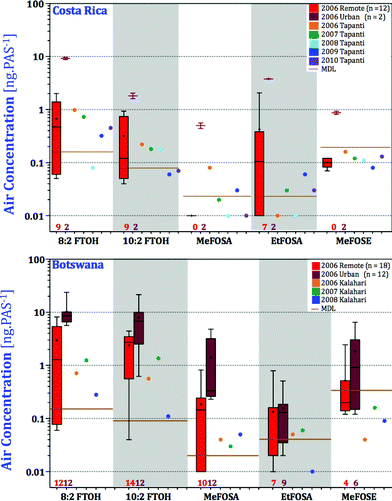
In order to evaluate how representative GAPS sites are for a country as a whole, we compared nPFAS levels at the two GAPS sites in the Kalahari, Botswana, and Tapanti, Costa Rica, with those from the two national PAS networks (Fig. 1). Tapanti National Park is a protected site in central Costa Rica, approximately 35 kilometers south of the country's capital San Jose. The Kalahari site is in an isolated location in the Southwest of Botswana. In addition to GAPS, two field campaigns deployed XAD-based PAS across several locations in Costa Rica and Botswana between the end of the 2005 and the beginning of 2007. Table S13† report the nPFASs levels at the different sampling sites in units of ng PAS−1. Amounts of nPFAS varied across the regions, with more heavily populated areas, such as Francistown, Botswana and San Antonio de Belen, Costa Rica, having higher levels (Fig. 6). Samples from Botswana's Okavango Delta and Costa Rica's National Parks were uniformly low; somewhat higher levels at Eagle Island may be due to its proximity to a tourist camp. Fluorotelomer alcohols dominated the overall nPFAS composition, with 8![[thin space (1/6-em)]](https://www.rsc.org/images/entities/char_2009.gif) :
:![[thin space (1/6-em)]](https://www.rsc.org/images/entities/char_2009.gif) 2 FTOH being the most abundant. This is consistent with the AAS campaigns in the same regions. Higher levels of EtFOSA at EARTH (an agricultural university in the Caribbean lowland) and Belen may be related to the use of EtFOSA as an insecticide (Sulfluramid) controlling ants and cockroaches in Costa Rica and proximity to industrial emissions.56
2 FTOH being the most abundant. This is consistent with the AAS campaigns in the same regions. Higher levels of EtFOSA at EARTH (an agricultural university in the Caribbean lowland) and Belen may be related to the use of EtFOSA as an insecticide (Sulfluramid) controlling ants and cockroaches in Costa Rica and proximity to industrial emissions.56
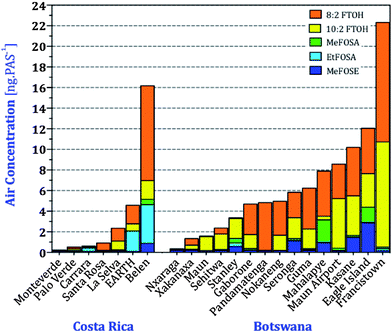 | ||
Fig. 6 Amounts of nPFAS in passive air samplers deployed across Costa Rica and Botswana. 6![[thin space (1/6-em)]](https://www.rsc.org/images/entities/char_2009.gif) : :![[thin space (1/6-em)]](https://www.rsc.org/images/entities/char_2009.gif) 2 FTOH and EtFOSE are not displayed because most sites had levels below the MDL. 2 FTOH and EtFOSE are not displayed because most sites had levels below the MDL. | ||
In 2009, the Kalahari sampling site was discontinued, and sampling commenced at Vanderbijl Park, South Africa, instead. Given its location and proximity to the metropolitan area of Johannesburg, Vanderbijl cannot be considered representative of thinly populated Botswana. Additionally, Lammel et al.57 noted significant levels of PAHs at Vanderbijl compared with a more isolated location in that region (Molopo), suggesting the presence of local sources, likely due to traffic or industrial combustion.
In both Costa Rica and Botswana, the levels of nPFAS measured at the GAPS sites during all five years were lower than the levels measured across the country (Fig. 7). Given the extreme isolation of the GAPS site in the Kalahari Desert, this comes as no surprise. The Kalahari site is in a truly remote location representing atmospheric background concentrations. Tapanti National Park may be located a relatively short distance from populated San Jose; however, the mountainous landscape, the low population density, and the lack of local agricultural activity may explain the low levels in Tapanti compared with other sites in Costa Rica. In summary, in both Botswana and Costa Rica, the GAPS sites are representative of the more remote parts of the country with respect to nPFAS levels. It should be noted that the levels of sulfonamides and sulfonamidoethanols (MeFOSA, EtFOSA, MeFOSE) detected in the samples from Costa Rica and Botswana were near the MDLs and caution is advised when interpreting their levels.
Comparison of volumetric concentrations at GAPS sites with previously reported values
Validation of our PAS data at a global level can be achieved by comparing it with nPFAS concentrations that had previously been reported for 20 of the 46 GAPS sites. At 18 of these 20 sites, the GAPS pilot study used PUFs/SIPs during the 2009 spring sampling campaign.29 SIP disks were also deployed at two South Korean GAPS sites during the 2009 spring sampling period.24 AAS were deployed in three of the GAPS locations with XAD-PAS: Toronto in March 2006,19 and Tudor Hill and Sable Island in July–August 2007.18 To compare our measurements with these data, the recommended sampling rates from Table 2 were used to calculate volumetric air concentrations of the nPFAS in pg m−3 at the GAPS sites. Concentrations of 8:2 FTOH, the most abundant and frequently detected compound, are compared for all 20 sites in Fig. 8. It is important to keep in mind that the figure compares a range of six annual averages (XAD-PAS) with a value for a single three month period during those six years (SIPs). It is not certain how representative this single period measured with SIPs is for the respective locations, however, comparisons were still made to give a general idea of the agreement between the two PASs. Concentrations of 8![[thin space (1/6-em)]](https://www.rsc.org/images/entities/char_2009.gif) :
:![[thin space (1/6-em)]](https://www.rsc.org/images/entities/char_2009.gif) 2 FTOH derived from SIPs were on average ∼3.7 times higher than those derived from XAD-PASs. The concentration ranges of 8
2 FTOH derived from SIPs were on average ∼3.7 times higher than those derived from XAD-PASs. The concentration ranges of 8![[thin space (1/6-em)]](https://www.rsc.org/images/entities/char_2009.gif) :
:![[thin space (1/6-em)]](https://www.rsc.org/images/entities/char_2009.gif) 2 FTOH derived from AAS at three sites typically overlapped both XAD-PASs and SIPs.
2 FTOH derived from AAS at three sites typically overlapped both XAD-PASs and SIPs.
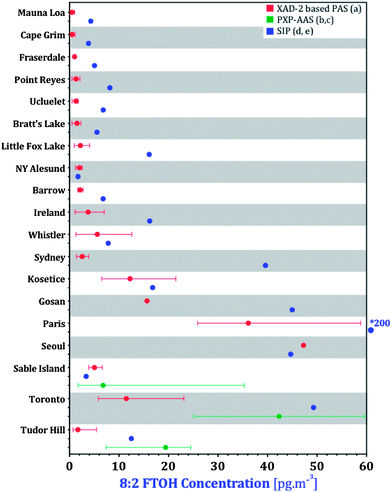 | ||
Fig. 8 Comparisons of 8![[thin space (1/6-em)]](https://www.rsc.org/images/entities/char_2009.gif) : :![[thin space (1/6-em)]](https://www.rsc.org/images/entities/char_2009.gif) 2 FTOH concentrations with literature data. (a) This study, (b) Shoeib et al.,19( c) Shoeib et al.,18 (d) Genualdi et al.,29 (e) Kim et al.24 * Outside of range for majority of the data. 2 FTOH concentrations with literature data. (a) This study, (b) Shoeib et al.,19( c) Shoeib et al.,18 (d) Genualdi et al.,29 (e) Kim et al.24 * Outside of range for majority of the data. | ||
There are a few possible reasons for the lower annual concentrations in the XAD-based samplers compared with the seasonally deployed SIPs. As noted above, nPFAS concentrations in Egbert are higher in warmer than colder months (Fig. S1†). SIP disks deployed in spring (April–June) could therefore yield higher air concentrations than XAD-PAS deployed for an entire year. Additionally, the sampling rates for the XAD-PAS (esp. in tropical locations) and SIPs are uncertain. Sampling rates for the XAD-PAS are based on calibrations at two outdoor sampling sites as described above, whereas those for the SIPs were based on an indoor calibration.28 Comparing AAS PXP sandwiches, SIPs and SPMDs for nPFAS sampling in the field, Dreyer et al.27 observed that FTOH concentrations measured by AAS were generally higher than those measured by both PASs, whereas FOSAs and FOSEs were higher in both PASs than in AASs. The use of sampling rates from an indoor calibration was noted as one possible explanation for the discrepancy.28 In fact, Dreyer et al.27 derived sampling rates for FOSAs and FOSEs outdoors that were higher than those by Shoeib et al.28 by a factor between 1.15 and 7.3; no sampling rates for FTOHs could be established by Dreyer et al.27 as they reached equilibrium before the end of the sampling period. As such, determination of FTOH concentrations in SIPs cannot be done by applying only a linear sampling rate, but also requires the consideration of the SIP's uptake capacity (i.e. partitioning behaviour between the SIP medium and air (KPSM)), which adds additional uncertainty. It is therefore possible that the SIP derived FTOH concentrations reported by Genualdi et al.29 are too high, because of (i) the use of sampling rates from an indoor uptake study and (ii) complications arising from having to interpret data in the curvilinear uptake phase of a passive sampler. It is also likely that some of the discrepancies are due to analytical uncertainty and/or differences between the laboratories.
Another way of investigating discrepancies between the results from different sampling methods, which is much less dependent on highly uncertain sampling rates, is through the use of fingerprint ratios (F.R.),47,58 which relate the concentrations of the 6![[thin space (1/6-em)]](https://www.rsc.org/images/entities/char_2009.gif) :
:![[thin space (1/6-em)]](https://www.rsc.org/images/entities/char_2009.gif) 2 FTOH or the 10
2 FTOH or the 10![[thin space (1/6-em)]](https://www.rsc.org/images/entities/char_2009.gif) :
:![[thin space (1/6-em)]](https://www.rsc.org/images/entities/char_2009.gif) 2 FTOH to that of the more prominent 8
2 FTOH to that of the more prominent 8![[thin space (1/6-em)]](https://www.rsc.org/images/entities/char_2009.gif) :
:![[thin space (1/6-em)]](https://www.rsc.org/images/entities/char_2009.gif) 2 FTOH:
2 FTOH:
 | (2) |
The 6![[thin space (1/6-em)]](https://www.rsc.org/images/entities/char_2009.gif) :
:![[thin space (1/6-em)]](https://www.rsc.org/images/entities/char_2009.gif) 2/8
2/8![[thin space (1/6-em)]](https://www.rsc.org/images/entities/char_2009.gif) :
:![[thin space (1/6-em)]](https://www.rsc.org/images/entities/char_2009.gif) 2 F.R. as derived from XAD-PAS, SIP-PAS and PXP-AASs agree much better with each other (Fig. 9) than the volumetric air concentrations (Fig. 8). The 10
2 F.R. as derived from XAD-PAS, SIP-PAS and PXP-AASs agree much better with each other (Fig. 9) than the volumetric air concentrations (Fig. 8). The 10![[thin space (1/6-em)]](https://www.rsc.org/images/entities/char_2009.gif) :
:![[thin space (1/6-em)]](https://www.rsc.org/images/entities/char_2009.gif) 2/8
2/8![[thin space (1/6-em)]](https://www.rsc.org/images/entities/char_2009.gif) :
:![[thin space (1/6-em)]](https://www.rsc.org/images/entities/char_2009.gif) 2 F.R. shows less agreement, with ratios measured by PXP-AASs and SIPS being generally somewhat higher. The better agreement between relative rather than absolute concentrations suggests that a part of the discrepancy between sampling methods is due to uncertain sampling rates.
2 F.R. shows less agreement, with ratios measured by PXP-AASs and SIPS being generally somewhat higher. The better agreement between relative rather than absolute concentrations suggests that a part of the discrepancy between sampling methods is due to uncertain sampling rates.
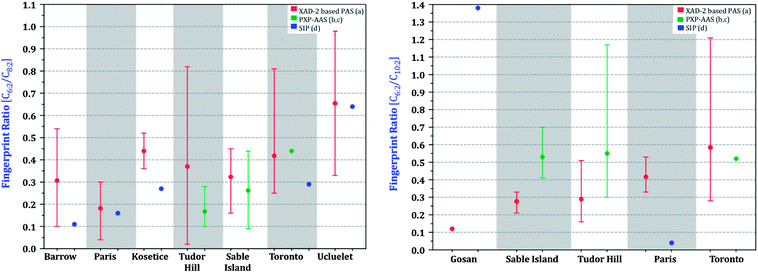 | ||
Fig. 9 Fingerprint ratios (C6![[thin space (1/6-em)]](https://www.rsc.org/images/entities/char_2009.gif) : :![[thin space (1/6-em)]](https://www.rsc.org/images/entities/char_2009.gif) 2 FTOH/C8 2 FTOH/C8![[thin space (1/6-em)]](https://www.rsc.org/images/entities/char_2009.gif) : :![[thin space (1/6-em)]](https://www.rsc.org/images/entities/char_2009.gif) 2 FTOH, C10 2 FTOH, C10![[thin space (1/6-em)]](https://www.rsc.org/images/entities/char_2009.gif) : :![[thin space (1/6-em)]](https://www.rsc.org/images/entities/char_2009.gif) 2 FTOH/C8 2 FTOH/C8![[thin space (1/6-em)]](https://www.rsc.org/images/entities/char_2009.gif) : :![[thin space (1/6-em)]](https://www.rsc.org/images/entities/char_2009.gif) 2 FTOH; where C = Concentration) of sites. Not all sites are shown due to levels being below limits of quantification for literature data. (a) This study, (b) Shoeib et al.,18 (c) Shoeib et al.,19 (d) Genualdi et al.29 and Kim et al.24 2 FTOH; where C = Concentration) of sites. Not all sites are shown due to levels being below limits of quantification for literature data. (a) This study, (b) Shoeib et al.,18 (c) Shoeib et al.,19 (d) Genualdi et al.29 and Kim et al.24 | ||
Contributions of the current study
The calibration studies in a temperate and tropical region have established that XAD-PASs have sufficiently large uptake capacity to yield air concentrations over deployment periods as long as a year. Therefore, XAD-PAS are suited for measuring annually averaged nPFAS concentrations as part of the GAPS Network. The presence of nPFAS all around the globe indicates that they are truly global atmospheric contaminants, with FTOHs levels being significantly higher than those of FOSAs and FOSEs. Two national passive sampling campaigns in countries with a designated GAPS location have shown that the GAPS sites are representative of the more remote parts of the country. The first six years of GAPS data show an initial decline in FTOH concentrations followed by a slight increase, suggestive of continued usage of fluorotelomer-based products. Six years of data are thus insufficient for deducing trends in the levels of the fluorotelomer alcohols in the global atmosphere. Levels of both FOSAs and FOSEs dropped mostly below detection limits after the 2006 sampling year, presumably as a result of efforts to remove POSF-based products in North America. It remains to be seen whether large-scale production of PFOS related products in Asia may eventually lead to higher atmospheric levels of FOSEs and FOSAs in the future. As such, continued long-term monitoring is crucial to establish the trends of the nPFAS at a global scale.Acknowledgements
We appreciate the support from the numerous people partaking in the deployment and retrieval of the passive air samplers (see ESI for names). We acknowledge funding from the United Nations Environmental Program Chemicals, the Natural Sciences and Engineering Research Council of Canada, the Canadian Foundation for Climate and Atmospheric Sciences, the Chemicals Management Plan, and the Northern Contaminants Program. We also are thankful to Lutz Ahrens, Catherine E. Oyiliagu, Xiaoshu Cao, and Michelle Hoang for analytical and laboratory help.References
- B. D. Key, R. D. Howell and C. S. Criddle, Environ. Sci. Technol., 1997, 31, 2445–2454 CrossRef CAS.
- J. P. Giesy and K. Kannan, Environ. Sci. Technol., 2001, 35, 1339–1342 CrossRef CAS.
- J. P. Giesy and K. Kannan, Environ. Sci. Technol., 2002, 36, 146A–152A CrossRef CAS.
- T. J. Wallington, M. D. Hurley, J. Xia, D. J. Wuebbles, S. Sillman, A. Ito, J. E. Penner, D. A. Ellis, J. W. Martin, S. A. Mabury, O. J. Nielsen and M. P. Sulbaek Andersen, Environ. Sci. Technol., 2006, 40, 924–930 CrossRef CAS.
- U. Schenker, M. Scheringer, M. MacLeod, J. W. Martin, I. T. Cousins and K. Hungerbühler, Environ. Sci. Technol., 2008, 42, 3710–3716 CrossRef CAS.
- N. L. Stock, V. I. Furdui, D. C. G. Muir and S. A. Mabury, Environ. Sci. Technol., 2007, 41, 3529–3536 CrossRef CAS.
- C. M. Butt, U. Berger, R. Bossi and G. T. Tomy, Sci. Total Environ., 2010, 408, 2936–2965 CrossRef CAS PubMed.
- S. Wei, L. Q. Chen, S. Taniyasu, M. K. So, M. B. Murphy, N. Yamashita, L. W. Y. Yeung and P. K. S. Lam, Mar. Pollut. Bull., 2007, 54, 1813–1818 CrossRef CAS PubMed.
- M. Cai, H. Yang, Z. Xie, Z. Zhao, F. Wang, Z. Lu, R. Sturm and R. Ebinghaus, J. Hazard. Mater., 2012, 209–210, 335–342 CrossRef CAS PubMed.
- D. A. Ellis, J. W. Martin, S. A. Mabury, M. D. Hurley, M. P. Sulbaek Andersen and T. J. Wallington, Environ. Sci. Technol., 2003, 37, 3816–3820 CrossRef CAS.
- F. Wania, Environ. Sci. Technol., 2007, 41, 4529–4535 CrossRef CAS.
- K. Prevedouros, I. T. Cousins, R. C. Buck and S. H. Korzeniowski, Environ. Sci. Technol., 2006, 40, 32–44 CrossRef CAS.
- M. Simcik, J. Environ. Monit., 2005, 7, 759–763 RSC.
- J. L. Barber, U. Berger, C. Chaemfa, S. Huber, A. Jahnke, C. Temme and K. C. Jones, J. Environ. Monit., 2007, 9, 530–541 RSC.
- C. Chaemfa, J. L. Barber, S. Huber, K. Breivik and K. C. Jones, J. Environ. Monit., 2010, 12, 1100 RSC.
- M. Cai, Z. Xie, A. Möller, Z. Yin, P. Huang, M. Cai, H. Yang, R. Sturm, J. He and R. Ebinghaus, Chemosphere, 2012, 87, 989–997 CrossRef CAS PubMed.
- L. Ahrens, M. Shoeib, S. Del Vento, G. Codling and C. Halsall, Environ. Chem., 2011, 8, 399–406 CrossRef CAS.
- M. Shoeib, P. Vlahos, T. Harner, A. Peters, M. Graustein and J. Narayan, Atmos. Environ., 2010, 44, 2887–2893 CrossRef CAS PubMed.
- M. Shoeib, T. Harner and P. Vlahos, Environ. Sci. Technol., 2006, 40, 7577–7583 CrossRef CAS.
- A. Dreyer, I. Weinberg, C. Temme and R. Ebinghaus, Environ. Sci. Technol., 2009, 43, 6507–6514 CrossRef CAS.
- A. Dreyer and R. Ebinghaus, Atmos. Environ., 2009, 43, 1527–1535 CrossRef CAS PubMed.
- A. M. Piekarz, T. Primbs, J. A. Field, D. F. Barofsky and S. Simonich, Environ. Sci. Technol., 2007, 41, 8248–8255 CrossRef CAS.
- A. Jahnke, S. Huber, C. Temme, H. Kylin and U. Berger, J. Chromatogr., A, 2007, 1164, 1–9 CrossRef CAS PubMed.
- S.-K. Kim, M. Shoeib, K.-S. Kim and J.-E. Park, Environ. Pollut., 2012, 162, 144–150 CrossRef CAS PubMed.
- L. Ahrens, M. Shoeib, T. Harner, S. C. Lee, R. Guo and E. J. Reiner, Environ. Sci. Technol., 2011, 45, 8098–8105 CrossRef CAS PubMed.
- J. Li, S. Del Vento, J. Schuster, G. Zhang, P. Chakraborty, Y. Kobara and K. C. Jones, Environ. Sci. Technol., 2011, 45, 7241–7248 CrossRef CAS PubMed.
- A. Dreyer, M. Shoeib, S. Fiedler, J. Barber, T. Harner, K.-W. Schramm, K. C. Jones and R. Ebinghaus, Environ. Chem., 2010, 7, 350–358 CrossRef CAS.
- M. Shoeib, T. Harner, S. C. Lee, D. Lane and J. Zhu, Anal. Chem., 2008, 80, 675–682 CrossRef CAS PubMed.
- S. Genualdi, S. C. Lee, M. Shoeib, A. Gawor, L. Ahrens and T. Harner, Environ. Sci. Technol., 2010, 44, 5534–5539 CrossRef CAS PubMed.
- S. Oono, K. H. Harada, M. A. M. Mahmoud, K. Inoue and A. Koizumi, Chemosphere, 2008, 73, 932–937 CrossRef CAS PubMed.
- M. Loewen, F. Wania, F. Wang and G. Tomy, Environ. Sci. Technol., 2008, 42, 2374–2379 CrossRef CAS.
- A. Jahnke, U. Berger, R. Ebinghaus and C. Temme, Environ. Sci. Technol., 2007, 41, 3055–3061 CrossRef CAS.
- J. W. Martin, K. Kannan, U. Berger, P. de Voogt, J. A. Field, J. Franklin, J. P. Giesy, T. Harner, D. C. G. Muir, B. Scott, M. Kaiser, U. Järnberg, K. C. Jones, S. A. Mabury, H. Schroeder, M. Simcik, C. Sottani, B. van Bavel, A. Kärrman, G. Lindström and S. van Leeuwen, Environ. Sci. Technol., 2004, 38, 248A–255A CrossRef CAS.
- A. Dreyer, C. Temme, R. Sturm and R. Ebinghaus, J. Chromatogr., A, 2008, 1178, 199–205 CrossRef CAS PubMed.
- F. Wania, L. Shen, Y. D. Lei, C. Teixeira and D. C. G. Muir, Environ. Sci. Technol., 2003, 37, 1352–1359 CrossRef CAS.
- C. Shunthirasingham, B. T. Mmereki, W. Masamba, C. E. Oyiliagu, Y. D. Lei and F. Wania, Environ. Sci. Technol., 2010, 44, 8082–8088 CrossRef CAS PubMed.
- T. Gouin, F. Wania, C. Ruepert and L. E Castillo, Environ. Sci. Technol., 2008, 42, 6625–6630 CrossRef CAS.
- C. Shunthirasingham, T. Gouin, Y. D. Lei, C. Ruepert, L. E. Castillo and F. Wania, Environ. Toxicol. Chem., 2011, 30, 2709–2717 CrossRef CAS PubMed.
- S. J. Hayward, T. Gouin and F. Wania, Environ. Sci. Technol., 2010, 44, 3410–3416 CrossRef CAS PubMed.
- S. J. Hayward, T. Gouin and F. Wania, J. Agric. Food Chem., 2010, 58, 1077–1084 CrossRef CAS PubMed.
- C. Shunthirasingham, C. E. Oyiliagu, X. Cao, T. Gouin, F. Wania, S. C. Lee, K. Pozo, T. Harner and D. C. G. Muir, J. Environ. Monit., 2010, 12, 1650 RSC.
- R. C. Antweiler, Environ. Sci. Technol., 2008, 42, 3732–3738 CrossRef CAS.
- R. Aruga, Anal. Chim. Acta, 1997, 354, 255–262 CrossRef CAS.
- F. E. Grubbs, Technometrics, 1969, 11, 1–21 CrossRef.
- V. Langer, A. Dreyer and R. Ebinghaus, Environ. Sci. Technol., 2010, 44, 8075–8081 CrossRef CAS PubMed.
- X. Zhang and F. Wania, Environ. Sci. Technol., 2012, 46, 9563–9570 CrossRef CAS PubMed.
- A. Dreyer, V. Matthias, C. Temme and R. Ebinghaus, Environ. Sci. Technol., 2009, 43, 4029–4036 CrossRef CAS.
- C. E. Müller, A. C. Gerecke, C. Bogdal, Z. Wang, M. Scheringer and K. Hungerbühler, Environ. Pollut., 2012, 169, 196–203 CrossRef PubMed.
- M. J. A. Dinglasan-Panlilio and S. A. Mabury, Environ. Sci. Technol., 2006, 40, 1447–1453 CrossRef CAS.
- J. P. Benskin, D. C. G. Muir, B. F. Scott, C. Spencer, A. O. De Silva, H. Kylin, J. W. Martin, A. Morris, R. Lohmann, G. Tomy, B. Rosenberg, S. Taniyasu and N. Yamashita, Environ. Sci. Technol., 2012, 46, 5815–5823 CrossRef CAS PubMed.
- A. Jahnke, L. Ahrens, R. Ebinghaus and C. Temme, Environ. Sci. Technol., 2007, 41, 745–752 CrossRef CAS.
- Z. Wang, M. Scheringer, M. MacLeod, C. Bogdal, C. E. Müller, A. C. Gerecke and K. Hungerbühler, Environ. Pollut., 2012, 169, 204–209 CrossRef CAS PubMed.
- M. Shoeib, T. Harner, M. Ikonomou and K. Kannan, Environ. Sci. Technol., 2004, 38, 1313–1320 CrossRef CAS.
- R. C. Buck, J. Franklin, U. Berger, J. M. Conder, I. T. Cousins, P. de Voogt, A. A. Jensen, K. Kannan, S. A. Mabury and S. P. van Leeuwen, Integr. Environ. Assess. Manage., 2011, 7, 513–541 CrossRef CAS PubMed.
- J. N. Westgate, C. Shunthirasingham, C. Oyiliagu, H. von Waldow and F. Wania, Atmos. Environ., 2010, 44, 4380–4387 CrossRef CAS PubMed.
- F. Ramirez, Instituto Regional de Estudios en Sustancias Toxicas, Universidad Nacional, Heredia, Costa Rica, 2010 Search PubMed.
- G. Lammel, P. Dobrovolný, A. Dvorská, K. Chromá, R. Brázdil, I. Holoubek and J. Hosek, J. Environ. Monit., 2009, 11, 1964–1972 RSC.
- S. Fiedler, G. Pfister and K.-W. Schramm, Toxicol. Environ. Chem., 2010, 92, 1801–1811 CrossRef CAS.
Footnote |
| † Electronic supplementary information (ESI) available. See DOI: 10.1039/c3em00499f |
| This journal is © The Royal Society of Chemistry 2014 |

