
 Open Access Article
 This Open Access Article is licensed under a
 Creative Commons Attribution 3.0 Unported Licence
Dual-graphite cells based on the reversible intercalation of bis(trifluoromethanesulfonyl)imide anions from an ionic liquid electrolyte
Sergej
Rothermel
,
Paul
Meister
,
Guido
Schmuelling
,
Olga
Fromm
,
Hinrich-W.
Meyer
,
Sascha
Nowak
,
Martin
Winter
* and
Tobias
Placke
*
University of Münster, MEET Battery Research Center, Institute of Physical Chemistry, Corrensstr. 46, 48149 Münster, Germany. E-mail: sergej.rothermel@uni-muenster.de; martin.winter@uni-muenster.de; tobiasplacke@uni-muenster.de; Fax: +49 251 83 36032; Tel: +49 251 83 36717
First published on 11th August 2014
Abstract
Recently, dual-ion cells based on the anion intercalation into a graphite positive electrode have been proposed as electrochemical energy storage devices. For this technology, in particular electrolytes which display a high stability vs. oxidation are required due to the very high operation potentials of the cathode, which may exceed 5 V vs. Li/Li+. In this work, we present highly promising results for the use of graphite as both the anode and cathode material in a so-called “dual-graphite” or “dual-carbon” cell. A major goal for this system is to find suitable electrolyte mixtures which exhibit not only a high oxidative stability at the cathode but also form a stable solid electrolyte interphase (SEI) at the graphite anode. As an electrolyte system, the ionic liquid-based electrolyte mixture Pyr14TFSI-LiTFSI is used in combination with the SEI-forming additive ethylene sulfite (ES) which allows stable and highly reversible Li+ ion and TFSI− anion intercalation/de-intercalation into/from the graphite anode and cathode, respectively. By addition of ES, also the discharge capacity for the anion intercalation can be remarkably increased from 50 mA h g−1 to 97 mA h g−1. X-ray diffraction studies of the anion intercalation into graphite are conducted in order to understand the influence of the electrolyte additive on the graphite structure and on the cell performance.
Broader contextOne of the most challenging issues in the 21st century is the preservation of a consistent energy supply that meets the world's increasing energy demands. The present energy economy based on fossil fuels is considered to be at serious risk due to several factors, such as the shortages of non-renewable resources or concerns about the environmental impact of energy consumption, and thus gives rise to the development of renewable energy sources. The need for clean and efficient storage of electrical energy will be vast, not only to meet the rising energy demand, but in particular to prevent global warming. Currently, lithium-ion batteries dominate the small format battery market for portable electronic devices and are now being widely regarded as the technology of choice for future automotive and stationary applications. The requirements for stationary batteries are significantly different from those of power batteries in electric vehicles. For stationary batteries, high safety, low cost and long cycle life are the most important parameters. In this paper, we introduce the dual-graphite/dual-carbon battery technology as a promising option for grid applications, since it displays environmental, safety and cost benefits (e.g. free of transition metals, non-flammability of the ionic liquid electrolyte, graphite as a low-cost electrode material, aqueous electrode processing possible for anodes and cathodes) over state-of-the-art lithium-ion batteries. |
1. Introduction
As a redox-amphoteric material, graphite can be reduced as well as oxidized by chemical or electrochemical methods.1 The resulting positive or negative charge can be compensated by the intercalation of a variety of certain anionic/cationic intercalation guests into the interlayer gaps of the graphite lattice.1,2 While lithiated graphite is an established anode material in state-of-the-art lithium-ion batteries,3 graphite intercalation compounds (GICs) intercalated by anions were suggested by Carlin et al. as possible active materials for positive electrodes in so-called “dual intercalating molten electrolyte batteries”.4 In their work, they proposed a dual-graphite battery system which uses different room temperature ionic liquids (RTILs), such as 1-ethyl-3-methylimidazolium-hexafluorophosphate (EMI+PF6−). In this set-up, the electrolyte does not only act as a charge carrier but also as a source for intercalation guests, in which EMI+ intercalates into the graphite anode and PF6− intercalates into the graphite cathode during the charge process.4 However, the reversibility of the intercalation/de-intercalation behavior of this dual-graphite cell was relatively poor. The concept of a dual-carbon cell is also followed in industry, as recently the Japanese start-up “Power Japan Plus” announced plans to commercialize such a kind of dual-carbon battery.5Recently, we introduced a novel dual-intercalation battery system using a mixture of N-butyl-N-methylpyrrolidinium bis(trifluoromethanesulfonyl)imide (Pyr14TFSI) and lithium bis(trifluoromethanesulfonyl)imide (LiTFSI) as an electrolyte.6–9 In this “dual-ion cell”, where e.g. metallic lithium or Li4Ti5O12 (LTO) is used as an anode material, and graphite, which is intercalated by TFSI− anions during charge, is used as a cathode material, and shows a highly reversible cycling performance with a Coulombic efficiency exceeding 99%.6 It was demonstrated that a reversible cathode discharge capacity of more than 50 mA h g−1 at room temperature and above 110 mA h g−1 at 60 °C operation temperature can be achieved.6 X-ray diffraction investigations revealed the mechanism behind the formation of Cn+TFSI− GICs.10 The intercalation of TFSI− anions proceeds in definable and consecutive phases. The attainment of these different nphases is dependent on the operation conditions such as the cut-off potential or the temperature. A specific discharge capacity of 115 mA h g−1 is the maximum we found so far for the TFSI− uptake into graphite, which corresponds to a stage-1 GIC with a stoichiometry ranging between C19TFSI and C20TFSI.10
In order to differentiate the energy storage mechanism of this battery system from the ion transfer mechanism which is known from lithium-ion batteries, we introduced the term “dual-ion cell”. This type of cell mechanism includes all cell reactions where simultaneously anions and cations react with the electrodes. In this dual-ion battery system, which also implies the dual-graphite/dual-carbon system, the electrolyte needs to be considered as an active material as well. This is in contrast to a lithium-ion cell, in which the electrolyte “only” acts as a charge carrier between the anode and the cathode and where the thickness of the electrolyte layer needs to be minimized. According to the work of Dahn and Seel in 2000,11 there must be a high amount of electrolyte present in the dual-graphite cell to provide enough ions which are needed during charging of the cell. In their work, they reported that an electrolyte with a high molarity is crucial to achieve a sufficiently high energy density of this system.11
Ionic liquids (ILs), being salts of low temperature melting points, are one of the most promising classes of electrolytes providing new opportunities in electrochemistry.12,13 ILs show several advantageous properties for electrochemical applications, such as a negligible vapor pressure, a broad liquid range and an ionic conductivity which can be in the same range of organic solvent-based electrolytes.12,13 It should be noted that the use of ILs as solvents for electrochemical reactions is predominantly driven by their excellent oxidative and reductive stability and thus a large electrochemical stability window, which generally exceeds the ones of conventional electrolyte solvents.14 In particular, electrolytes displaying a high stability vs. oxidation are required for the dual-ion technology, due to the very high operation potentials of the cathode, which may surpass 5 V vs. Li/Li+.
Since the compatibility of the ionic liquid Pyr14TFSI with graphite anodes is not sufficient,15–17 so far the selection of the anode materials for the dual-ion system has been limited to metallic lithium or LTO. Due to the excellent electrochemical stability of Pyr14TFSI against cathodic decomposition, there is no effective solid electrolyte interphase (SEI) formation on the graphite anode. Thus, graphite undergoes exfoliation by intercalation of the relatively large organic cations (Pyr14+) between the graphene layers, leading to irreversible degradation of the negative electrode.17 This process is illustrated schematically in Fig. 1 for a dual-graphite cell.
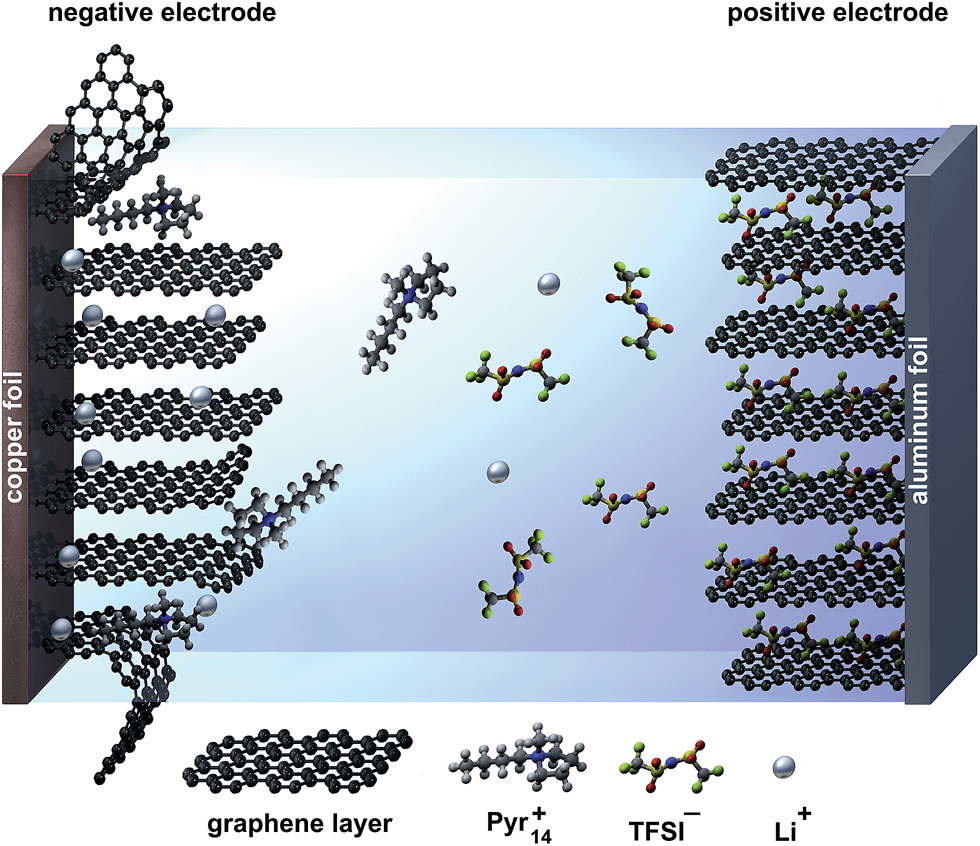 | ||
| Fig. 1 Schematic illustration of a dual-graphite cell with no effective SEI layer at the graphite anode during the charge process. The negative graphite electrode suffers from exfoliation reactions caused by co-intercalation of the relatively large pyrrolidinium (Pyr14+) cations. | ||
One solution to enable the use of ILs with graphite anodes is the addition of SEI-forming electrolyte additives such as ethylene sulfite (ES).18–20 Sulfur-based electrolyte additives are proposed to support the SEI formation by adsorption of their reduced species onto the catalytically active functional groups of the graphite surface.18,19,21 Unfortunately, the mechanism of the SEI formation in the presence of ES as an additive has not been well understood so far. Ota et al. proposed that an intermediate, such as SO2, is formed during the reductive decomposition of ES, which then reacts with various compounds such as Li2SO3 or Li2SO4.22 These compounds may contribute to more effective formation of the inorganic part of the SEI layer. Furthermore, Wrodnigg et al. suggested ES as an effective SEI-forming agent in the presence of propylene carbonate (PC) as a solvent, whereby graphite is protected from rapid exfoliation caused by massive co-intercalation of PC, leading to the destruction of the graphite structure.18 Recently, Leggesse and Jiang reported that ES can undergo a one- and two-electron reduction mechanism in PC-based electrolytes, whereas the formation of Li2SO3 is more favorable in the two-electron reduction process.23 The major reduction products which are considered to be responsible for the formation of an effective SEI layer are Li2SO3, (CH2OSO2Li)2, CH3CH(OSO2Li)–CH2OCO2Li and ROSO2Li.23
In this work, we present promising results concerning the use of graphite as both the anode and cathode material in a so-called “dual-graphite cell” using the ionic liquid-based electrolyte mixture Pyr14TFSI-LiTFSI in combination with ES as an SEI-forming additive. The energy storage mechanism of this system is based on the simultaneous TFSI− anion intercalation into the graphite positive electrode and Li+ ion intercalation into the graphite negative electrode during charge. During discharge, both ions are released back into the electrolyte. In this regard, the intercalation of Pyr14+ cations into the graphite anode needs to be prevented by the formation of a protective SEI layer, which still allows the reversible intercalation/de-intercalation of lithium ions, as depicted in Fig. 2.
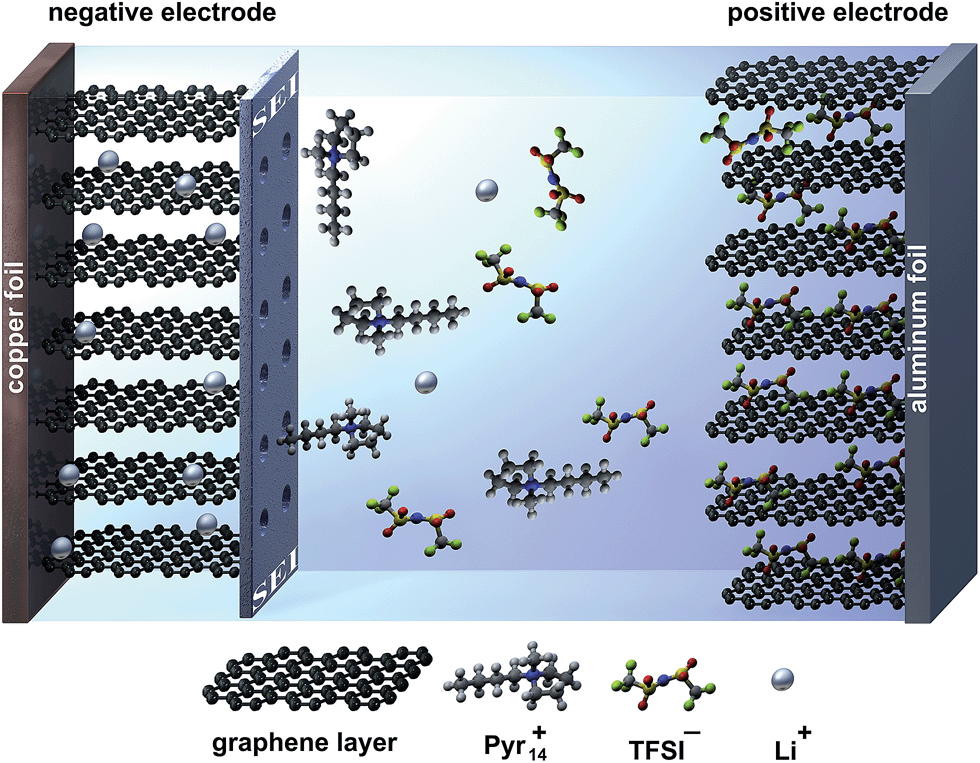 | ||
| Fig. 2 Schematic illustration of a dual-graphite cell with an effective SEI layer at the graphite anode during the charge process. The negative graphite electrode is protected from co-intercalation reactions of pyrrolidinium cations by the SEI layer; the SEI still allows the transport and intercalation of lithium ions. | ||
Recently, Read et al. reported that a dual-graphite cell using an organic solvent-based electrolyte can be cycled reversibly.24 However, the long-term cycling stability as well as Coulombic efficiency was relatively poor. Herein, we will demonstrate that by the use of the ionic liquid electrolyte mixture, the dual-graphite system displays a stable cycling performance with a high Coulombic efficiency, while both the discharge capacity and efficiency can be tailored by the operation conditions, such as the upper cut-off cell voltage. In addition, X-ray diffraction studies of the anion intercalation into graphite are performed in order to understand the influence of the electrolyte additive on the graphite structure and on the cell performance.
2. Experimental
The preparation of the graphite positive electrodes was carried out using a composition of 90 wt% of KS6L graphite (Imerys; D90 = 8.5 μm; BET specific surface area = 19.0 m2 g−1), 5 wt% of conductive carbon black C-nergy Super C65 (Imerys) and 5 wt% of sodium carboxymethyl-cellulose (CMC) as a binder (Walocell CRT 2000 PPA12, Dow Wolff Cellulosics). The details of the electrode preparation have been described previously.6The graphite negative electrodes were prepared in the same way using 90% of commercial graphite (further abbreviated as CG; D90 = 40.8 μm; BET specific surface area = 3.96 m2 g−1) as an active material, 5 wt% of conductive carbon black agent C-nergy™ Super C65 (Imerys), 2.5 wt% of the binder styrene-butadiene rubber (SBR; LIPATON SB 5521, Polymer Latex GmbH) and 2.5 wt% of sodium carboxymethylcellulose (CMC) as a binder (Walocel CRT 2000 PPA 12, Dow Wolff Cellulosics). The electrode paste for the graphite anode was cast on high-purity copper foil (Carl Schlenk AG®). The mass loading of the graphite negative electrode was ca. 2.5 mg cm−2.20
The ionic liquid N-butyl-N-methylpyrrolidinium bis(tri-fluoromethanesulfonyl)imide (Pyr14TFSI, Solvionic, purity: 99.9%) used as an electrolyte solvent was dried under ultra-high vacuum (5 × 10⁻⁸ mbar, 110 °C) for 48 hours using a turbo molecular pump TPS-compact (Varian Vacuum Technologies) before use. Under inert conditions, a mixture of dried Pyr14TFSI (water content less than 10 ppm, determined by Karl Fischer titration) with 1 M lithium bis(trifluoromethane-sulfonyl)imide (LiTFSI, 3 M, purity: 99.95%) as conductive and electroactive salt (mole fraction of LiTFSI: 0.3) was prepared. To this electrolyte solution, 2 wt% of the SEI-forming additive ethylene sulfite (ES, Sigma Aldrich, purity: 98%) were admixed. The maximum solubility of LiTFSI in the ionic liquid is strongly dependent on the temperature. While at 20 °C a LiTFSI mole fraction of ca. 0.32 is possible, this can be strongly enhanced to about 0.68 at 60 °C. Phase diagrams of the ionic liquid electrolyte mixtures were reported by Henderson and Passerini.25
Electrochemical measurements were carried out either in a half-cell set-up (Subsections 3.1 and 3.2) with metallic lithium as counter and reference electrodes or in a full-cell set-up (Subsection 3.4) with the CG-based electrode as an anode, the KS6L-based electrode as a cathode and high-purity metallic lithium foil (Rockwood Lithium®) as a reference electrode. For that purpose a custom-made Swagelok® type T-cell with a three-electrode configuration was used. A borosilicate glass microfiber (Whatman® GF/D) drenched with 120 μL of electrolyte served as the separator.
Charge/discharge cycling was performed on a multichannel Maccor 4300 battery test system (MACCOR, INC). After cell assembly, the cells rested for at least 12 hours to ensure homogeneous electrolyte distribution and sufficient electrode wetting. The constant current cycling of CG-based graphite anodes in a half-cell set-up was conducted with a specific current of 37.2 mA g−1 (0.1C) between cut-off potentials of 0.02 V and 1.5 V vs. Li/Li+ (see Subsection 3.1). The charge/discharge cycling of KS6L graphite cathodes in a half-cell set-up was performed with a constant current of 50 mA g−1 between cut-off potentials of 3.0 V and 4.8–5.2 V vs. Li/Li+ (see Subsection 3.2). The constant current cycling of dual-graphite cells (Subsection 3.4) was carried out with a constant charge and discharge current of 10 mA g−1 for the first three cycles in order to provide a homogeneous SEI-formation, while from the 4th cycle the current is increased in certain experiments (e.g. to 50 mA g−1 in Fig. 9 or to 500 mA g−1 in Fig. 11).
For the in situ X-ray diffraction (XRD) measurements, a modified commercial CR2016 coin cell (Hohsen, Japan) with an X-ray transparent window was used. The details of this set-up have been described previously.10 After assembly of the coin cell using high-purity metallic lithium (Rockwood Lithium®) as a counter electrode, the cell was directly placed in an X-ray diffractometer (BRUKER D8 Advance, equipped with a copper target X-ray tube). XRD measurements were conducted in a range between 2θ = 20° and 35° with a step size of 0.185° per second resulting in 20 minutes per in situ XRD scan at an accelerating voltage of 40 kV and a current flow of 40 mA. For in situ XRD measurements, cyclic voltammetry was performed using a VSP multichannel potentiostatic-galvanostatic system (Biologic® Science Instrument, France) with a scan rate of 50 mV s−1 between 3.4 V and 5.2 V at 20 °C with a 3 hour constant voltage step at the upper cut-off voltage.
3. Results and discussion
A major goal for the dual-graphite system is to find a suitable electrolyte mixture which exhibits first a high oxidative stability, in particular with anions that are stable upon intercalation/de-intercalation into the graphite cathode, and second is able to form a stable SEI layer at the graphite anode. As an electrolyte system, the ionic liquid-based electrolyte mixture Pyr14TFSI-1 M LiTFSI in combination with the SEI-forming additive ethylene sulfite (2 wt%) is studied. At first, lithium ion intercalation into the graphite anode and TFSI− anion intercalation into the graphite cathode are investigated independently in a half-cell set-up (Secitons 3.1 and 3.2). In Seciton 3.4, the electrochemical performance of the dual-graphite system is studied in detail.3.1. Graphite anode performance in a half-cell set-up
As mentioned above, the compatibility of the pure ionic liquid Pyr14TFSI-LiTFSI with graphite anodes is relatively poor, which is related to insufficient SEI formation and the co-intercalation of Pyr14+ cations between the graphene layers, leading to irreversible degradation/exfoliation of graphite.15,17Fig. 3 displays the charge/discharge cycling behavior for lithium ion intercalation/de-intercalation into/from graphite as an anode material (CG graphite) with the additive containing ionic liquid-based electrolyte (Pyr14TFSI, 1 M LiTFSI + 2 wt% ES). Even though the maximum discharge capacity is only about 100 mA h g−1, which is significantly lower than the theoretical value of fully lithiated graphite (372 mA h g−1), a capacity retention of 83% can be obtained after 50 cycles at a C-rate of 0.1 (Fig. 3a). This relatively low reversible discharge capacity was also reported by others15,26 and is most likely related to the low charge transfer kinetics for lithium intercalation/de-intercalation into/from graphite at the electrode/electrolyte interface, i.e. at the SEI. Furthermore, it can be caused by the high viscosity of the electrolyte and by the relatively low self-diffusion coefficient and transference number of Li+ in the ionic liquid.27 The reversible capacity may be further enhanced by tailoring the SEI layer by the use of certain electrolyte additives. However, these additives must not only build a stable SEI layer but also exhibit a high stability vs. oxidation for the dual-graphite cell.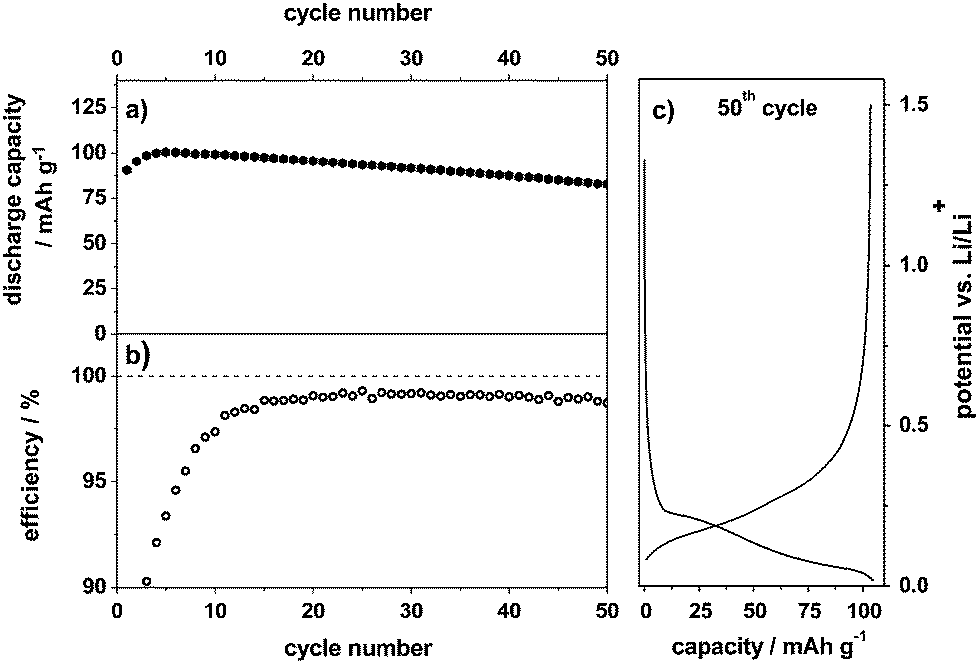 | ||
| Fig. 3 (a) Discharge capacity curve, (b) Coulombic efficiency curve and (c) potential vs. specific capacity profile during the 50th cycle of the constant current charge/discharge cycling for the metallic lithium/CG anode half-cell. Electrolyte: Pyr14TFSI-1 M LiTFSI + 2 wt% ES; cut-off potentials: 0.02 V and 1.5 V vs. Li/Li+, specific current: 37.2 mA g−1. | ||
The average Coulombic efficiency is about 99.0% along the cycles 10 to 50 (Fig. 3b). However, the efficiency in the first cycle with only 49% is quite low. Fig. 3c displays a representative charge/discharge potential profile from the 50th cycle, showing that lithium ion intercalation reversibly takes place in the potential range from 0.20 V to 0.02 V vs. Li/Li+. Overall, by addition of 2 wt% ES to the ionic liquid electrolyte, a reversible lithiation/de-lithiation of graphite is realized. In Section 3.4, we will show that this electrolyte system displays a highly reversible electrochemical performance in the dual-graphite cell, outperforming any results published so far in the literature for similar systems.
3.2. Graphite cathode performance in a half cell set-up
The electrochemical intercalation/de-intercalation behavior of TFSI− anions from the pure ionic liquid (Pyr14TFSI-LiTFSI) into graphite in a metallic lithium/graphite dual-ion cell was studied in detail in previous publications.6,7,28 As the use of the additive ES is primarily intended to increase the compatibility of the ionic liquid electrolyte with the graphite anode, no negative influence on the TFSI− anion intercalation is desirable in the presence of ES. In order to verify this assumption, electrochemical investigations of the TFSI− anion intercalation were performed with the ES-based electrolyte.Fig. 4 illustrates the discharge capacity curves (a) and the Coulombic efficiency curves (b) vs. cycle number (50 cycles) for the constant current cycling of the metallic lithium/KS6L graphite dual-ion cells with the pure electrolyte Pyr14TFSI-LiTFSI and the one containing 2 wt% ES as an additive. Representative potential vs. specific capacity profiles for the anion intercalation/de-intercalation into/from graphite of the 50th charge/discharge cycle are shown in Fig. 4c. The cut-off potentials for the anion intercalation/de-intercalation were set to 3.0 V and 5.0 V vs. Li/Li+, respectively.
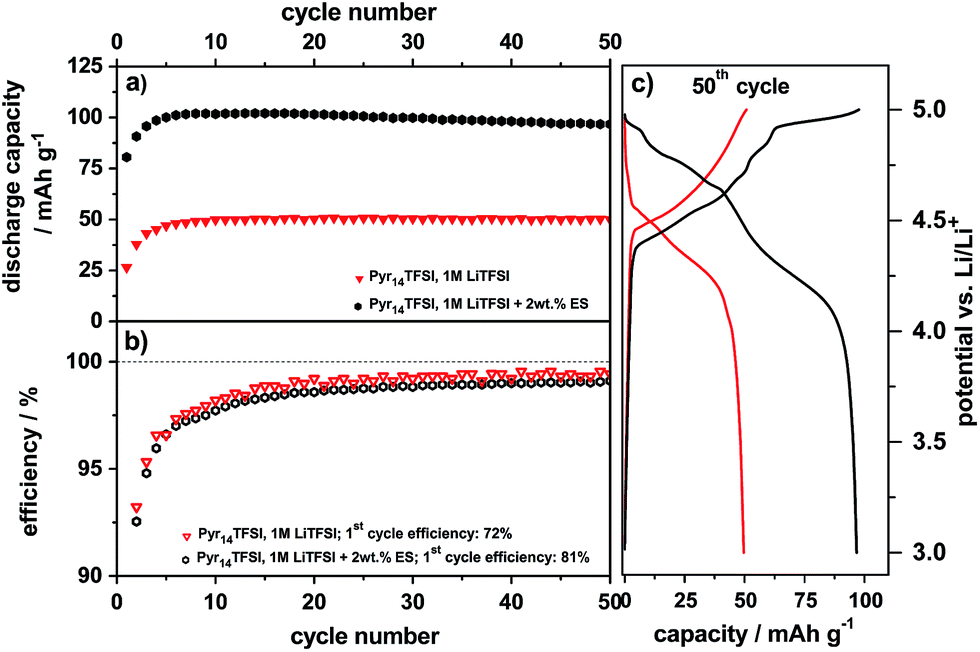 | ||
| Fig. 4 Discharge capacity curves, (b) Coulombic efficiency curves and (c) potential vs. specific capacity profiles during the 50th cycle of the constant current charge/discharge cycling for the metallic lithium/KS6L graphite cathode dual-ion cell (half-cell setup). Cut-off potentials: 3.0 V and 5.0 V vs. Li/Li+, specific current: 50 mA g−1. | ||
It is obvious that the discharge capacity of the ES-containing system is remarkably increased to 97 mA h g−1 (50th cycle) in comparison with the one of the pure ionic liquid, which displays a maximum value of 50 mA h g−1 (Fig. 4a and c). Apart from the first charge/discharge cycles, the Coulombic efficiency is very similar for both systems and reaches about 99% (Fig. 4b). As we discussed previously, the low Coulombic efficiency in the first cycles is most likely related to some type of “formation”, which is presumably a kinetic hindrance due to the first intercalation of TFSI− between the graphene sheets.28 This “formation” may take a few cycles until all graphite particles of the porous electrode are wetted and the maximum discharge capacity is achieved.28
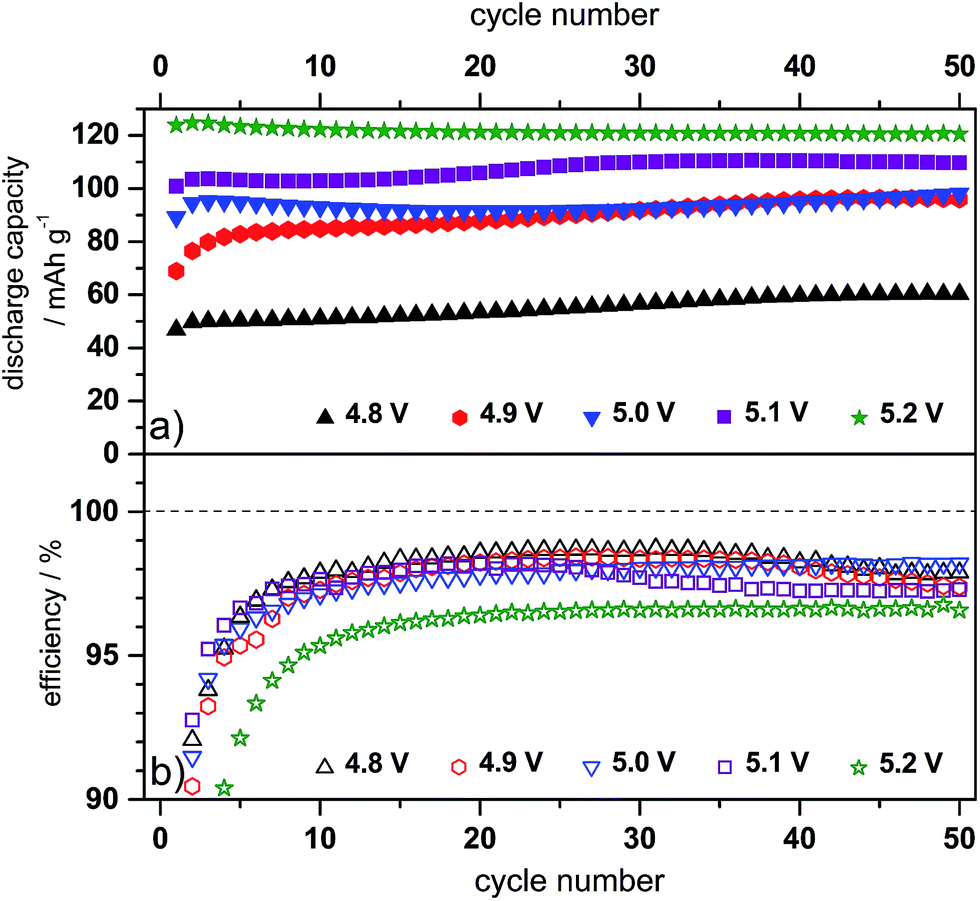
Since the use of the electrolyte additive leads to an increase of the maximum discharge capacity of the graphite cathode, the influence of a varying upper charging end potential, ranging from 4.8 V to 5.2 V vs. Li/Li+ on the discharge capacity and Coulombic efficiency was investigated. Table 1 summarizes the discharge capacity and efficiency values obtained at these different potentials.
| Charging end potential vs. Li/Li+/V | Discharge capacity/mA h g−1 | Coulombic efficiency/% |
|---|---|---|
| 4.8 | 49 | 99.5 |
| 4.9 | 61 | 99.3 |
| 5.0 | 97 | 99.1 |
| 5.1 | 126 | 99.0 |
| 5.2 | 116 | 97.8 |
In general, the discharge capacity increases with an increasing upper charging end potential, i.e. from 49 mA h g−1 at 4.8 V vs. Li/Li+ to 126 mA h g−1 at 5.1 V vs. Li/Li+, while the Coulombic efficiency slightly decreases, i.e. from 99.5% to 99.0%. If the upper cut-off potential is further enhanced to 5.2 V vs. Li/Li+, the discharge capacity drops to 116 mA h g−1 and the efficiency also deteriorates to 97.8%. Therefore, it can be assumed that potentials above 5.1 V vs. Li/Li+ lead to enhanced irreversible reactions, most likely caused by electrolyte degradation and in particular by decomposition of the intercalated anion.
Fig. 5 displays the differential capacity profiles of the metallic lithium/KS6L graphite dual-ion cell at different charging end potentials ranging from 4.8 V to 5.2 V vs. Li/Li+, each from the 50th charge/discharge cycle. In Fig. 5a, the dQ/dV profiles over the whole potential range are depicted, while Fig. 5b–d are magnifications for a better visualization of the intercalation/de-intercalation peaks. From these profiles the correlation between the TFSI− intercalation and de-intercalation peaks can be realized, which are marked by Roman numerals. The correlation of these peak positions is also summarized in Table 2. When the upper cut-off potential is set to 5.2 V vs. Li/Li+, six TFSI− intercalation peaks are observable, while the main intercalation takes place in the potential range from 4.36 V to 4.65 V vs. Li/Li+ (II and III) and at 4.97 V vs. Li/Li+ (VI).
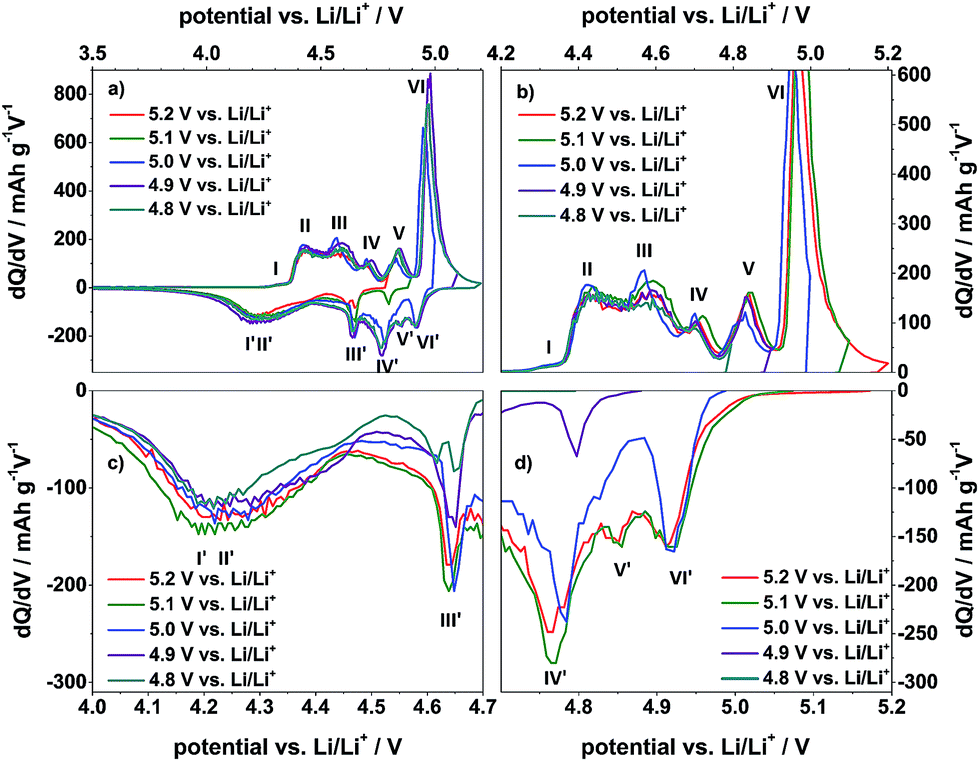 | ||
| Fig. 5 Differential capacity profiles of the metallic lithium/KS6L graphite dual-ion cell during constant current charge/discharge cycling with a specific current of 50 mA g−1. Sections (b), (c) and (d) are magnifications of the total profile (a). In each case, the 50th charge/discharge cycle is shown. Cut-off potentials: 3.0 V and 4.8–5.2 V vs. Li/Li+. | ||
| Pyr14TFSI, 1M LiTFSI + 2 wt% ES | |||
|---|---|---|---|
| Intercalation peak number | Peak position/V vs. Li/Li+ | De-intercalation peak number | Peak position/V vs. Li/Li+ |
| I | 4.26–4.35 | I′ | 3.80–4.44 |
| II | 4.36–4.46 | II′ | |
| III | 4.54–4.65 | III′ | 4.64 |
| IV | 4.71 | IV′ | 4.77 |
| V | 4.84 | V′ | 4.83–4.87 |
| VI | 4.97 | VI′ | 4.91 |
| Pyr14TFSI, 1M LiTFSI | |||
|---|---|---|---|
| Intercalation peak number | Peak position/V vs. Li/Li+ | De-intercalation peak number | Peak position/V vs. Li/Li+ |
| I | 4.37–4.43 | I′ | 3.98–4.14 |
| II | 4.44–4.56 | II′ | 4.15–4.46 |
| III | 4.64–4.79 | III′ | 4.46–4.60 |
| IV | 4.97–5.05 | IV′ | 4.69 |
| V | 5.05–5.20 | V′ | 4.84 |
In relation to that, also six corresponding de-intercalation peaks/potential regions can be identified (Table 2), ranging from 4.91 V to 4.64 V vs. Li/Li+ (III′ to VI′) and from 4.44 V to 3.90 V vs. Li/Li+ (I′ and II′). If the cut-off potential is decreased, e.g. to 5.0 V or 4.9 V vs. Li/Li+, the TFSI− intercalation peaks V and VI diminish and/or disappear, while, in the same way, the de-intercalation peaks VI to III weaken or completely disappear. In contrast, the intercalation peaks I to IV and the de-intercalation peaks I′ and II′ nearly stay constant, independent of the upper cut-off potential from 4.8 V to 5.2 V vs. Li/Li+.
In order to gain a better understanding of the influence of the electrolyte additive on the TFSI− anion intercalation/de-intercalation behavior, the differential capacity profiles from the Li/KS6L graphite dual-ion cell using the pure and the ES-containing IL-electrolyte are compared in Fig. 6. In addition, Table 2 also lists the peak positions for anion intercalation/de-intercalation from the pure ionic liquid electrolyte. It is obvious that the electrolyte additive displays a strong influence on the TFSI− uptake/release into/from graphite since the potential ranges for intercalation/de-intercalation as well as the intensities of these peaks completely change (Fig. 6). While for the pure ionic liquid five main intercalation and de-intercalation peaks/potential regions (I–V and I′–V′) can be seen, the IL with ES additive displays six peaks, as described above. In particular, the onset potential for the anion uptake is shifted to a lower value for the ES-containing electrolyte: 4.26 V compared to 4.37 V vs. Li/Li+ (peaks I and I). In addition, the main intercalation peak for the additive containing electrolyte is below 5.0 V vs. Li/Li+ (peak VI), while for the pure ionic liquid the main intercalation takes place above 5.0 V vs. Li/Li+ (peak V). Anion de-intercalation from the additive-based electrolyte starts at a higher potential (4.91 V compared to 4.84 V vs. Li/Li+) and also takes place at lower potentials (3.80 V vs. 3.98 V vs. Li/Li+, see Table 2).
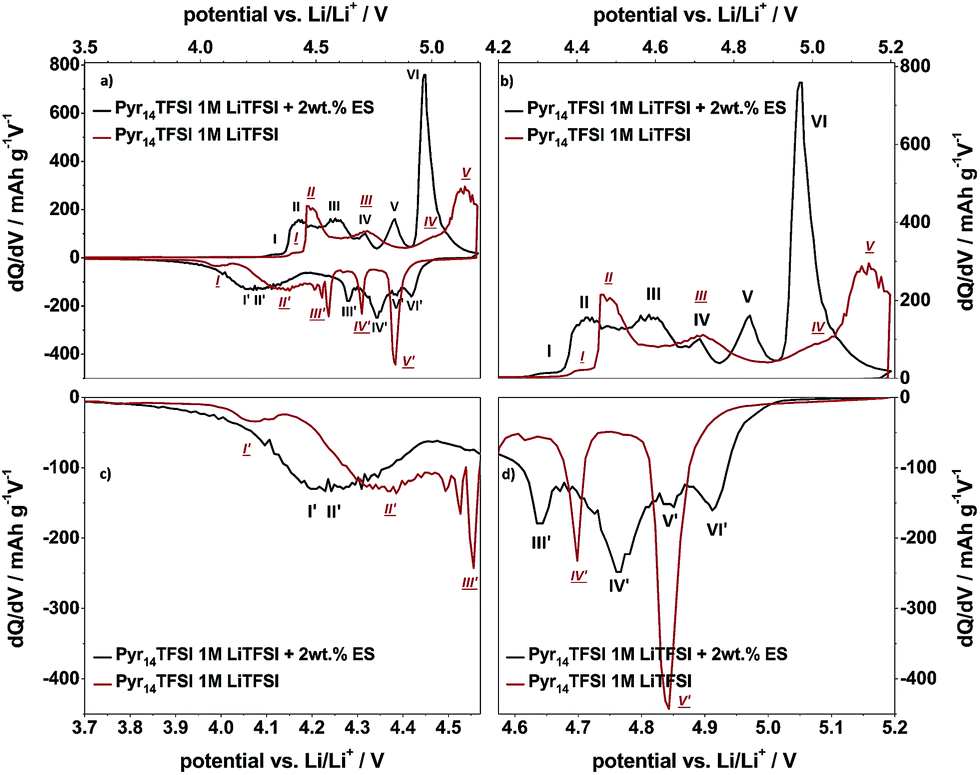 | ||
| Fig. 6 Comparison of representative differential capacity profiles of the metallic lithium/KS6L graphite dual-ion cells, applying two different electrolyte mixtures (red curve: Pyr14TFSI-1 M LiTFSI; black curve: Pyr14TFSI-1 M LiTFSI + 2 wt% ES) during constant current charge/discharge cycling with a specific current of 50 mA g−1. In each case, the 50th charge/discharge cycle is displayed. Cut-off potentials: 3.0 V and 5.2 V vs. Li/Li+. | ||
Overall, it can be summarized that the addition of ES as an additive to the Pyr14TFSI-LiTFSI ionic liquid results in a strongly enhanced discharge capacity for the anion intercalation into graphite. This enhancement may be related to a reduced coordination of Li+ ions with TFSI− anions in the presence of ethylene sulfite. Deshpande et al. reported on the mobility and transport properties of ionic liquids, in particular on an enhancement of the lithium ion mobility in ionic liquid-based electrolytes which contain electrolyte additives, such as ethylene carbonate, vinylene carbonate or tetrahydrofuran.29 They proposed that the inclusion of organic additives decreases the extent of coordination of the lithium ion with the IL-anion.29 Furthermore, Bayley et al. reported that electrolyte additives will influence the transport properties of cations and anions in ionic liquid electrolytes, i.e. the diffusion coefficient of the anion may be enhanced by addition of certain organic diluents.30 These effects may also explain the differences, i.e. the increased discharge capacity and reduced onset potential for the anion intercalation process into graphite from the ES containing IL in comparison with the pure ionic liquid electrolyte. However, further investigations are necessary to confirm this assumption.
3.3. In situ X-ray diffraction study of the anion intercalation into graphite
X-ray diffraction studies of the TFSI− anion intercalation were performed in order to examine whether the increase in discharge capacity also results in a change of the structural composition of the GIC, i.e. in a higher stage formation, for the additive containing electrolyte compared to the pure ionic liquid-based system. In a previous publication, we reported on the XRD investigation of the TFSI− intercalation into graphite for the pure Pyr14TFSI-LiTFSI electrolyte.10Here, we showed that the anion intercalation takes place via a stage formation process and calculated the maximum stage number, periodic repeat distance and gallery height for the Cn+TFSI− GIC.10
Fig. 7a illustrates the first cycle of the in situ XRD pattern for TFSI− intercalation/de-intercalation from the ES containing electrolyte, which was carried out by cyclic voltammetry (CV). Fig. 7b displays the voltage and specific current profiles in dependence of time from the CV experiment. The scan rate was set to 50 μV s−1 and a constant voltage step of 180 minutes was conducted at the upper cut-off voltage of 5.20 V. For a better visualization, the first 22 XRD scans in the back of Fig. 7a are not depicted, since the (002) peak of graphite with relatively high intensity remains unaffected until the first anion intercalation takes place at about 4.55 V (Fig. 7b). To enable a better comparison between the XRD pattern and the cyclic voltammogram, representative colored XRD scans (Fig. 7a) can be correlated with the colored dots (with the same color) in the voltage and current profiles (Fig. 7b).
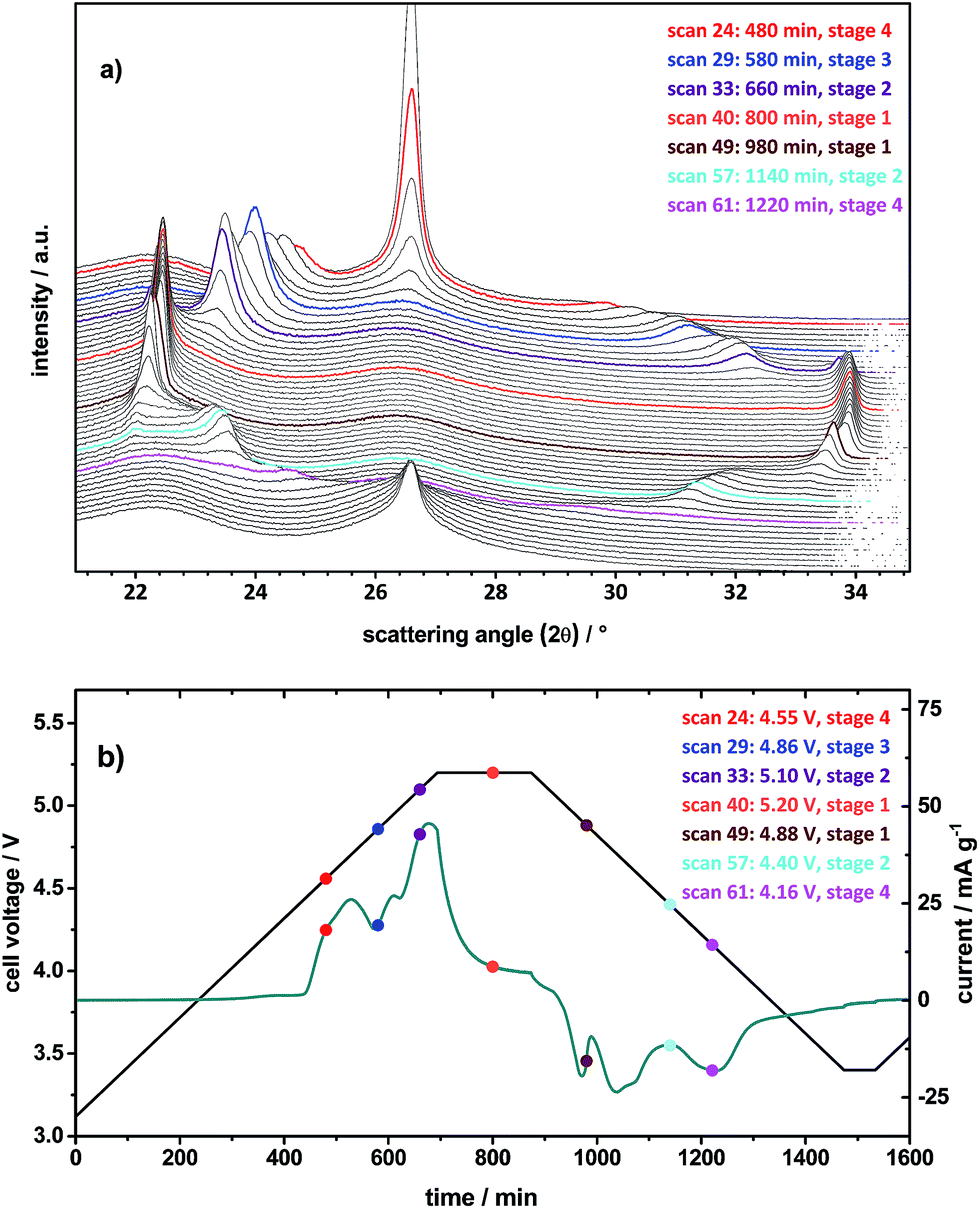 | ||
| Fig. 7 (a) In situ X-ray diffraction patterns and (b) cell voltage vs. time (black curve) and specific current vs. time (blue curve) profiles of the cyclic voltammetry experiment (1st cycle) of the metallic lithium/KS6L dual-ion cell. Electrolyte: Pyr14TFSI-1 M LiTFSI + 2 wt% ES. Scan rate: 50 μV s−1. Colored lines in (a) and colored dots in (b) can be correlated with each other by the scan number. | ||
In addition, Table 3 summarizes the values for the most dominant stage number n, the periodic repeat distance Ic, the TFSI gallery height di, and the gallery expansion Δd, which are calculated in accordance with our previous publication.10 For comparison reasons, also the corresponding values for the pure ionic liquid electrolyte are listed in Table 3.
| Pyr14TFSI, 1 M LiTFSI + 2 wt% ES | ||||||
|---|---|---|---|---|---|---|
| Cell voltage/V | 4.55 | 4.86 | 5.10 | 5.20 | 4.88 | 4.40 |
| Scan number | 24 | 29 | 33 | 40 | 49 | 57 |
| d (n+2)/d(n+1) ratio | 1.20 | 1.30 | 1.37 | 1.51 | 1.51 | 1.34 |
| Dominant stage (n) | 4 | 3 | 2 | 1 | 1 | 2 |
| Periodic repeat distance (Ic)/Å | 18.03 ± 0.01 | 14.84 ± 0.26 | 11.39 ± 0.13 | 7.92 ± 0.01 | 7.97 ± 0.01 | 11.38 ± 0.02 |
| Gallery height (di)/Å | 7.99 | 7.88 | 7.91 | 7.92 | 7.98 | 8.05 |
| Gallery expansion (Δd)/Å | 4.64 | 4.53 | 4.56 | 4.57 | 4.63 | 4.70 |
| Pyr14TFSI, 1M LiTFSI (according to Schmuelling et al.10) | |||||
|---|---|---|---|---|---|
| Cell voltage/V | 4.70 | 4.80 | 5.20 | 4.60 | 4.00 |
| d (n+2)/d(n+1) ratio | 1.20 | 1.26 | 1.31 | 1.31 | 1.27 |
| Dominant stage (n) | 4 | 3 | 2 | 2 | 3 |
| Periodic repeat distance (Ic)/Å | 18.01 ± 0.06 | 14.65 ± 0.02 | 11.31 ± 0.13 | 11.38 ± 0.11 | 14.91 ± 0.07 |
| Gallery height (di)/Å | 7.96 | 7.95 | 7.96 | 8.03 | 8.21 |
| TFSI gallery expansion (Δd)/Å | 4.61 | 4.60 | 4.61 | 4.68 | 4.86 |
The scan 23 for the pristine KS6L graphite electrode shows the (002) peak of graphite as expected at 2θ = 26.55° (Fig. 7a). By charging the cell to 4.55 V, the (002) graphite peak decreases in intensity and splits up into two new peaks, one more dominant peak (00n + 1) at 24.7° and the second (00n + 2) at 29.7° (scan 24).31,32 By determining the ratio of the d(n+2)/d(n+2) peak positions and correlating these with the ratios of stage pure GICs, given in our previous publication,10 it is possible to calculate the most dominant stage phase of the observed GIC.31,32 Here, the first observable intercalation stage is 4 (Table 3). When the voltage is increased to 4.86 V, the stage is raised to the next higher level of 3 (scan 29). Passing stage 2 by scan 33 at 5.10 V, the maximum intercalation stage 1 is reached during the constant voltage step at 5.2 V, exemplarily represented by scan 40 (Fig. 7 and Table 3). As the de-intercalation starts at 5.06 V (compare with peak VI′ in Fig. 6), the intercalation stage changes to 2 at 4.40 V (scan 57) and to 4 at 4.16 V (scan 61). In contrast, for the pure ionic liquid electrolyte only a maximum stage number of 2 is observed under the same operation conditions (Table 3).
These results confirm that by addition of ES to the electrolyte, not only the discharge capacity is increased, but also the composition changes from a stage-2 GIC to a stage-1 GIC. The TFSI− gallery height of about 8 Å and thus the gallery expansion of 4.65 Å nearly stay unaffected from the type of electrolyte as well as from the stage number (Table 3).
3.4. Dual-graphite cell performance
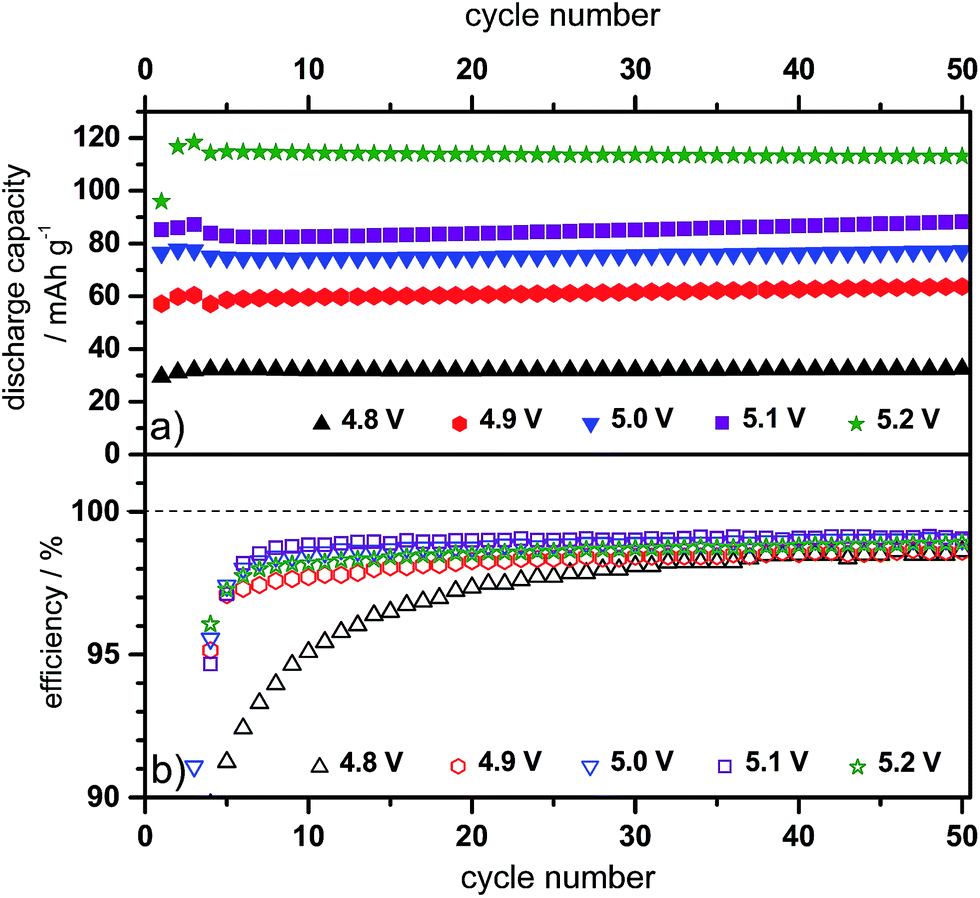
Considering the investigations performed in different half-cell set-ups, it is obvious that the Pyr14TFSI-LiTFSI-based electrolyte in combination with the additive ES enables first the reversible lithiation of graphite and second improves the anion intercalation into the graphite cathode. For this reason, dual-graphite full-cell investigations were conducted.Fig. 8 and 9 illustrate the cycling behavior of the dual-graphite cells, performed with constant charge/discharge currents of 10 mA g−1 and 50 mA g−1, respectively. In the second case, three formation cycles with a lower current were carried out (10 mA g−1) before increasing the current to 50 mA g−1 (Fig. 9). Assuming a theoretical capacity of 100 mA h g−1, a specific current of 10 mA g−1 would correspond to a C-rate of 0.1. The upper cut-off voltage for these experiments was varied between 4.8 V and 5.2 V, in order to investigate the influence on the Coulombic efficiency, discharge capacity and cycling stability. The corresponding values of the cycling data from representative cycles, including the Coulombic efficiency and discharge capacity, are given in Table 4.
 | ||
| Fig. 8 (a) Discharge capacity cycling curves and (b) Coulombic efficiency curves of the constant current charge/discharge cycling for CG/KS6L dual-graphite cells. Electrolyte: Pyr14TFSI, 1 M LiTFSI + 2 wt% ES; specific current for charge and discharge: 10 mA g−1; cut-off voltages: 3.0 V and 4.8–5.2 V. | ||
 | ||
| Fig. 9 Discharge capacity cycling curves and (b) Coulombic efficiency curves of the constant current charge/discharge cycling for CG/KS6L dual-graphite cells. Electrolyte: Pyr14TFSI-1 M LiTFSI + 2 wt% ES; specific current for charge and discharge: 10 mA g−1 (for cycles 1–3) and 50 mA g−1 (for cycles 4–50); cut-off voltages: 3.0 V and 4.8–5.2 V. | ||
| Specific current/mA g−1 | Upper cut-off voltage/V | Discharge capacity/mA h g−1 | Coulombic efficiency (1st cycle)/% | Coulombic efficiency (50th cycle)/% |
|---|---|---|---|---|
| 10 | 4.8 | 60 | 73.8 | 97.9 |
| 4.9 | 96 | 69.6 | 97.4 | |
| 5.0 | 98 | 71.2 | 98.2 | |
| 5.1 | 110 | 75.0 | 97.2 | |
| 5.2 | 121 | 69.5 | 96.6 | |
| 50 | 4.8 | 32 | — | 98.6 |
| 4.9 | 64 | — | 98.6 | |
| 5.0 | 77 | — | 99.0 | |
| 5.1 | 88 | — | 99.1 | |
| 5.2 | 113 | — | 98.9 |
In general, the discharge capacity increases with a rising upper charging end voltage. At a constant current of 10 mA g−1, the discharge capacity changes from 60 mA h g−1 at 4.8 V to 121 mA h g−1 at 5.2 V (representative value for the 50th cycle, see Table 4). By the increase of the specific charge/discharge current to 50 mA g−1 (Fig. 9), the discharge capacity decreases for all cut-off voltages compared to cycling at 10 mA g−1. At 4.8 V, a discharge capacity of 32 mA h g−1 is measured, which can be enhanced to 113 mA h g−1 at 5.2 V. A detailed study on the influence of the specific current on the electrochemical performance of the dual-graphite cell was reported in our previous work.20 Here, we found that the charge process (= intercalation of lithium ions and TFSI− anions into graphite) is the rate-determining step, while a discharge capacity ranging from 100 mA h g−1 to 30 mA h g−1 is achieved for a specific current that varies from 10 mA g−1 to 500 mA g−1.20Fig. 8 and 9 depict the first 50 cycles of the charge/discharge cycling and reveal a stable cycling behavior, independent of the upper cut-off voltage.
Fig. 10 displays representative cell voltage (black curve, left y-axis) as well as the anode and cathode potential profiles vs. Li/Li+ (red curves, right y-axis) for the CG/KS6L dual-graphite cell during selected cycles (1st, 2nd, 49th and 50th cycles) of the constant current charge/discharge process. The upper and lower cell voltages are 5.1 V and 3.0 V, respectively, and are given by the difference of the cathode and anode potentials.33 The charge/discharge rate for the first three cycles was 10 mA g−1, while the following cycles were performed at 50 mA g−1 (corresponding to Fig. 9; 5.1 V cut-off voltage).
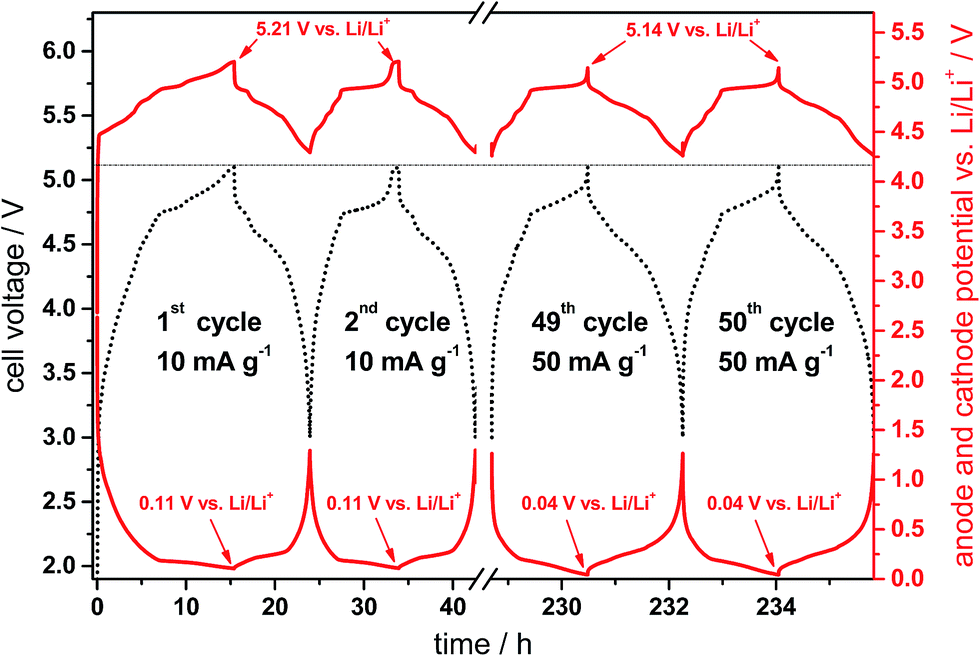 | ||
| Fig. 10 Cell voltage vs. time profile (black, dotted curve) and anode and cathode potential vs. time profiles (red curves) of the CG/KS6L dual-graphite cell during representative cycles of the constant current charge/discharge cycling process. The specific current for cycles 1–3 is 10 mA g−1 and 50 mA g−1 for the following cycles. Cell voltage range: 3.0 V and 5.1 V. | ||
From the cell voltage and potential profiles of the anode and cathode, it is obvious that the first cycle differs from the following cycles, which is mainly related to the SEI formation and electrolyte decomposition taking place at the graphite anode as well as to the first intercalation of TFSI− anions into the graphite cathode. In the first charge process, the anode potential reaches 0.115 V vs. Li/Li+, which means that the graphite anode is not fully intercalated by lithium ions, i.e. stage 2 is observed (LiC12).34 The transition to stage 1 occurs at a potential of ca. 0.09 V vs. Li/Li+ and is thus about 25 mV below the potential plateau of stage 2.34 In other words this means that the anode is oversized in terms of capacity, which is desired in order to avoid lithium metal plating and therefore safety issues at the anode.33 According to the behavior of the anode potential, the cathode potential in the first cycle rises to a maximum of 5.21 V vs. Li/Li+. At an increased rate (50 mA g−1), the anode potential drops to 0.04 V vs. Li/Li+ and the cathode potential drops to the same extent to 5.14 V vs. Li/Li+, which may be related to an increased cell resistance. The potential profiles for the anion intercalation have been discussed in detail in previous publications.6,28,35 Overall, it can be observed that the intercalation of both lithium ions and TFSI− anions into the graphite anode and cathode, respectively, occurs with a high reversibility leading to a high cycling stability. Recently, we reported a capacity retention of more than 98% for this dual-graphite system after 500 charge/discharge cycles at a rate of 50 mA g−1 and at an upper cut-off voltage of 5.0 V.20
The Coulombic efficiency of the dual-graphite system varies in the first charge/discharge cycle between 69.5% and 75.0% (Table 4), which is mainly related to SEI formation and electrolyte decomposition at the anode as well as the first anion intercalation into the graphite cathode (kinetic activation), as described above. The efficiency in the first cycle seems to be independent of the upper cut-off voltage, as no correlation can be seen. Since the electrolyte in this system can be considered as an active material, an excess of electrolyte is necessary due to the irreversible consumption of lithium for the SEI formation. In the subsequent cycles, the Coulombic efficiency increases and varies, e.g. in the 50th cycle, between 97.2% and 98.2% at a charge/discharge rate of 10 mA g−1 (Table 4 and Fig. 8), while the highest efficiency is reached at a cut-off voltage of 5.0 V.
At an enhanced rate of 50 mA g−1, the efficiency can be further increased and varies between 98.6% and 99.1% (Table 4 and Fig. 9). Here, the highest efficiency is obtained at 5.0 and 5.1 V. This trend can most likely be explained by a decreased decomposition of intercalated TFSI− anions as well as a decreased self-discharge for an increased charge/discharge current, which we observed in current rate investigations for the dual-ion system. Thus a higher rate results in an enhanced Coulombic efficiency.6,28 The influence of the cycling rate on the coulombic efficiency was studied in more detail by Smith et al. for different lithium-ion full cells based on graphite negative electrodes.36 They reported that the time of one cycle is the dominant contributor to the irreversible capacity (coulombic inefficiency) for cells that were cycled at low rates (e.g. C/24), which indicated that parasitic reactions consuming charge proceed independent of the cycling rate.36 Since the electrolyte oxidation and decomposition can be considered as parasitic side reactions for the dual-graphite cell, the departure of the coulombic efficiency from unity (1.0000…) will increase with cycle time and behave inversely with the C-rate. In particular at elevated operation temperatures (e.g. 60 °C), the efficiency will decrease remarkably. This is also what we reported in a recent publication, showing the influence of the operation temperature on the electrochemical performance of the dual-ion system.28
Fig. 11 displays the constant current charge/discharge cycling behavior and efficiency curves for the dual-graphite system cycled at 500 mA g−1 (corresponding to 5C if a theoretical capacity of 100 mA h g−1 is assumed). The system exhibits a stable cycling performance over 500 cycles with a discharge capacity of about 50 mA h g−1. In addition, the Coulombic efficiency displays an average value of 99.8%. As discussed above, one can assume that the increased charge/discharge rate results in a reduced decomposition of intercalated anions as well as reduced self-discharge reactions.
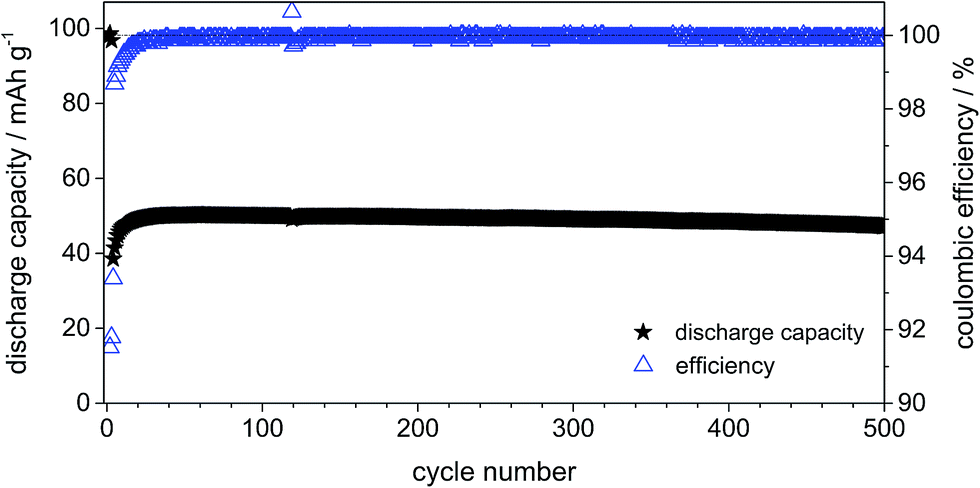 | ||
| Fig. 11 Discharge capacity curve and Coulombic efficiency curve of the constant current charge/discharge cycling performance of the CG/KS6L dual-graphite cell. Cell voltage range: 3.0 V and 5.1 V; specific current for charge and discharge: 10 mA g−1 (for cycles 1–3) and 500 mA g−1 (for cycles 4–500). | ||
4. Conclusion
In this work, we demonstrated promising results for the electrochemical performance of a “dual-graphite cell” using the ionic liquid-based electrolyte mixture Pyr14TFSI-LiTFSI in combination with ethylene sulfite (ES) as an SEI-forming additive. The main issue for this dual-graphite cell is to find a suitable electrolyte mixture that first enables reversible lithium ion intercalation/de-intercalation into the graphite negative electrode by formation of a stable solid electrolyte interphase (SEI) as well as second allows the reversible intercalation/de-intercalation of the electrolyte salt anions (here: TFSI− anions) into the graphite positive electrode with a sufficiently high Coulombic efficiency. This in turn is dependent on a high oxidative stability of the electrolyte mixture, in particular on the stability of the intercalated anion.By the use of the Pyr14TFSI-LITFSI ionic liquid electrolyte with 2 wt% of ES, it was possible to cycle the dual-graphite cell with a high reversibility, avoiding graphite exfoliation at the anode which is extensively observed for the pure ionic liquid. Furthermore, we found that the discharge capacity, which is related to the anion intercalation for a metallic lithium/graphite dual-ion cell, is nearly doubled if ES as an additive is used. At an upper cut-off potential of 5.0 V vs. Li/Li+, a discharge capacity of 97 mA h g−1 is reached, while only 50 mA h g−1 is obtained if no electrolyte additive is present. By the use of in situ XRD measurements we studied the anion intercalation into graphite with respect to the stage formation and structural composition. It was possible to determine the maximum stage number as well as to calculate the periodic repeat distance, the TFSI− gallery height and the gallery expansion. From these investigations, we found that by the use of ES as an electrolyte additive a maximum stage number of 1 is reached in the first cycle, while for the pure ionic liquid only a stage 2 is obtained. Therefore, the addition of ethylene sulfite to the electrolyte not only results in an enhanced discharge capacity for the anion uptake, but also in a different structural composition. For the pure ionic liquid, we found a maximum capacity of 115 mA h g−1 for the TFSI− uptake into graphite, which corresponds to a stage-1 GIC with a stoichiometry ranging between C19TFSI and C20TFSI.10 However, these results were obtained at an increased operation temperature of 60 °C.10 For the Pyr14TFSI-LiTFSI electrolyte with ES as an additive we determined a maximum capacity of 126 mA h g−1, which corresponds to a stage-1 GIC with a stoichiometry of ca. C18TFSI. The enhancement in the specific capacity and the change in the potential profile for intercalation/de-intercalation, e.g. a reduced onset potential for anion intercalation, may be related to a reduced coordination of Li+ ions with TFSI− anions in the presence of ES, i.e. the diffusion coefficient of the anion may be enhanced by addition of ES. However, these assumptions need to be confirmed in future investigations.
The constant current charge/discharge cycling investigations of the dual-graphite system displayed a stable cycling performance over 50 cycles with a specific discharge capacity varying from 32 mA h g−1 to 121 mA h g−1 depending on the upper charging end voltage and the rate. In a previous publication, we showed that a stable cycling is realized even over 500 cycles for this dual-graphite system.20 Enhanced charging end potentials and lower charge/discharge rates result in a higher specific capacity. The Coulombic efficiency can also be tailored by the charging end potential and rate, while here a contrary trend was found. With increasing rate and decreasing upper charging end potential, the Coulombic efficiency can be enhanced and may exceed 99%.
Recently, we reported that the charge process (= intercalation of lithium ions and TFSI− anions into graphite) is the rate-determining step for the dual-graphite system, while a discharge capacity ranging from 100 mA h g−1 to 30 mA h g−1 can be achieved for a specific current that ranges from 10 mA g−1 to 500 mA g−1.20 Here, we could additionally show that a stable charge/discharge cycling performance over 500 cycles at a specific current of 500 mA g−1 (corresponds to 5C if a theoretical capacity of 100 mA h g−1 is assumed) is achieved with a specific capacity close to 50 mA h g−1 and a Coulombic efficiency exceeding 99.8% during cycling.
The specific gravimetric and volumetric energy of the dual-graphite cell strongly depend on the electrolyte salt concentration, as reported by Dahn and Seel.11 In this work, a 1 M LiTFSI concentration was used, which needs to be strongly enhanced in order to further increase the specific energy of this system. Then, the energy content may be sufficient for storage applications like stationary energy storage. One approach to increase the LiTFSI concentration could be the use of mixtures of ionic liquids and organic solvents that display a low viscosity but a sufficiently high stability vs. oxidation. In this case, one big advantage of ionic liquids compared to organic solvent-based electrolytes is the fact that no “additional” solvent is needed, as the solvent and the electrolyte salt are the same. Recently, we reported that the practical specific energy of this dual-graphite system may be in the range of ca. 80% of the energy of a Li4Ti5O12/LiFePO4 battery with an organic solvent-based electrolyte.7 This energy content may be “enough” for stationary batteries, but is probably not sufficient for automotive applications.
Overall, despite its moderate energy density,24 the dual-graphite technology may be a promising option for grid applications, since it displays environmental, safety and cost benefits (e.g. free of transition metals, non-flammability of the ionic liquid electrolyte, low-cost electrode materials, aqueous electrode processing possible for the anode and cathode) over state-of-the-art lithium-ion batteries.
Acknowledgements
The authors would like to thank the Federal Ministry of Education and Research (BMBF) for funding of this work in the project “Insider” (03EK3031A) within the “Förderinitiative Energiespeicher”. We gratefully acknowledge the supply of materials by Imerys Graphite & Carbon and Rockwood Lithium®. We also further acknowledge the support of Mariano Grünebaum (University of Münster, group Prof. Dr H.-D. Wiemhöfer) for visualization of the operating principle of the dual-graphite system.References
- J. O. Besenhard and H. P. Fritz, Angew. Chem., Int. Ed. Engl., 1983, 22, 950–975 CrossRef PubMed.
- K. Tasaki, J. Phys. Chem. C, 2013, 118, 1443–1450 Search PubMed.
- J. P. Olivier and M. Winter, J. Power Sources, 2001, 97–98, 151–155 CrossRef CAS.
- R. T. Carlin, H. C. Delong, J. Fuller and P. C. Trulove, J. Electrochem. Soc., 1994, 141, L73–L76 CrossRef CAS PubMed.
- PowerJapanPlus, http://powerjapanplus.com.
- T. Placke, O. Fromm, S. F. Lux, P. Bieker, S. Rothermel, H. W. Meyer, S. Passerini and M. Winter, J. Electrochem. Soc., 2012, 159, A1755–A1765 CrossRef CAS PubMed.
- T. Placke, P. Bieker, S. F. Lux, O. Fromm, H. W. Meyer, S. Passerini and M. Winter, J. Phys. Chem., 2012, 226, 391–407 CAS.
- S. F. Lux, P. Bieker, H. W. Meyer, T. Placke, S. Passerini and M. Winter, 2013, Publication number: DE102011054122 A1, Application number: DE201110054122, Also published as: WO2013045567A1.
- M. Winter, P. Bieker, S. F. Lux, H. W. Meyer, T. Placke and S. Passerini, 2013, Publication number: DE102011054119 A1, Application number: DE201110054119, Also published as: WO2013045561A1.
- G. Schmuelling, T. Placke, R. Kloepsch, O. Fromm, H. W. Meyer, S. Passerini and M. Winter, J. Power Sources, 2013, 239, 563–571 CrossRef CAS PubMed.
- J. R. Dahn and J. A. Seel, J. Electrochem. Soc., 2000, 147, 899–901 CrossRef CAS PubMed.
- A. Lewandowski and A. Swiderska-Mocek, J. Power Sources, 2009, 194, 601–609 CrossRef CAS PubMed.
- M. Galinski, A. Lewandowski and I. Stepniak, Electrochim. Acta, 2006, 51, 5567–5580 CrossRef CAS PubMed.
- F. Endres, S. Z. El Abedin, A. Y. Saad, E. M. Moustafa, N. Borissenko, W. E. Price, G. G. Wallace, D. R. MacFarlane, P. J. Newman and A. Bund, Phys. Chem. Chem. Phys., 2008, 10, 2189–2199 RSC.
- S. F. Lux, M. Schmuck, G. B. Appetecchi, S. Passerini, M. Winter and A. Balducci, J. Power Sources, 2009, 192, 606–611 CrossRef CAS PubMed.
- A. Balducci, M. Schmuck, W. Kern, B. Rupp, S. Passerini and M. Winter, ECS Trans., 2008, 11, 109–114 CAS.
- M. Nadhérna, J. Reiter, J. Moskon and R. Dominko, J. Power Sources, 2011, 196, 7700–7706 CrossRef PubMed.
- G. H. Wrodnigg, J. O. Besenhard and M. Winter, J. Electrochem. Soc., 1999, 146, 470–472 CrossRef CAS PubMed.
- G. H. Wrodnigg, J. O. Besenhard and M. Winter, J. Power Sources, 2001, 97–8, 592–594 CrossRef.
- S. Rothermel, P. Meister, O. Fromm, J. Huesker, H. W. Meyer, M. Winter and T. Placke, ECS Trans., 2014, 58, 15–25 CrossRef PubMed.
- R. Mogi, M. Inaba, S. K. Jeong, Y. Iriyama, T. Abe and Z. Ogumi, J. Electrochem. Soc., 2002, 149, A1578–A1583 CrossRef CAS PubMed.
- H. Ota, T. Akai, H. Namita, S. Yamaguchi and M. Nomura, J. Power Sources, 2003, 119, 567–571 CrossRef.
- E. G. Leggesse and J.-C. Jiang, J. Phys. Chem. A, 2012, 116(45), 11025–11033 CrossRef CAS PubMed.
- J. A. Read, A. v. W. Cresce, M. Ervin and K. Xu, Energy Environ. Sci., 2014, 7, 617–620 CAS.
- W. A. Henderson and S. Passerini, Chem. Mater., 2004, 16, 2881–2885 CrossRef CAS.
- G. B. Appetecchi, M. Montanino, A. Balducci, S. F. Lux, M. Winterb and S. Passerini, J. Power Sources, 2009, 192, 599–605 CrossRef CAS PubMed.
- T. Froemling, M. Kunze, M. Schoenhoff, J. Sundermeyer and B. Roling, J. Phys. Chem. B, 2008, 112, 12985–12990 CrossRef CAS PubMed.
- T. Placke, S. Rothermel, O. Fromm, P. Meister, S. F. Lux, J. Huesker, H.-W. Meyer and M. Winter, J. Electrochem. Soc., 2013, 160, A1979–A1991 CrossRef CAS PubMed.
- A. Deshpande, L. Kariyawasam, P. Dutta and S. Banerjee, J. Phys. Chem. C, 2013, 117, 25343–25351 CAS.
- P. M. Bayley, G. H. Lane, N. M. Rocher, B. R. Clare, A. S. Best, D. R. MacFarlane and M. Forsyth, Phys. Chem. Chem. Phys., 2009, 11, 7202–7208 RSC.
- X. Zhang, N. Sukpirom and M. M. Lerner, Mater. Res. Bull., 1999, 34, 363–372 CrossRef CAS.
- B. Özmen-Monkul and M. M. Lerner, Carbon, 2010, 48, 3205–3210 CrossRef PubMed.
- S. Krueger, R. Kloepsch, J. Li, S. Nowak, S. Passerini and M. Winter, J. Electrochem. Soc., 2013, 160, A542–A548 CrossRef CAS PubMed.
- M. Winter, J. O. Besenhard, M. E. Spahr and P. Novak, Adv. Mater., 1998, 10, 725–763 CrossRef CAS.
- P. Meister, V. Siozios, J. Reiter, S. Klamor, S. Rothermel, O. Fromm, H.-W. Meyer, M. Winter and T. Placke, Electrochim. Acta, 2014, 130, 625–633 CrossRef CAS PubMed.
- A. J. Smith, J. C. Burns and J. R. Dahn, Electrochem. Solid-State Lett., 2010, 13, A177–A179 CrossRef CAS PubMed.
| This journal is © The Royal Society of Chemistry 2014 |