 Open Access Article
Creative Commons Attribution 3.0 Unported Licence
Bright, wind-driven white mechanoluminescence from zinc sulphide microparticles embedded in a polydimethylsiloxane elastomer†
Soon Moon
Jeong‡
*,
Seongkyu
Song‡
,
Kyung-Il
Joo
,
Joonwoo
Kim
,
Sung-Ho
Hwang
,
Jaewook
Jeong
and
Hyunmin
Kim
Nano & Bio Research Division, Daegu Gyeongbuk Institute of Science and Technology, 50-1 Sang-Ri, Hyeonpung-Myeon, Dalseong-Gun, Daegu 711-873, Republic of Korea. E-mail: smjeong@dgist.ac.kr
First published on 22nd July 2014
Abstract
A variety of mechanoluminescent (ML) materials have recently reinvigorated studies of luminescence activated by mechanical stress, but few practical applications have been demonstrated due to the destructive nature of the process. To overcome these shortcomings, elastico-mechanoluminescent (elastico-ML) materials, which generate luminescence under elastic deformation, have been suggested with a view to their use in practical devices. However, the weak brightness and limited white colour expression of these materials must be resolved before they can be employed in practical applications. Here, we report a wind-driven ML device that produces significant brightness and emits warm/neutral/cool white light over a range of colour temperatures from zinc sulphide (ZnS) microscopic particles embedded in a polydimethylsiloxane (PDMS) composite. Harnessing wind-activated mechanoluminescent devices in practical displays or lighting systems could pave the way to new environmentally friendly lights, which reduce energy waste and promote sustainability.
Broader contextMechanically driven light generation is an exciting and under-exploited phenomenon with a variety of possible practical applications. Mechanoluminescence (ML) has potential applications in colourful displays and white-light sources driven by vibrating mechanical actions. However, the related research has suffered from the difficulty in obtaining a strong, repeatable signal, so enhancing ML intensity has not been a major area of focus. Weak brightness and limited white colour expression of ML must be resolved with a view to its use in practical ML displays or ML light sources. Here we report a new wind-driven ML device that produces significant brightness and emits light over a range of tunable white colours. A patterned, colourful ML driven by wind was also demonstrated. Harnessing wind-driven ML in practical lighting systems could pave the way to new environmentally friendly lights based on wind motion, to cut down energy waste and promote sustainability. |
Introduction
Though Francis Bacon first reported the appearance of sparkling light while breaking sugar crystals in 1605, research into mechanoluminescent materials primarily dates from the last few decades.1 Most studies of mechanoluminescence (ML) or triboluminescence (TL) have been performed using quartz,2,3 sugar,4 rocks,5,6 alkali halides,7,8 and molecular crystals.9,10 Because the phenomenon is often weak and unrepeatable, ML was initially assumed to have no major applications, and enhancing ML intensity has not been a major area of focus. Intense, reliable ML could lead to practical applications for these materials, such as displays and light sources driven by naturally vibrating mechanical actions.To achieve intense, repeatable luminescence, elastico-ML materials are generally required. These materials generate luminescence during elastic deformation without fracture. Efficient elastico-ML materials have been developed11–16 and proposed for flexible crack sensors,13 ubiquitous light sources,14 and biological uses such as bioimaging15 and artificial skin.16 At present, the most commonly studied elastico-ML materials are rare-earth-ion-doped aluminates and silicates as well as zinc sulphide (ZnS).
Elastico-ML behaviour has been reported using irradiated alkali halide crystals and persistent luminescent crystals.1 These materials require repetitive pre-irradiation using an excitation source such as X-rays, γ-rays, or UV light to achieve reproducible luminescence under applied pressure.17–19 On the other hand, copper- or manganese-doped ZnS does not require pre-irradiation for repetitive luminescence.20,21 In particular, ZnS:Cu exhibited durable mechanoluminescence over 100![[thin space (1/6-em)]](https://www.rsc.org/images/entities/char_2009.gif) 000 times in mechanical stress applications without requiring additional treatment.20 The mechanism for the self-recovery of ML intensity without irradiation from an excitation light source is not well understood; however, it was recently proposed that this behaviour might be caused by the trapping of drifting charge carriers in the presence of a piezoelectric field.22,23 Thus, ML materials that do not require pre-treatment lend themselves more easily to practical ML applications.
000 times in mechanical stress applications without requiring additional treatment.20 The mechanism for the self-recovery of ML intensity without irradiation from an excitation light source is not well understood; however, it was recently proposed that this behaviour might be caused by the trapping of drifting charge carriers in the presence of a piezoelectric field.22,23 Thus, ML materials that do not require pre-treatment lend themselves more easily to practical ML applications.
Recently, PDMS-supported composite structures fabricated using various piezoelectric materials have been widely utilized as piezoelectric nanogenerators for energy harvesting applications.24–30 These PDMS composites are very attractive because of their ease of fabrication, mechanical robustness, and low cost. These characteristics are also applicable in the field of ML research because durable stress-transferring materials are promising candidates for producing high brightness ML. Moreover, PDMS is an efficient stress-transferring material due to its softness and its robust characteristics under repeated mechanical stress. Notably, intense ML can only be obtained with very durable materials because a high degree of vibration is needed to achieve large luminescence. The durability of PDMS, therefore, makes it promising for use in high-brightness devices.
Previously, we proposed a possible approach for durable20 and colour-tuneable ML21 using PDMS composites. The tuneable colour range was dependent on the vibrating conditions, and only a specific warm white luminescence could be realized using green and orange phosphors. However, various bright white ML has not yet been realized; this realization would thus enable the exploitation of ML in various applications.
However, one of the major drawbacks of PDMS-based ML composites is the poor emission of blue luminescence, which is the result of the softness of the composite. A composite film containing blue phosphors exhibits green rather than blue luminescence even when the composite is fully stretched because the compressive stress is insufficient to activate the blue emission. However, strong vibration conditions enable a blue shift in the green luminescence from ZnS:Cu + PDMS structures.20 Therefore, bright and durable blue emission will enable broad output colour control, including white ML through combinations with other colours. Hence, bright white ML could be possible with durable PDMS composites when strong vibrations are applied to the samples.
Here, we show bright white ML (with warm, neutral, or cool colour temperature) and deep blue ML using a gas flow system to simulate the effect of wind and to achieve the required vibrational conditions. We also consider that ML materials will have potential use in harvesting wind power for illumination and display systems by demonstrating an example of wind-driven patterned colourful ML composites. Because wind power is a sustainable and environmentally friendly energy source, the findings of this study could create a significant new field in energy harvesting.
Experimental
To develop bright, reproducible, visibly coloured ML, three independent ML materials, ZnS doped with Cu based phosphors (orange, GG13; blue, GG64; and green, GG45, purchased from Osram Sylvania Inc.), were uniformly distributed into a PDMS matrix. Note that the three ML materials used in this study exhibited approximately 20–30% brighter ML than those used in previous reports20,21 (ESI, Fig. S1†). For the optical characterisation of each composite, we used a stretching–releasing (S–R) system with optimised measurement conditions, as shown in Fig. S2 of the ESI.†We denote the composite structures with blue, green, and orange phosphors embedded in PDMS as B + PDMS, G + PDMS, and O + PDMS, respectively. The ML and electroluminescence (EL) spectra and their associated Commission Internationale de L'Eclairage (CIE) coordinates demonstrate the range of colour and brightness of our composites.
Material preparation
To fabricate the coloured ML samples, ML phosphor materials were mixed and embedded in PDMS (Wacker ELASTOSIL RT601) as a curing agent, at a weight ratio of 9![[thin space (1/6-em)]](https://www.rsc.org/images/entities/char_2009.gif) :
:![[thin space (1/6-em)]](https://www.rsc.org/images/entities/char_2009.gif) 1 (base/crosslinker ratio). The ML material
1 (base/crosslinker ratio). The ML material![[thin space (1/6-em)]](https://www.rsc.org/images/entities/char_2009.gif) :
:![[thin space (1/6-em)]](https://www.rsc.org/images/entities/char_2009.gif) PDMS weight ratio was maintained at 7
PDMS weight ratio was maintained at 7![[thin space (1/6-em)]](https://www.rsc.org/images/entities/char_2009.gif) :
:![[thin space (1/6-em)]](https://www.rsc.org/images/entities/char_2009.gif) 3. For the composition of the ML material, two phosphors were mixed at weight ratios (O
3. For the composition of the ML material, two phosphors were mixed at weight ratios (O![[thin space (1/6-em)]](https://www.rsc.org/images/entities/char_2009.gif) :
:![[thin space (1/6-em)]](https://www.rsc.org/images/entities/char_2009.gif) G or O
G or O![[thin space (1/6-em)]](https://www.rsc.org/images/entities/char_2009.gif) :
:![[thin space (1/6-em)]](https://www.rsc.org/images/entities/char_2009.gif) B) of 9
B) of 9![[thin space (1/6-em)]](https://www.rsc.org/images/entities/char_2009.gif) :
:![[thin space (1/6-em)]](https://www.rsc.org/images/entities/char_2009.gif) 1, 8
1, 8![[thin space (1/6-em)]](https://www.rsc.org/images/entities/char_2009.gif) :
:![[thin space (1/6-em)]](https://www.rsc.org/images/entities/char_2009.gif) 2, 7
2, 7![[thin space (1/6-em)]](https://www.rsc.org/images/entities/char_2009.gif) :
:![[thin space (1/6-em)]](https://www.rsc.org/images/entities/char_2009.gif) 3, 6
3, 6![[thin space (1/6-em)]](https://www.rsc.org/images/entities/char_2009.gif) :
:![[thin space (1/6-em)]](https://www.rsc.org/images/entities/char_2009.gif) 4 and 5
4 and 5![[thin space (1/6-em)]](https://www.rsc.org/images/entities/char_2009.gif) :
:![[thin space (1/6-em)]](https://www.rsc.org/images/entities/char_2009.gif) 5 in order to maintain the total weight of the ML material. Pure blue (B + PDMS), green (G + PDMS) and orange (O + PDMS) samples were also prepared as references.
5 in order to maintain the total weight of the ML material. Pure blue (B + PDMS), green (G + PDMS) and orange (O + PDMS) samples were also prepared as references.
Optical characterisation
The ML spectra, EL spectra, brightness, and CIE coordinates of the various ML composites were recorded using a spectroradiometer (PR-655, Photo Research Inc.), which was vertically aligned with the light-generating samples. The detection spot was 5.25 mm in diameter (MS-75 lens). To characterise the wind-driven ML, we used an additional supplementary lens (SL-1×) to reduce the detection spot diameter to 0.89 mm to match the small uniform ML light size (approximately 4 mm diameter). The ML images were captured using a digital camera (Canon EOS 70D).ACEL device fabrication and electrical characterisation
Prior to curing, the prepared phosphor/PDMS mixtures were sandwiched between pre-cleaned indium tin oxide (ITO) glass substrates (12 mm × 16 mm) with a sheet resistance of ∼20 Ω □−1. The samples were cured at 70 °C for 30 min. For the frequency-dependent spectra and brightness, a sinusoidal voltage of 170 V was applied (emitting area: 12 × 12 mm2).Fabrication of the patterned, wind-driven ML composite
The “ML” logo was patterned by injecting the ML paste into the holes of an aluminium (Al) mould. The Al mould consisted of 441 holes, each with a diameter of 1 mm and a depth of 3 mm. First, the Al mould was treated with a self-assembled monolayer (SAM) using a mixed solvent of toluene (95 wt%) and trichloro(octadecyl)silane (5 wt%). This pre-treatment facilitated the detachment of the patterned ML composites from the Al mould. To make the patterned green ML composite with a white ML background, green ML paste (G + PDMS) was injected into the holes comprising the “ML” logo using a syringe. After curing at 70 °C for 30 min in an air oven, the white ML paste (O + B + PDMS, O![[thin space (1/6-em)]](https://www.rsc.org/images/entities/char_2009.gif) :
:![[thin space (1/6-em)]](https://www.rsc.org/images/entities/char_2009.gif) B = 7
B = 7![[thin space (1/6-em)]](https://www.rsc.org/images/entities/char_2009.gif) :
:![[thin space (1/6-em)]](https://www.rsc.org/images/entities/char_2009.gif) 3) was injected into the remaining holes. The white paste was then poured over the mould surface to form a thick base plate. After drying, the patterned ML composite was easily delaminated from the SAM-treated Al mould. The other ML pattern was fabricated using the same procedure but by injecting only green (G + PDMS) ML paste into the patterned Al mould. The patterning process is illustrated in Fig. S3 and S4.†
3) was injected into the remaining holes. The white paste was then poured over the mould surface to form a thick base plate. After drying, the patterned ML composite was easily delaminated from the SAM-treated Al mould. The other ML pattern was fabricated using the same procedure but by injecting only green (G + PDMS) ML paste into the patterned Al mould. The patterning process is illustrated in Fig. S3 and S4.†
Results and discussion
Optical characteristics of the ML composites
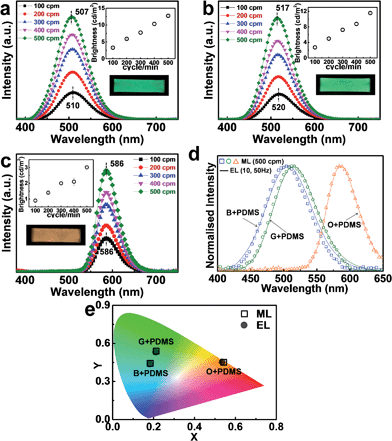
Fig. 1 shows the ML spectra obtained for each composite for S–R rates between 100 and 500 cycles per minute (cpm). The B + PDMS (Fig. 1a) and G + PDMS (Fig. 1b) composites showed a small blue spectral shift (∼3 nm) with an increasing S–R rate, whereas the O + PDMS (Fig. 1c) spectrum did not shift with the increase of S–R rate. This may result from the Mn activator in the ZnS:Cu, Mn particle, which gains energy from the excited Cu. Thus, the orange emission persists at all S–R rates.The ML brightness for all samples linearly increased with increasing S–R rate (upper insets of Fig. 1a–c) without requiring pre- or post-irradiation from an excitation light source. Photographs of the emission are also included in each figure in the lower insets. Note that the B + PDMS composite did not show blue ML due to insufficient mechanical energy or frequency to excite the blue energy level via the simple stretching system. Instead, the B + PDMS composite showed a peak wavelength at 507–510 nm, which was shifted by only 10 nm from that of the G + PDMS (∼517–520 nm), and the ML emission (photograph in the inset of Fig. 1a) was green rather than blue.
It is helpful to understand ML colour characteristics by comparing with the electroluminescent (EL) spectrum driven by a low frequency condition because simple stretching alone cannot produce highly vibrating conditions. To compare the EL and ML spectra, we fabricated alternate current electroluminescent (ACEL) devices with the same composition as each ML composite. As shown in Fig. 1d, for each phosphor composite, the ML at 500 cpm could be mimicked almost exactly using EL at 10 Hz for B + PDMS and G + PDMS or at 50 Hz for O + PDMS. This overlap implies that, in each phosphor, ML and EL were emitted from the same emission centre. We can utilize this information to predict ML using EL measurement prior to applying mechanical stress. The CIE coordinates also show similar values for both ML and EL at (0.18, 0.44), (0.21, 0.54) and (0.54, 0.45) for B+, G+, and O + PDMS, respectively (Fig. 1e). Note that each colour position denoted by the CIE coordinates coincides with the corresponding photographs shown in the lower insets of Fig. 1a–c.
Electrical characteristics of the ACEL samples
To verify that a range of colours could be produced, we also fabricated ACEL devices consisting of O + G + PDMS or O + B + PDMS with phosphor ratios ranging from 9 (orange)![[thin space (1/6-em)]](https://www.rsc.org/images/entities/char_2009.gif) :
:![[thin space (1/6-em)]](https://www.rsc.org/images/entities/char_2009.gif) 1 (green or blue) to an equal mix of 5
1 (green or blue) to an equal mix of 5![[thin space (1/6-em)]](https://www.rsc.org/images/entities/char_2009.gif) :
:![[thin space (1/6-em)]](https://www.rsc.org/images/entities/char_2009.gif) 5, while maintaining a constant overall phosphor volume. We then examined the spectral and colour variations in these composites at electrical frequencies of 50 Hz and 1 kHz (Fig. 2a–d) and at three intermediate frequencies (Fig. S5†). We found that the peak emission wavelengths of B + PDMS and G + PDMS were closely related to the electrical frequency. In particular, the spectral shift originating from B + PDMS and G + PDMS increased with increasing electrical frequency. However, the spectral shape of O + PDMS showed no relationship with the frequency (Fig. 2b and d, and S5†). To understand the peak shift dependence on the electrical frequency, we normalised the calculated intensity by the peak wavelength of O + PDMS (586 nm; Fig. S6 and S7†). We found that as the amount of blue or green phosphor increased, the normalised intensity also increased, indicating an increase in the intensity of blue light emitted versus orange light emitted. As a result, the highest peak positions of the green and blue spectra shifted down to 500 and 450 nm from 507 and 496 nm, respectively (Fig. 2a–d).
5, while maintaining a constant overall phosphor volume. We then examined the spectral and colour variations in these composites at electrical frequencies of 50 Hz and 1 kHz (Fig. 2a–d) and at three intermediate frequencies (Fig. S5†). We found that the peak emission wavelengths of B + PDMS and G + PDMS were closely related to the electrical frequency. In particular, the spectral shift originating from B + PDMS and G + PDMS increased with increasing electrical frequency. However, the spectral shape of O + PDMS showed no relationship with the frequency (Fig. 2b and d, and S5†). To understand the peak shift dependence on the electrical frequency, we normalised the calculated intensity by the peak wavelength of O + PDMS (586 nm; Fig. S6 and S7†). We found that as the amount of blue or green phosphor increased, the normalised intensity also increased, indicating an increase in the intensity of blue light emitted versus orange light emitted. As a result, the highest peak positions of the green and blue spectra shifted down to 500 and 450 nm from 507 and 496 nm, respectively (Fig. 2a–d).
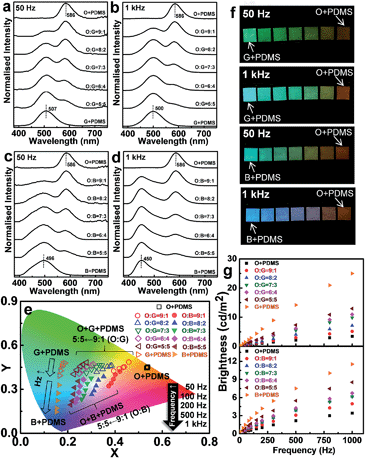 | ||
Fig. 2 Electrical characterization of the ACEL samples with different mixing ratios of O + G + PDMS and O + B + PDMS. The O![[thin space (1/6-em)]](https://www.rsc.org/images/entities/char_2009.gif) : :![[thin space (1/6-em)]](https://www.rsc.org/images/entities/char_2009.gif) G and O G and O![[thin space (1/6-em)]](https://www.rsc.org/images/entities/char_2009.gif) : :![[thin space (1/6-em)]](https://www.rsc.org/images/entities/char_2009.gif) B ratios varied from 10 B ratios varied from 10![[thin space (1/6-em)]](https://www.rsc.org/images/entities/char_2009.gif) : :![[thin space (1/6-em)]](https://www.rsc.org/images/entities/char_2009.gif) 0 (pure O + PDMS) to 9 0 (pure O + PDMS) to 9![[thin space (1/6-em)]](https://www.rsc.org/images/entities/char_2009.gif) : :![[thin space (1/6-em)]](https://www.rsc.org/images/entities/char_2009.gif) 1, 8 1, 8![[thin space (1/6-em)]](https://www.rsc.org/images/entities/char_2009.gif) : :![[thin space (1/6-em)]](https://www.rsc.org/images/entities/char_2009.gif) 2, 7 2, 7![[thin space (1/6-em)]](https://www.rsc.org/images/entities/char_2009.gif) : :![[thin space (1/6-em)]](https://www.rsc.org/images/entities/char_2009.gif) 3, 6 3, 6![[thin space (1/6-em)]](https://www.rsc.org/images/entities/char_2009.gif) : :![[thin space (1/6-em)]](https://www.rsc.org/images/entities/char_2009.gif) 4, 5 4, 5![[thin space (1/6-em)]](https://www.rsc.org/images/entities/char_2009.gif) : :![[thin space (1/6-em)]](https://www.rsc.org/images/entities/char_2009.gif) 5, and 0 5, and 0![[thin space (1/6-em)]](https://www.rsc.org/images/entities/char_2009.gif) : :![[thin space (1/6-em)]](https://www.rsc.org/images/entities/char_2009.gif) 10 (pure G+ or B + PDMS). (a–d) The EL spectra from the composites under the lowest (50 Hz) and highest (1 kHz) frequency conditions. Other frequency-induced EL results (100, 200, 500 Hz) are provided in Fig. S5, ESI.† (e) The CIE coordinate (x, y) values. (f) Photos of the EL for ACEL samples connected by conducting tape. (g) Brightness obtained from the ACEL samples. 10 (pure G+ or B + PDMS). (a–d) The EL spectra from the composites under the lowest (50 Hz) and highest (1 kHz) frequency conditions. Other frequency-induced EL results (100, 200, 500 Hz) are provided in Fig. S5, ESI.† (e) The CIE coordinate (x, y) values. (f) Photos of the EL for ACEL samples connected by conducting tape. (g) Brightness obtained from the ACEL samples. | ||
It should be noted that there is an interesting relationship between electrical frequency and the emission colour in ACEL samples. To understand this behaviour, we must first consider that two emission bands (blue and green) exist in phosphors such as ZnS:Cu.31,32 The green emission arises from the transition between the impurity-induced shallow donor state and the t2 state of Cu,33,34 whereas the blue emission is related to the e state.35,36 However, Xu et al. attributes the blue emission to the transition from the conduction band edge to the t2 state.31 Furthermore, Peng et al. believe that the blue emission is a result of the native defect state.33 So far, no uniform model exists, and the detailed mechanism regarding the main luminescent properties of ZnS:Cu is still controversial.
Second, we must consider the spectral shift in ACEL devices with increasing frequency. Some researchers experimentally investigated the blue enhancement at higher electrical frequencies.37,38 A tentative explanation of this behaviour is proposed based on the presence of two different phases of the EL materials, resulting in two emission sites.38 This explanation also must consider the emission mechanism described in ref. 31–36. Hence, based on these two considerations, the spectral shift is difficult to describe in detail at the current stage. However, the blue spectral shifts in the blue and green luminescence under high electrical-frequency conditions clearly increase the blue component of the emission, resulting in a blue colour shift.
To visualize the colour dependence on the electrical frequency, we also examined the CIE colour coordinates that represent the EL colours from the various O + G + PDMS and O + B + PDMS composites, as shown in Fig. 2e. Two behaviours can be observed. First, the colour varied according to the phosphor composition; this occurs because the CIE coordinates of the multi-component light are linear combinations of the individual coordinates. Second, the blue colour shift was associated with increasing electrical frequency due to the activation of the blue emission.
In the O + G + PDMS samples, the emitted colour shifted to blue as the weight ratio of green phosphors increased; however, no O + G + PDMS samples yielded CIE coordinates corresponding to white, even at the highest frequency (1 kHz). In contrast, the O + B + PDMS samples did undergo a colour shift to the white region in the chromaticity diagram. The colour shift phenomenon in the EL measurement can be useful for predicting white ML emission because the mechanical excitation does not exceed the 1 kHz electrical excitation. Fig. 2f shows the ACEL images from our samples with varying phosphor ratios at both 50 Hz and 1 kHz. As the ACEL frequency increased, the brightness increased (Fig. 2g). The mixed ACEL samples changed colour with increasing ACEL frequency, while only the O + PDMS sample remained unchanged. These results imply that various white colours are achievable with the O + B + PDMS composites if a stress activator can provide sufficiently fast vibration of the samples.
Optical and colour characteristics of the wind-driven ML
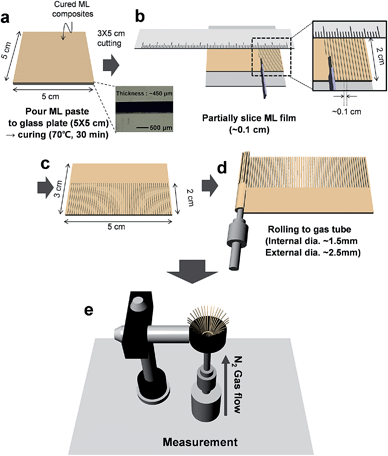
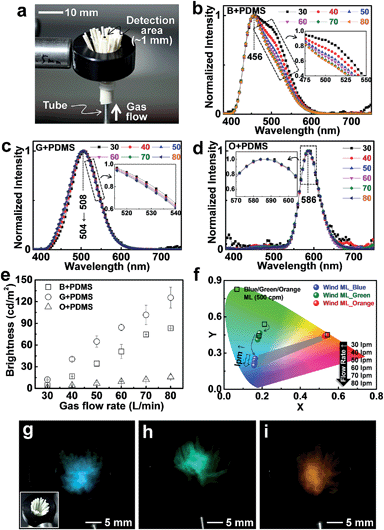
A system producing ML, which is driven by a renewable, natural phenomenon such as wind, could have a number of potential uses. To simulate natural wind, we used nitrogen gas flow over a partial incision of the ML film, which produced bright ML during gas flow. The samples for wind-driven ML were produced by partially slicing the ML composite films. The detailed fabrication process is shown in Fig. 3a–e. We did not quantify the gas flow-induced vibration, but we used the gas flow rate as a variable. In short, we used the concept that the increased gas flow produces higher vibration.Prior to evaluating white ML, we characterised the optical properties of the partially sliced B + PDMS, G + PDMS, and O + PDMS ML films (Fig. 4a). In the B + PDMS samples, a blue 456 nm peak was observed using a low gas flow rate (30 L min−1; Fig. 4b) in contrast to the S–R motion-induced ML results (Fig. 1a and S8†). The wavelength of this peak was comparable to that of the EL between 200 and 500 Hz (Fig. S7†). The green component gradually decreased with increasing gas flow rate (inset of Fig. 4b), and the blue ML generation was caused by the fast vibration of the partially sliced composites during the gas flow. In contrast, the spectra obtained from the G + PDMS and O + PDMS samples did not noticeably change shape as the gas flow increased (Fig. 4c and d). However, these samples did show different intensities under various gas flow rates (Fig. S9†), tending toward emissions with increased brightness at higher gas flow rates (Fig. 4e).
The brightness increased linearly with the increasing gas flow rate. This result is promising because it suggests that higher ML brightness can be obtained by simply applying stronger vibrations. From the B + PDMS, G + PDMS, and O + PDMS samples, the highest ML brightness values were 83.3 cd m−2, 125.5 cd m−2, and 15.8 cd m−2, respectively, at 80 L min−1, which was the experimental limit of our system. Fig. 4f shows the CIE coordinates obtained from the wind-driven B + PDMS, G + PDMS and O + PDMS ML composites with the corresponding S–R motion (500 cpm)-induced coordinates for comparison. Note that the O + PDMS colour was nearly unchanged, whereas the wind-driven results for B + PDMS and G + PDMS samples showed large blue shifts compared with the S–R results. By assuming that the CIE coordinates of the device ML are a linear combination of two primary colours, we can predict white ML emission in the grey region in the O + B + PDMS samples. Fig. 4g–i show photographs of the wind-driven blue, green, and orange ML, respectively, at 60 L min−1. The inset photograph (Fig. 4g) shows a static image from the same camera position used for the wind-driven ML photographs.
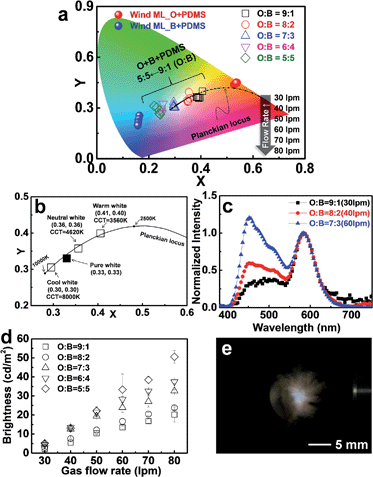
To demonstrate that we could achieve white ML using our wind-driven technique, we mixed the blue and orange phosphors into PDMS to make O + B + PDMS samples in the different weight ratios predicted by the grey region displayed in Fig. 4f. We observed a blue shift with increasing flow rate (Fig. 5a), which was caused by the decreasing green component, as shown in the normalised spectra (Fig. S9†). The location of blackbody radiation (Planckian locus) in the chromaticity diagram is also embedded. The typical blackbody temperature in the white region of the chromaticity diagram ranges from 2500 to 10![[thin space (1/6-em)]](https://www.rsc.org/images/entities/char_2009.gif) 000 K.39Fig. 5b shows the locations of several white ML points that are closest to the Planckian locus. Warm, neutral, and cool white ML were demonstrated in the 9
000 K.39Fig. 5b shows the locations of several white ML points that are closest to the Planckian locus. Warm, neutral, and cool white ML were demonstrated in the 9![[thin space (1/6-em)]](https://www.rsc.org/images/entities/char_2009.gif) :
:![[thin space (1/6-em)]](https://www.rsc.org/images/entities/char_2009.gif) 1, 8
1, 8![[thin space (1/6-em)]](https://www.rsc.org/images/entities/char_2009.gif) :
:![[thin space (1/6-em)]](https://www.rsc.org/images/entities/char_2009.gif) 2, and 7
2, and 7![[thin space (1/6-em)]](https://www.rsc.org/images/entities/char_2009.gif) :
:![[thin space (1/6-em)]](https://www.rsc.org/images/entities/char_2009.gif) 3 O
3 O![[thin space (1/6-em)]](https://www.rsc.org/images/entities/char_2009.gif) :
:![[thin space (1/6-em)]](https://www.rsc.org/images/entities/char_2009.gif) B weight ratio samples with the correlated colour temperature (CCT) of 3560, 4620, and 8000 K, respectively. Fig. 5c shows the representative warm, neutral, and cool white ML spectra normalised to the peak of O + PDMS emission (586 nm). The increased relatively blue component is suitable for tracing the Planckian locus. The brightness linearly increases with the gas flow rate (Fig. 5d), and a brighter ML can be obtained by increasing the blue phosphor weight. The mixed ML brightness is roughly equal to the sum of the B + PDMS and O + PDMS brightness divided by the weight ratio because the emission from one phosphor does not affect the absorption band of the other phosphor. Fig. 5e shows the photograph of cool white ML (O
B weight ratio samples with the correlated colour temperature (CCT) of 3560, 4620, and 8000 K, respectively. Fig. 5c shows the representative warm, neutral, and cool white ML spectra normalised to the peak of O + PDMS emission (586 nm). The increased relatively blue component is suitable for tracing the Planckian locus. The brightness linearly increases with the gas flow rate (Fig. 5d), and a brighter ML can be obtained by increasing the blue phosphor weight. The mixed ML brightness is roughly equal to the sum of the B + PDMS and O + PDMS brightness divided by the weight ratio because the emission from one phosphor does not affect the absorption band of the other phosphor. Fig. 5e shows the photograph of cool white ML (O![[thin space (1/6-em)]](https://www.rsc.org/images/entities/char_2009.gif) :
:![[thin space (1/6-em)]](https://www.rsc.org/images/entities/char_2009.gif) B = 7
B = 7![[thin space (1/6-em)]](https://www.rsc.org/images/entities/char_2009.gif) :
:![[thin space (1/6-em)]](https://www.rsc.org/images/entities/char_2009.gif) 3, 60 L min−1) with a CCT of 8000 K.
3, 60 L min−1) with a CCT of 8000 K.
To intuitively understand the strength of the wind in these experiments, we roughly calculated the wind speed (m s−1) by noting that ML light is primarily observed at the upper edge of the ring-type optical unit. The diameter of uniform ML emitting area is 4 mm, approximately (Fig. 5e). Therefore, the wind speed is approximately 40–100 m s−1 under the 30–80 L min−1 conditions. Note that this wind speed range belongs to the hurricane or typhoon which has a value greater than 30 m s−1 even under lowest experimental gas flow conditions (30 L min−1). Our future goal is to achieve bright ML under gentle breezes (a few meters per second).
Patterned, wind-driven ML characteristics
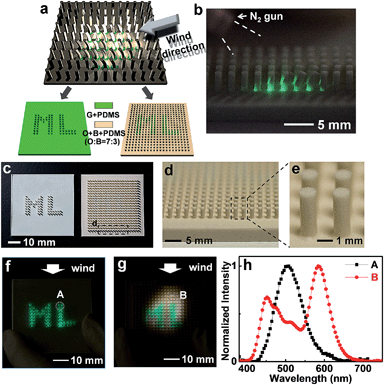
Using our findings, we designed and built a device that utilizes the wind to generate ML in small, vibrating rods (Fig. 6a). When the wind flows over a specific region, the rods in that region emit ML due to the application of stress primarily to the connecting region between the rod and the base plate. Brighter ML was observed near the rod-plate joint because the stress is primarily concentrated at the point where the rod bends (Fig. 6b).We also fabricated two types of wind-driven patterned sheets with the logo “ML” (Fig. 6a). In Fig. 6, we used false colour (green and white) to improve the visibility; however, the photographs show a milky colour under normal laboratory lighting (Fig. 6c). The fabrication methods for each patterned sample are outlined in Fig. S3 and S4.† The magnified photographs of the wind-driven patterned ML samples are given in Fig. 6d and e. Fig. 6f and g show photographs of the ML-emitting features from two types of wind-driven patterned MLs. The “ML” logo emits green light due to the patterned vibrating rods, either with (Fig. 6g) or without (Fig. 6f) a white ML background. The corresponding spectra, indicated by A and B, respectively, are shown in Fig. 6h. The normal green and neutral white ML spectra (CCT = 4460 K) with CIE coordinates of (0.36, 0.34) are observed in spots A and B, respectively. The patterned white ML shows a slightly different relative blue intensity when compared with the wind-driven ML (Fig. 5c). This difference could be a result of changes in the wind injection method because wind flow through a narrow gas tube with an inner diameter of ∼1.5 mm (Fig. 3d) should generate stronger vibrations.
Challenges in realizing a natural wind-driven ML system
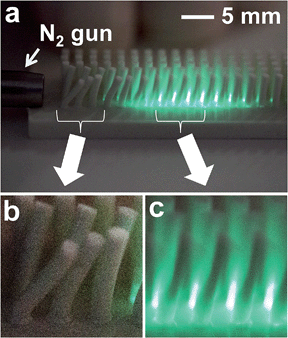
To realize a natural wind-driven ML display or lighting system as a final application in this work, there are several challenges that need to be overcome. First, natural wind flow does not have a harmonic frequency. Note, however, that the rods emit ML only when vibrated with some frequency conditions as shown in S–R and EL tests (Fig. 1 and 2, respectively). To verify the ML generation even under continuous N2 flow, we injected gas to the patterned wind-driven sample. We used longer rods (5 mm) to enhance the visibility of the wind effect. Fig. 7a shows a photograph of the ML from the vibrating rods under continuous N2 flow. Note that distant rods emit rather bright ML, whereas the rods nearest to the gas gun do not. This occurs because nearest rods are not vibrated even under a rather strong wind force (Fig. 7b). On the other hand, even with a 0.1 s camera shutter speed, Fig. 7c shows a rather blurred image due to the fast vibration of the rods. We can explain this phenomenon as follows. First, the nearest rods experience a strong directional wind force because the spread of the gas is small at a small distance from the gas tube. As the distance increases, however, the wind direction becomes irregular due to the interaction between the rapidly spreading gas and the aligned rods. In general, we find that there is an equilibrium state between the wind and the restoring force of the rods (Fig. 7b). The ML emission was observed only twice by visual inspection, namely, when the gas was injected and stopped. On the other hand, we can expect that it is difficult to produce an equilibrium force state between the irregularly distributed wind and the restoring force of the rods as the distance increases. This can produce the fast vibration of rods as shown in Fig. 7c. However, if we apply natural wind, the wind direction must be complex. For natural wind harvesting, the structure must be optimized so that the rods will vibrate even under omnidirectional wind flow.Another challenge is that the current ML samples have a rather large resolution compared with commercially available high-resolution displays. For wind-driven ML samples, we used a simple imprinting technique as depicted in Fig. S3 and S4.† The diameter of the rods is 1 mm (1 pixel can be considered as 1 rod). Simply, it would be very promising if it is possible to demonstrate patterned ML samples with 100 ppi (pixel per inch) pixel density which has been used in commercially available displays (note that the current pixel density of the ML sample is only 12.7 ppi).
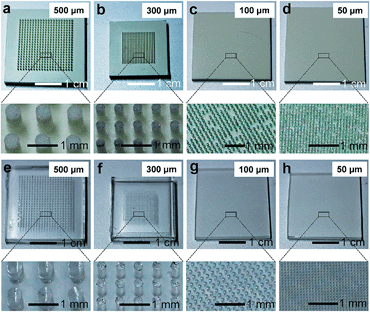
For the higher resolution, we experimentally checked the limit of resolution when we used a simple imprint technique. We made imprint moulds containing the holes with diameters of 500 μm, 300 μm, 100 μm and 50 μm, respectively. The distance between each hole is the same as its diameter and the aspect ratio (depth/diameter) is maintained to be 3. The calculated pixel densities are 25.4, 42.4, 127 and 254 ppi, respectively. Fig. 8a–d show photographs of patterned ML composites obtained from imprint moulds. Uniformly distributed rods are obtained from 500 μm and 300 μm sized holes (Fig. 8a and b) whereas defective regions are observed in small pattern sized holes as shown in Fig. 8c and d. The generation of these defects in 100 μm and 50 μm pattern sizes can be explained that the small rods are easily torn from the base plate when they are delaminated from the mould by friction between rods and mould surface. This problem can be improved by SAM treatment making a hydrophobic surface of the holes; however, the rods would be torn out if the diameter of the rods decreases to that of thin fibres. Moreover weak binding of phosphors due to the small fraction of PDMS (30 wt%) can be another reason for the defective patterned structure. We also fabricated the PDMS-only (without phosphors) patterned structure as shown in Fig. 8e–h. Uniformly distributed rods are observed even in small pattern size. These results imply that the fraction of phosphors must be decreased to make small thin fibres because more PDMS can make stronger binding of phosphor powders against friction from moulds during delamination.
This problem can be resolved by employing nano-sized ML phosphors. Because nano-size can allow larger contact area with PDMS even at a low fraction of phosphors, the strong ML intensity from uniformly patterned ML composites is possible. This challenge will be part of our future work. However, at the current stage of development, our wind-driven ML structure could be potentially used in a large-scale outdoor ML billboard with large pixels.
The most important and serious challenge is the weak brightness compared to commercially available lighting. Currently, we believe that the ML device could be applied as a surface light source such as organic light-emitting diode (OLED) lighting. Our ML device would not be a useful point source, because point sources require very high illumination intensity. To utilize ML as a surface light source, the required brightness is about 1000 cd m−2. However, this value can only be obtained from very highly vibrating ML films under the 1100–1200 L min−1 gas flow condition, which is calculated by linear fitting (O![[thin space (1/6-em)]](https://www.rsc.org/images/entities/char_2009.gif) :
:![[thin space (1/6-em)]](https://www.rsc.org/images/entities/char_2009.gif) B = 5
B = 5![[thin space (1/6-em)]](https://www.rsc.org/images/entities/char_2009.gif) :
:![[thin space (1/6-em)]](https://www.rsc.org/images/entities/char_2009.gif) 5 composition in Fig. 5d). This is an extremely harsh condition both experimentally and naturally. Hence, we should consider a highly efficient ML system emitting bright ML stimulated even at small stress or strain, if we assume that efficiency is defined as the “ML intensity” divided by the “strength of stimuli.” The strength of the stimuli term is related to the intrinsic properties (including electrical or shape characteristics) of the phosphor, whereas the ML intensity is related to the light extraction technology.
5 composition in Fig. 5d). This is an extremely harsh condition both experimentally and naturally. Hence, we should consider a highly efficient ML system emitting bright ML stimulated even at small stress or strain, if we assume that efficiency is defined as the “ML intensity” divided by the “strength of stimuli.” The strength of the stimuli term is related to the intrinsic properties (including electrical or shape characteristics) of the phosphor, whereas the ML intensity is related to the light extraction technology.
Conclusions
In conclusion, we demonstrated bright, wind-driven ML from ZnS-microparticles embedded in a PDMS elastomer. Regulating the wind (gas) flow rate enabled a linear increase in brightness, which is promising for applications and devices requiring bright ML materials. We also demonstrate a variety of colour temperatures of the wind-driven white ML, namely, warm, neutral, and cool white, which were very close to the Planckian locus. A patterned, colourful ML driven by wind was also demonstrated, paving the way toward environmentally friendly ML displays or white light sources.We have previously focused on improving qualities such as duration, brightness, and colour of light generated by ML. During these studies, we found that the brightness enhancement (between different models) is similar for both the ML and EL experiments (20–30%). Moreover, the tendency for colour shift under different vibration (or stretching) conditions also follows the EL data. Recently, we found some studies concerning piezoelectrically induced EL models.40–42 These studies show a similar composition-dependence relationship between ML and EL.40 This similar behaviour suggests a hint for deeper investigation of ML origin. Thus, several on-going projects critically include an elucidation on the physics of the ML in our system using Raman-based spectro/microscopy as well as interferometric measurements using a coherent-pulse generating optical cavity system around the wind-driven light source. We strongly believe that these studies are very helpful for developing the ML research field.
Acknowledgements
This work was partly supported by a Mid-career Research Program (NRF-2014R1A2A2A01003133) through the National Research Foundation of Korea (NRF) grant funded by the Korea government (MSIP) and by a basic research program (14-NB-04) through DGIST funded by the MSIP.Notes and references
- B. P. Chandra, in Luminescence of Solids, ed. D. R. Vij, Plenum, New York, United States of America, 1998, ch. 10 Search PubMed.
- G. T. Reynolds, J. Lumin., 1997, 75, 295 CrossRef CAS.
- G. N. Chapman and A. J. Walton, J. Appl. Phys., 1983, 54, 5961 CrossRef CAS PubMed.
- A. J. Walton, Adv. Phys., 1977, 26, 887 CrossRef CAS.
- B. T. Brady and G. A. Rowell, Nature, 1986, 321, 488 CrossRef.
- Y. Enomoto and H. Hashimoto, Nature, 1990, 346, 641 CrossRef CAS.
- N. A. Atari, Phys. Lett. A, 1982, 90, 93 CrossRef.
- B. P. Chandra, A. K. Bagri and B. P. Chandra, J. Lumin., 2010, 130, 309 CrossRef CAS PubMed.
- L. M. Sweeting, M. L. Cashel and M. M. Rosenblatt, J. Lumin., 1992, 52, 281 CrossRef CAS.
- B. P. Chandra and J. I. Zink, J. Chem. Phys., 1980, 7, 5933 CrossRef PubMed.
- C.-N. Xu, T. Watanabe, M. Akiyama and X. G. Zheng, Appl. Phys. Lett., 1999, 74, 2414 CrossRef CAS PubMed.
- C.-N. Xu, X.-G. Zheng, M. Akiyama, K. Nonaka and T. Watanabe, Appl. Phys. Lett., 2000, 76, 179 CrossRef CAS PubMed.
- N. Terasaki and C.-N. Xu, IEEE Sens. J., 2013, 13, 3999 CrossRef.
- N. Terasaki, H. Yamada and C.-N. Xu, Catal. Today, 2013, 201, 203 CrossRef CAS PubMed.
- N. Terasaki, H. Zhang, H. Yamada and C.-N. Xu, Chem. Commun., 2011, 47, 8034 RSC.
- C.-N. Xu, T. Watanabe, M. Akiyama and X. G. Zheng, Appl. Phys. Lett., 1999, 75, 1236 CrossRef PubMed.
- M. Akiyama, C.-N. Xu, H. Matsui, K. Nonaka and T. Watanabe, Appl. Phys. Lett., 1999, 75, 2548 CrossRef CAS PubMed.
- M. Akiyama, C.-N. Xu, K. Nonaka and T. Watanabe, Appl. Phys. Lett., 1990, 73, 3046 CrossRef PubMed.
- M. Akiyama, C.-N. Xu, Y. Liu, K. Nonaka and T. Watanabe, J. Lumin., 2002, 97, 13 CrossRef CAS.
- S. M. Jeong, S. Song, S.-K. Lee and B. Choi, Appl. Phys. Lett., 2013, 102, 051110 CrossRef PubMed.
- S. M. Jeong, S. Song, S.-K. Lee and N. Y. Ha, Adv. Mater., 2013, 25, 6194 CrossRef CAS PubMed.
- V. K. Chandra, B. P. Chandra and P. Jha, Appl. Phys. Lett., 2013, 103, 161113 CrossRef PubMed.
- B. P. Chandra, V. K. Chandra and P. Jha, Appl. Phys. Lett., 2014, 104, 031102 CrossRef PubMed.
- K.-I. Park, M. Lee, Y. Liu, S. Moon, G.-T. Hwang, G. Zhu, J. E. Kim, S. O. Kim, D. K. Kim, Z. L. Wang and K. J. Lee, Adv. Mater., 2012, 24, 2999 CrossRef CAS PubMed.
- K.-I. Park, C. K. Jeong, J. Ryu, G.-T. Hwang and K. J. Lee, Adv. Energy Mater., 2013, 3, 1539 CrossRef CAS PubMed.
- K. Y. Lee, D. Kim, J.-H. Lee, T. Y. Kim, M. K. Gupta and S. W. Kim, Adv. Funct. Mater., 2014, 24, 37 CrossRef CAS PubMed.
- H. Sun, H. Tian, Y. Yang, D. Xie, Y.-C. Zhang, X. Liu, S. Ma, H.-M. Zhao and T.-L. Ren, Nanoscale, 2013, 5, 6117 RSC.
- S. Xu, Y.-W. Yeh, G. Poirier, M. C. McAlpine, R. A. Register and N. Yao, Nano Lett., 2013, 13, 2393 CrossRef CAS PubMed.
- Z.-H. Lin, Y. Yang, J. M. Wu, Y. Liu, F. Zhang and Z. L. Wang, J. Phys. Chem. Lett., 2012, 3, 3599 CAS.
- J. H. Jung, M. Lee, J.-I. Hong, Y. Ding, C.-Y. Chen, L.-J. Chou and Z. L. Wang, ACS Nano, 2011, 5, 10041 CrossRef CAS PubMed.
- S. J. Xu, S. J. Chua, B. Liu, L. M. Gan, C. H. Chew and G. Q. Xu, Appl. Phys. Lett., 1998, 73, 478 CrossRef CAS PubMed.
- S. Lee, D. Song, D. Kim, J. Lee, S. Kim, I. Y. Park and Y. D. Choi, Mater. Lett., 2004, 58, 342 CrossRef CAS.
- W. Q. Peng, G. W. Cong, S. C. Qu and Z. G. Wang, Opt. Mater., 2006, 29, 313 CrossRef CAS PubMed.
- C. Corrado, J. K. Cooper and J. Z. Zhang, Sci. Adv. Mater., 2012, 4, 254 CrossRef CAS PubMed.
- P. Peka and H.-J. Schulz, Phys. Rev. B: Condens. Matter Mater. Phys., 1994, 193, 57 CAS.
- P. Peka and H.-J. Schulz, Solid State Commun., 1994, 89, 225 CrossRef CAS.
- S. M. Pillai and C. P. G. Vallabhan, Solid State Commun., 1983, 47, 909 CrossRef CAS.
- B. Allieri, S. Peruzzi, L. Antonini, A. Speghini, M. Bettinelli, D. Consolini, G. Dotti and L. E. Depero, J. Alloys Compd., 2002, 341, 79 CrossRef CAS.
- E. F. Schubert, in Light-Emitting Diodes, ed. E. F. Schubert, Cambridge Univ. Press, Cambridge, UK, 2nd edn, 2006, ch. 19 Search PubMed.
- J.-C. Zhang, X. Wang, X. Yao, C.-N. Xu and H. Yamada, J. Electrochem. Soc., 2010, 157, G269 CrossRef CAS PubMed.
- H. Zhang, C.-N. Xu, N. Terasaki and H. Yamada, Electrochem. Solid-State Lett., 2011, 14, J76 CrossRef CAS PubMed.
- Y. Liu and C.-N. Xu, Appl. Phys. Lett., 2004, 84, 5016 CrossRef CAS PubMed.
Footnotes |
| † Electronic supplementary information (ESI) available. See DOI: 10.1039/c4ee01776e |
| ‡ These authors contributed equally to this work. |
| This journal is © The Royal Society of Chemistry 2014 |

