Mechanism investigation and suppression of self-discharge in active electrolyte enhanced supercapacitors†
Received
1st January 2014
, Accepted 18th February 2014
First published on 24th February 2014
Abstract
The self-discharge (SDC) process of active electrolyte enhanced supercapacitors (AEESCs) was investigated systematically. The AEESC with hydroquinone as an active electrolyte showed higher specific capacitance but much faster SDC compared with electronic double layer supercapacitors. The electrode process of the above AEESC was studied, and the mechanism of the SDC process was investigated quantitatively. The migration of the active electrolyte between two electrodes of the device was found to be the primary reason for the fast SDC. Two strategies were designed to suppress the migration of the active electrolyte. Following these strategies, two new AEESCs were fabricated, with a Nafion® membrane as the separator and CuSO4 as the active electrolyte. The two AEESCs showed both high specific capacitances and longer SDC times, demonstrating that the problem of poor energy retention of AEESCs was successfully solved.
Broader context
Active electrolyte enhanced supercapacitors (AEESCs) have distinguished themselves as promising devices for electric energy storage due to their high specific capacitance and easy fabrication processes. In AEESCs the redox active species, which provide large pseudocapacitance, are dissolved in an electrolyte rather than being deposited on the electrodes. However, the effects of the active electrolyte on the self-discharging (SDC) process of AEESCs have long been neglected. The rate of SDC is the index of the energy retention of a power storage device, and supercapacitors with fast SDC processes are of little practical use due to the quick loss of stored energy. In this paper, the SDC process of AEESCs was investigated systematically. We found that the migration of the active electrolyte between two electrodes of the device strongly accelerated the SDC process. In order to suppress the fast SDC of AEESCs, two strategies were devised to stop the migration of the active electrolyte. We demonstrated that by using an ion exchange membrane as the separator or CuSO4 as the active electrolyte, the fast SDC process can be successfully suppressed. These results will shed light on the future design of AEESCs with high capacitance and superior energy retention.
|
Introduction
Recent years have witnessed the rapid development of electrochemical supercapacitors.1–3 Compared with batteries, which store energy throughout the bulk of the electrode material, supercapacitors store charges on the surface of their electrodes (with electric double layer, EDL) and thus are able to provide much higher power density (103 to 105 W kg−1).4 Also supercapacitors have longer cycle lives than batteries. These properties make supercapacitors suitable power sources for the applications which demand high charging–discharging currents, such as in electric vehicles. Supercapacitors based on the EDL (EDLSCs) suffer from low energy density (<10 W h kg−1); thus considerable efforts have been devoted to increase their energy density without sacrificing their power density. The energy density of a supercapacitor is decided by both the specific capacitance and the operation voltage, but for EDLSCs based on carbon materials with an aqueous electrolyte, the operation voltage is limited to ∼1 V by the electrochemical window of water, thus most studies are focused on how to increase the specific capacitance. An efficient way to improve the specific capacitance is to incorporate redox active materials into capacitors, which can store additional energy by electrochemical reactions.5–8 The redox active materials, such as metal oxide/hydroxides5 and conducting polymers,7 are usually coated onto inert carbon electrodes to provide additional capacitance (pseudocapacitance) in a battery-like manner. The asymmetric device structure after incorporation of redox active materials can also increase the operation voltage of the device. With these redox active materials, the specific capacitances of electrodes were promoted to over 1000 F g−1,9,10 corresponding to an energy density of >50 W h kg−1 and a power density of ∼103 W kg−1.
Recently, several groups reported another type of supercapacitor, the so-called active electrolyte enhanced supercapacitor (AEESC). In AEESCs the redox active species, which provide large pseudocapacitance, are dissolved in the electrolyte rather than coated on the electrodes. For example, Roldán et al. added hydroquinone (HQ) in the H2SO4 electrolyte of supercapacitors with activated carbon or carbon nanotubes as electrodes.11 The specific capacitance of the electrode was increased from ∼320 F g−1 in H2SO4 to 901 F g−1 in the HQ/H2SO4 redox active electrolyte. During the charging process HQ was oxidized into p-benzoquinone (BQ) near the positive electrode,12 and when the device was discharged BQ was reduced back to HQ. Similarly, ferricyanide (Fe(CN)64−), iodide (I−), methylene blue and p-phenylenediamine were also employed as redox active electrolytes, significantly enhancing the performance of the supercapacitors.13–17 Compared with solid redox active materials, active electrolytes are much easier to process and are compatible with the present fabrication technology of commercial supercapacitors. Therefore, the AEESC is considered as a promising type of supercapacitor.
However, the previous investigation mainly focused on how to improve the specific capacitance by inducing an active electrolyte, but neglected the effects of the active electrolyte on the self-discharge (SDC) process of the supercapacitors.18 The rate of SDC is the index of the energy retention of a power storage device, and supercapacitors with high SDC rates are of little practical use due to the quick loss of stored energy. Unfortunately, most researchers did not report the SDC rate of their AEESCs, and from the limited examples it was found that the SDC of AEESCs was faster compared with that of EDLSCs.18 If a high SDC rate is the intrinsic property of AEESCs, neglecting it will lead to overrating the practicability of AEESCs. Although the SDC process of EDLSCs has been investigated both in theory and experiment,19,20 the conclusions of these investigations help us little to understand the SDC of AEESCs, because the working mechanism of the two types of supercapacitor are distinct. Therefore, in order to fully evaluate the performance of AEESCs, it is necessary to conduct a comprehensive research on their SDC process. In this paper, by taking the HQ enhanced supercapacitor as an example, we systematically investigated the SDC process of AEESCs. It was found that the AEESC with HQ/H2SO4 as the electrolyte showed a much faster SDC process compared with the EDLSC with pure H2SO4 as the electrolyte. The electrode process on individual electrodes of AEESCs was analyzed and the mechanism of the SDC process was investigated quantitatively. The migration of the active electrolyte between two electrodes was believed to cause the SDC of AEESCs. In order to inhabit the migration of the active electrolyte, two different strategies were designed: using an ion-exchange membrane as the separator or choosing a special active electrolyte which is reversibly convertible into insoluble species during charge–discharge cycles. Following the above strategies, the Nafion® membrane was tested as the separator in the AEESC containing HQ, and a novel AEESC with CuSO4 as the active electrolyte was fabricated. It was found that both devices showed improved specific capacitances compared with the corresponding EDLSCs, and much slower SDC processes than conventional AEESCs.
Experimental
Materials
Natural graphite powders were bought from Qingdao Huatai lubricant sealing S&T Co. Ltd. Graphene oxide (GO) was prepared with a modified Hummers method according to the literature.21,22 H2SO4 (98%), hydrazine monohydrate (80%), hydroquinone (AR) and copper sulfate (AR) were purchased from Sinopharm Chemical Reagent Co., Ltd. Nafion® 117 membrane was the product of DuPont.
Preparation of the graphene hydrogel
The graphene hydrogel (GHG) was prepared by reducing GO hydrothermally followed by treating with hydrazine.23,24 Briefly, 10 mL GO aqueous dispersion (2 mg mL−1) was sealed in a Teflon-lined autoclave and maintained at 180 °C for 12 h. After the autoclave was cooled to room temperature, the black GHG block in the autoclave was taken out, immersed into an aqueous solution of hydrazine monohydrate (50%), and treated at 95 °C for 8 h. Finally, the resulting GHG was purified by dialysis overnight in ultrapure water.
Fabrication of the supercapacitors
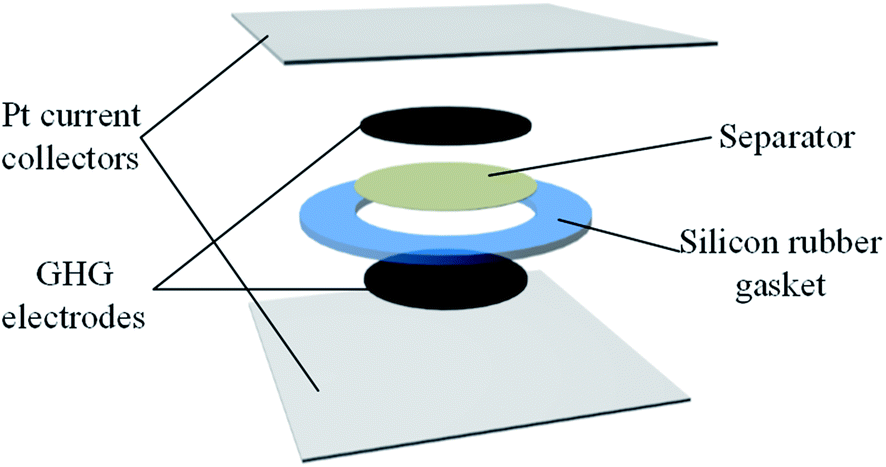
The structure of the supercapacitor devices is illustrated in Fig. 1. Platinum foil was used as the current collector, and a silicon rubber gasket with a thickness of 1 mm and an inner diameter of 12 mm was used to seal the device. GHG cylinders were employed as electrodes. The as-prepared GHG was immersed into the electrolyte overnight to exchange their interior water with the electrolyte and cut into small cylindrical pieces (with a thickness of ∼1 cm and a diameter of ∼0.8 cm). The GHG cylinders were compressed into thick discs under 600 kPa. Two of these GHG discs, together with platinum foils and a piece of separator were assembled into a layered structure, as shown in Fig. 1, and sandwiched between two glass slides which were held together by a clamp. Four types of devices were fabricated, whose electrolytes are 1 M H2SO4 (Device 1), 0.4 M HQ + 1 M H2SO4 (Device 2 and Device 3), 0.4 M CuSO4 + 1 M H2SO4 (Device 4), respectively. For Device 3, the separator was the Nafion® 117 membrane, while for the other three devices the separators were porous cellulose acetate membranes (pore size: 0.2 μm).
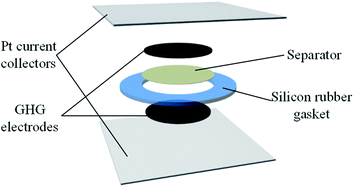 |
| | Fig. 1 Structure of the supercapacitors used in this paper. | |
To conduct three-electrode measurements, the above device was immersed into an electrochemical cell filled with the same electrolyte as used in the device. Two channels were cut on the silicon rubber gasket, to ensure the connectivity of the electrolyte in the device and the cell. The two electrodes of the device were used as the working and counter electrodes, respectively, and a saturated calomel electrode (SCE) was used as the reference electrode.
Characterization
The structure of GHG was characterized using a Hitachi TM3000 scanning electron microscope. All the electrochemical measurements were performed on a CHI 660D electrochemical workstation. Before testing the device was activated by cyclic voltammetry cycling from 0 V to the work voltage of each device for 50 cycles.25 The specific capacitance of the device was calculated from galvanostatic charge–discharge (GCD) curves according to the following equations:| |  | (1) |
| |  | (2) |
where J is the mass current density, I is the current applied on the device, t is the discharge time, m is the total mass of two electrodes, V is the highest voltage in the GCD curves, and IR represents the voltage drop at the beginning of the discharge process, caused by the internal resistance of the device. The specific capacitance of the single electrode was calculated from the GCD curves measured in the three-electrode system:| | 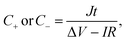 | (3) |
| |  | (4) |
where m is the mass of the single electrode and ΔV is the potential change of the electrode during the discharge process; I, t and IR have the same definitions as in eqn (1) and (2).
Results and discussion
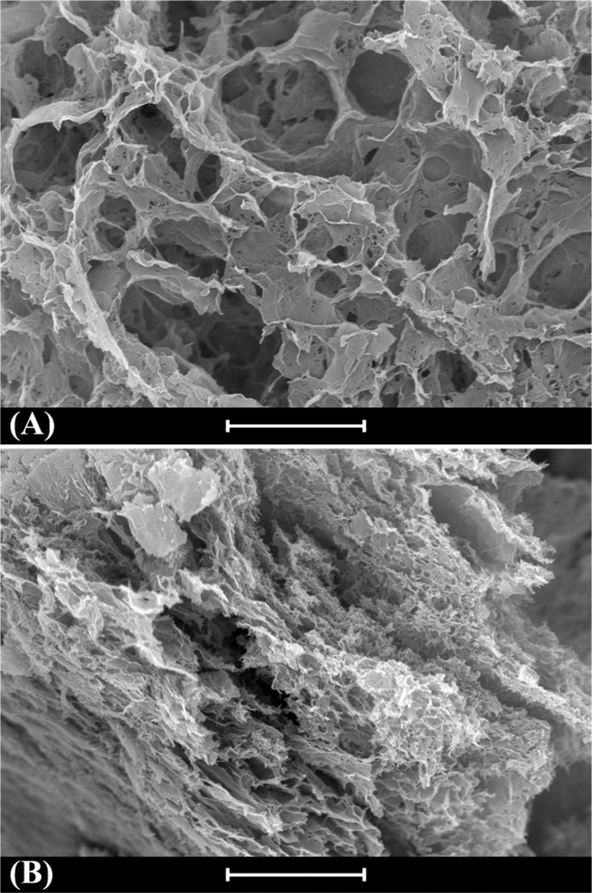
In this paper graphene was chosen as the electrode material because it can provide high specific capacitance. Graphene electrodes in an aqueous electrolyte were reported to have a specific capacitance of 160 F g−1 at a high current density of 100 A g−1.23 And in an organic electrolyte, a KOH activated graphene material showed a high energy density of 70 W h kg−1 and a very large power density of 2.5 × 10⁵ W kg−1 at a current density of 5.7 A g−1, owing to the high working voltage (3.5 V).26 Some of these performances are much higher than those of commercial carbon supercapacitors. The GHG used as an electrode material was synthesized via self-assembly of chemically converted graphene (CCG) sheets during hydrothermal reduction of graphene oxide (GO).27,28 As depicted in Fig. 2A, the as-prepared GHG shows a highly porous three-dimensional (3D) network composed of two-dimensional (2D) CCG sheets. The size of pores in GHG is in the range of several to tens of micrometers. During the assembly of supercapacitor devices, GHG was compressed to ∼15% of its original volume, and consequently the pore size decreased obviously, as shown in Fig. 2B. In spite of this, the pores in the GHG electrode are still large enough for the diffusion of the electrolyte.29 The thickness of the GHG disc in the device was ∼440 μm, and the mass density of the single electrode was 2.6–3.5 mg cm−2.
 |
| | Fig. 2 SEM images of the GHG. (A) As-prepared GHG; (B) compressed GHG electrode. Scale bar: 20 μm. | |
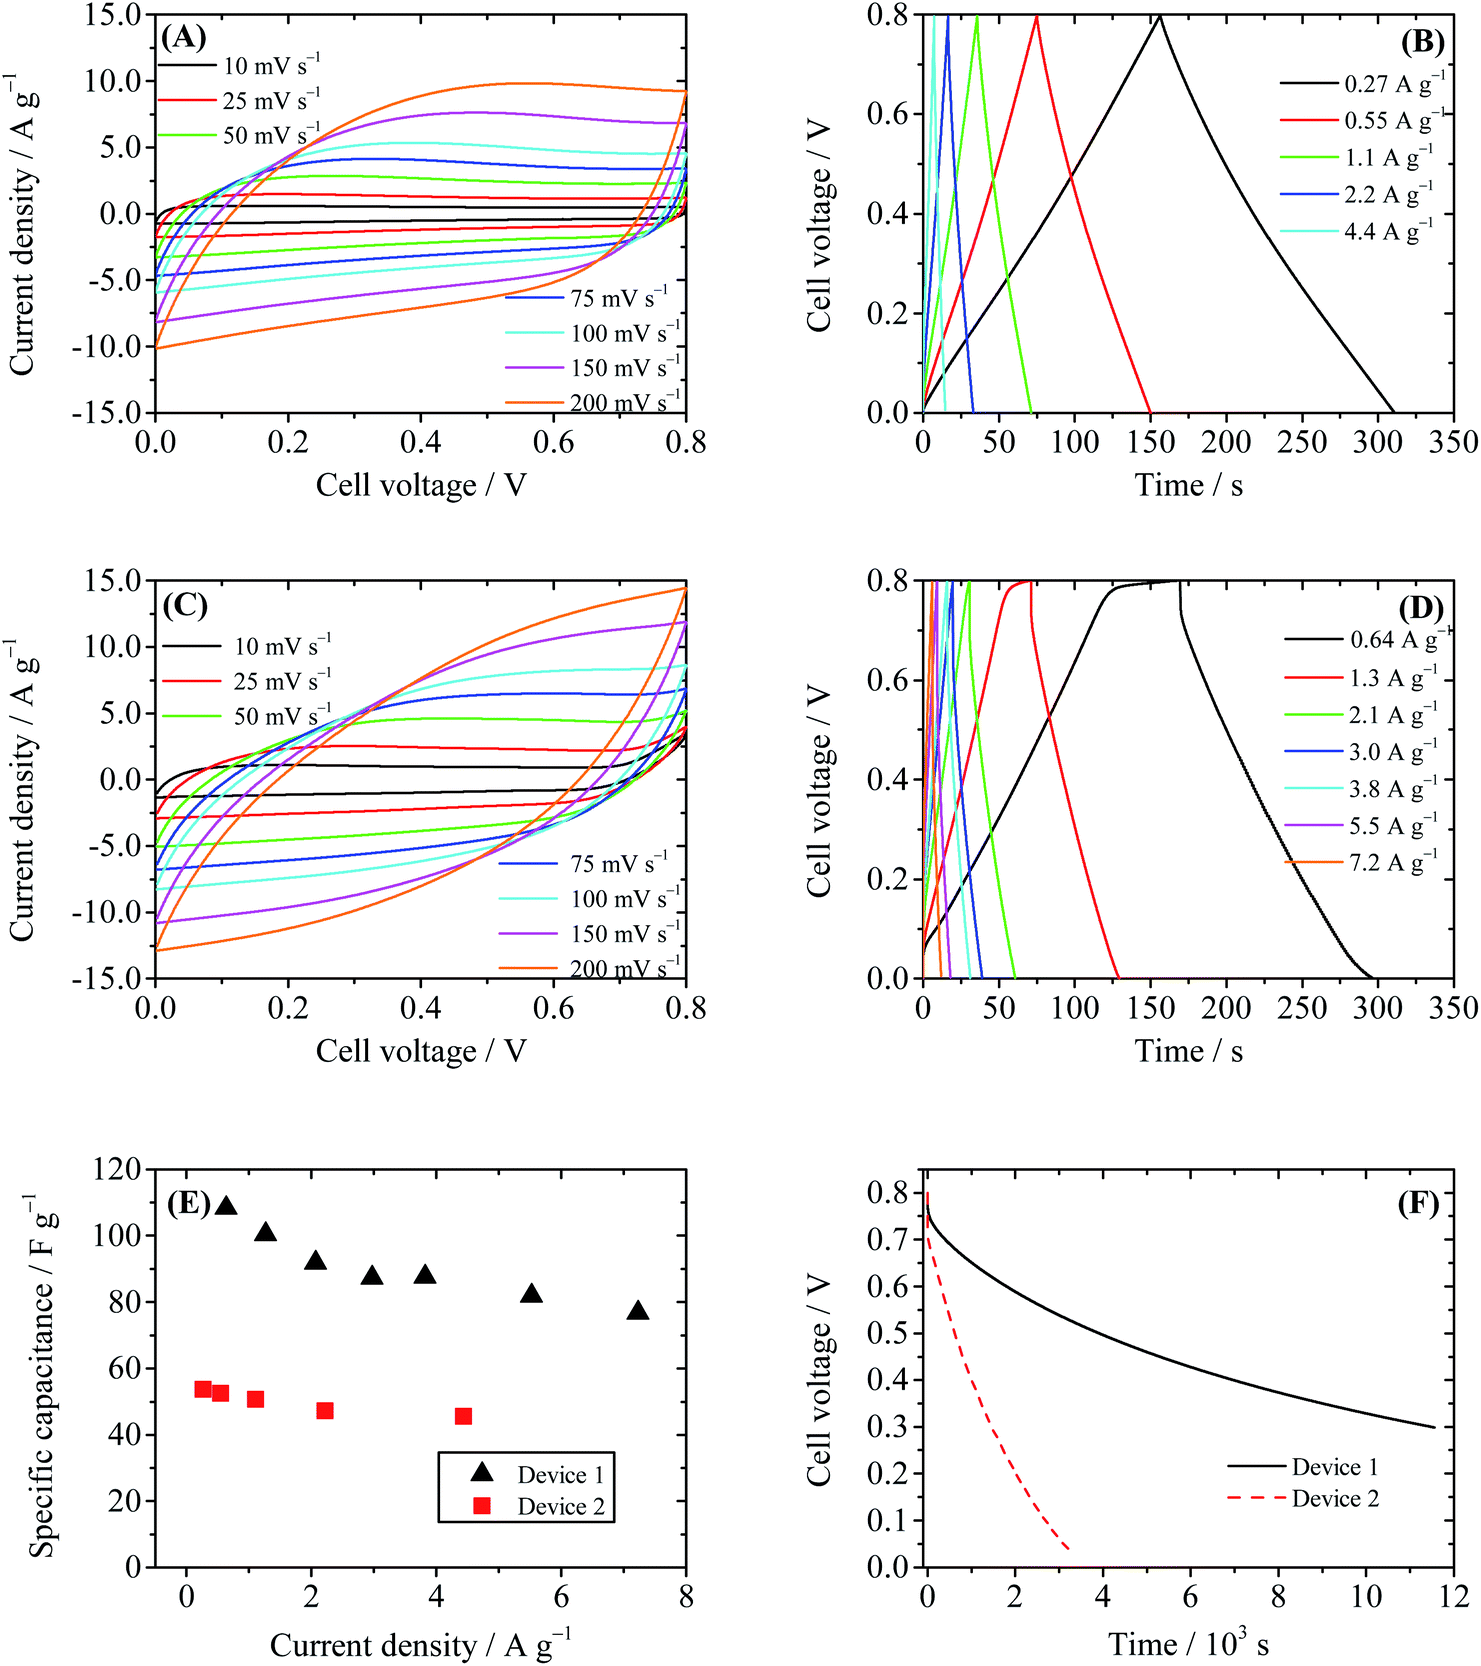
To evaluate the performance of the GHG electrode, a supercapacitor with 1 M H2SO4 as the electrolyte (Device 1) was first fabricated and tested. As displayed in Fig. 3A, the CV curves of Device 1 are almost rectangular, with weak and wide redox waves around 0.4 V, which can be attributed to the redox waves of residual oxygen-containing functional groups on CCG sheets.30 The GCD curves of Device 1 shown in Fig. 3B are nearly triangular, indicating that the capacitance of Device 1 is independent of cell voltage. The specific capacitances of Device 1 calculated from GCD curves are 50.8 F g−1 at 1.1 A g−1 and 45.5 F g−1 at 4.4 A g−1. These results are consistent with the literature data,23,30 demonstrating that the prepared GHG is a suitable electrode material for supercapacitors. We then investigated the GHG-based AEESCs with HQ as the active electrolyte (Device 2).11 When HQ was added in the electrolyte, the electrochemical behavior of the device changed in several aspects. The shapes of CV curves of Device 2 (Fig. 3C) are still deformed rectangles, but the currents in CV curves of Device 2 are larger than those in Device 1, revealing that HQ provides additional capacitance. At high scan rates, the shapes of CV curves deviate from rectangle, becoming obviously tilted. This is caused by the larger capacitance and/or internal resistance of Device 2. At low scan rates, when the cell voltage of Device 2 rises above 0.7 V, the current increases sharply, and during the reverse scanning no cathodic current is observed. This phenomenon suggests that some irreversible electrochemical reactions take place at high cell voltages. In Fig. 3D, there exists a plateau at high cell voltage regions of the charge curves with a low current density (<2.6 A g−1), corresponding to the large current at the same voltage range in CV curves. Such a plateau is characteristic of the solvent decomposition.31 In this voltage range, the current is consumed by the decomposition of water, thus the growth rate of cell voltage is very low. The specific capacitances of Device 2 calculated from GCD curves are 100.2 F g−1 at 1.3 A g−1 and 76.8 F g−1 at 7.2 A g−1, respectively. These values are nearly two times those of Device 1 (Fig. 3E), showing that the active electrolyte HQ significantly increases the specific capacitance of the electrochemical capacitor.
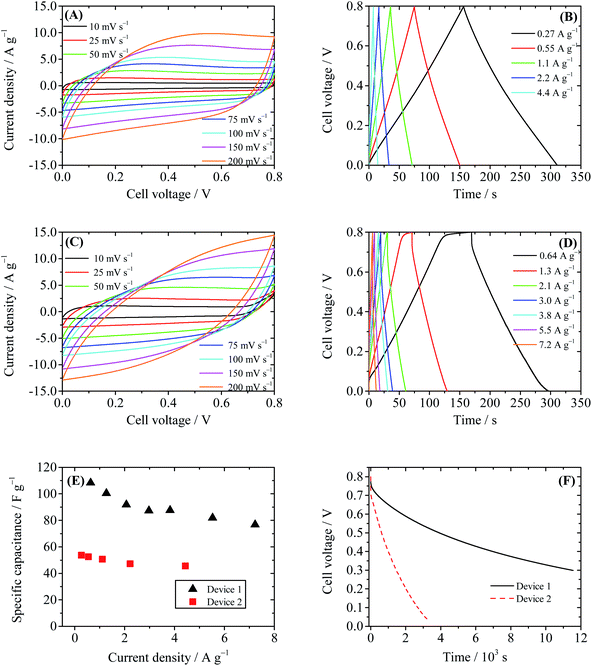 |
| | Fig. 3 Performance of Device 1 (1 M H2SO4 as the electrolyte) and Device 2 (0.4 M HQ + 1 M H2SO4 as the electrolyte). (A) Cyclic voltammograms of Device 1 at different scanning rates. (B) Galvanostatic charge–discharge curves of Device 1. (C) Cyclic voltammograms of Device 2 at different scanning rates. (D) Galvanostatic charge–discharge curves of Device 2. (E) Comparison of specific capacitances of Device 1 and Device 2. (F) SDC curves of Devices 1 and 2, recorded after the devices were charged to 0.8 V at a constant current of 10 mA. | |
However, when SDC of the capacitor device is taken into account, an obvious drawback of Device 2 arises. As depicted in Fig. 3F, the SDC process of Device 2 is much faster than that of Device 1. After 11![[thin space (1/6-em)]](https://www.rsc.org/images/entities/char_2009.gif) 524 s the cell voltage of Device 1 decreases to 0.3 V (τ0.3); however, τ0.3 of Device 2 is only 1462 s, and in 3100 s the cell voltage of Device 2 dwindles down from 0.8 V to 0.05 V. Noticing that the structure and package of both Device 1 and Device 2 are identical, their effects on the SDC process can be considered as system errors; thus the comparison of the SDC time of the two devices distinctly reveals the fact that HQ strongly accelerates the SDC process. Fast SDC processes will limit the practical application of the supercapacitor. Therefore, after the introduction of active electrolyte HQ, although the specific capacitance of the supercapacitor is improved, the practicability of the device becomes even worse.
524 s the cell voltage of Device 1 decreases to 0.3 V (τ0.3); however, τ0.3 of Device 2 is only 1462 s, and in 3100 s the cell voltage of Device 2 dwindles down from 0.8 V to 0.05 V. Noticing that the structure and package of both Device 1 and Device 2 are identical, their effects on the SDC process can be considered as system errors; thus the comparison of the SDC time of the two devices distinctly reveals the fact that HQ strongly accelerates the SDC process. Fast SDC processes will limit the practical application of the supercapacitor. Therefore, after the introduction of active electrolyte HQ, although the specific capacitance of the supercapacitor is improved, the practicability of the device becomes even worse.
To determine the mechanism of the SDC process of the two devices, the SDC curves were analyzed with several established models. If the SDC of the capacitor is governed by current leakage over a resistance R (RC circuit), the cell voltage V can be described by:
| |  | (5) |
where
V0 is the initial voltage of the cell. However, for both devices, the plot of ln
V against
t did not give a straight line (see Fig. S1 in ESI
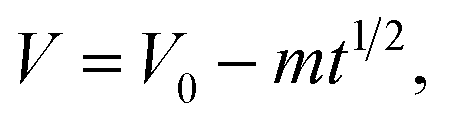
†). In fact, since the packaging method of the two devices and the measurement system are identical, the leakage currents in the two devices are supposed to be similar and cannot lead to such large differences in the SDC rate. Thus the SDC process is not caused by current leakage over a resistance. Another well-accepted mechanism of SDC is the diffusion-control model. In this model the stored charges are lost due to the diffusion of the electrolyte ions in the EDL, and the cell voltage obeys the following equation:
32| |  | (6) |
where
m is the diffusion parameter and is decided by, for a given device, the initial voltage. Fitting of the SDC curve of Device 1 shows that the cell voltage is proportional to the square root of time (
R2 = 0.999, as depicted in Fig. S2
†); thus the SDC of Device 1 is probably controlled by diffusion of the ions in the EDL.
19,32 However, in Device 2, since the active electrolyte HQ and its oxidation product BQ are nearly electrically neutral in H
2SO
4, and their diffusion coefficients are obviously smaller than those of H
+ and SO
42−, it is difficult to explain the fast SDC of Device 2 by diffusion of ions in the EDL.
In fact, the fast SDC process of Device 2 is closely related to the active electrolyte HQ; thus to explain the SDC process, the electrode processes on each individual electrode and mass transport in the device are taken into account. The potential changes of single electrodes in Devices 1 and 2 are shown in Fig. 4. From Fig. 4A one can easily conclude that Device 1 is a symmetric capacitor, because during the charge–discharge process the potential shift of each electrode is always half of the cell voltage. However, as represented in Fig. 4B, Device 2 is a typical asymmetric device. When current is applied on Device 2, a large IR drop appears in the potential curve of the anode, but the potential of the anode remains almost unchanged for the rest of the charge process. When the cell voltage reaches 0.7 V, a tiny increase in the anode potential of 0.06 V is observed, corresponding to a high specific capacitance of 1851.4 F g−1. Since the total capacitance of the device is the series capacitance of two electrodes, the large specific capacitance of the anode can significantly increase the total capacitance of the device. Meanwhile, the potential of the cathode changes obviously during the charge process, from 0.33 V to a very negative potential of −0.24 V vs. SCE (Fig. 4B). At this negative potential, water is decomposed to release hydrogen. This can explain the appearance of a solvent decomposition plateau on the GCD curve of Device 2. The asymmetric specific capacitances of electrodes in Device 2 also suggest that an asymmetric device structure, with a small anode mass and large cathode mass, can further enhance the specific capacitance of the device, by balancing the capacitances of two electrodes. The potential curves in Fig. 4B agree well with the results obtained in other HQ enhanced supercapacitors with activated carbon as electrodes12 and can be explained by the redox reaction of HQ on the anode. In fact, during the charge–discharge process, the following electrochemical reaction takes place on the surface of the anode:
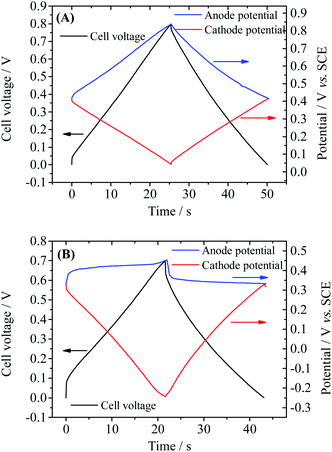 |
| | Fig. 4 Potential curves of single electrodes of Device 1 (A) and Device 2 (B) during GCD. Current density: Device 1: anode, 3.2 A g−1 cathode: 2.58 A g−1; Device 2: anode, 4.8 A g−1, cathode, 3.65 A g−1. | |
Thus the electrode reaction on the anode is a galvanostatic electrolysis. It has been confirmed by the previous investigation that this electrochemical reaction is reversible on the graphene electrode.33 Therefore, the electrode potential of the anode during the galvanostatic electrolysis will change little as long as the electrolysis time is shorter than the transition time.34 Namely, HQ becomes an ideal depolarizer in the device, which pins the anode potential near its equilibrium electrode potential. According to the definition of capacitance (eqn (3)), the capacitance of the anode becomes ultralarge due to the small potential change. Therefore, the Faradaic process at the anode is the origin of the large capacitance of Device 2.
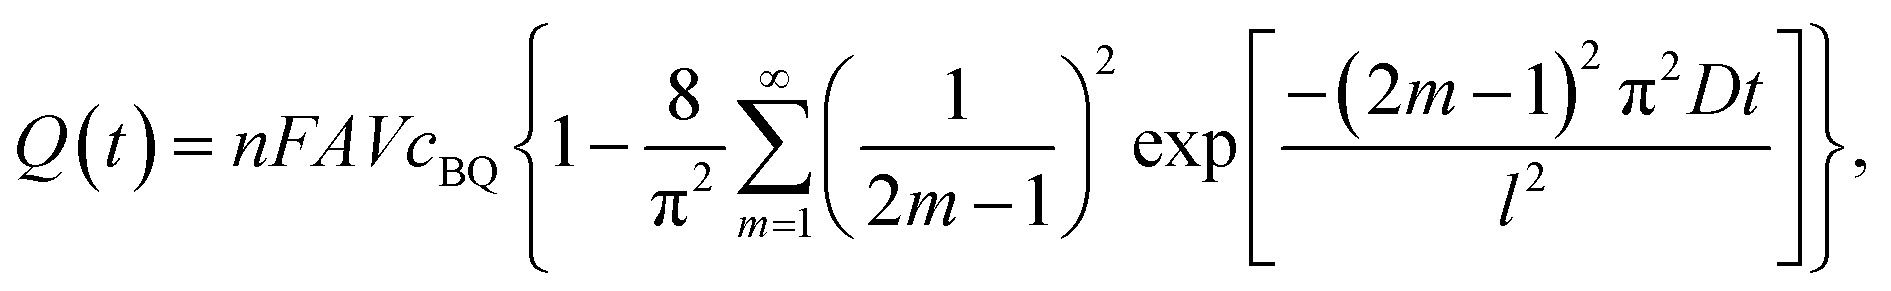
As mentioned above, BQ is generated during the charge process as the product of galvanostatic electrolysis of HQ and dissolves in the electrolyte inside the channels of the porous GHG anode. These BQ molecules will diffuse across the separator and reach the surface of the cathode, as shown in Fig. 5. Since the potential of the cathode drops to −0.24 vs. SCE via charging the EDL, BQ will be easily reduced by the cathode. The reduction of BQ on the charged cathode is a coulostatic electrolysis in thin layers of solution. Noticing that the potential of the cathode is much lower than the equilibrium potential of BQ/HQ, the electrochemical reaction is controlled by diffusion of BQ. For simplicity, it is assumed that at the beginning of SDC the initial concentration of BQ in the anode chamber and the separator is uniform, and the diffusion coefficient of BQ in the porous separator and the GHG electrode is identical; thus the total charge passing from the cathode to the solution follows eqn (7):35
| |  | (7) |
where
A is the area of the electrode,
cBQ is the initial concentration of BQ in the anode chamber,
V is the volume of BQ solution,
n is the number of electrons transferred in the reaction (
n = 2 for the reduction of BQ),
F is the Faraday constant,
D is the diffusion coefficient of BQ and
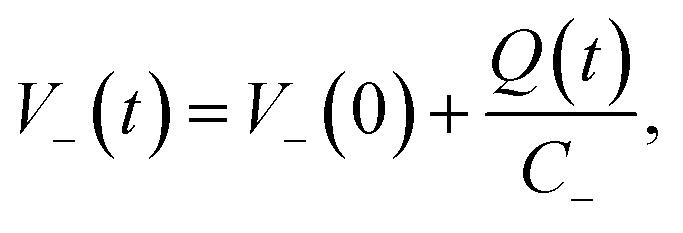
l is the total thickness of the separator and the anode. Since the potential of the cathode
V−(
t) can be expressed as:
| |  | (8) |
and terms in
eqn (6) for which
m > 1 are negligibly small, the potential of cathode can be described by
eqn (8):
| |  | (9) |
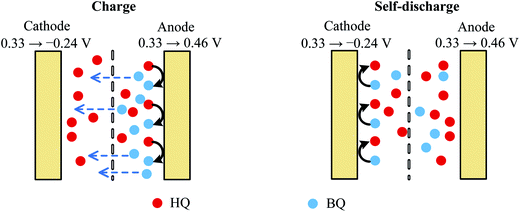 |
| | Fig. 5 Schematic sketch of the mechanism of charge and SDC of AEESCs. | |
Noticing that during the charge and discharge process the potential of the anode V+ remains almost unchanged, we have:
and
By substituting eqn (9) and (11) with (10), we obtained:
| | 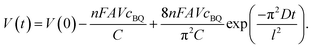 | (12) |
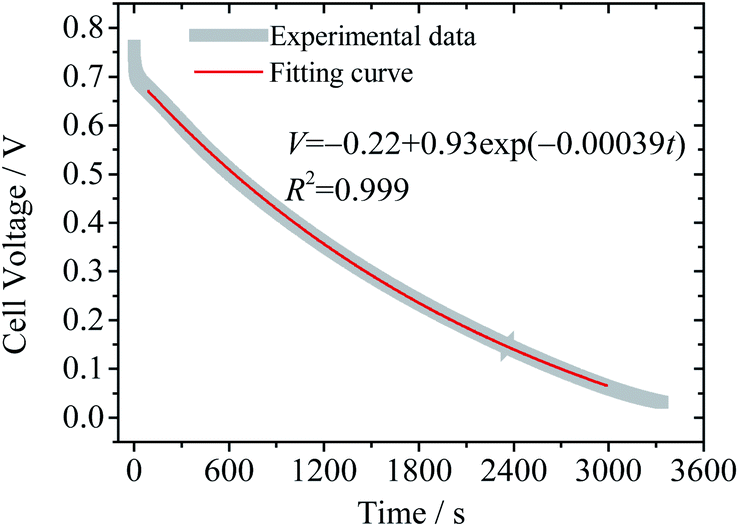
Eqn (12) reveals that the cell voltage V(t) decreases exponentially. It can be seen in Fig. 6 that the SDC curve fits well with eqn (12), giving a correlation coefficient of 0.999. It also suggests that the diffusion coefficient D and the thickness of the device strongly influence the SDC. From the fitting result the diffusion coefficient of BQ is calculated to be 1.2 × 10⁻⁷ cm2 s−1, smaller than the reported diffusion coefficient of BQ in H2SO4 (1.08 × 10⁻⁵ cm2 s−1),36 due to the fact that the porous structure of the GHG electrode and the separator significantly increases the diffusion length.
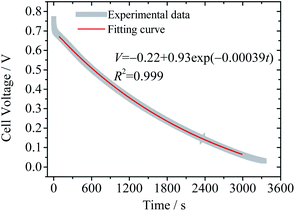 |
| | Fig. 6 Fitting result of the SDC curve of Device 2 to eqn (12). | |
At the initial stage of the SDC curve, there is a quick drop of cell voltage, resulting in a deviation from the fitting result. This is probably caused by the decomposition of the solvent. As mentioned above, solvent water will be reduced on the cathode when the device is fully charged, and when the charge current is cut off this reduction process will go on, leading to a rapid increase in the cathode potential. Such a process is not controlled by diffusion and strongly depends on the surface property of the electrode (the overpotential of hydrogen evolution reaction). The platinum current collector in Device 2 may catalyze the hydrogen evolution reaction, but the fundamental reason is that the active electrolyte HQ shifts the working potential range of the cathode beyond the electrochemical window of the solvent, accelerating the SDC process.
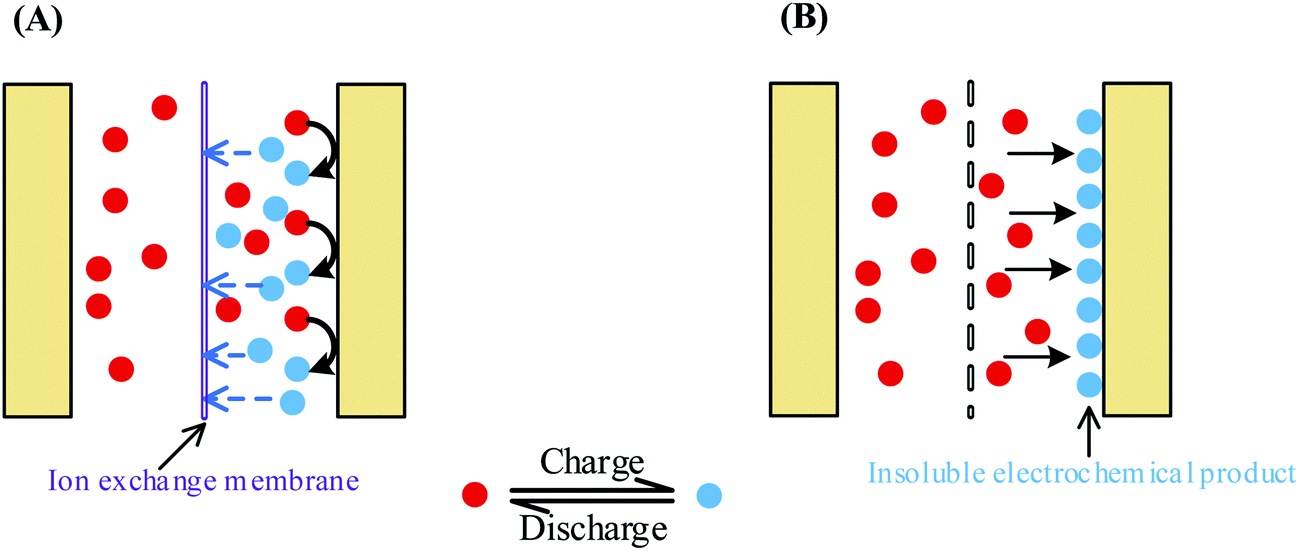
According to the above discussions, to suppress the fast SDC process of AEESCs, the first essential step is to stop the shuttle of the active electrolyte between two electrodes. To do so, we devised two strategies, as shown in Fig. 7: (1) using an ion-exchange membrane as the separator of the capacitor, which can block the migration of the active electrolyte (Fig. 7A); (2) using a special active electrolyte which is converted into insoluble species and deposited onto the electrode during the electrochemical reaction in the charge process (Fig. 7B).
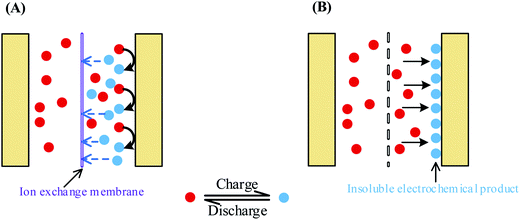 |
| | Fig. 7 Two strategies for inhibiting the migration of the active electrolyte between two electrodes. (A) Using an ion-exchange membrane as the separator; (B) choosing a special active electrolyte which is converted into insoluble species during the charge process. | |
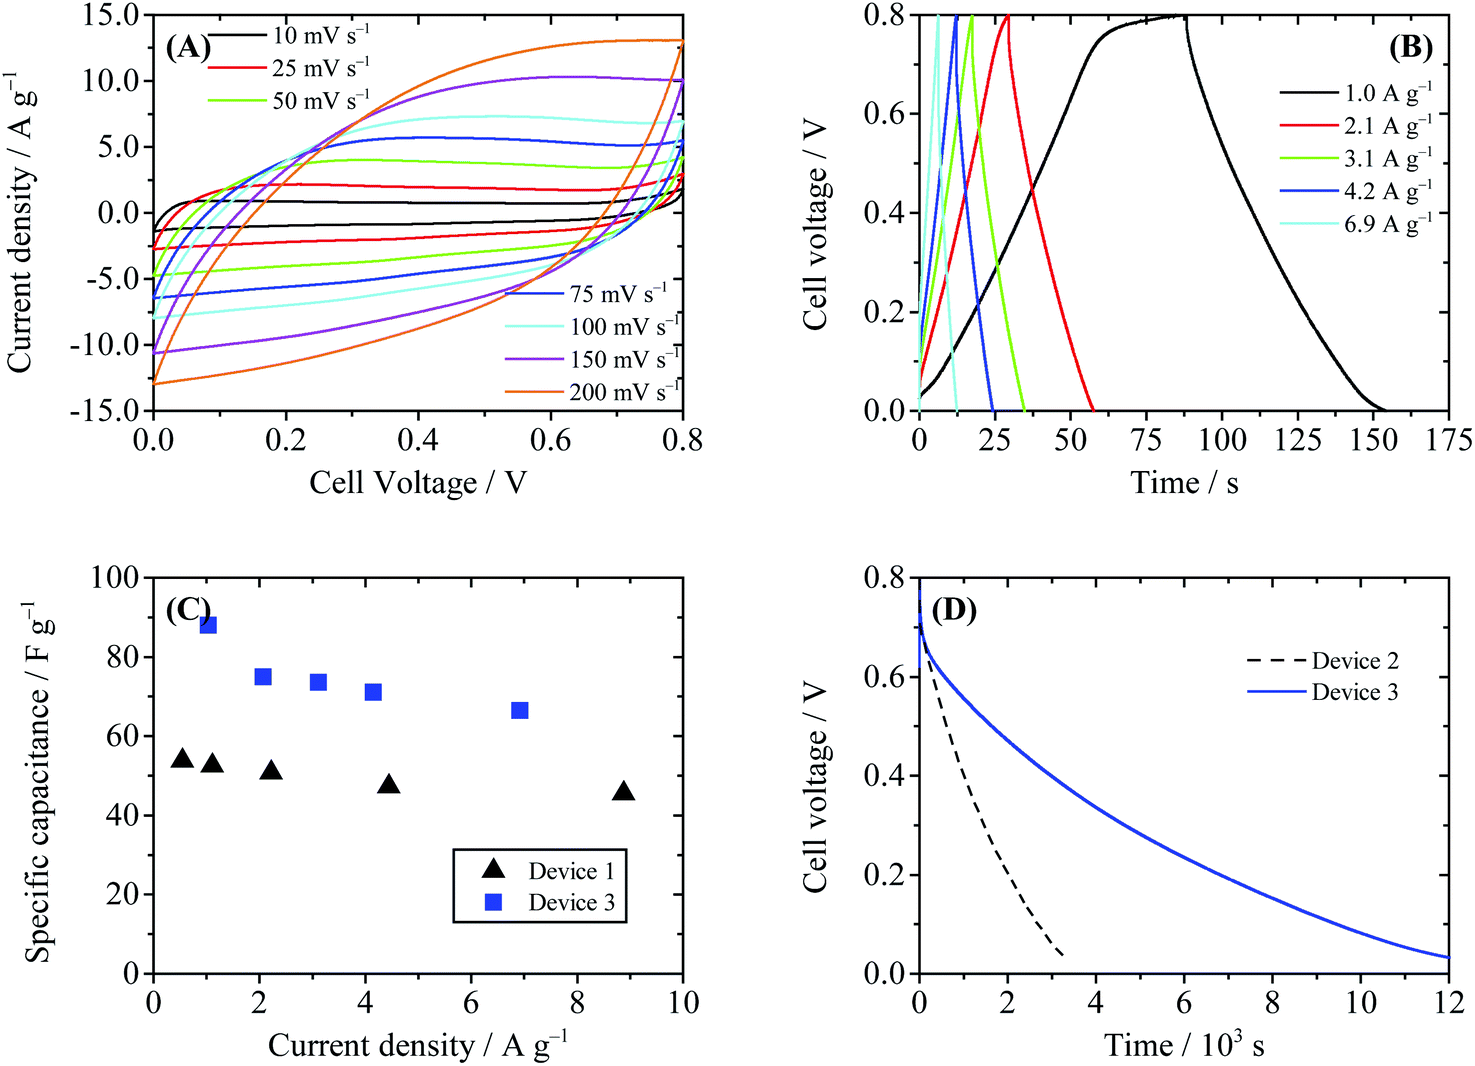
We first tried to improve HQ enhanced supercapacitors following the first strategy. The porous separator in Device 2 was replaced by the Nafion® 117 membrane (Device 3), which only allowed migration of H+ ion across itself, thus the shuttle of BQ was inhibited. As displayed in Fig. 8, the shapes of CV and GCD curves of Device 3 resemble those of Device 2, suggesting that the electrode processes are not changed by the Nafion® film. The specific capacitances of Device 3 are calculated to be 75.0 F g−1 at 2.1 A g−1 and 66.4 F g−1 at 6.9 A g−1, lower than those of Device 2, but still much higher than those of EDLSC Device 1 (Fig. 8C). Fig. 8D compares the SDC curves of Devices 2 and 3. It can be observed in this figure that the SDC process of Device 3 is much slower than that of Device 2. The cell voltage of Device 3 decreases from 0.8 V to 0.3 V after 4686 s, three times that of Device 2 (1462 s). This result reveals that the Nafion® separator can successfully block the migration of the active electrolyte and suppress the SDC process. However, the attenuation of cell voltage of Device 3 is still faster than Device 1. Thus, there exist some other minor paths of SDC in Device 3. One possible way is the decomposition of water, which also occurs in Device 2. This process can result in a sharp cell voltage decrease at the beginning of the SDC. Besides, HQ is reactive and can be converted into BQ by oxygen in air, thus a certain amount of BQ may be induced into the electrolyte as the impurity. Some of the BQ molecules in the cathode chamber may survive after the charge process, and they can also cause SDC by consuming the negative charges on the cathode.
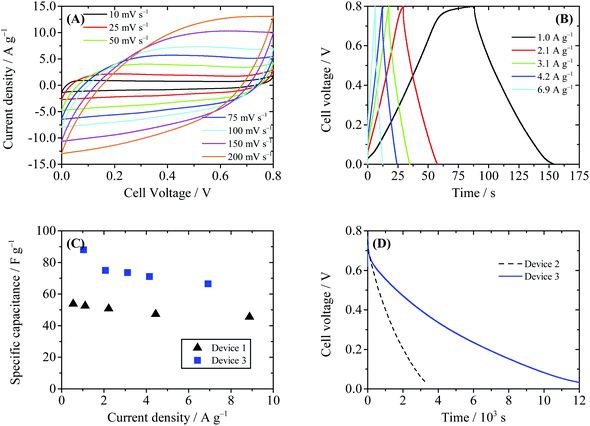 |
| | Fig. 8 Performance of Device 3 (with 0.4 M HQ + 1 M H2SO4 as the electrolyte and Nafion® 117 as the separator). (A) Cyclic voltammograms at different scanning rates. (B) Galvanostatic charge–discharge curves. (C) Comparison of the specific capacitance of Device 1 and Device 3. (D) SDC curves of Devices 2 and 3, recorded after the devices were charged to 0.8 V at a constant current of 10 mA. | |
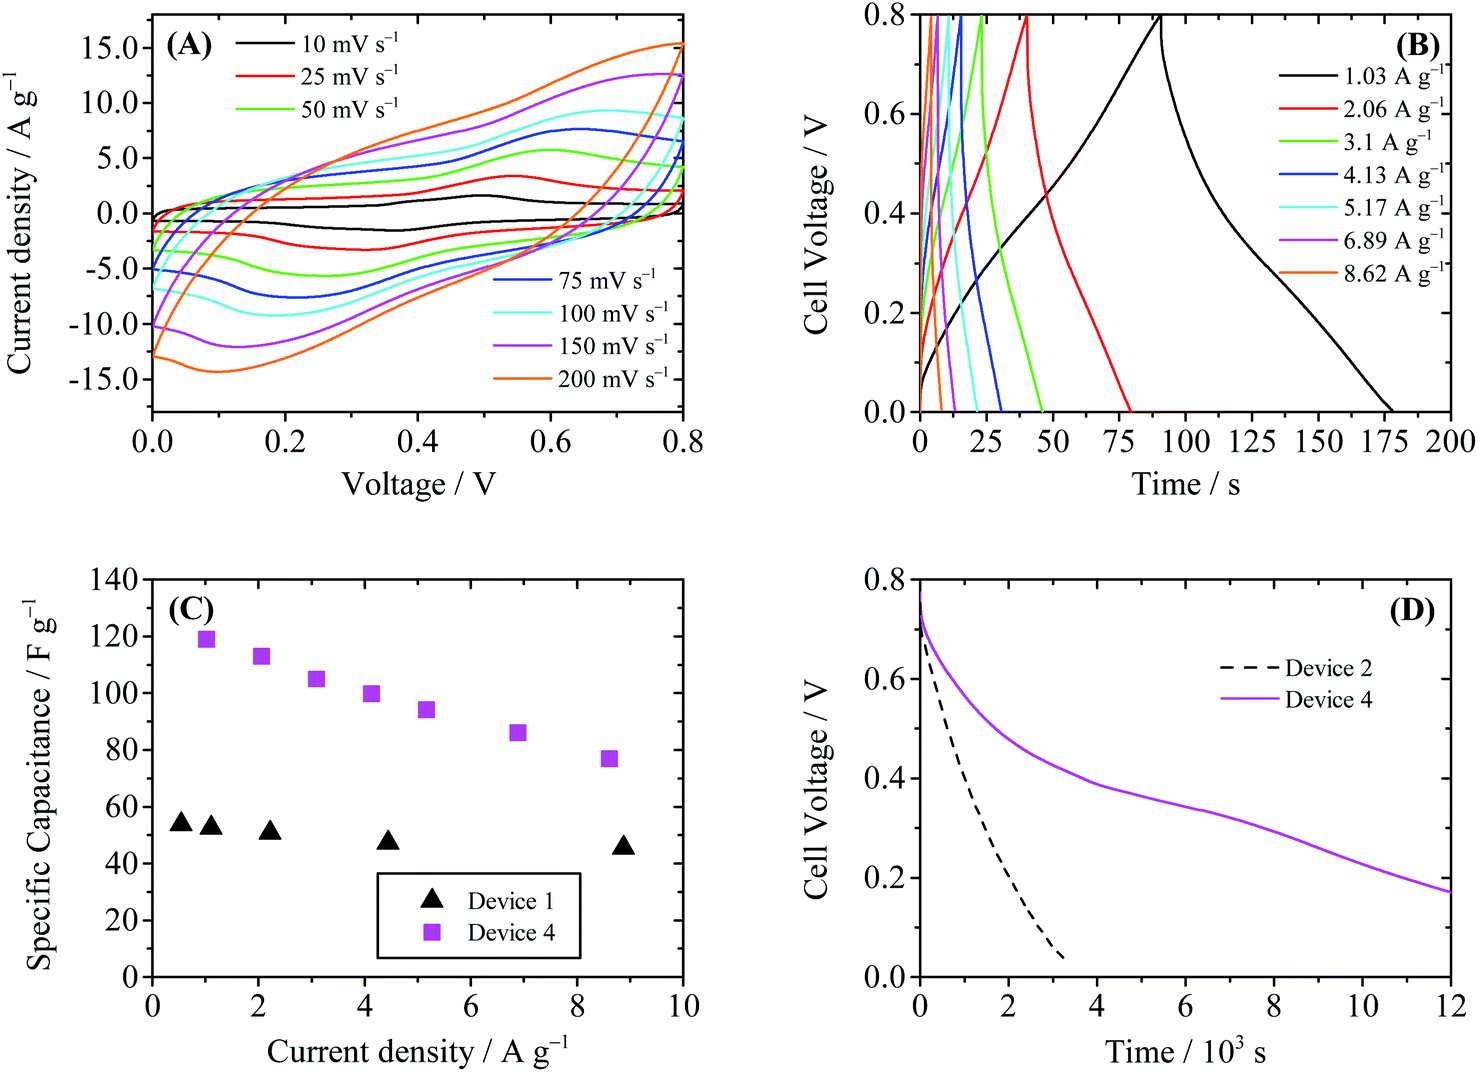
To overcome the shortages of above devices, we designed another AEESC following strategy 2, by taking CuSO4 as the active electrolyte (Device 4). In sulfonic acid, the following electrode reaction will occur, whose standard electrode potential is 0.34 V vs. SHE (standard hydrogen electrode):37
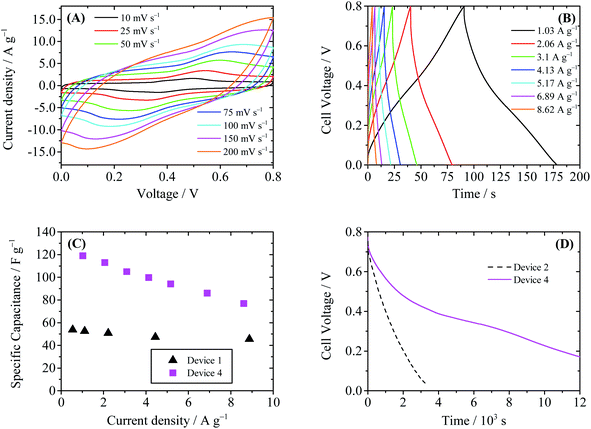
Thus when Device 4 is charged, Cu2+ ions are reduced to Cu metal (copper electroplate), which is insoluble in water and deposited onto the cathode. As a result, in Device 4 there will be no shuttle effect of the electrochemical product. The characterization curves of the Device 4 are summarized in Fig. 9. In the CV curves of Device 4 (Fig. 9A), a pair of redox wave around 0.4 V is observed. This redox wave is different from that of Device 1; thus it may be assigned to the redox reaction of CCG involving copper species. Fig. 9B shows the GCD curves of Device 4. The GCD curves obviously deviate from the ideal triangular shape, due to the above-mentioned electrochemical reactions. The specific capacitances of Device 4 calculated from GCD curves are 113 F g−1 at 2.1 A g−1 and 86 F g−1 at 6.9 A g−1, as shown in Fig. 9C. Similar to Device 2, the enhancement of specific capacitance of Device 4 comes from the Faradaic pseudocapacitance induced by electroactive Cu2+. However, since the shuffle effect is suppressed, Device 4 shows a much slower SDC process compared with Device 2. As depicted in Fig. 9D, it takes 7727 s for the cell voltage of Device 4 to decrease from 0.8 V to 0.3 V through SDC, and this time is significantly longer than those of Device 2 (1462 s) and Device 3 (4686 s). From the SDC curve of Device 4 it is also found that there exists a plateau region around 0.35 V, which is consistent with the plateau in the GCD curve.
 |
| | Fig. 9 Performance of Device 4 (with 0.4 M CuSO4 + 1 M H2SO4 as the electrolyte). (A) Cyclic voltammograms at different scanning rates. (B) Galvanostatic charge–discharge curves. (C) Comparison of the specific capacitance of Device 1 and Device 4. (D) SDC curves of Devices 2 and 4, recorded after the devices were charged to 0.8 V at a constant current of 10 mA. | |
Also the electrode processes in Device 4 were investigated in a three-electrode system. As shown in Fig. 10, during the charge–discharge process, the potential shift of the anode (0.77 V) makes chief contribution to the increase of cell voltage, while the potential of the cathode remains stable (potential change: 0.03 V). The specific capacitance of the cathode is calculated to be 14072.5 F g−1 at 2.1 A g−1 and that of the anode is 243.3 F g−1 at 2.0 A g−1. As discussed above, the ultrahigh specific capacitance of the cathode is the result of the electrochemical reaction of Cu2+. The Cu deposited on the GHG electrode during the charge process can be observed by SEM (Fig. S7†). The equilibrium potential of Cu2+/Cu under experimental conditions (0.4 M Cu2+ in 1 M H2SO4) is ∼0.07 V vs. SCE or 0.252 V vs. SHE. As a result, the working potential range of the anode is 0.252–1.052 V vs. SHE. Under this potential range the solvent water is stable (noticing that the standard electrode potential of the reaction O2 + 4H+ + 4e− = 2H2O is 1.229 V vs. SHE37). Therefore, SDC through decomposition of the solvent, which occurs in Devices 2 and 3, is avoided. Moreover, as described above, in Device 3 the oxidation product of BQ may be induced into the electrolyte and cause SDC. But in Device 4 the reduction product copper is not probably induced into the electrolyte. Therefore, the charges stored on the electrode of Device 4 will not be lost through those additional redox processes. To conclude, with CuSO4 as the active electrolyte, the capacitance of the supercapacitor is improved significantly, while the fast SDC process usually occurring in other AEESCs is suppressed.
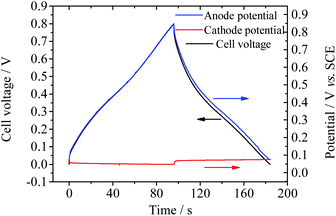 |
| | Fig. 10 Potential curves of single electrodes of Device 4 during GCD at current densities of 2.0 A g−1 (for the anode) and 2.1 A g−1 (for the cathode). | |
Conclusions
In summary, in this paper, we systematically investigated the SDC processes of AEESCs. After incorporation of soluble electroactive species into a supercapacitor device, although the capacitance of the device was increased, the SDC process was accelerated significantly. The migration of the active electrolyte between two electrodes of the device (shuttle effect) is the primary reason for the fast SDC, as indicated by the analysis of electrode processes of single electrodes. In order to block the migration of the active electrolyte between two electrodes, we developed two basic strategies: (1) using an ion-exchange membrane as the separator of the capacitor and (2) choosing a special active electrolyte which is converted into insoluble species during the electrochemical reaction in the charge process. Two AEESCs were fabricated following these designs. It was confirmed that with the Nafion® 117 membrane as the separator or with CuSO4 as the active electrolyte, the SDC of AEESCs can be successfully suppressed. We believe that the results in this paper can guide the further design of AEESCs with both high energy density and good energy retention, and push forward the development of supercapacitors in practical applications.
Acknowledgements
This work was supported by the National Natural Science Foundation of China (21104041).
Notes and references
- P. Simon and Y. Gogotsi, Nat. Mater., 2008, 7, 845–854 CrossRef CAS PubMed.
- L. L. Zhang and X. S. Zhao, Chem. Soc. Rev., 2009, 38, 2520–2531 RSC.
- G. Wang, L. Zhang and J. Zhang, Chem. Soc. Rev., 2012, 41, 797–828 RSC.
- M. S. Whittingham, Proc. IEEE, 2012, 100, 1518–1534 CrossRef CAS.
- W. T. Deng, X. B. Ji, Q. Y. Chen and C. E. Banks, RSC Adv., 2011, 1, 1171–1178 RSC.
- C. D. Lokhande, D. P. Dubal and O. S. Joo, Curr. Appl. Phys., 2011, 11, 255–270 CrossRef.
- G. A. Snook, P. Kao and A. S. Best, J. Power Sources, 2011, 196, 1–12 CrossRef CAS.
- X. Zhao, B. M. Sanchez, P. J. Dobson and P. S. Grant, Nanoscale, 2011, 3, 839–855 RSC.
- H. Wang, H. S. Casalongue, Y. Liang and H. Dai, J. Am. Chem. Soc., 2010, 132, 7472–7477 CrossRef CAS PubMed.
- Y. F. Wang, X. W. Yang, L. Qiu and D. Li, Energy Environ. Sci., 2013, 6, 477–481 CAS.
- S. Roldán, C. Blanco, M. Granda, R. Menéndez and R. Santamaría, Angew. Chem., Int. Ed., 2011, 50, 1699–1701 CrossRef PubMed.
- S. Roldán, M. Granda, R. Menéndez, R. Santamaría and C. Blanco, J. Phys. Chem. C, 2011, 115, 17606–17611 Search PubMed.
- S. Roldán, M. Granda, R. Menéndez, R. Santamaría and C. Blanco, Electrochim. Acta, 2012, 83, 241–246 CrossRef.
- J. Cong, X. Yang, L. Kloo and L. Sun, Energy Environ. Sci., 2012, 5, 9180–9194 CAS.
- W. Chen, R. B. Rakhi and H. N. Alshareef, Nanoscale, 2013, 5, 4134–4138 RSC.
- H. Yu, L. Fan, J. Wu, Y. Lin, M. Huang, J. Lin and Z. Lan, RSC Adv., 2012, 2, 6736–6740 RSC.
- H. Yu, J. Wu, L. Fan, Y. Lin, S. Chen, Y. Chen, J. Wang, M. Huang, J. Lin, Z. Lan and Y. Huang, Sci. China: Chem., 2012, 55, 1319–1324 CrossRef CAS.
- M. Tachibana, T. Ohishi, Y. Tsukada, A. Kitajima, H. Yamagishi and M. Murakami, Electrochemistry, 2011, 79, 882–886 CrossRef CAS.
- Q. Zhang, J. Rong, D. Ma and B. Wei, Energy Environ. Sci., 2011, 4, 2152–2159 CAS.
- T. Tevi, H. Yaghoubi, J. Wang and A. Takshi, J. Power Sources, 2013, 241, 589–596 CrossRef CAS.
- W. S. Hummers and R. E. Offeman, J. Am. Chem. Soc., 1958, 80, 1339 CrossRef CAS.
- K. W. Chen, L. B. Chen, Y. Q. Chen, H. Bai and L. Li, J. Mater. Chem., 2012, 22, 20968–20976 RSC.
- L. Zhang and G. Q. Shi, J. Phys. Chem. C, 2011, 115, 17206–17212 CAS.
- Y. X. Xu, Q. Wu, Y. Q. Sun, H. Bai and G. Q. Shi, ACS Nano, 2010, 4, 7358–7362 CrossRef CAS PubMed.
- M. D. Stoller and R. S. Ruoff, Energy Environ. Sci., 2010, 3, 1294–1301 CAS.
- Y. Zhu, S. Murali, M. D. Stoller, K. J. Ganesh, W. Cai, P. J. Ferreira, A. Pirkle, R. M. Wallace, K. A. Cychosz, M. Thommes, D. Su, E. A. Stach and R. S. Ruoff, Science, 2011, 332, 1537–1541 CrossRef CAS PubMed.
- Y. X. Xu, K. X. Sheng, C. Li and G. Q. Shi, ACS Nano, 2010, 4, 4324–4330 CrossRef CAS PubMed.
- C. Li and G. Shi, Nanoscale, 2012, 4, 5549–5563 RSC.
- H. Zhang, G. Cao, Y. Yang and Z. Gu, Carbon, 2008, 46, 30–34 CrossRef CAS.
- K. X. Sheng, Y. X. Xu, C. Li and G. Q. Shi, New Carbon Mater., 2011, 26, 9–15 CrossRef CAS.
- S. Ban, J. Zhang, L. Zhang, K. Tsay, D. Song and X. Zou, Electrochim. Acta, 2013, 90, 542–549 CrossRef CAS.
- B. W. Ricketts and C. Ton-That, J. Power Sources, 2000, 89, 64–69 CrossRef CAS.
- C. L. He, C. L. Liu, T. P. Xie, Y. Wang, J. Zhang and L. Zhang, Chem. J. Chin. Univ., 2012, 33, 1290–1294 CAS.
-
A. J. Bard and L. R. Faulkner, Electrochemical Methods Fundamentals and Applications, John Wiley & Sons, 2nd edn, 2001 Search PubMed.
- A. T. Hubbard and D. G. Peters, CRC Crit. Rev. Anal. Chem., 1973, 3, 201–242 CAS.
- X. S. Zhang, P. Ding, Y. C. Dai and W. K. Yuan, Prog. Nat. Sci., 1999, 9, 796–800 Search PubMed.
-
W. M. Haynes and D. R. Lide, Handbook of Chemistry and Physics, CRC Press, Boca Raton, 90th edn, 2010 Search PubMed.
Footnote |
| † Electronic supplementary information (ESI) available: Fitting results of SDC curves; AC impedance spectra and cycling stability of Devices 3 and 4; SEM image and EDX of Cu coated GHG electrodes. See DOI: 10.1039/c4ee00002a |
|
| This journal is © The Royal Society of Chemistry 2014 |
Click here to see how this site uses Cookies. View our privacy policy here.  Open Access Article
 This Open Access Article is licensed under a Creative Commons Attribution-Non Commercial 3.0 Unported Licence