 Open Access Article
Nitrile-assistant eutectic electrolytes for cryogenic operation of lithium ion batteries at fast charges and discharges
Yoon-Gyo
Cho
a,
Young-Soo
Kim
a,
Dong-Gil
Sung
b,
Myung-Su
Seo
b and
Hyun-Kon
Song
*a
aSchool of Energy and Chemical Engineering, UNIST, Ulsan 689-798, Korea. E-mail: philiphobi@hotmail.com
bBEXEL Corporation, Gumi, Kyung-Buk, Korea
First published on 30th January 2014
Abstract
The charge/discharge characteristics of lithium ion batteries at low temperature (LT = −20 °C) are enhanced by using ethylene carbonate (EC)-based electrolytes with the help of assistant solvents of nitriles. Conventional liquid electrolytes (e.g. a mixture of EC and dimethyl carbonate (DMC), abbreviated as LED) cannot support a satisfactory capacity at low temperature as well as at high rates even if electric vehicles require low-temperature operation. Introducing propionitrile or butyronitrile (Pn or Bn) into LED (resulting in LEDPn or LEDBn) as a co-solvent increases significantly the high-rate capacities at −20 °C. For example, LEDPn delivers 62% of the available capacity at 1 C and 46% at 3 C with a 2.7 V cut-off while the control LED provides just 6% and 4% at the same rates. Successful operation at −20 °C with nitrile-assistant electrolytes results from high ionic conductivity, low viscosity and freezing point depression caused by the eutectic behavior of the carbonates (EC/DMC) and Pn. Based on the phase diagram of Pn with EC/DMC, we expect a meaningful battery operation up to −110 °C, probably lower, at the eutectic composition.
Broader contextLithium ion batteries for electric vehicles should provide required energy within limited spaces with guaranteed safety, delivering enough power to satisfy the requirements of electric motors, be charged within a short time period so that drivers can endure and be operated in a wide range of temperature including the cryogenic range up to −20 °C and more severely −30 °C. The inferior charge and discharge characteristics of LIBs at low temperatures are one of the most serious problems that should be overcome by research and development. The disability of LIBs at low-temperature operations is caused by the limited ionic transport properties of the electrolyte, sluggish Li+ desolvation with slow charge transfer kinetics and phase transition of the electrolyte, leading to severe ohmic and concentration polarization. In this work, we present nitrile-assistant carbonate-based eutectic electrolytes showing significantly enhanced charge and discharge characteristics at −20 °C and high rates up to 3 C. The successful operation at −20 °C with the nitrile-assistant electrolytes results from high ionic conductivity, low viscosity and freezing point depression caused by the eutectic behavior of the carbonates and nitriles. |
1. Introduction
Lithium ion batteries (LIBs) have expanded their field of application into electric vehicles (EVs) and energy storage systems (ESSs) since they dominate the market share of batteries for electronic devices including cell phones, laptop computers, camcorders and digital cameras.1 Their energy and power densities have been enhanced steadily to satisfy the requirements of new application targets. The requirements of EVs or more technically xEVs including hybrid, plug-in and full EVs (HEVs, PHEVs and EVs) are rather more sophisticated than those of ESS applications. LIBs for xEVs should provide required energy within a limited space with guaranteed safety, deliver enough power to satisfy the requirements of electric motors, be able to be charged within a short time period so that drivers can wait, and be operated within a wide range of temperature including the cryogenic range up to −20 °C and more severely −30 °C.2 The inferior charge and discharge characteristics of LIBs at low temperatures are one of the most serious problems that must be overcome by research and development.The disability of LIBs at low-temperature operations is caused by the limited ionic transport properties of the electrolyte, sluggish Li+ desolvation with slow charge transfer kinetics and phase transition of electrolyte, leading to severe ohmic and concentration polarization.3 As a representative example, the value of ionic conductivity (σi) of EC![[thin space (1/6-em)]](https://www.rsc.org/images/entities/char_2009.gif) :
:![[thin space (1/6-em)]](https://www.rsc.org/images/entities/char_2009.gif) PC (50
PC (50![[thin space (1/6-em)]](https://www.rsc.org/images/entities/char_2009.gif) :
:![[thin space (1/6-em)]](https://www.rsc.org/images/entities/char_2009.gif) 50 vol%, EC = ethylene carbonate; PC = propylene carbonate) with 1 M LiPF6 falls from ∼101 mS cm−1 at 25 °C to 100 mS cm−1 at −20 °C.4 The lower σi leads to a higher ohmic polarization so that the voltage margin between the working and cut-off potentials is reduced at the initial time period of galvanostatic discharge. Also, concentration polarization follows during discharge, showing depletion of Li+ in the immediate proximity of the cathode particles.3 Phase transition from liquid to solid affects the ionic conductivity and concentration of Li+ in a negative way. The situation is even more severe at high charge or discharge rates so that only a small fraction of stored energy can be extracted.
50 vol%, EC = ethylene carbonate; PC = propylene carbonate) with 1 M LiPF6 falls from ∼101 mS cm−1 at 25 °C to 100 mS cm−1 at −20 °C.4 The lower σi leads to a higher ohmic polarization so that the voltage margin between the working and cut-off potentials is reduced at the initial time period of galvanostatic discharge. Also, concentration polarization follows during discharge, showing depletion of Li+ in the immediate proximity of the cathode particles.3 Phase transition from liquid to solid affects the ionic conductivity and concentration of Li+ in a negative way. The situation is even more severe at high charge or discharge rates so that only a small fraction of stored energy can be extracted.
To select solvent molecules guaranteeing good performances, viscosity (η) and dielectric constants (ε) are considered as the first criteria. The viscosity η is related to mobility whereas ε indicates the degree of salt dissociation. There is every possibility that low η and high ε imply a high σi value because σi consists of the mobility and the number of charge carriers. EC, one of cyclic carbonates, is the widely used main component of electrolytes due to its high value of ε at 89.78 and its SEI (solid-electrolyte interface)-layer-forming ability. However, it is a solid at room temperature (freezing point, Tf = 36.4 °C) with a high viscosity (η = 1.90 cP at 40 °C) so that co-solvent(s) with low η and low Tf are required. Linear carbonates such as dimethyl carbonate (DMC) and ethylmethyl carbonate (EMC) have been used as counterparts to EC to complement its demerits. The boiling point (Tb) of the solvent should be considered important since stability at room temperature and safety issues at high temperature cannot be sacrificed for enhancing the low-temperature operation.
There have been limited efforts to enhance the low-temperature operation of LIBs. With a criterion of a low Tf, below −70 °C, a high Tb of around 100 °C and a low η of around 0.5 cP or below, esters such as methyl acetate (Ma) have been popularly chosen as additives for EC-based electrolytes.2,5–9 As a representative example, adding Ma into an EC-based electrolyte enhanced the discharge capacity at −20 °C from 75% of stored charge to 90% at 0.1 C6 or 50–90% at 1 C.2 However, the Ma-containing electrolyte showed poor cycle retention at room temperature.2 Without the help of esters, the low-temperature operations were enhanced at low discharge rates by optimizing the formulation of carbonate-based electrolytes by way of increasing low-Tf carbonates and decreasing EC.10–12 The use of BF4− instead of PF6− was helpful for improving the capacity at −20 °C with a less than 5% capacity increase at 0.5 C.13 In most of the works reported, cells were tested only at low discharge rates. The cell test data were not reported at C rates higher than 1 C.
In case of focusing on enhancing the low-temperature behavior of electrolytes, the Tf value of the chosen co-solvent is the main criterion. However, the property is helpful just as the initial screening parameter. It should be considered whether a mixture of chosen co-solvents and EC shows eutectic behaviour leading to a Tf of the mixture lower than that of each constituent.14,15 A single Tf is observed at the eutectic composition whereas multiple Tf values are measured at other compositions.
In this work, we present an EC-based eutectic electrolyte containing nitriles16–18 showing significantly enhanced charge and discharge characteristics at −20 °C and high rates up to 3 C. As far as we know, this is the first work reporting the meaningful enhancement of low-temperature behaviours at such a high C-rate. The rate capability and cyclability of full cells including our electrolytes at room temperature were not sacrificed.
2. Experimental
2.1. Electrolytes
The solvent compositions of the electrolytes are summarized in Table 1. LED was used as a control. Three different nitriles with carbon number variation (CnH2n+1CN with n = 1–3) were used. 1 M LiPF6 was used for all electrolytes. 2 wt% of FEC (fluoroethylene carbonate) (Solvay Fluor) was used as an SEI-forming agent for the cell tests. All solvents (Sigma Aldrich) were used as received.2.2. Physical properties
The ionic conductivity of the electrolytes was measured using a conductivity meter (Mettler-Toledo, SevenMulti with an InLab 710 platinum 4-pole conductivity probe). Connection of the probe with sample containers was tightly sealed with Teflon tape to prevent moisture contamination of the samples. The viscosity of the electrolytes was measured using a viscometer (Brookfield, DV-III U with an SC4-18 spindle). During both measurements, the temperature of the electrolytes was controlled between −20 °C and 60 °C. Each measurement was done at thermal equilibration.2.3. Differential scanning calorimetry (DSC)
The freezing points of the electrolyte mixtures in the absence and presence of lithium salt were measured at 5 °C min−1 under nitrogen atmosphere by DSC (TA instruments, Q2000). Aluminium hermetic pans were used as the sample holders. Samples were cooled down to −90 °C and then heated to a higher temperature up to 50 °C.2.4. Cooling bath mixtures
Ethanol was supplied continuously into liquid nitrogen in a Dewar flask. The temperature was monitored using a K-type thermocouple connected to a digital indicator. Electrolyte in a polypropylene bottle (Nalgene) was stored in the cooling bath for 5 min or longer after the temperature of interest (−110 °C and −120 °C) was stabilized. The phase (liquid or frozen) was checked just after the electrolyte-containing bottle was brought out of the Dewar flask.2.5. Cell preparation
3.5 mA·h coin-type cells and 580 mA·h 21-stack pouch-type cells were prepared for testing the full cells. Commercially available lithium nickel cobalt aluminium oxide (NCA; Ecopro, NCA021) and artificial graphite (Sumitomo, SUA) were used as the active materials of the cathode and anode, respectively. A porous polyethylene separator (Tonen, F16BME) was used. Cathodes were prepared by mixing NCA with 5 wt% carbon black (TIMCAL, Super-P) and 3 wt% poly(vinylidene difluoride) (PVDF) (Kureha, KF7208). Anodes were prepared by slurrying artificial graphite powder with 7 wt% PVDF (Kureha, KF9130). The slurries were coated onto aluminium foil for cathodes or copper foil for anodes, followed by drying at 100 °C under vacuum for 12 h.2.6. Cell tests
Cells were galvanostatically charged to 4.3 V and then potentiostatically charged at 4.3 V when the current reached 5% of the charging current. Then, they were discharged to 3 V or 2.7 V galvanostatically. The potentiostatic charging step was omitted when investigating the charge characteristics. A battery tester (ETH, HC606 or WonATech, WBCS3000) was used for charging or discharging the battery cells.3. Results and discussion
3.1. Transport properties of electrolytes
Nitriles were chosen as the assistant solvent candidates to improve the low-temperature operation of the LIBs from the viewpoints of three intrinsic properties (Table 2). They are frozen at low temperature, around −100 °C (except for An), whereas their boiling point is as high as around +100 °C. The viscosity of the nitriles is lower than that of DMC, a linear carbonate. In addition, the ε values of the nitriles provide a possibility that ionic salts are dissociated in nitriles to a degree lower than with cyclic carbonates but much higher than for linear carbonates. When compared with the properties of Ma that has been used as a low-Tf solvent, the nitriles show higher Tb and ε values as well as similar Tf and η.| Code | T f/°C | T b/°C | η RT/cP | ε RT |
|---|---|---|---|---|
| a T f and Tb = freezing and boiling point temperatures, respectively. ηRT = viscosity at RT. εRT = dielectric constant at RT. RT = room temperature (25 °C). b Measured at 40 °C. | ||||
| EC | 36.4 | 248 | 1.90b | 89.78 |
| PC | −48.8 | 242 | 2.53 | 64.92 |
| DMC | 4.6 | 91 | 0.59 | 3.107 |
| Ma | −96 | 56 | 0.368 | 6.67 |
| An | −46 | 81 | 0.343 | 37.5 |
| Pn | −100 to −86 | 97 | 0.411 | |
| Bn | −112 | 118 | 0.515 | 20.7 |
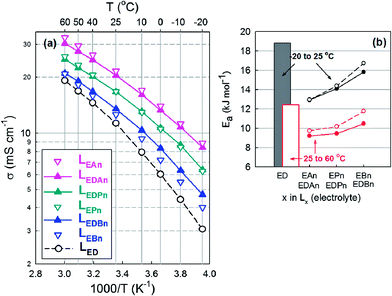
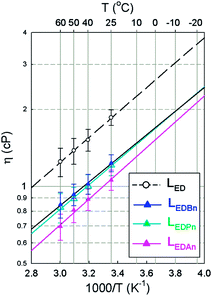
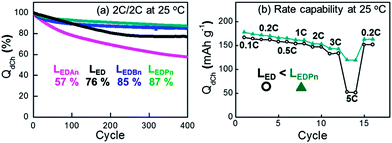
By introducing the nitriles into a mixture of EC and DMC (LED), the values of σi were improved significantly (Fig. 1a). At room temperature, σi increased from 11.33 mS cm−1 (LED) to 20.5 (LEDAn), 16.73 (LEDPn) or 13.53 (LEDBn). At −20 °C, σi = 3.07 mS cm−1 (LED) increased to 8.41 (LEDAn), 6.39 (LEDPn) or 4.7 (LEDBn). Along the length of the alkyl chain of the nitriles, σi decreased at least partly due to their η (Fig. 2). The activation energy (Ea), estimated from Arrhenius plots of σi as a function of temperature, supports the dependency of σi on the solvents (Fig. 1b). The ternary mixture systems consisting of EC, DMC and nitriles were preferred to their binary counterpart of EC and nitriles in this work because the ternary mixtures showed lower activation energies.
3.2. Cell performances at low temperature
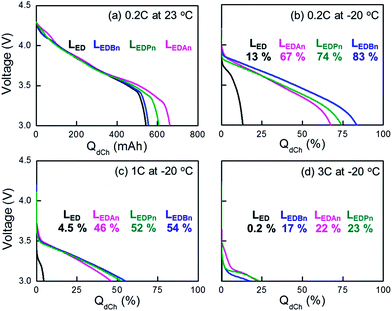
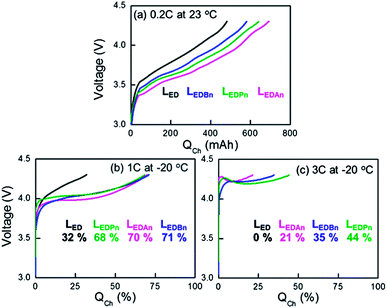
Pouch-type full cells were discharged or charged at −20 °C after they were fully charged or discharged at 0.2 C at room temperature, respectively (Fig. 3 and Fig. 4). 2 wt% FEC was added to the electrolytes. The capacities at −20 °C (QLT) were normalized by the capacity at 0.2 C at room temperature (QRT/0.2 C in Fig. 3a or 4a). At room temperature with 0.2 C discharge, the initial IR drops were not significantly different between the electrolytes, including even the control (Fig. 3a). At the latter part of discharge, however, more conductive electrolyte provided more extra capacity. It is unclear why higher capacities than the designed value (580 mA·h) were obtained with LEDPn and LEDAn. The overestimated capacities were not due to capacity deviation between the cells, which is confirmed by using at least five cells for the same experiments. On the other hand, higher charge capacities and smaller IR rise were obtained with higher-conductivity electrolytes for charging at 0.2 C at room temperature.At −20 °C, the nitrile-assistant electrolytes delivered significantly enhanced capacities at all discharge and charge rates, compared with LED as the control electrolyte. With the control electrolyte, cells did not work at 1 C and 3 C during discharge (Fig. 3c and 3d) and at 3 C during charge (Fig. 4b and 4c). A large difference of capacities was not observed between nitrile-assistant electrolytes at both charges and discharges except for the high-rate charge at 3 C at −20 °C (Fig. 3c). The Pn-containing electrolyte (LEDPn) was the best choice of electrolyte when the charge capacity at 3 C was considered (Fig. 4c).
At low-temperature operations with high C-rates, it looks evident that the initial IR drop or rise (ΔIR) is at least one of the most serious factors to affect the cell performance. The abrupt potential change at initial discharge or charge processes makes the operating potential window narrower so that the cell potential reaches a cut-off potential before cells deliver or acquire their available capacity completely. With increasing C-rates at −20 °C, the ΔIR of LEDAn increased from 0.3 V at 0.2 C to 0.8 V at 3 C during discharge. The values became much more amplified with the control LED: 0.5 V at 0.2 C to >1.3 V at 3 C. The IR drop cannot be explained only by ionic conductivity. Although the difference of σi between LED and LEDBn is smaller than between LEDBn and LEDAn, there is a larger difference between the control and LEDBn in terms of the IR drop whereas no significant gap was found within the nitrile-assistant electrolytes. In addition to the initial potential change, the shape of the potential profiles is different between LED and the nitrile-containing electrolytes. Faradaic reaction proceeded to at plateau (relatively less sloping) region only during a very short period in the control. That is to say, the potential shift caused by the IR drop cannot be totally responsible for the capacity decrease. Nitrile-assistant electrolytes could enhance concentration polarization as well as the ohmic polarization. We reported that cyano-resins containing nitrile groups can solve mass transfer problems due to their high transference number of lithium ions.19
3.3. Cell performances at room temperature
Subsequent to the cryogenic experiments, cell performances were checked at room temperature (Fig. 5). The difference between nitrile-assistant electrolytes, which was not clearly recognized in the low-temperature operations, was observed in the room-temperature tests. An, the smallest nitrile used in this work, showed a critically poor cycle retention whose capacity decayed to 57% of the initial capacity after 400 cycles. Pn- or Bn-containing electrolytes were superior to the control in terms of the cycle retention. LEDPn, the electrolyte regarded as the best nitrile in this work, showed critically enhanced performances at a fast discharge (5 C in Fig. 5b). There is every possibility that cryogenic performances are closely related to high rate performances at room temperature. Fast conduction as well as facile mass transfer would be a key factor to govern the low temperature or high rate operations.In addition to performances at room temperature, the stability of the electrolytes at high temperature, such as 60 °C, was investigated in our preliminary experiments. Pouch-type full cells of NCA/graphite showed a similar capacity decay along cycles for both the nitrile-assistant electrolyte (LEDPn) and the control electrolyte (LED). The poor capacity retention is not due to the nitrile but at least partly due to the instability of NCA at high temperatures.20,21 With LiNi0.5Mn0.3Co0.2O2 as a more stable cathode material at 60 °C, there were no deteriorating effects of the nitriles on the capacity retention observed.
3.4. Eutectic behavior of electrolytes
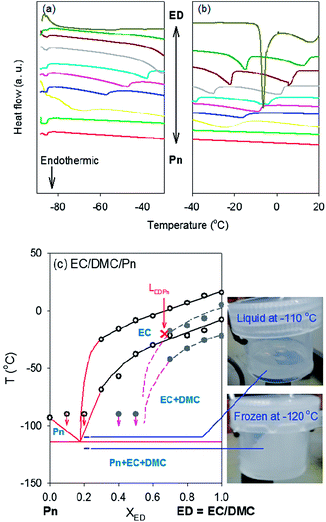
EC is a solid at room temperature (Tf = 36.4 °C). However, its mixtures with linear carbonates are in the liquid phase because they form a eutectic mixture, the melting or freezing point of which goes down to lower temperature.22,23 To investigate the eutectic properties, the phase diagram of LEDPn was built by recording endothermic peak temperatures in thermograms obtained by DSC (Fig. 6). The composition between Pn and ED (= 1![[thin space (1/6-em)]](https://www.rsc.org/images/entities/char_2009.gif) :
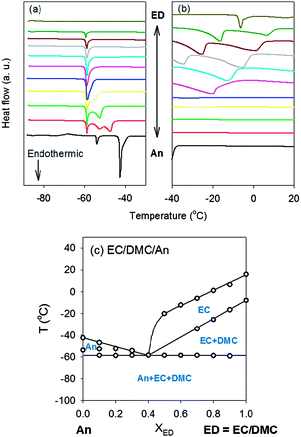
:![[thin space (1/6-em)]](https://www.rsc.org/images/entities/char_2009.gif) 1 vol% EC/DMC) was changed. Samples were cooled down to −90 °C due to the limit of our instrument so that peaks were not measured below −90 °C. The melting point of pure Pn (the red curves in Fig. 6a and 6b) was not measured because it is below the temperature limit of our DSC (Table 2). Two endothermic peaks were observed between 0% and 70% Pn (or 100% and 30% EC/DMC). However, there were no transitions for the other compositions (0% to 30% EC/DMC) above −90 °C. Using only the experimental data (open symbols and black lines), it was difficult to draw the phase boundary including the solidus line and identify the solid phase in each region. To get a picture of the phase diagrams of the mixture between nitriles and EC/DMC, we selected An as another nitrile. An is a model system appropriate for our instrument because its Tf (−46 °C) can be measured.
1 vol% EC/DMC) was changed. Samples were cooled down to −90 °C due to the limit of our instrument so that peaks were not measured below −90 °C. The melting point of pure Pn (the red curves in Fig. 6a and 6b) was not measured because it is below the temperature limit of our DSC (Table 2). Two endothermic peaks were observed between 0% and 70% Pn (or 100% and 30% EC/DMC). However, there were no transitions for the other compositions (0% to 30% EC/DMC) above −90 °C. Using only the experimental data (open symbols and black lines), it was difficult to draw the phase boundary including the solidus line and identify the solid phase in each region. To get a picture of the phase diagrams of the mixture between nitriles and EC/DMC, we selected An as another nitrile. An is a model system appropriate for our instrument because its Tf (−46 °C) can be measured.
With An, we successfully built the phase diagram of the mixture between An and EC/DMC (Fig. 7). Around 60% An (XED = 0.4), the eutectic point was observed. The solidus line (horizontal line in Fig. 7c), below which all components are in the solid phase, was located at −60 °C. Components indicated in the figure are solid phases in their corresponding regions. For example, a fraction of EC and DMC exists as a solid at XED = 0.8 and T = −40 °C. Beyond the liquidus lines, all components are in the liquid phase.
With lessons from the phase diagram of EC/DMC/An, we re-built that of the Pn-containing solvent mixture by using the expected lines (red lines in Fig. 6c). The expected lines were drawn in a way to satisfy all the experimental data. At XED = 0.1 and 0.2, the lines should go below −90 °C because no endothermic peaks were observed. Our guess on the eutectic point is at ∼80% Pn (XED = 0.2) and a temperature between −110 °C and −120 °C. To confirm the eutectic temperature, the phase of LEDPn was checked by immersing the electrolyte in cooling bath mixtures consisting of liquid nitrogen and ethanol. The electrolyte solvent was frozen at −120 °C whereas the liquid state was maintained at −110 °C (photos of Fig. 6c). Additionally, the eutectic point was estimated at XED = 0.3 and T = −145 °C by calculation based on a thermodynamic relationship between the composition and temperature:24 ln![[thin space (1/6-em)]](https://www.rsc.org/images/entities/char_2009.gif) fi = (−Hi°/R)(1/T − 1/Ti°) with i = component, f = mole fraction, H° = enthalpy of fusion, T° = melting point of pure component and R = ideal gas constant. The enthalpy values were obtained from the MOLINSTINCTS database and the mole fraction (fi) was converted to the volume fraction (Xi) using the densities and molecular weights of the components. The eutectic composition estimated at 70% Pn (30% EC/DMC) by the calculation should be questioned because two endothermic peaks were observed experimentally. However, the calculated values support our estimated eutectic point of the tri-component solvent mixture being around the true eutectic composition and temperature.
fi = (−Hi°/R)(1/T − 1/Ti°) with i = component, f = mole fraction, H° = enthalpy of fusion, T° = melting point of pure component and R = ideal gas constant. The enthalpy values were obtained from the MOLINSTINCTS database and the mole fraction (fi) was converted to the volume fraction (Xi) using the densities and molecular weights of the components. The eutectic composition estimated at 70% Pn (30% EC/DMC) by the calculation should be questioned because two endothermic peaks were observed experimentally. However, the calculated values support our estimated eutectic point of the tri-component solvent mixture being around the true eutectic composition and temperature.
In addition to the solvent phase boundary, the phase boundary of the electrolyte was partly constructed from the endothermic peaks of solvent mixtures with lithium salt (grey solid symbols in Fig. 6c). Freezing point depression was observed with LEDPn in the presence of LiPF6. No endothermic peaks of the salt-containing electrolyte were observed beyond −90 °C at XED < 0.5. For comparison, the critical composition below which no peaks are observed in the DSC thermograms was XED = 0.2 for LEDPn without lithium salt. It is clear that introducing the lithium salt into LEDPn extended the liquid phase region to lower temperature at all compositions, even if the eutectic point of the salt-containing LEDPn was difficult to estimate due to the cooling limitation of our DSC instrument. The composition of LEDPn at −20 °C in this work is located nearby the liquidus line within the all-liquid region (red × symbol in Fig. 6c). Therefore, we have an additional extra compositional margin for formulating electrolytes for ultra-cryogenic applications. More Pn-rich compositions bring two benefits: not only extending the temperature range within which only the liquid phase exists, but also decreasing the viscosity. However, disadvantages introduced by using a higher amount of Pn should be considered. There is the possibility of a decrease in the solvation ability of the solvent mixture at the more Pn-rich composition compared with that of the composition used in this work (red × in Fig. 6c). Side-reactions, especially on anodes at high temperatures, should be considered. Also, too small an amount of EC is not unfavored in terms of the SEI layer formation. At least at −20 °C, therefore, the composition (EC/DMC/Pn = 1![[thin space (1/6-em)]](https://www.rsc.org/images/entities/char_2009.gif) :
:![[thin space (1/6-em)]](https://www.rsc.org/images/entities/char_2009.gif) 1
1![[thin space (1/6-em)]](https://www.rsc.org/images/entities/char_2009.gif) :
:![[thin space (1/6-em)]](https://www.rsc.org/images/entities/char_2009.gif) 1) can be considered as a more optimized value than the eutectic composition.
1) can be considered as a more optimized value than the eutectic composition.
3.5. Decreasing cut-off voltage during discharge as a possible scenario
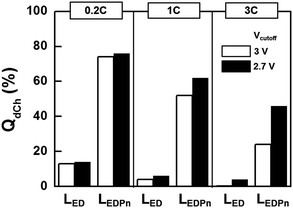
Potential profiles of NCA||graphite during discharge consist of a sloping Faradaic region followed by an abrupt fall-down of potential at room temperature with low C-rate (Fig. 3a). The potential drop in the latter part of the discharge is brought about because no more Faradaic reactions are available. As higher C-rates were used for discharging the cells, the potential drop at the end of the discharge is difficult to observe (Fig. 3b–d). The cell potentials would reach cut-off voltages earlier before Faradaic reactions were fully utilized.If the capacities obtained at −20 °C with high C-rates by using nitrile-assistant electrolytes in this work were not satisfactory, we would need to adopt an additional strategy. The cut-off voltage for discharge (Vcutoff) can be practically lowered, to at least 2.7 V. We compared capacities between two different Vcutoff values: 3 V as a conventional value that is used above in this work and 2.7 V (Fig. 8). At a slow discharge such as 0.2 C, the change of Vcutoff did not lead to a capacity enhancement because every electroactive mass was already completely utilized. The enhancement factor of the capacity dramatically increased as the discharge rates were increased. At −20 °C with 3 C, capacities increased two-fold with Vcutoff = 2.7 V. A fraction of unreacted mass is utilized additionally in the extra 0.3 V margin. We believe it is practically meaningful that 50% of the available capacity is deliverable at such a high rate (3 C) under such a cryogenic condition (−20 °C).
4. Conclusions
In this work, we proposed the use of nitriles as a co-solvent in EC-based electrolytes to enhance the LIB performances at cryogenic conditions, specifically at −20 °C. Pn and Bn (CnH2n+1CN with n = 2 and 3, respectively) were expected to be a proper solvent for cryogenic electrolytes, based on their basic properties such as high conductivity, low viscosity, low freezing point and high boiling point. Introduction of Pn or Bn to EC-based electrolytes enhanced not only the cryogenic performance significantly but also the cycle retention and rate capability at room temperature. For example, the Pn-containing electrolyte delivered 50% of available capacity at −20 °C and 3 C discharge rate with 2.7 V cut-off. The composition of LEDPn used in this work was estimated as the optimized composition at −20 °C after the phase diagram of the tertiary mixture was considered. The point at (33% Pn, −20 °C) in the phase diagram was located just beyond the liquidus line of the solvent, that is to say, within an all-liquid region. More severe cryogenic conditions can be managed by the composition due to freezing point depression caused by lithium salt in the electrolyte.Acknowledgements
Y.-G.C. and Y.-S.K. contributed equally to this work. This work was supported by MOTIE (Green: 10042948 (KEIT)), MSIP (Mid: 2013R1A2A2A04015706 (NRF), CRC: 2013K000210) and MOE (BK21Plus: 10Z20130011057), Korea.Notes and references
- T. H. Kim, J. S. Park, S. K. Chang, S. Choi, J. H. Ryu and H. K. Song, Adv. Energy Mater., 2012, 2, 860–872 CrossRef CAS.
- S. V. Sazhin, M. Y. Khimchenko, Y. N. Tritenichenko and H. S. Lim, J. Power Sources, 2000, 87, 112–117 CrossRef CAS.
- K. L. Gering, ECS Trans., 2006, 1, 119–149 CAS.
- N. Kamaya, K. Homma, Y. Yamakawa, M. Hirayama, R. Kanno, M. Yonemura, T. Kamiyama, Y. Kato, S. Hama, K. Kawamoto and A. Mitsui, Nat. Mater., 2011, 10, 682–686 CrossRef CAS PubMed.
- M. C. Smart, B. V. Ratnakumar, S. Surampudi, Y. Wang, X. Zhang, S. G. Greenbaum, A. Hightower, C. C. Ahn and B. Fultz, J. Electrochem. Soc., 1999, 146, 3963–3969 CrossRef CAS.
- H. C. Shiao, D. Chua, H. P. Lin, S. Slane and M. Salomon, J. Power Sources, 2000, 87, 167–173 CrossRef CAS.
- M. C. Smart, B. V. Ratnakumar and S. Surampudi, J. Electrochem. Soc., 2002, 149, A361–A370 CrossRef CAS.
- M. C. Smart, B. V. Ratnakumar, K. B. Chin and L. D. Whitcanack, J. Electrochem. Soc., 2010, 157, A1361–A1374 CrossRef CAS.
- M. C. Smart, B. L. Lucht, S. Dalavi, F. C. Krause and B. V. Ratnakumar, J. Electrochem. Soc., 2012, 159, A739–A751 CrossRef CAS.
- M. C. Smart, B. V. Ratnakumar, L. D. Whitcanack, K. B. Chin, S. Surampudi, H. Croft, D. Tice and R. Staniewicz, J. Power Sources, 2003, 119–121, 349–358 CrossRef CAS.
- L. Wang, Y. Huang and D. Jia, Solid State Ionics, 2006, 177, 1477–1481 CrossRef CAS.
- M. C. Smart, B. V. Ratnakumar, A. Behar, L. D. Whitcanack, J. S. Yu and M. Alamgir, J. Power Sources, 2007, 165, 535–543 CrossRef CAS.
- S. S. Zhang, K. Xu and T. R. Jow, J. Solid State Electrochem., 2003, 7, 147–151 CrossRef CAS.
- M. S. Ding and T. R. Jow, J. Electrochem. Soc., 2005, 152, A1199–A1207 CrossRef CAS.
- V. Ruiz, T. Huynh, S. R. Sivakkumar and A. G. Pandolfo, RSC Adv., 2012, 2, 5591–5598 RSC.
- H. Duncan, N. Salem and Y. Abu-Lebdeh, J. Electrochem. Soc., 2013, 160, A838–A848 CrossRef CAS.
- Y. Abu-Lebdeh and I. Davidson, J. Electrochem. Soc., 2009, 156, A60–A65 CrossRef CAS.
- Y. Abu-Lebdeh and I. Davidson, J. Power Sources, 2009, 189, 576–579 CrossRef CAS.
- Y. S. Kim, Y. G. Cho, D. Odkhuu, N. Park and H. K. Song, Sci. Rep., 2013, 3, 1917 Search PubMed.
- S. H. Lee, C. S. Yoon, K. Amine and Y. K. Sun, J. Power Sources, 2013, 234, 201–207 CrossRef CAS.
- S. M. Bak, K. W. Nam, W. Chang, X. Q. Yu, E. Y. Hu, S. Hwang, E. A. Stach, K. B. Kim, K. Y. Chung and X. Q. Yang, Chem. Mater., 2013, 25, 337–351 CrossRef CAS.
- M. S. Ding, K. Xu and T. R. Jow, J. Electrochem. Soc., 2000, 147, 1688–1694 CrossRef CAS.
- M. S. Ding, K. Xu, S. S. Zhang and T. R. Jow, J. Electrochem. Soc., 2001, 148, A299–A304 CrossRef CAS.
- L. Brunet, J. Caillard and P. André, Int. J. Mod. Phys. C, 2004, 15, 675–687 CrossRef CAS.
| This journal is © The Royal Society of Chemistry 2014 |

