
 Open Access Article
 This Open Access Article is licensed under a
 Creative Commons Attribution 3.0 Unported Licence
New PtII diimine–dithiolate complexes containing a 1,2-dithiolate-1,2-closo-dicarbadodecarborane: an experimental and theoretical investigation†
Anna
Pintus
a,
M. Carla
Aragoni
a,
Simon J.
Coles
 b,
Susanne L.
Coles (née Huth)
b,
Francesco
Isaia
a,
Vito
Lippolis
a,
Ana-Daniela
Musteti
c,
Francesc
Teixidor
c,
Clara
Viñas
c and
Massimiliano
Arca
*a
b,
Susanne L.
Coles (née Huth)
b,
Francesco
Isaia
a,
Vito
Lippolis
a,
Ana-Daniela
Musteti
c,
Francesc
Teixidor
c,
Clara
Viñas
c and
Massimiliano
Arca
*a
aDipartimento di Scienze Chimiche e Geologiche, Università degli Studi di Cagliari, S.S. 554 bivio per Sestu, 09042 Monserrato, CA, Italy. E-mail: marca@unica.it
bDepartment of Chemistry, Faculty of Natural and Environmental Sciences, University of Southampton, Highfield, Southampton SO17 1BJ, UK
cInstitut de Ciència de Materials de Barcelona (ICMAB-CSIC), Campus UAB, 08193 Bellaterra, Spain
First published on 7th August 2014
Abstract
Five new [Pt(N^N)(dtoc)] complexes (1–5; N^N = diimine: 2,2′-bipyridine and its 4,4′-alkyl/aryl-substituted derivatives or 1,10-phenanthroline; dtoc2− = 1,2-dithiolate-1,2-closo-dicarbadodecaborane) have been synthesized and characterized by spectroscopic and electrochemical methods, and by means of X-ray diffraction in the case of complexes 1 and 4. Hybrid DFT and time-dependent (TD) DFT calculations were performed on complexes 1–5 and the previously reported complex [Pt(Ph2phen)(dtoc)] (6; Ph2phen = 4,7-diphenyl-1,10-phenanthroline) both in the gas phase and in the presence of several solvents (CH2Cl2, CHCl3, CH3CN, acetone, THF, DMF, DMSO, and toluene) to gain an insight into the electronic structure of the complexes and explain their experimental features. Theoretical calculations allowed for the determination of structure–property relationships within the series of the six complexes considered, and the prediction of their second order nonlinear optical (SONLO) properties by evaluating their first static hyperpolarizabilities (βtot).
Introduction
Since the first reports by Miller and Dance in 1973,1 diimine–dithiolate metal complexes [M(N^N)(S^S)] have received a great deal of attention. These systems have been, in fact, applied to second order nonlinear optics (SONLO),2,3 dye-sensitized solar cells,4–8 light-to-chemical energy conversion,9,10 DNA intercalation,11,12 and as conducting13 and magnetic14 materials or sensors.15 Such a variety of potential applications arise from their peculiar electronic features. In fact, [M(N^N)(S^S)] complexes undergo reversible electrochemical processes16 and show large molecular hyperpolarizabilities,17 room-temperature luminescence in solution,18,19 and a peculiar intense (molar extinction coefficient ε up to 104 M−1 cm−1) solvatochromic absorption in the vis-NIR region.20,21 This absorption, thoroughly investigated in the past by both experimental and theoretical means,22 was assigned to a charge-transfer (CT) transition occurring from the HOMO, mainly localized on the S^S ligand and partly on the central metal ion, to the LUMO, centred on the diimine N^N.23 The nature of this transition, often described as a mixed-metal/ligand-to-ligand charge-transfer (MMLL'CT),24 accounts for the negative solvatochromism featured by the corresponding absorption, since it generates an excited state, which is less polar or polarized in the opposite direction with respect to the ground state.25Starting from the pioneering work carried out by Eisenberg and co-workers in the 1990s,26,27 a large number of diimine–dithiolate complexes have been reported, mainly featuring PtII as a central metal ion. The possibility of tuning both the electrochemical and photophysical properties of these chromophores by systematically varying both the central metal ion28 and the S^S and N^N ligand29 was distinctly proved. In this context, some of the authors recently reported on a series of new PtII diimine–dithiolate complexes featuring differently functionalized 1,2-dithiolato ligands belonging to the classes of R-edt2− (monosubstituted ethylene-1,2-dithiolates; R = phenyl, 2-naphtyl, 1-pyrenyl)30,31 and R-dmet2− (N-substituted 2-thioxo-1,3-thiazoline-4,5-dithiolates; R = methyl, ethyl, phenyl),32,33 along with variously alkyl- and aryl-substituted 2,2′-bipyridine and 1,10-phenanthroline ligands, thus showing the possibility of fine-tuning the linear and nonlinear optical properties of these systems.34
The twelve-vertex 1,2-closo-C2B10H12 icosahedral carborane has been widely studied.35 The unique stabilities and geometrical properties of the isomeric closo C2B10H12 carboranes suggested this species as a building block for stereo precise structural platforms with novel reaction centres having properties that cannot be achieved with organic hydrocarbon compounds.36 In addition, the 1,2-closo-C2B10H12 cluster is electron-withdrawing through the carbon atoms37 and electron donating through the boron atoms. Consequently, when sulphur atoms are bonded to the carbon cluster atoms, as in the dithiol 1,2-(SH)2-closo-C2B10H10 (H2dtoc), the electron density will be depleted on them, thus varying the potentials required for the electrochemical reduction of the corresponding complexes.38 In particular, as far as diimine–dithiolate systems are concerned, it is reasonable to assume that more strong electron-deficient39 moieties such as the 1,2-closo-C2B10H12 cluster could affect the electrochemical and optical properties of these complexes with respect to those obtained with organic dithiolates.
In this context, we report on the synthesis, characterization and DFT investigation of five new [Pt(N^N)(S^S)] complexes featuring the 1,2-dithiolato-1,2-closo-dicarbadodecaborane ligand (dtoc2−),40 in combination with differently substituted 2,2′-bipyridine and 1,10-phenanthroline derivatives. The properties of the newly synthesized complexes were compared with those based on organic ethylene-1,2-dithiolates30–33 and with [Pt(Ph2phen)(dtoc)] (Ph2phen = 4,7-diphenyl-1,10-phenanthroline), the only example of a [Pt(N^N)(S^S)] complex featuring the dtoc2− ligand reported so far.41–43
Results and discussion
Synthesis
In the present study, five new complexes belonging to the general class [Pt(N^N)(dtoc)] were synthesized following the general preparation method for [Pt(N^N)(S^S)] systems,1 which exploits the reaction of the desired S^S dithiolato ligand with a metal precursor of the type [PtCl2(N^N)] (Scheme 1).44,45 In particular, the diimines N^N = 2,2′-bipyridine (bipy), 1,10-phenanthroline (phen), 4,4′-dimethyl-2,2′-bipyridine (Me2bipy), 4,4′-di(tert-butyl)-2,2′-bipyridine (tBu2bipy), and 4,4′-diphenyl-2,2′-bipyridine (Ph2bipy) were employed for the synthesis of the corresponding [PtCl2(N^N)] complexes, which were reacted with the 1,2-dithiolate-1,2-closo-dicarbadodecarborane ligand (generated in situ by the deprotonation of the corresponding dithiol H2dtoc)35b to afford the desired [Pt(N^N)(dtoc)] complexes 1–5.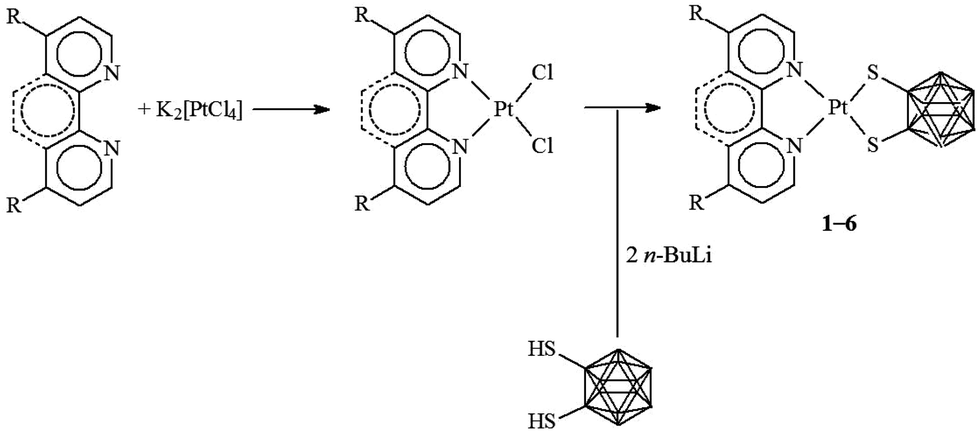 | ||
| Scheme 1 General pathway for the synthesis of [Pt(N^N)(dtoc)] complexes 1–6. N^N = bipy (1), phen (2), Me2bipy (3), tBu2bipy (4), Ph2bipy (5), and Ph2phen (6). | ||
Crystallographic studies
X-ray diffraction quality single crystals were successfully grown for complexes 1 and 4 (Fig. 1 and Table S1 in ESI†). The platinum atom is coordinated in both complexes by the two diimine N atoms and the two S atoms of the dtoc2− ligand in a distorted square planar cis-“S2N2” configuration. The Pt–N and Pt–S bond lengths closely resemble the values found in two similar bis-monothiolato o-carborane platinum complexes containing 2,2′-bipiridine46 and substituted 1,10-phenantroline ligands,41,43 and are in the range of bond lengths typical for other PtII diimine–dithiolate systems structurally characterized so far [2.045(16) and 2.239(16) Å, respectively].47 | ||
| Fig. 1 ORTEP drawing of complexes 1 (top) and 4 (bottom) showing the atom-labeling scheme. Thermal ellipsoids are drawn at the 60% probability level. Hydrogen atoms have been omitted for clarity. For complex 1: Pt–S(1) 2.2725(17), Pt–S(2) 2.2789(16), Pt–N(1) 2.057(6), Pt–N(2) 2.055(6), S(1)–C(1) 1.777(7), S(2)–C(2) 1.790(7), C(1)–C(2) 1.638(9) Å; S(1)–Pt–S(2) 92.35(6), N(1)–Pt–N(2) 79.8(2), N(1)–Pt–S(2)–C(2) 174(2)°. For complex 4: Pt–S(1) 2.2686(4), Pt–N(1) 2.046(4), S(1)–C(1) 1.796(5), C(1)–C(1)′ 1.631(10) Å; S(1)–Pt–S(1)′ 92.19(7), N(1)–Pt–N(1)′ 78.6(2)°. ′ = 1 − x, 1/2 − y, z. | ||
Analogously, C–S and C–C bond lengths within the dtoc2− ligand in complexes 1 and 4 are very close to the mean values found in the Cambridge Structural Database (CSD) for complexes featuring dtoc2− as a bidentate ligand coordinated to a single transition metal ion [1.782(9) and 1.652(20) Å, respectively],48 and only slightly different from the Ccarborane–thiol and the skeletal C–C bond distances found in the carboranyl sulphide anion [1,2-S(Ph)C2B10H10]−.49 The dithiol-o-carborane forms in both cases a five membered chelate ring, with S–Pt–S/N–Pt–N angles of 92.35(6)/79.8(2) and 92.19(7)°/78.6(2)° for complexes 1 and 4, respectively, which fall within the expected ranges.50
In complex 4 the bipyridyl ligand lies in the PtN2S2 coordination plane, and a mirror plane bisects the molecule by passing through the bond joining the two pyridine rings, the platinum ion, and the C–C bond of carborane. Complex 1 displays a similar arrangement of the bipyridyl ligand, which however slightly deviates from planarity [dihedral angle N(1)–Pt–S(2)–C(2) = 173.92°; Fig. 1]. Both complexes 1 and 4 are packed in a head-to-tail fashion to form columnar structures along axis a and b respectively, but they differ in the nature of the interactions involved. In complex 1 short intermolecular Pt⋯C contacts align the complex molecules in pillars developing along the direction of the a-axis with alternating Pt⋯C distances of 3.395(8) and 3.530(8) Å (Fig. 2).51 Similar short contacts have been explained with a weak axial interaction between the filled dz2 orbital of platinum and the π* antibonding orbital of the involved C atoms in the bipyridyl ring.52 Weak intermolecular interactions involving the B atoms of the dtoc2− ligand and the H atoms of both ligands hold the stacks together [B(6)⋯H(11) 3.180, B(10)⋯H(7A) 3.163, B(7)⋯H(6) 2.884, B(3)⋯H(6) 3.179, B(2)⋯H(6) 3.039, B(9)⋯H(11) 3.134 Å].
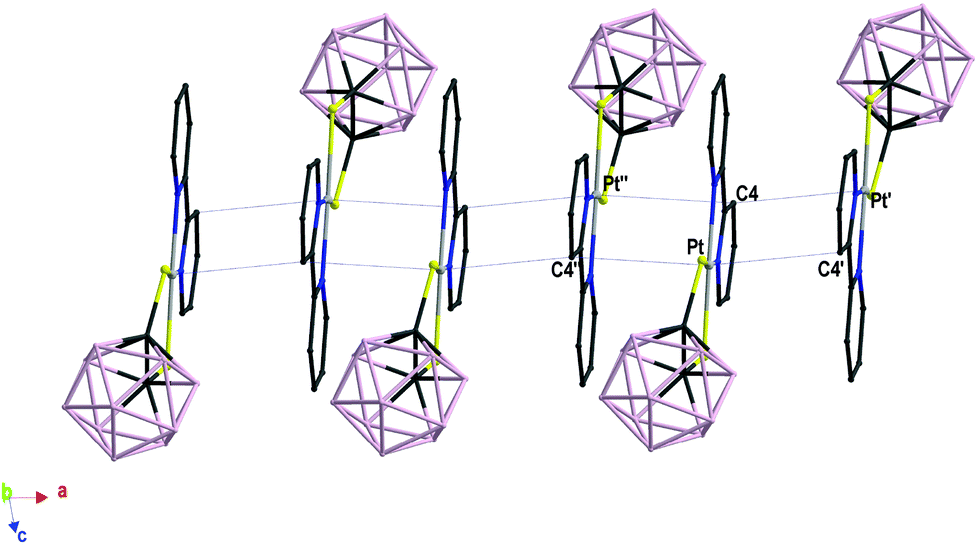 | ||
| Fig. 2 Packing views of the columnar arrangement in complex 1. Alternate short and long contacts in complex 1: Pt⋯C4′ 3.395(8), Pt⋯C4′′ 3.530(8) Å (′ 2 − x, 1 − y, −z; ′′ 1 − x, 1 − y, −z). Hydrogen atoms have been omitted for clarity. | ||
In complex 4 the molecules are aligned into mono-dimensional columns running along the crystallographic a-axis through extensive face-to-face π–π interactions involving both rings of bipy moieties with stacking distances of 3.89 Å, though no interactions involving the platinum ions can be evidenced. Weak interactions involving the H atoms of the tert-butyl substituents of the 2,2′-bipyridines and the B atoms of the dtoc2− ligand [B(1)⋯H(14B) 3.034, B(3)⋯H(14B) 3.138, B(4)⋯H(14B) 3.137 Å] are responsible for the 3D packing of the columns. It is noteworthy, probably due to the bulky substituents at the pyridine rings, that the structure of 4 contains solvent accessible channels running along the b-axis (376.16 Å3, 12.6% of the cell volume, Fig. 3).53
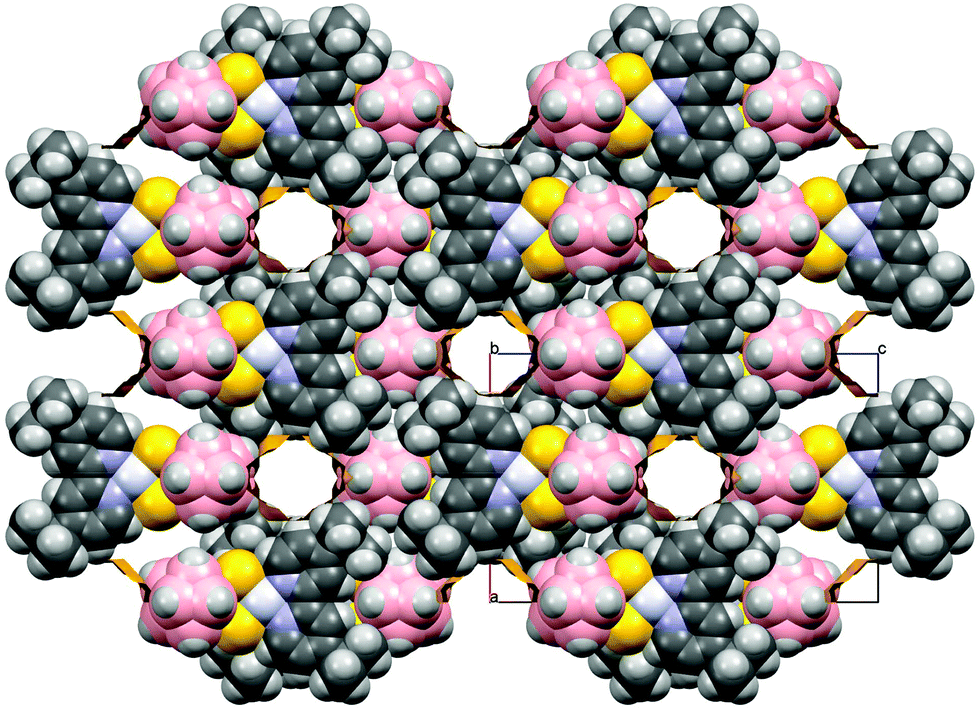 | ||
| Fig. 3 Space fill style view evidencing the void channels in the packing of complex 4. | ||
Electrochemistry
Cyclic voltammetry (CV) measurements (Table 1) performed in dry DMSO showed that complexes 1–6 feature monoelectronic reversible (iIpc/iIpa values in the range 0.8–1.3) reduction processes (EI1/2) between −1.709 and −1.536 V vs. Fc+/Fc (Fig. 4 for complex 1), corresponding to the reduction of the neutral species to the corresponding monoanions. The potential values EI1/2 determined for complexes 1–6 can be compared with the first reduction potentials determined for the [Pt(N^N)(Me-dmet)] complexes featuring the same diimine ligands under the same experimental conditions.34,54 In fact, the two sets of data are very similar and linearly correlated (R2 = 0.95). On passing from S^S = Me-dmet2− to dtoc2−, the potentials are only slightly shifted (on an average by 0.018 V), confirming that the potential of this reduction process depends on the nature of the diimine.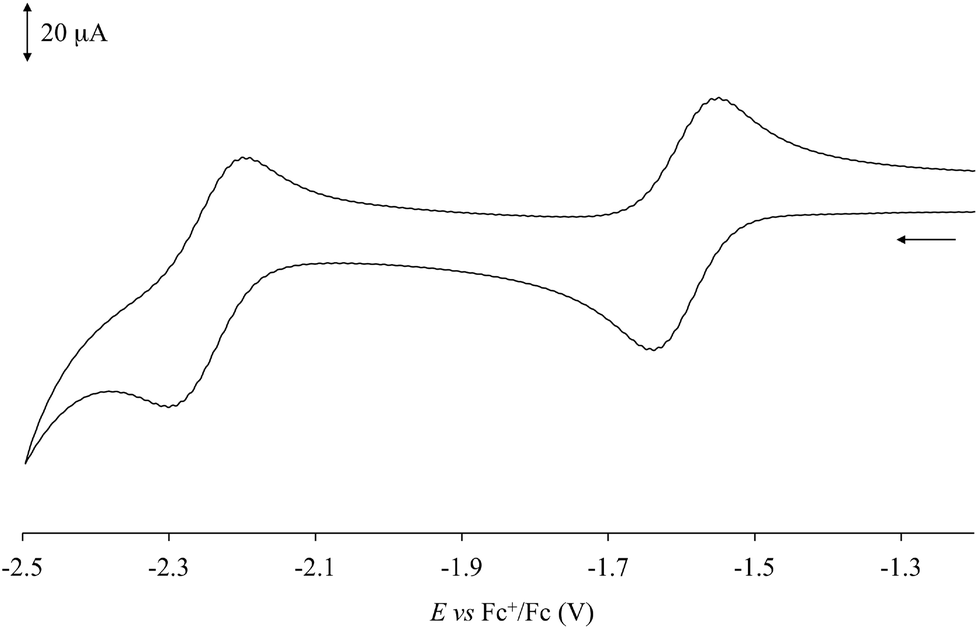 | ||
| Fig. 4 Cyclic voltammogram recorded at a platinum electrode in an anhydrous DMSO solution of 1 [298 K; scan rate 100 mV s−1; supporting electrolyte [NBu4][PF6] 0.1 M]. | ||
| E I1/2 | |EIpc–EIpa| | i Ipc/iIpa | E II1/2 | |EIIpc–EIIpa| | i IIpc/iIIpa | |
|---|---|---|---|---|---|---|
| a All potentials E1/2, Epc, and Epa are referred to the Fc+/Fc couple. Scan rate 100 mV s−1. | ||||||
| 1 | −1.593 | 0.088 | 1.0 | −2.251 | 0.100 | 1.1 |
| 2 | −1.604 | 0.081 | 1.3 | −2.229 | 0.047 | 1.2 |
| 3 | −1.709 | 0.135 | 0.8 | — | — | — |
| 4 | −1.698 | 0.044 | 1.1 | — | — | — |
| 5 | −1.536 | 0.071 | 1.0 | −2.090 | 0.091 | 0.4 |
| 6 | −1.541 | 0.071 | 1.1 | −2.100 | 0.091 | 0.9 |
Complexes 1, 2, 5, and 6 exhibit a further quasi-reversible reduction (iIIpc/iIIpa = 0.4–1.2) at about −2.1/−2.2 V vs. Fc+/Fc (EII1/2, Table 1 and Fig. 4 for complex 1), which leads from monoanionic to dianionic species. The second reduction process was previously reported for [Pt(Ph2Phen)(dtoc)] (6; Ph2Phen = 4,7-diphenyl-1,10-phenanthroline; Scheme 1) in DMF (E1/2 = −2.14 V vs. Fc+/Fc).43 Weinstein and co-authors supposed this process to be localized on the diimine,43 although in analogy to what was reported for different [Pt(bipy)L2] (L = py, Me2N-py, Cl), [Pt(bipy)(en)], and [Pt(phen)(py)2] complexes,55 this reduction could be attributed to the formation of a dianionic PtI radical species [PtI(N^N˙)(S^S)]2−.56
An examination of the reduction potentials EI1/2 and EII1/2 listed in Table 1 shows that no significant effect is observed on passing from N^N = bipy to N^N = phen in complexes 1 and 2, respectively. The introduction of alkyl substituents at the diimine (3 and 4) induces a potential shift towards more negative values, while phenyl substituents (5 and 6) shift both EI1/2 and EII1/2 towards more positive values with respect to the complexes 1 and 2 featuring unsubstituted diimines. Given the predominant localization of the LUMO on the diimine in [Pt(N^N)(S^S)] systems,23 this trend suggests that aryl substituents at the N^N ligands induce a stabilization of the LUMO, while alkyl substituents cause an opposite effect.34 This could also account for the absence of the reduction to dianionic forms in the case of complexes 3 and 4, whose EII1/2 potential would be too negative to be electrochemically explored.
Although a further oxidation process at about 0.95 V vs. the Fc+/Fc couple was reported in DMF for 6,43 this process was not observed in DMSO within the explored potential range. The lack of oxidation processes to cationic species suggests a remarkable stabilization of the HOMO in 1–6 as compared to different diimine–dithiolate complexes, possibly ascribed to the electron-withdrawing effect of the 1,2-closo-C2B10H12 cluster.38
Absorption UV–vis spectroscopy
Diimine–dithiolate complexes show a peculiar low-energy solvatochromic absorption in the visible region.20 Accordingly, the UV-vis absorption spectra recorded in DMSO for complexes 1 and 3–5, bearing bipyridine ligands, feature a broad and asymmetric absorption band in the visible region, with absorption maxima in the range 420–440 nm, and molar extinction coefficients ε between 4700 and 8200 M−1 cm−1 (Table 2 and Fig. 5 for complex 1). In the case of complexes 2 and 6, bearing 1,10-phenanthroline ligands, this absorption is split into two bands, falling at 378/395 and 427/441 nm, respectively (ε values of about 6000–7000 M−1 cm−1 in DMSO; Table 2 and Fig. 5 for complex 2), in agreement with the data previously reported for complex 6.43 An examination of the absorption spectra recorded for complexes 1–6 in eight different solvents (namely CH2Cl2, CHCl3, CH3CN, acetone, THF, DMF, DMSO, and toluene) shows a remarkable solvatochromism for the absorption bands in the visible region, with a shift in the λmax value of about 40–60 nm.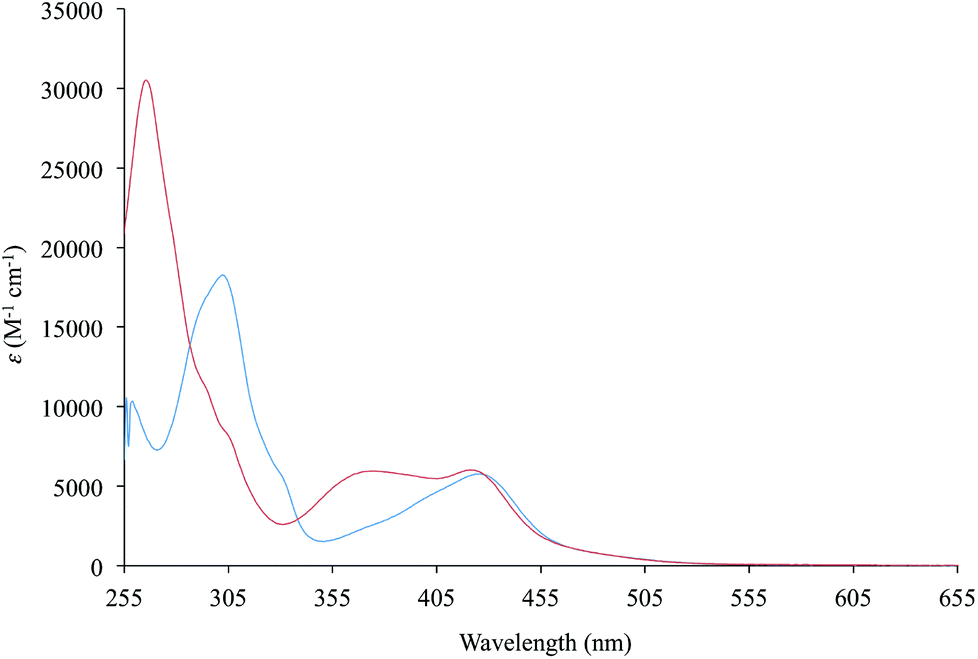 | ||
| Fig. 5 UV–vis absorption spectra (255–655 nm) recorded for complexes 1 (blue line) and 2 (red line) in DMSO. | ||
| CH2Cl2 | CHCl3 | CH3CN | Acetone | THF | DMF | DMSO | Toluene | |
|---|---|---|---|---|---|---|---|---|
| a If not reported, the molar extinction coefficients were not determined for solubility reasons. | ||||||||
| 1 | 447 (6300) | 452 (6500) | 425 (5700) | 434 (5600) | 452 (6300) | 428 (5800) | 424 (5800) | 481 |
| 2 | 444 (6200) | 453 (6600) | 426 (4400) | 436 (5800) | 453 (6100) | 430 (6000) | 427 (6100) | 476 |
| 3 | 437 (5200) | 434 (4300) | 445 | 428 (5000) | 445 (4900) | 425 (4400) | 420 (4700) | 454 |
| 4 | 438 (7300) | 447 (7200) | 418 (6700) | 428 (7200) | 446 (7600) | 423 (6700) | 419 (6000) | 470 (8600) |
| 5 | 458 (9300) | 467 (7000) | 438 (8900) | 448 (8100) | 466 (7700) | 444 (8400) | 439 (8200) | 492 |
| 6 | 452 (8000) | 460 (8200) | 438 (7300) | 448 (8700) | 463 (8400) | 444 (7000) | 441 (6700) | 484 (8000) |
In particular, both the broad absorption featured by the bipyridine-containing complexes and the two bands shown in the case of complexes 2 and 6 display a negative solvatochromism, and a dependence of their ε values on the nature of the solvent (Table 2 and Fig. 6 for complex 2).
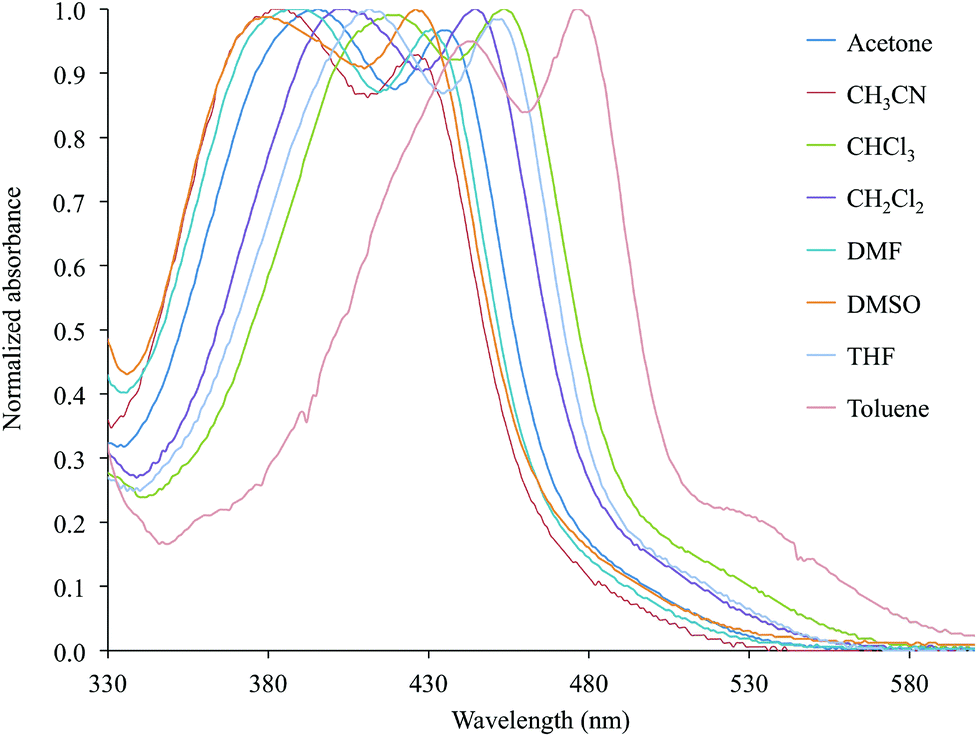 | ||
| Fig. 6 Normalized absorption spectra in the Vis region (330–600 nm) recorded for complex 2 in eight selected solvents (Table 2). | ||
The observed solvatochromic behaviour is in agreement with the empirical scale previously proposed by Eisenberg and co-workers for platinum diimine–dithiolate complexes,20 thus suggesting a CT character for the electronic transitions involved (Fig. S1† for complex 2).
The λmax values recorded in DMSO for the solvatochromic absorption at the lowest energy of complexes 1–6 strongly depend on the nature of the diimine, analogously to what was previously observed for [Pt(N^N)(S^S)] complexes featuring R-dmet2− 1,2-dithiolato ligands.34 In particular on passing from complexes 1 and 2, bearing unsubstituted diimines, to complexes 5 and 6, where the N^N ligands are phenyl-substituted, a red-shift can be observed. On the other hand, alkyl substituents (complexes 3 and 4) induce a blue-shift of the λmax value of the corresponding complexes. Since the solvatochromic band is attributed to the HOMO–LUMO transition, its wavelength can be correlated to the LUMO energy, and thus spectroscopic and electrochemical CV data have been cross-compared. In fact, a linear correlation holds between the λmax values and the E1/2 potentials (Fig. 7 and S2† for EI1/2 and EII1/2, respectively; R2 = 0.82 and 0.98). This correlation suggests that the variation of the λmax values should be attributed mainly to a variation in the energies of the LUMO, localized in the diimine, while the uppermost filled MOs would not be affected, and should therefore be localized on the dtoc2− ligand and/or the central metal ion, in agreement with what was reported for different [Pt(N^N)(S^S)] complexes.25
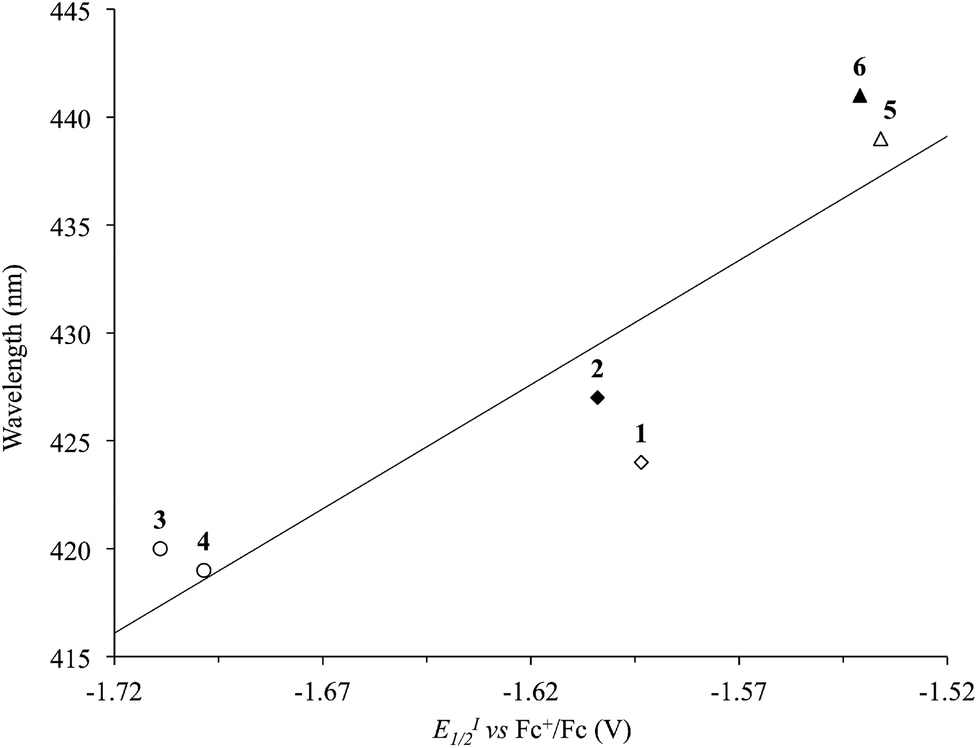 | ||
| Fig. 7 Correlation between the reduction potentials EI1/2 (V vs. Fc+/Fc) and the λmax of the solvatochromic absorption (nm) in DMSO solutions of complexes 1–6 (R2 = 0.82; Tables 1 and 2). N^N = unsubstituted (rhombs) 2,2′-bipyridine (empty) or 1,10-phenathroline (filled), and alkyl (circles) or phenyl (triangles) derivatives. | ||
Theoretical calculations
With the aim of gaining an insight into the electronic structure of the title complexes and interpreting the electrochemical and spectroscopic features observed experimentally, a theoretical investigation was performed on complexes 1–6 at the density functional theory (DFT) level.57 Following the good results previously obtained with different [Pt(N^N)(S^S)] complexes,34 the hybrid PBE0 functional was adopted,58 and the all-electron double-ζ basis sets (BSs) with polarization functions by Schäfer, Horn, and Ahlrichs59 were exploited for light atomic species. For the heavier Pt species, the CRENBL BS60 with relativistic effective core potentials (RECPs)61,62 was chosen to account for the relativistic effects occurring in the case of third-row transition metal ions.63 Given the role played by the solvent in the spectroscopic features of PtII diimine–dithiolate complexes, solvation calculations were also carried out at the same level of theory using the integral equation formalism of the polarizable continuous model (IEF-PCM) within the self-consistent reaction field (SCRF) approach.64 Calculations were performed both in the gas phase and in the presence of DMSO for all the complexes 1–6, and in the case of complex 1, solvation calculations were performed by considering all of the eight solvents employed for the spectroscopic measurements (see above; Table S2†).The structural features optimized both in the gas phase and in DMSO are summarized in Table 3. Very similar sets of data were found for the optimized geometries of complexes 1–6 in the gas phase, the Pt–S and Pt–N distances falling in the ranges 2.284–2.289 and 2.050–2.059 Å, respectively.
| 1 | 2 | 3 | 4 | 5 | 6 | |
|---|---|---|---|---|---|---|
| a Atom labelling scheme as reported in Fig. 1 for complex 1. | ||||||
| Pt–S(1) | 2.287 (2.305) | 2.284 (2.302) | 2.289 (2.306) | 2.289 (2.306) | 2.288 (2.306) | 2.286 (2.303) |
| Pt–S(2) | 2.287 (2.305) | 2.284 (2.302) | 2.289 (2.306) | 2.289 (2.306) | 2.288 (2.306) | 2.286 (2.303) |
| Pt–N(1) | 2.053 (2.052) | 2.059 (2.059) | 2.053 (2.051) | 2.052 (2.051) | 2.050 (2.050) | 2.054 (2.053) |
| Pt–N(2) | 2.053 (2.052) | 2.059 (2.059) | 2.053 (2.051) | 2.052 (2.051) | 2.050 (2.050) | 2.054 (2.053) |
| S(1)–C(1) | 1.795 (1.793) | 1.795 (1.794) | 1.795 (1.793) | 1.795 (1.793) | 1.795 (1.793) | 1.795 (1.794) |
| S(2)–C(2) | 1.795 (1.793) | 1.795 (1.794) | 1.795 (1.793) | 1.795 (1.793) | 1.795 (1.793) | 1.795 (1.794) |
| C(1)–C(2) | 1.617 (1.621) | 1.618 (1.622) | 1.618 (1.623) | 1.618 (1.624) | 1.618 (1.623) | 1.619 (1.624) |
| S(1)–Pt–S(2) | 90.36 (90.31) | 90.99 (90.72) | 90.39 (90.26) | 90.46 (90.22) | 90.47 (90.17) | 90.89 (90.59) |
| N(1)–Pt–N(2) | 79.22 (79.49) | 80.08 (80.30) | 79.10 (79.31) | 80.00 (79.37) | 79.11 (79.34) | 79.64 (79.82) |
| N(1)–Pt–S(2)–C(2) | 170.88 (175.31) | 169.37 (174.10) | 170.09 (174.01) | 169.87 (174.93) | 170.04 (175.19) | 169.78 (174.97) |
For all the complexes, almost no changes in the optimized bond distances and angles were observed upon considering solvation in the calculations, the principal bond distances and angles varying by less than 0.1 Å and 1°, respectively. The most significant difference regards the N(1)–Pt–S(2)–C(2) dihedral angle, which is increased for all complexes by about 5° towards planarity on passing from the gas phase to the implicitly solvated species. The calculations performed in the case of complex 1 taking into account eight different solvents confirm that the optimized parameters vary only slightly upon changing the solvent (Table S2†).65 A very good agreement was found between the parameters optimized in the gas phase and the corresponding experimental structural data for complexes 1 and 4, with all of the bond lengths and angles differing by less than 0.03 Å and 2°, respectively.
In Fig. 8 and S3† the ground-state (GS) bonding scheme is shown in terms of the frontier Kohn–Sham (KS) molecular orbital (MO) scheme for complexes 1 and 2, respectively. Analogously to what was reported for related complexes,66,67 KS-HOMO and KS-HOMO−1 (MOs 102 and 101, respectively, in Fig. 8) are π-in-nature MOs mainly localized on the sulphur atoms of the dtoc2− ligand. The stabilization effect induced by the electron-withdrawing dtoc2− ligand allows for a larger extent of mixing between the ligand fragment molecular orbitals (FMOs) and the atomic orbitals (AOs) of the metal ion in the title complexes. In fact, KS-HOMOs show a remarkable contribution from 5d AOs of the Pt atom, which increases when the solvent is taken into account (17–18 and 24–25% in the gas phase and in DMSO, respectively; Fig. 9 for complex 1). Accordingly, KS-HOMO eigenvalues calculated for complexes 1–6 in the gas phase68 are remarkably more negative than those calculated at the same level of theory for different [Pt(N^N)(S^S)] complexes reported previously.34,69 The stabilization of the eigenvalues calculated for HOMOs and HOMO−1s for the complexes featuring the dtoc2− ligand is reflected in the absence of oxidation processes in the voltammograms recorded for complexes 1–6 in DMSO solution (see above).
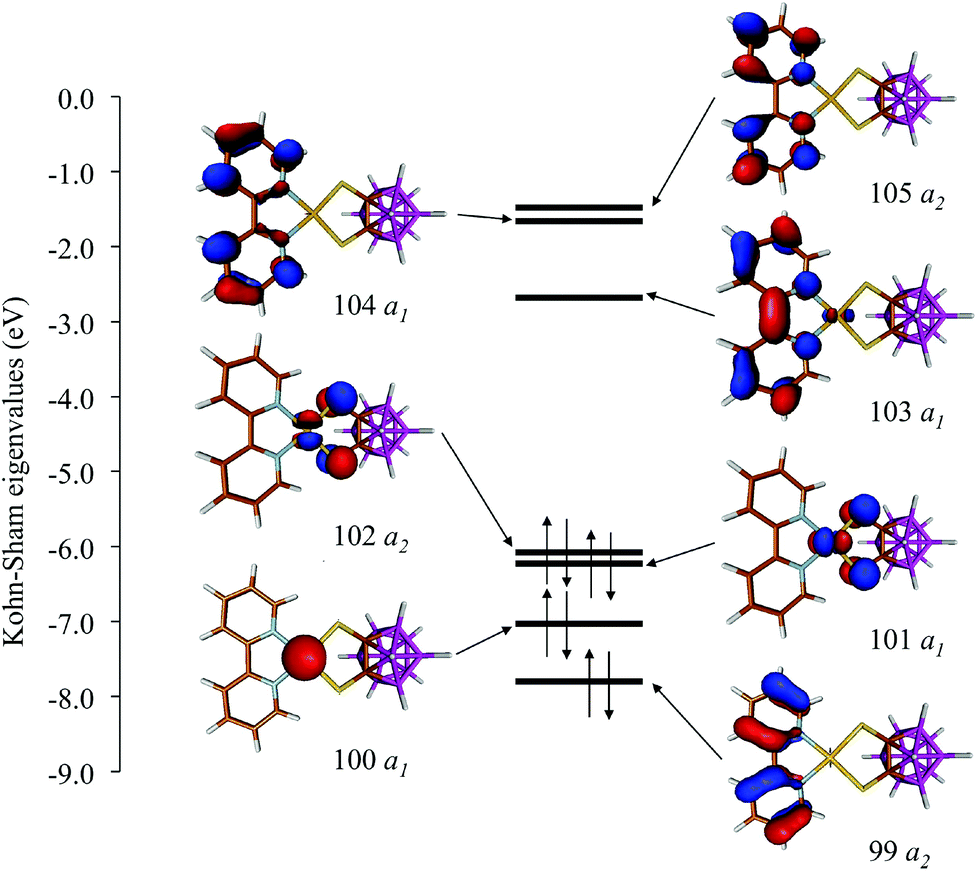 | ||
| Fig. 8 KS-MO scheme and isosurface drawings calculated for complex 1 in DMSO (IEF-PCM SCRF model; Cs point group; contour value = 0.05 e). | ||
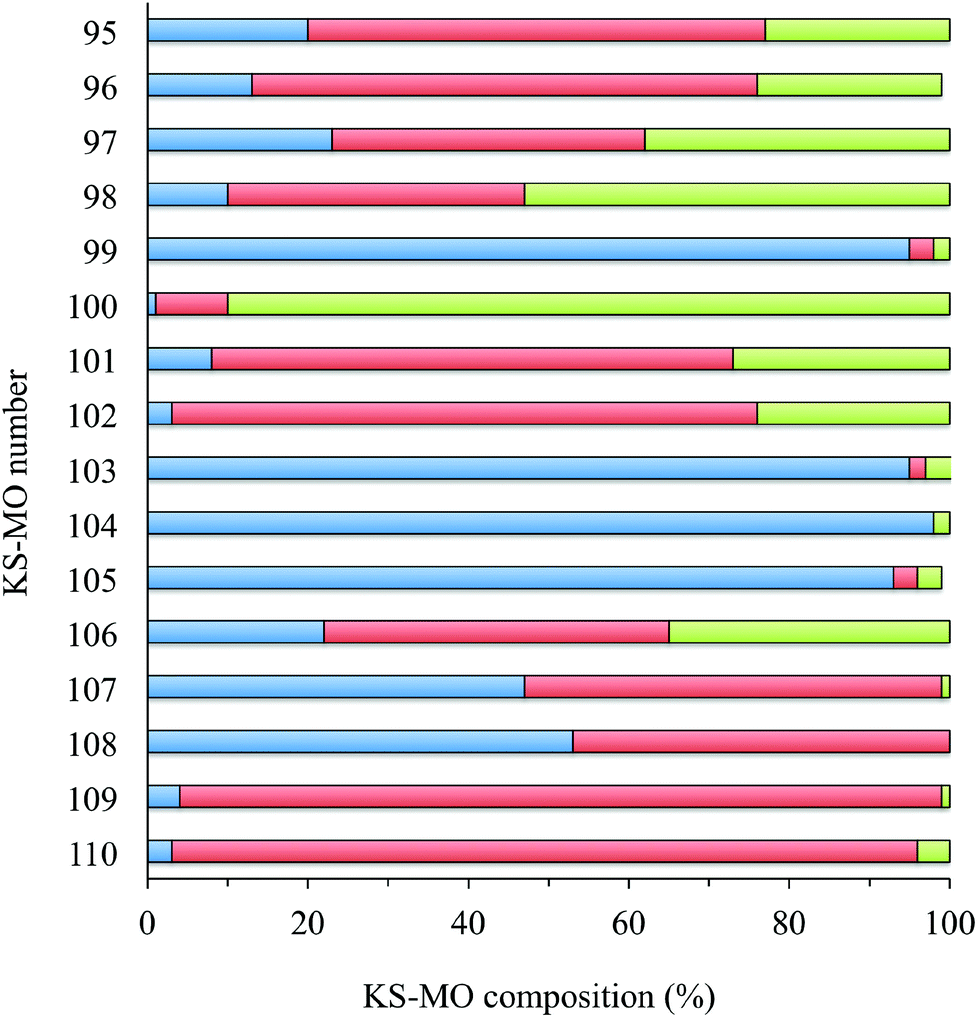 | ||
| Fig. 9 Frontier molecular orbital (KS-MOs 95–105; KS-HOMO = 102, KS-LUMO = 103) composition calculated for complex 1 in DMSO [fragments: platinum atom, green; dtoc2− ligand, red; N^N ligand (blue)]. | ||
The KS-LUMO is almost exclusively centred on the diimine ligand both in the gas phase and in DMSO (92–95%, Table S3†). The localization of the KS-LUMO on the N^N ligand is in agreement with what was hypothesized based on the analysis of the electrochemical and spectroscopic data discussed above. Accordingly, the potentials of the two reduction processes EI1/2 and EII1/2 observed for the complexes are linearly correlated with the KS-eigenvalues calculated for LUMOs of 1–6 in DMSO solution (R2 = 0.84 and 0.61 for the two reductions; Fig. 10). No significant changes were observed in the composition of the frontier MOs upon varying the solvents considered for the IEF-PCM SCRF calculations in the case of complex 1 (Table S4†).
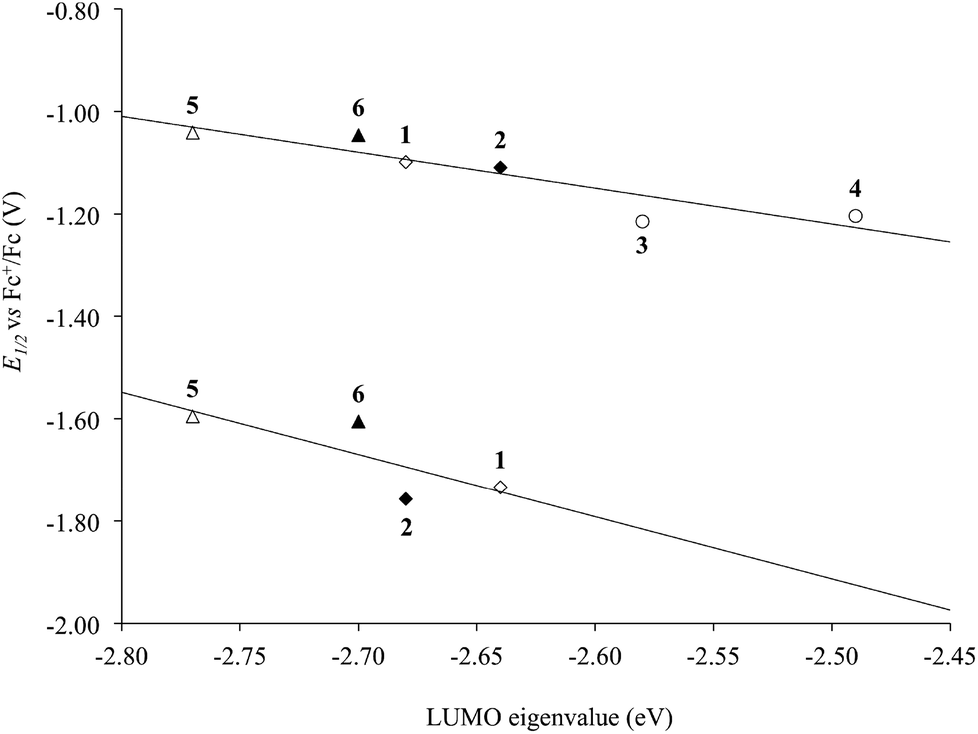 | ||
| Fig. 10 Correlation between the experimental half-wave potentials of the EI1/2 (top) and EII1/2 (bottom) reduction processes (V vs. Fc+/Fc) and the IEF-PCM TD-DFT calculated KS-LUMO eigenvalues (eV) for complexes 1–6 in DMSO (R2 = 0.84 and 0.61, respectively; Tables 1 and S3†). N^N = unsubstituted (rhombs) 2,2′-bipyridine (empty) or 1,10-phenathroline (filled), and alkyl (circles) or phenyl (triangles) derivatives. | ||
An analysis of the natural atomic charges70 calculated on complexes 1–6 shows that a charge separation of about 1.0 and 1.2 e exists between the two ligands in the gas phase and in DMSO, respectively (Table S5†). This polarization arises from the partial negative charge carried by the dtoc2− ligand (ranging between −0.54 and −0.71 e in the gas phase and between −0.57 and −0.73 e in DMSO solution) and the partial positive charge shown by the N^N ligands (in the ranges 0.42–0.46 e in the gas phase and 0.57–0.59 e in DMSO), the remaining positive charge of the complex being carried by the platinum ion (0.13–0.14 and e in DMSO). The calculated charge separation, which confirms what was previously reported for PtII diimine–dithiolate systems,34 also shows a small but not negligible dependence on the nature of the solvent (Table S6† for complex 1).
Time-dependent DFT (TD-DFT) calculations were carried out on complexes 1–6. Simulated UV–vis absorption spectra of the complexes are in very good agreement with the experimental ones, in particular as far as the solvation calculations are concerned (Tables 4 and S7,† and Fig. 11 for complex 2). For all complexes, the S0→S2 electronic transition was calculated to be responsible for the lowest energy solvatochromic absorption band observed experimentally in the 410–500 nm region (see above). This transition is mainly assigned to an almost pure (97% for complex 1, Table 4) monoelectronic excitation between the KS-HOMO−1 and KS-LUMO (KS-MOs 101 and 103, respectively, for complex 1; Table 4 and Fig. 8), in contrast with the previous DFT calculations reported on complex 6, where the transitions involving the frontier MOs were calculated to have negligible oscillator strengths.67 In all complexes, KS-HOMO−1, analogous to KS-HOMO, is a π-in-nature orbital predominantly localized on the sulfur atoms of the dtoc2− ligand, with a significant contribution from the Pt atom (27–28% in DMSO; Fig. 8, 9 and S3† and Table S3†). Thus, given the localization of KS-LUMO described above for complexes 1–6, the transition could be considered a mixed-metal/ligand-to-ligand CT (MMLL'CT), analogous to most of the [Pt(N^N)(S^S)] complexes reported so far (where it arises from the HOMO→LUMO one-electron excitation).25
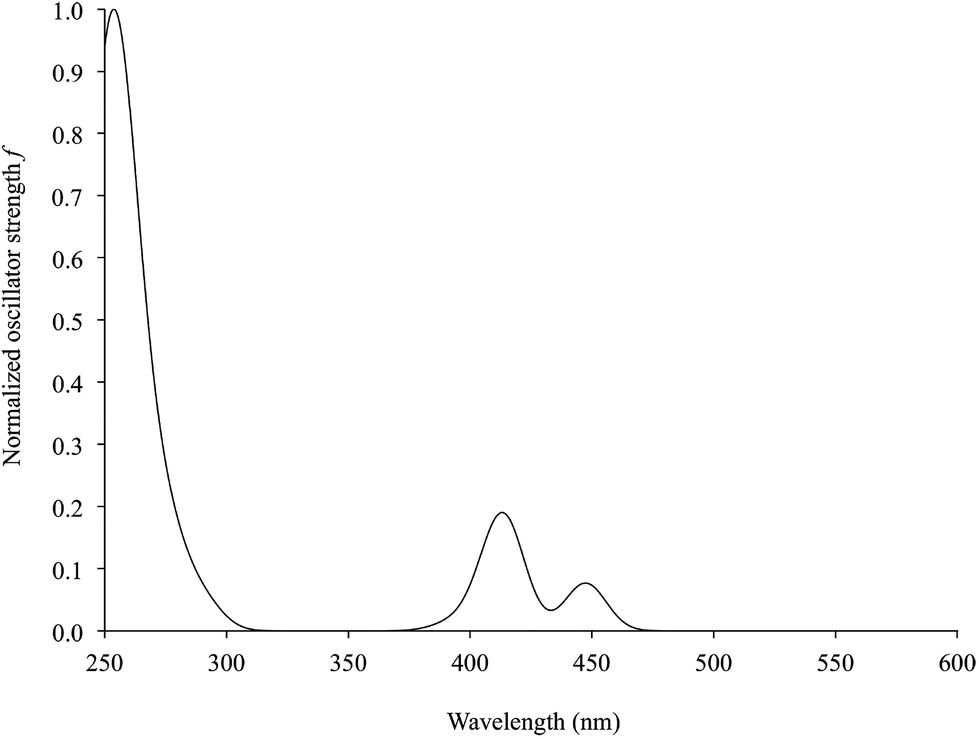 | ||
| Fig. 11 TD-DFT simulated UV–vis absorption spectrum (230–630 nm) of complex 2 in DMSO (IEF-PCM SCRF model; Table 4). | ||
| Exc. state | E | λ | f | Comp.a | % | Assignment |
|---|---|---|---|---|---|---|
| a MOs are labelled according to Fig. 8. | ||||||
| S2 | 2.553 | 443.6 | 0.103 | 101→103 | 97 | dtoc2−(65%) + Pt(27%)→bipy(95%) |
| S3 | 3.174 | 390.6 | 0.007 | 102→106 | 76 | dtoc2−(73%) + Pt(24%)→dtoc2−(43%) + Pt(35%) |
| S9 | 3.893 | 318.5 | 0.111 | 102→105 | 66 | dtoc2−(73%) + Pt(24%)→bipy(93%) |
| S10 | 3.929 | 315.5 | 0.008 | 101→105 | 79 | dtoc2−(65%) + Pt(27%)→bipy(93%) |
| S11 | 4.385 | 282.8 | 0.303 | 99→103 | 75 | bipy(95%)→bipy(95%) |
| S13 | 4.448 | 278.8 | 0.043 | 98→103 | 90 | Pt(53%) + dtoc2−(37%)→bipy(95%) |
| S14 | 4.515 | 274.6 | 0.132 | 97→103 | 79 | dtoc2−(39%) + Pt(38%)→bipy(95%) |
| S15 | 4.524 | 274.1 | 0.035 | 100→105 | 83 | Pt(90%)→bipy(93%) |
The CT character of this transition leads to a lowering in the charge separation in the excited state as compared to the GS that accounts for the negative solvatochromism observed.
The KS-LUMO composition also accounts for the linear correlation observed experimentally between the λmax of the corresponding absorption and the reduction potentials EI1/2 and EII1/2 of complexes 1–6, and for the dependence of the lowest energy solvatochromic band on the nature of the diimine observed experimentally. Accordingly, the experimental λmax values of the lowest energy solvatochromic absorption can be directly correlated to the eigenvalues of the KS-LUMO calculated for complexes 1–6 (Fig. S4†).
A very good agreement was also found between the experimental and calculated λmax values of the lowest energy absorption in different solvents in the case of complex 1 (R2 = 0.94; Fig. S5†).71,72
As regards complexes 2 and 6 bearing a 1,10-phenanthroline ligand, the solvatochromic absorption observed experimentally in the region 370–540 nm was calculated to derive mainly from the S0→S3 vertical transition (Table S7†). This transition is mainly (73% for complex 2) due to the KS-HOMO→KS-LUMO+1 monoelectronic excitation (108→110 for complex 2, Table S7 and Fig. S3†). Also in this case, the excitation can be considered a MMLL'CT, since KS-LUMO+1 is almost exclusively localized on the N^N ligand (99% for complex 2), thus accounting for its solvatochromism.
Finally, since complexes 1–6 could be exploited as SONLO materials,41 in analogy with different PtII complexes,73 static dipole moments μ and static first hyperpolarizabilities βtot were calculated both in the gas phase and in DMSO (Table 5). The calculated values of βtot (75–136 × 10−30 esu in the gas phase) are remarkably lower than those previously calculated for [Pt(N^N)(S^S)] complexes featuring different 1,2-dithiolato ligands (150–650 × 10−30 esu in the gas phase),34 thus confirming the experimental observations reported by Grinstaff and co-workers on the SONLO properties of [Pt(N^N)(S^S)] complexes with S^S = dithiolate o-carborane and different 1,2-dithiolates.42 No significant differences were observed in this case between the hyperpolarizability values calculated in the gas phase and in DMSO, while a clear trend was observed upon varying the N^N ligand. The largest values of βtot were calculated for complexes 5 and 6, featuring phenyl-substituted diimines, thus confirming that aryl pendants at the N^N ligand could improve the SONLO properties of [Pt(N^N)(S^S)] systems.34
| Gas phase | DMSO | |||||
|---|---|---|---|---|---|---|
| β tot × 104 (a.u.) | β tot × 10−30 (esu) | |μ| | β tot × 104 (a.u.) | β tot × 10−30 (esu) | |μ| | |
| 1 | 0.87 | 75 | 7.43 | 0.82 | 71 | 1.02 |
| 2 | 1.04 | 90 | 7.09 | 0.94 | 81 | 9.56 |
| 3 | 0.89 | 77 | 7.60 | 0.76 | 66 | 1.00 |
| 4 | 0.99 | 85 | 8.26 | 0.74 | 64 | 1.09 |
| 5 | 1.57 | 136 | 8.04 | 1.03 | 89 | 1.05 |
| 6 | 1.57 | 136 | 8.15 | 1.07 | 92 | 1.05 |
Conclusions
Five new [Pt(N^N)(S^S)] complexes featuring the 1,2-dithiolato-1,2-closo-dicarbadodecaborane ligand (dtoc2−) in combination with differently substituted 2,2′-bipyridine and 1,10-phenanthroline ligands were synthesized and characterized by both experimental and theoretical means, and their features were compared to those of the only previously reported complex of the same type (6). The very first structural information on [Pt(N^N)(dtoc)] complexes were also obtained by single crystal X-ray diffraction.As already observed for different PtII diimine–dithiolate complexes, solvatochromic absorptions are displayed in the visible region of the complexes’ spectra, and in particular a single broad absorption was observed in the case of the complexes featuring a 2,2′-bipyridine derivative (λmax = 420–440 nm in DMSO). Based on TD-DFT calculations, the broad absorption was attributed to the HOMO−1/LUMO electronic excitation, whose MMLL'CT character accounts for its solvatochromism. On the other hand, two different bands were shown in the case of complexes bearing 1,10-phenanthroline derivatives (λmax = 427–441 nm in DMSO), both assigned to excitations having a MMLL'CT character as well. The DFT calculations reported in this work thus allowed for the first persuasive interpretation of the peculiar spectroscopic features of [Pt(N^N)(dtoc)] complexes, in particular those containing the 1,10-phenanthroline moiety.
In the title complexes, the electron-withdrawing effect of the dtoc2− ligand determines a remarkable stabilization of the HOMOs and HOMO−1s with respect to [Pt(N^N)(S^S)] systems bearing different sulfur ligands. Thus, no oxidation processes were observed by CV in DMSO solution within the explored range of potentials (−2.5–1.5 V vs. Fc+/Fc). As a consequence, the energy gap between HOMO/HOMO−1 and LUMO is significantly increased with respect to other [Pt(N^N)(S^S)] complexes, thus shifting the typical solvatochromic absorption to higher energies.
It is worth underlining that the peculiar electronic structure of [Pt(N^N)(S^S)] complexes allows the fine-tuning of the energy of their frontier orbitals by a proper choice of the ligands, and hence the tailoring of both the electrochemical stability of the neutral complexes and the energy of the solvatochromic visible absorption. In this context:
(1) Donor S^S ligands raise HOMOs eigenvalues, while electron-withdrawing dithiolates, such as dtoc2−, exert the opposite effect.
(2) Diimines with donor (alkyl) substituents feature the LUMO at higher energy as compared to phenyl-substituted ones.
(3) As a consequence, on passing from complexes featuring a donor dithiolate and a phenyl-substituted diimine, such as [Pt(Ph2bipy)(Me-dmet)], to complexes featuring electron-withdrawing dithiolates and alkyl-substituted diimines, such as [Pt(Me2bipy)(dtoc)], the wavelength of the solvatochromic band can be varied by more than 150 nm in DMSO (λmax = 437 and 602 nm for [Pt(Me2bipy)(dtoc)] and [Pt(Ph2bipy)(Me-dmet)], respectively).
Finally, the calculated βtot values show that [Pt(N^N)(dtoc)] complexes have a less pronounced SONLO behaviour in comparison with [Pt(N^N)(S^S)] systems bearing 1,2-dithiolene ligands. The static βtot values reported in this work are in agreement with the trend previously observed with regard to the influence of the N^N ligand on the hyperpolarizability values, which showed that the presence of phenyl substituents increases βtot values.
The insight into the electrochemical and linear and nonlinear spectroscopic features of [Pt(N^N)(dtoc)] complexes given in the present work represents therefore a significant step forward in the understanding of the electronic features of this class of compounds, and opens the way to their employment in devices of interest in optical processing.
Experimental section
Chemicals
2,2′-Bipyridine, 1,10-phenanthroline and derivatives, K2[PtCl4], n-butyllithium (n-BuLi) were obtained from commercial sources. The solvents for the syntheses were of reagent grade. THF was freshly distilled on LiAlH4 before use.Synthesis of complexes
Platinum dichlorodiimine complexes [PtCl2(N^N)]44,45 and 1,2-dithiol-1,2-closo-dicarbadodecarborane40 were synthesized according to published procedures. The complex [Pt(Ph2phen)(dtoc)] (6) was synthesized through a modification of the procedure reported in the literature.41 Compounds 1–5 were all synthesized according to a similar procedure, described here in detail for complex 1. The details of the characterization of complexes 2–5 are available as ESI.†![[thin space (1/6-em)]](https://www.rsc.org/images/entities/char_2009.gif) 500), 295 (19500), 303 (sh, 18700), 447 nm (6300 M−1 cm−1); 13C{1H} NMR (DMF): δ = 155.0, 148.0, 140.0, 128.5, 124.3 (Caryl), 85.7 (Ccluster); 11B NMR (DMF): δ = −2.6 (2B, broad singlet), −7.7 (6B, 1J(B,H) = 125), −10.7 (2B, 1J(B,H) = 128); elemental analysis calcd (%) for C12H18N2S2B10Pt: C 25.84, H 3.28, N 5.02; found: C 26.01, H 3.31, N 4.93; CV (DMSO): E1/2vs. Fc+/Fc (scan rate = 100 mV s−1) = −1.593, −2.251 V.
500), 295 (19500), 303 (sh, 18700), 447 nm (6300 M−1 cm−1); 13C{1H} NMR (DMF): δ = 155.0, 148.0, 140.0, 128.5, 124.3 (Caryl), 85.7 (Ccluster); 11B NMR (DMF): δ = −2.6 (2B, broad singlet), −7.7 (6B, 1J(B,H) = 125), −10.7 (2B, 1J(B,H) = 128); elemental analysis calcd (%) for C12H18N2S2B10Pt: C 25.84, H 3.28, N 5.02; found: C 26.01, H 3.31, N 4.93; CV (DMSO): E1/2vs. Fc+/Fc (scan rate = 100 mV s−1) = −1.593, −2.251 V.
Characterization
Microanalyses were performed by using a Perkin-Elmer 240 B microanalyser. Infrared spectra were recorded on a Thermo-Nicolet 5700 spectrometer at room temperature: KBr pellets with a KBr beam-splitter and KBr windows (4000–400 cm−1, resolution 4 cm−1) were used. The 1H-NMR (300.13 MHz), 13C{1H}-NMR (75.47 MHz) and 11B-NMR (96.29 MHz) spectra were recorded on a Bruker ARX 300WB spectrometer. Chemical shift values for 1H-NMR spectra were referenced to an internal standard of SiMe4 in deuterated solvents. The 13C{1H}-NMR spectra of slightly soluble compounds were dissolved in DMF and spectra run in a double tube containing acetone-d6. Chemical shift values for 11B-NMR spectra were referenced relative to external BF3·OEt2. Chemical shifts are reported in units of parts per million downfield from the reference, and all coupling constants are reported in hertz. Absorption spectra were recorded on solutions of the investigated complexes in spectrophotometric grade solvents at 298 K in a quartz cell of 10.00 mm optical path using a Thermo Evolution 300 (190–1100 nm) spectrophotometer. Cyclic voltammetry measurements (scan rate 10–1000 mV s−1) were performed in dry DMSO in a Metrohm voltammetric cell, with a combined working and counter platinum electrode and a standard Ag/AgCl reference electrode using a Metrohm Autolab PGSTAT 10 potentiostat (C ≈ 1.5 × 10⁻³ M; supporting the electrolyte [NBu4][PF6] 0.10 M): reported data are referred to the Fc+/Fc reversible couple. The DMSO solutions were deaerated with analytical grade nitrogen at the start of each experiment to prevent oxygen interference. All experiments were performed at room temperature.X-ray crystallography
Single crystal X-ray diffraction data were collected at 120(2) K by combined Φ and Ω scans on a Bruker Nonius KappaCCD area detector situated at the window of a rotating anode (graphite MoKα radiation, λ = 0.71073 Å). The structures were solved by direct methods with SHELXS-97 and refined on F2 by using SHELXL-97.74 Complete crystallographic data have been deposited at the Cambridge Crystallographic Data Centre, CCDC 1010434 (complex 1) and 1010435 (complex 4).DFT calculations
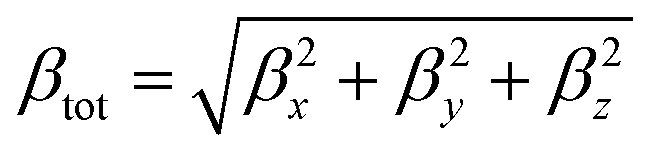
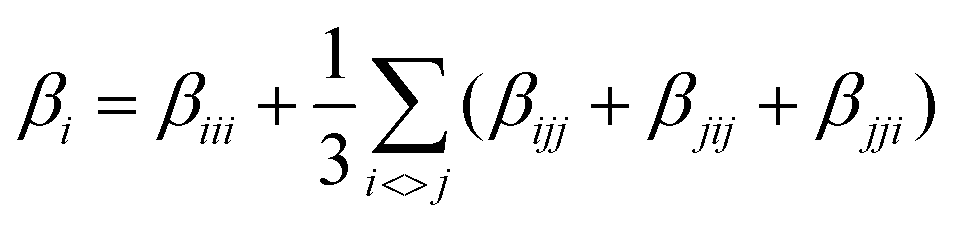
Theoretical calculations were performed at the DFT level57 with the Gaussian 09 suite of programs (rev. A.02)75 on a E4 workstation equipped with four quad-core AMD Opteron processors and 16 Gb of RAM, running the 64 bit version of the Ubuntu 12.04 Linux operating system. The PBE0 (PBE1PBE) hybrid functional was adopted,58 and Schäfer, Horn, and Ahlrichs double-ζ plus polarization all-electron basis sets59 were used for C, H, N, B, and S, whereas CRENBL BS60 with relativistic effective core potentials (RECPs)61,62 was chosen for the heavier Pt species. The tight SCF convergence criterion (SCF = tight keyword) and fine numerical integration grids [Integral(FineGrid) keyword] were used. The nature of the minima of each optimized structure was verified by harmonic frequency calculations (freq = raman keyword). Natural70 and Mulliken76 atomic charges were calculated at the optimized geometries at the same level of theory, and electronic transition energies and oscillator strength values were calculated at the TD-DFT level (100 states). The electronic spectra were simulated by a convolution of Gaussian functions centered at the calculated excitation energies. Solvation calculations were also carried out in the presence of a set of different solvents (CH2Cl2, CHCl3, CH3CN, acetone, THF, DMF, DMSO, and toluene), implicitly taken into account by the polarizable continuum model in its integral equation formalism variant (IEF-PCM).64 The total static second-order (quadratic) hyperpolarizability (the first hyperpolarizability)77βtot was calculated as described by Mendes et al.78 from the relation:where each static component βi (i = x, y, z) is obtained from the equation:
By using Kleinman symmetry relationships,79 the final equation was obtained:

The programs Gaussview 5.080 and Molden 5.081 were used to investigate the charge distributions and molecular orbital shapes. The software GaussSum 2.182 was used to calculate the molecular orbital contributions (MOC) from groups of atoms, along with the contribution of singly excited configurations to each electronic transition, and to generate all the necessary data to simulate absorption spectra.
Acknowledgements
The Università degli Studi di Cagliari, the Ministero dell'Istruzione, dell'Università e della Ricerca (MIUR, PRIN 2009Z9ASCA) and the Regione Autonoma della Sardegna are acknowledged for financial support. M. Arca thanks the Consorzio interuniversitario per le Applicazioni di Supercalcolo Per Università e Ricerca (CASPUR) for providing computational resources within the framework of HPC grants 2012. This work was supported by Generalitat de Catalunya (2009/SGR/00279), European Union (FP7-OCEAN-2013-614168) and COST Action CM1302. A.-D. Musteti thanks the Spanish Ministerio de Educación for a FPU grant (AP2008-02290). The Engineering and Physical Sciences Research Council is acknowledged for funding the UK National Crystallography Service. A.-D. Musteti is enrolled in the UAB PhD program.Notes and references
- T. R. Miller and I. G. Dance, J. Am. Chem. Soc., 1973, 95, 6970–6979 CrossRef CAS.
- C.-T. Chen, S. Y. Liao, K.-J. Lin and L.-L. Lai, Adv. Mater., 1998, 3, 334–338 CrossRef.
- H.-B. Zhao, Y.-Q. Qiu, C.-G. Liu, S.-L. Sun, Y. Liu and R.-S. Wang, J. Organomet. Chem., 2010, 695, 2251–2257 CrossRef CAS.
- E. A. M. Geary, N. Hirata, J. Clifford, J. R. Durrant, S. Parsons, A. Dawson, L. J. Yellowlees and N. Robertson, Dalton Trans., 2003, 3757–3762 RSC.
- A. Islam, H. Sugihara, K. Hara, L. P. Singh, R. Katoh, M. Yanagida, Y. Takahashi, S. Murata and H. Arakawa, Inorg. Chem., 2001, 40, 5371–5380 CrossRef CAS PubMed.
- C. L. Linfoot, P. Richardson, K. L. McCall, J. R. Durrant, A. Morandeira and N. Robertson, Sol. Energy, 2011, 85, 1195–1203 CrossRef CAS.
- A. Islam, H. Sugihara, K. Hara, L. P. Singh, R. Katoh, M. Yanagida, Y. Takahashi, S. Murata and H. Arakawa, New J. Chem., 2000, 24, 343–345 RSC.
- E. A. M. Geary, K. L. McCall, A. Turner, P. R. Murray, E. J. L. McInnes, L. A. Jack, L. J. Yellowlees and N. Robertson, Dalton Trans., 2008, 3701–3708 RSC.
- M. Hissler, J. E. McGarrah, W. B. Connick, D. K. Geiger, S. D. Cummings and R. Eisenberg, Coord. Chem. Rev., 2000, 208, 115–137 CrossRef.
- J. Zhang, P. Du, J. Schneider, P. Jarosz and R. Eisenberg, J. Am. Chem. Soc., 2007, 129, 7726–7727 CrossRef CAS PubMed.
- C. A. Mitsopoulou, C. E. Dagas and C. Makedonas, Inorg. Chim. Acta, 2008, 361, 1973–1982 CrossRef CAS.
- C. A. Mitsopoulou, C. E. Dagas and C. Makedonas, J. Inorg. Biochem., 2008, 102, 77–86 CrossRef CAS PubMed.
- K. Kubo, M. Nakano, H. Tamura and G. Matsubayashi, Inorg. Chim. Acta, 2002, 336, 120–124 CrossRef CAS.
- B. W. Smucker, J. M. Hudson, M. A. Omary and K. R. Dunbar, Inorg. Chem., 2003, 42, 4714–4723 CrossRef CAS PubMed.
- Y. Ji, R. Zhang, X.-B. Du, J.-L. Zuo and X.-Z. You, Dalton Trans., 2008, 2578–2582 RSC.
- E. A. M. Geary, L. J. Yellowlees, L. A. Jack, I. D. H. Oswald, S. Parsons, N. Hirata, J. R. Durrant and N. Robertson, Inorg. Chem., 2005, 44, 242–250 CrossRef CAS PubMed.
- S. D. Cummings, L.-T. Cheng and R. Eisemberg, Chem. Mater., 1997, 9, 440–450 CrossRef CAS.
- J. A. Zuleta, J. M. Bevilacqua, J. M. Rehm and R. Eisenberg, Inorg. Chem., 1992, 31, 1332–1337 CrossRef CAS.
- J. M. Bevilacqua and R. Eisenberg, Inorg. Chem., 1994, 33, 2913–2923 CrossRef CAS.
- S. D. Cummings and R. Eisenberg, J. Am. Chem. Soc., 1996, 118, 1949–1960 CrossRef CAS.
- C.-T. Chen, S.-Y. Liao, K.-J. Lin, C.-H. Chen and T.-Y. J. Lin, Inorg. Chem., 1999, 38, 2734–2741 CrossRef CAS.
- C. Makedonas and C. A. Mitsopoulou, Inorg. Chim. Acta, 2007, 360, 3997–4009 CrossRef CAS.
- C. Makedonas, C. A. Mitsopoulou, F. J. Lahoz and A. I. Balana, Inorg. Chem., 2003, 42, 8853–8865 CrossRef CAS PubMed.
- J. A. Zuleta, J. M. Bevilacqua, D. M. Proserpio, P. D. Harvey and R. Eisenberg, Inorg. Chem., 1992, 31, 2396–2404 CrossRef CAS.
- C. A. Mitsopoulou, Coord. Chem. Rev., 2010, 254, 1448–1456 CrossRef CAS.
- J. A. Zuleta, M. S. Burberry and R. Eisenberg, Coord. Chem. Rev., 1990, 97, 47–64 CrossRef CAS.
- J. A. Zuleta, J. M. Bevilacqua and R. Eisenberg, Coord. Chem. Rev., 1991, 111, 237–248 CrossRef CAS.
- T. M. Cocker and R. E. Bachman, Inorg. Chem., 2001, 40, 1550–1556 CrossRef CAS PubMed.
- W. Paw, S. D. Cummings, M. A. Mansour, W. B. Connick, D. K. Geiger and R. Eisenberg, Coord. Chem. Rev., 1998, 171, 125–150 CrossRef CAS.
- L. Ambrosio, M. C. Aragoni, M. Arca, F. A. Devillanova, M. B. Hursthouse, S. L. Huth, F. Isaia, V. Lippolis, A. Mancini and A. Pintus, Chem. – Asian J., 2010, 5, 1395–1406 CAS.
- M. C. Aragoni, M. Arca, F. A. Devillanova, F. Isaia, V. Lippolis and A. Pintus, Chem. – Asian J., 2011, 6, 198–208 CrossRef CAS PubMed.
- M. C. Aragoni, M. Arca, F. A. Devillanova, F. Isaia, V. Lippolis, A. Mancini, L. Pala, A. M. Z. Slawin and J. D. Woollins, Inorg. Chem., 2005, 44, 9610–9612 CrossRef CAS PubMed.
- S. Eid, M. Formigué, T. Roisnel and D. Lorcy, Inorg. Chem., 2007, 46, 10647–10654 CrossRef CAS PubMed.
- A. Pintus, M. C. Aragoni, N. Bellec, F. A. Devillanova, D. Lorcy, F. Isaia, V. Lippolis, R. A. M. Randall, T. Roisnel, A. M. Z. Salwin, J. D. Woollins and M. Arca, Eur. J. Inorg. Chem., 2012, 3577–3594 CrossRef CAS.
- (a) R. N. Grimes, Carboranes, Academic Press, London, 2nd edn, 2011 Search PubMed; (b) F. Teixidor and C. Viñas, in Science of Synthesis, ed. D. E. Kauffmann and D. S. Matteson, Thieme, Stuttgart, 2005, vol. 6, p. 1235 Search PubMed.
- F. Teixidor, C. Viñas, A. Demonceau and R. Nuñez, Pure Appl. Chem., 2003, 75, 1305–1313 CrossRef CAS.
- (a) F. Teixidor, R. Núñez, C. Viñas, R. Sillanpää and R. Kivekäs, Angew. Chem., Int. Ed., 2000, 39, 4460–4462 CrossRef; (b) R. Núñez, P. Farràs, F. Teixidor, C. Viñas, R. Sillanpää and R. Kivekäs, Angew. Chem., Int. Ed., 2006, 45, 1292–1294 CrossRef.
- L. Schwartz, L. Eriksson, R. Lomoth, F. Teixidor, C. Viñas and S. Ott, Dalton Trans., 2008, 2379–2381 RSC.
- F. Teixidor, G. Barberà, A. Vaca, R. Kivekäs, R. Sillanpää, J. Oliva and C. Viñas, J. Am. Chem. Soc., 2005, 127, 10158–10159 CrossRef CAS PubMed.
- H. D. Smith, C. O. Obenland and S. Papetti, Inorg. Chem., 1966, 5, 1013–1015 CrossRef CAS.
- K. Base and M. W. Grinstaff, Inorg. Chem., 1998, 37, 1432–1433 CrossRef CAS.
- K. Base, M. T. Tierney, A. Fort, J. Muller and M. W. Grinstaff, Inorg. Chem., 1999, 38, 287–289 CrossRef CAS.
- J. A. Weinstein, M. T. Tierney, E. S. Davies, K. Base, A. A. Robeiro and M. W. Grinstaff, Inorg. Chem., 2006, 45, 4544–4555 CrossRef CAS PubMed.
- G. T. Morgan and F. H. Burstall, J. Chem. Soc., 1934, 965–971 RSC.
- J. V. Rund, Inorg. Chem., 1974, 13, 738–740 CrossRef CAS.
- J. A. Todd, D. Caiazza, E. R. T. Tiekink and L. M. Rendina, Inorg. Chim. Acta, 2003, 352, 208–212 CrossRef CAS.
- An examination of the CDS (v. 5.33, updated Feb. 2014) provided to date 37 authentic examples of monomeric [Pt(N^N)(S^S)] complexes.
- 81 complexes featuring the 1,2-dithiolate-closo-1,2-dicarbadodecarborane acting as a bidentate ligand toward a single metal ion were found in the CDS (v. 5.33, updated Feb. 2014).
- R. Coult, M. A. Fox, W. R. Gill and K. Wade, Polyhedron, 1992, 11, 2717–2721 CrossRef CAS.
- The S–Pt–S angles show values similar to those found for the 1,2-dimercapto-o-carborane Pt complexes [Pt(dtoc)(PMe2Ph)2] and [Pt(dtoc)(PMePh2)2], recently reported by: M. K. Pal, V. K. Jain, A. P. Wadawale, S. A. Glazun, Z. A. Starikova and V. I. Bregadze, J. Organomet. Chem., 2012, 696, 4257–4263 CrossRef CAS.
- A search of the Cambridge Crystallographic Database shows that the contacts’ distances fall in the range of similar platinum–C2,2-bipy contacts in 2,2′-bipyridine Pt complexes. See for example: D. E. Janzen and K. R. Mann, J. Chem. Crystallogr., 2013, 43, 292–298 CrossRef CAS; J. Ni, X. Zhang, N. Qiu, Y.-H. Wu, L.-Y. Zhang, J. Zhang and Z.-N. Chen, Inorg. Chem., 2011, 50, 9090–9096 CrossRef PubMed.
- C. E. Keefer, R. D. Bereman, S. T. Purrington, B. W. Knight and P. D. Boyle, Inorg. Chem., 1999, 38, 2294–2302 CrossRef CAS.
- Solvent molecules can freely move up and down the voids hence the type of alkane cannot be unambiguously confirmed by X-ray diffraction analysis. The electron density in the voids was smoothed using the SQUEEZE module in Platon.
- E I1/2 = −1.608, −1.620, −1.740, −1.692, −1.563, and −1.561 V vs. Fc+/Fc for complexes [Pt(N^N)(Me-dmet)] featuring N^N = bipy, phen, Me2bipy, tBu2bipy, Ph2bipy, and Ph2phen, respectively. See ref. 34.
- P. S. Braterman, J.-I. Song, F. M. Wimmer, S. Wimmer, W. Kaim, A. Klein and R. D. Peacock, Inorg. Chem., 1992, 31, 5084–5088 CrossRef CAS.
- The reduction step was recorded in DMF solution at −2.071, −2.12, −2.082, and −2.105 V for [Pt(bipy)(py)2], [Pt(bipy)(Me2N-py)], [Pt(bipy)(en)], and [Pt(phen)(py)2].
- W. Koch and M. C. Holthausen, A Chemist's Guide to Density Functional Theory, Wiley-VCH, Weinheim, Germany, 2nd edn, 2002 Search PubMed.
- C. Adamo and V. Barone, J. Chem. Phys., 1999, 110, 6158–6170 CrossRef CAS.
- A. Schäfer, H. Horn and R. Ahlrichs, J. Chem. Phys., 1992, 97, 2571–2577 CrossRef.
- W. C. Ermler, R. B. Ross and P. A. Christiansen, Int. J. Quantum. Chem., 1991, 40, 829–846 CrossRef CAS.
- T. H. Dunning Jr. and P. J. Hay, in Methods of Electronic Structure, Theory, ed. H. F. Schaefer III, Plenum Press, New York, 1977, vol. 2 Search PubMed.
- J. V. Ortiz, P. J. Hay and R. L. Martin, J. Am. Chem. Soc., 1992, 114, 2736–2737 CrossRef CAS.
- B. A. Hess, Relativistic Effects in Heavy Element Chemistry and Physics, Wiley-VCH, Weinheim, 2003 Search PubMed.
- J. Tomasi, B. Mennucci and R. Cammi, Chem. Rev., 2005, 105, 2999–3094 CrossRef CAS PubMed.
- In particular, the optimised C(1)–C(2) bond distances vary within 0.002 Å along the series of the solvents considered in this work (Table S2†), thus factoring out a direct relationship between the structural features of the 1,2-dithiolates and the observed solvatochromic behaviour, reported recently in the case of different fluorescent o-carborane derivatives; see: A. Ferrer-Ugalde, A. Gonzáles-Campo, C. Viñas, J. Rodríguez-Romero, R. Santillan, N. Farfán, R. Sillampaä, A. Sousa-Pedrares, R. Núñes and F. Teixidor, Chem. – Eur. J., 2014 DOI:10.1002/chem.201402396.
- Notably, the MO composition calculated here is different from the results previously reported for 6 in ref. 67, where – in contrast with experimental spectroscopic and electrochemical measurements – both the HOMO and the LUMO were reported to be centered on the diimine.
- X. Liu, Y. Qiu, H. Chen, N. Li, S. Sun and Z. Su, Sci. China, Ser. B: Chem., 2009, 52, 144–152 CrossRef CAS.
- KS-HOMO eigenvalues calculated in the gas phase for complexes 1–6: −5.73, −5.69, −5.58, −5.52, −5.59, −5.56 eV, respectively.
- KS-HOMO eigenvalues calculated in the gas phase: −4.49, −4.43, −4.33, −4.49, −4.39, and −4.34 eV for N^N = bipy, phen, Me2bipy, tBu2bipy, Ph2bipy, and Ph2phen, respectively. See ref. 34.
- A. E. Reed, R. B. Weinstock and F. Weinhold, J. Chem. Phys., 1985, 83, 735–746 CrossRef CAS.
- Calculated λmax values (nm) of the S0→S2 vertical transition for complexes 1–6 in DMSO (IEF-PCM SCRF model): 444, 444, 437, 425, 459, and 459 nm, respectively.
- Calculated λmax values: CH2Cl2 462, CHCl3 481, CH3CN 444, acetone 449, DMF 445, THF 466, toluene 519 nm.
- (a) A. Colombo, C. Dragonetti, D. Marinotto, S. Righetto, D. Roberto, S. Tavazzi, M. Escadeillas, V. Guerchais, H. Le Bozec, A. Boucekkine and C. Latouche, Organomet. Chem., 2013, 32, 3890–3894 CrossRef CAS; (b) A. Valore, A. Colombo, C. Dragonetti, S. Righetto, D. Roberto, R. Ugo, F. De Angelis and S. Fantacci, Chem. Commun., 2010, 46, 414–2416 RSC; (c) S. De Bella, C. Dragonetti, M. Pizzotti, D. Roberto, F. Tessore and R. Ugo, Top. Organomet. Chem., 2010, 28, 1–55 CrossRef.
- G. M. Sheldrick, Acta Crystallogr., Sect. D: Biol. Crystallogr., 2008, 64, 112–122 CrossRef CAS PubMed.
- M. J. Frisch, G. W. Trucks, H. B. Schlegel, G. E. Scuseria, M. A. Robb, J. R. Cheeseman, G. Scalmani, V. Barone, B. Mennucci, G. A. Petersson, H. Nakatsuji, M. Caricato, X. Li, H. P. Hratchian, A. F. Izmaylov, J. Bloino, G. Zheng, J. L. Sonnenberg, M. Hada, M. Ehara, K. Toyota, R. Fukuda, J. Hasegawa, M. Ishida, T. Nakajima, Y. Honda, O. Kitao, H. Nakai, T. Vreven, J. A. Montgomery Jr., J. E. Peralta, F. Ogliaro, M. Bearpark, J. J. Heyd, E. Brothers, K. N. Kudin, V. N. Staroverov, R. Kobayashi, J. Normand, K. Raghavachari, A. Rendell, J. C. Burant, S. S. Iyengar, J. Tomasi, M. Cossi, N. Rega, J. M. Millam, M. Klene, J. E. Knox, J. B. Cross, V. Bakken, C. Adamo, J. Jaramillo, R. Gomperts, R. E. Stratmann, O. Yazyev, A. J. Austin, R. Cammi, C. Pomelli, J. W. Ochterski, R. L. Martin, K. Morokuma, V. G. Zakrzewski, G. A. Voth, P. Salvador, J. J. Dannenberg, S. Dapprich, A. D. Daniels, O. Farkas, J. B. Foresman, J. V. Ortiz, J. Cioslowski and D. J. Fox, Gaussian 09, Revision A.02, Gaussian, Inc., Wallingford CT, 2009 Search PubMed.
- R. S. Mulliken, J. Chem. Phys., 1955, 23, 1833–1840 CrossRef CAS.
- M. P. Cifuentes and M. G. Humphrey, J. Organomet. Chem., 2004, 3968–3981 CrossRef CAS.
- P. J. Mendes, A. J. P. Carvalho and J. P. P. Ramalho, J. Mol. Struct. (THEOCHEM), 2009, 900, 110–117 CrossRef CAS.
- D. A. Kleinman, Phys. Rev., 1962, 126, 1977–1979 CrossRef CAS.
- R. Dennington, T. Keith and J. Millam, GaussView, Version 5, Semichem Inc., Shawnee Mission KS, 2009 Search PubMed.
- G. Schaftenaar and J. H. Noordik, J. Comput.-Aided Mol. Des., 2000, 14, 123–134 CrossRef CAS PubMed.
- N. M. O'Boyle, A. L. Tenderholt and K. M. Langner, J. Comput. Chem., 2008, 29, 839–845 CrossRef PubMed.
Footnote |
| † Electronic supplementary information (ESI) available: Details on the characterization of complexes 2–5, crystallographic data for complexes 1 and 4, metric parameters optimized in the gas phase and in selected solvents, calculated eigenvalues and MO compositions, NPA charges, details on vertical transitions calculated at the TD-DFT level, correlations between UV–vis absorption wavelengths in selected solvents and empirical parameters, correlation between CV data and UV–vis absorption wavelengths, KS-MO scheme calculated for complex 2 in DMSO, correlation between experimental and calculated absorption wavelengths in DMSO, correlation between experimental and calculated solvatochromic absorption wavelengths. CCDC 1010434 and 1010435. For ESI and crystallographic data in CIF or other electronic format see DOI: 10.1039/c4dt01929f |
| This journal is © The Royal Society of Chemistry 2014 |