 Open Access Article
 This Open Access Article is licensed under a
 Creative Commons Attribution 3.0 Unported Licence
Excited state potential energy surfaces and their interactions in FeIV![[double bond, length as m-dash]](https://www.rsc.org/images/entities/h2_char_e001.gif) O active sites
O active sites
Martin
Srnec
ab,
Shaun D.
Wong
a and
Edward I.
Solomon
*a
aDepartment of Chemistry, Stanford University, Stanford, CA 94305-5080, USA. E-mail: edward.solomon@stanford.edu
bJ. Heyrovský Institute of Physical Chemistry, AS CR, v.v.i., Czech Republic
First published on 4th June 2014
Abstract
The non-heme ferryl active sites are of significant interest for their application in biomedical and green catalysis. These sites have been shown to have an S = 1 or S = 2 ground spin state; the latter is functional in biology. Low-temperature magnetic circular dichroism (LT MCD) spectroscopy probes the nature of the excited states in these species including ligand-field (LF) states that are otherwise difficult to study by other spectroscopies. In particular, the temperature dependences of MCD features enable their unambiguous assignment and thus determination of the low-lying excited states in two prototypical S = 1 and S = 2 NHFeIV![[double bond, length as m-dash]](https://www.rsc.org/images/entities/char_e001.gif) O complexes. Furthermore, some MCD bands exhibit vibronic structures that allow mapping of excited-state interactions and their effects on the potential energy surfaces (PESs). For the S = 2 species, there is also an unusual spectral feature in both near-infrared absorption and MCD spectra – Fano antiresonance (dip in Abs) and Fano resonance (sharp peak in MCD) that indicates the weak spin–orbit coupling of an S = 1 state with the S = 2 LF state. These experimental data are correlated with quantum-chemical calculations that are further extended to analyze the low-lying electronic states and the evolution of their multiconfigurational characters along the Fe–O PESs. These investigations show that the lowest-energy states develop oxyl FeIII character at distances that are relevant to the transition state (TS) for H-atom abstraction and define the frontier molecular orbitals that participate in the reactivity of S = 1 vs. S = 2 non-heme FeIVO active sites. The S = 1 species has only one available channel that requires the C–H bond of a substrate to approach perpendicular to the Fe–oxo bond (the π channel). In contrast, there are three channels (one σ and two π) available for the S = 2 non-heme FeIVO system allowing C–H substrate approach both along and perpendicular to the Fe–oxo bond that have important implications for enzymatic selectivity.
O complexes. Furthermore, some MCD bands exhibit vibronic structures that allow mapping of excited-state interactions and their effects on the potential energy surfaces (PESs). For the S = 2 species, there is also an unusual spectral feature in both near-infrared absorption and MCD spectra – Fano antiresonance (dip in Abs) and Fano resonance (sharp peak in MCD) that indicates the weak spin–orbit coupling of an S = 1 state with the S = 2 LF state. These experimental data are correlated with quantum-chemical calculations that are further extended to analyze the low-lying electronic states and the evolution of their multiconfigurational characters along the Fe–O PESs. These investigations show that the lowest-energy states develop oxyl FeIII character at distances that are relevant to the transition state (TS) for H-atom abstraction and define the frontier molecular orbitals that participate in the reactivity of S = 1 vs. S = 2 non-heme FeIVO active sites. The S = 1 species has only one available channel that requires the C–H bond of a substrate to approach perpendicular to the Fe–oxo bond (the π channel). In contrast, there are three channels (one σ and two π) available for the S = 2 non-heme FeIVO system allowing C–H substrate approach both along and perpendicular to the Fe–oxo bond that have important implications for enzymatic selectivity.
 Martin Srnec | Martin Srnec completed his PhD in 2010 at the Institute of Organic Chemistry and Biochemistry, Academy of Sciences of the Czech Republic and then he spent two years (2011–2013) at Stanford University, USA, with Prof. E. I. Solomon as a postdoctoral fellow. Currently, he is a researcher at the J. Heyrovský Institute of Physical Chemistry, AS CR in Prague. He is mainly interested in the application of spectroscopic and quantum chemical methods to elucidate reaction mechanisms of redox-active metalloenzymes. |
 Shaun D. Wong | Shaun Wong received his B.S. in chemistry from UC Berkeley and his Ph.D. from Stanford University. His work centered on elucidating the electronic structures and reaction mechanisms of low- and high-spin Fe(IV)–oxo species in enzymes and model complexes. |
 Edward I. Solomon | Edward I. Solomon grew up in North Miami Beach, Florida, received his Ph.D. at Princeton (with D. S. McClure), and was a postdoctoral fellow at The Ørsted Institute (with C. J. Ballhausen) and then at Caltech (with H. B. Gray). He was a Professor at the Massachusetts Institute of Technology until 1982, when he joined the faculty at Stanford University, where he is now the Monroe E. Spaght Professor of Humanities and Sciences and Professor of Photon Science at SLAC National Accelerator Lab. He has been an Invited Professor in Argentina, Australia, Brazil, China, France, India, and Japan. Professor Solomon's research is in the fields of Physical-Inorganic and Bioinorganic Chemistry with emphasis on the application of a wide range of spectroscopic methods combined with QM calculations to elucidate the electronic structure of transition metal sites and its contribution to physical properties and reactivity. |
Introduction
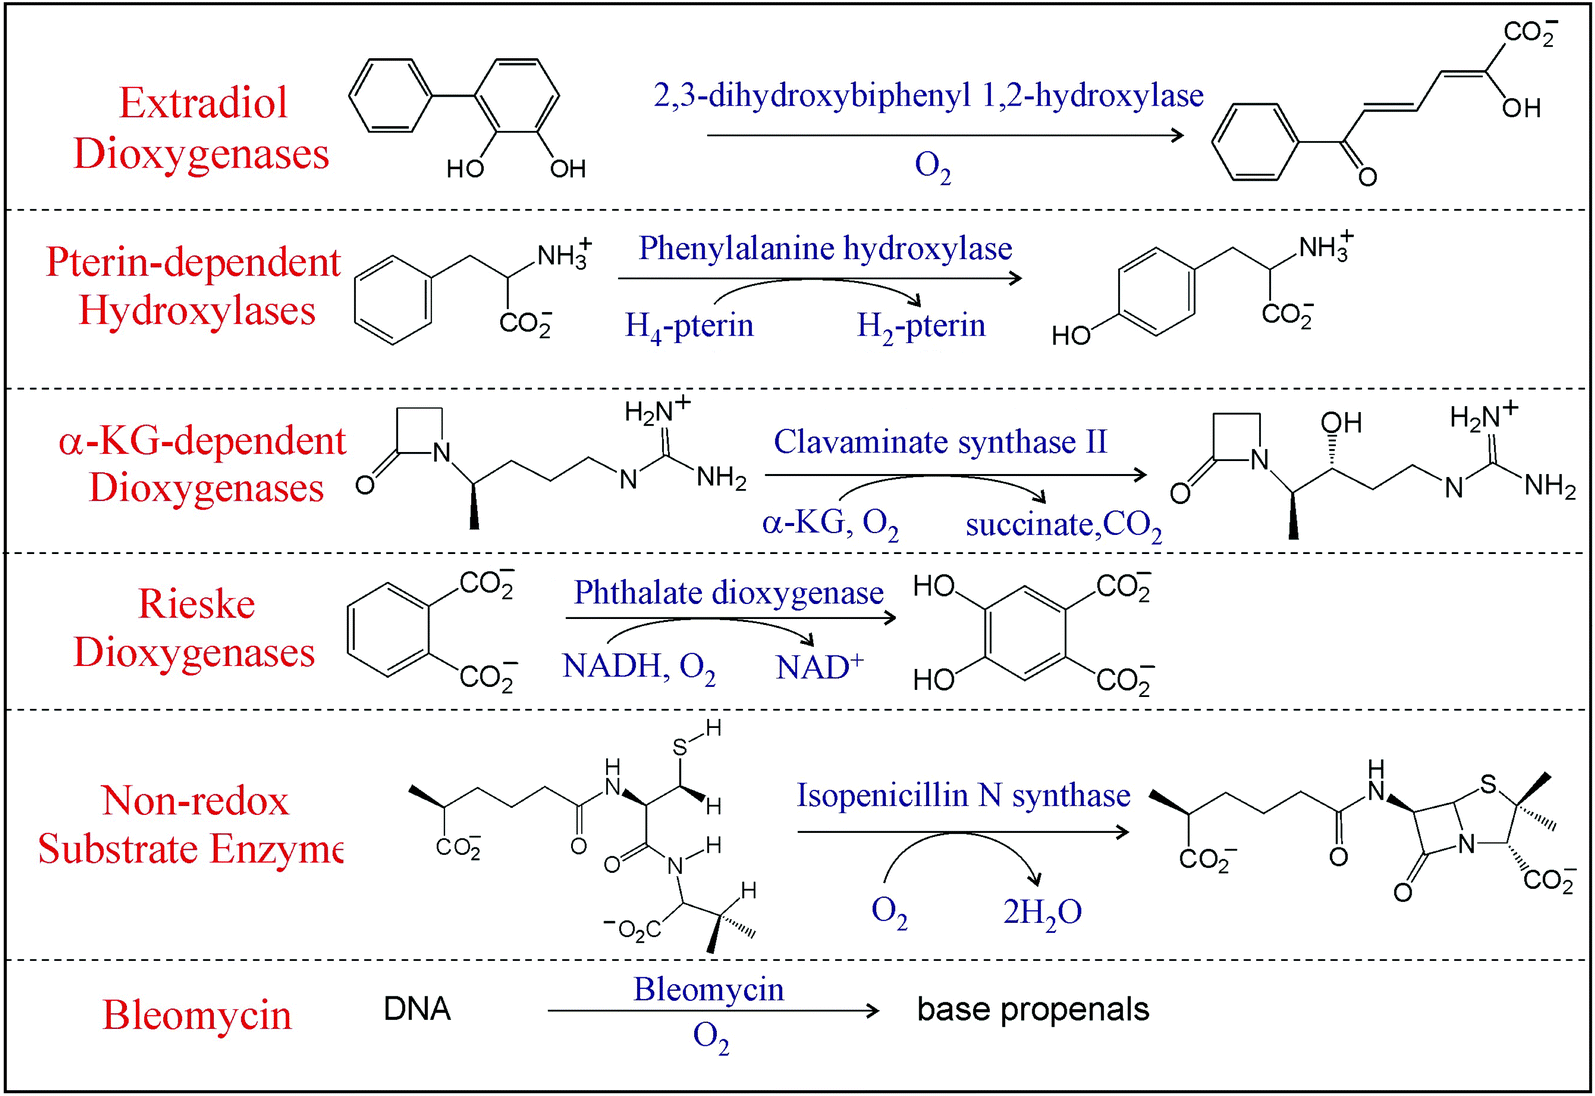
Mononuclear non-heme iron (NHFe) enzymes, ubiquitous in living organisms, are involved in many vital biological processes including the regulation of hypoxia, demethylation of DNA, antibiotic, and natural product biosynthesis and bioremediation, and are related to disease states.1,2 Most of these enzymes use an S = 2 FeII center to activate 3O2 to perform various ‘difficult’ and formally spin-forbidden reactions including hydroxylation, halogenation, desaturation, and electrophilic aromatic substitution on unreactive singlet organic substrates that require the cleavage of strong aliphatic or aromatic C—H bonds. The mononuclear NHFe enzymes can be divided into six classes3 based on their O2 activation mechanism (Table 1; here we omit classes where substrates are activated by an S = 5/2 NHFeIII active site to react with dioxygen – see ref. 4). In the Rieske dioxygenases, O2 is reduced by two electrons (one e− from the FeII center and one e− from an adjacent Fe2S2 Rieske center) that gives rise to a reactive high-spin (S = 5/2) FeIII–OOH intermediate.5 Similarly, in bleomycin, a glycopeptide antibiotic used in anticancer therapy,6 dioxygen is activated to form a low-spin (S = 1/2) FeIII–OOH intermediate.7 Alternatively, in the extradiol dioxygenases, 2e− from the catecholate substrate reduce O2 leading to what is thought to be a peroxy-quinone-bridged FeII intermediate.5 Provided the FeII center is the only source of electrons as is in the case for the class of enzymes that have no cofactor and a non-redox active substrate that include isopenicillin-N-synthase (IPNS), the 1e− reduction of O2 can give the thermodynamically unfavored high-spin (Stotal = 2) FeIII–O2˙− intermediate.8 In the two most prevalent NHFe classes that use either a pterin or an α-ketoglutarate as a cofactor, the formation of high-spin S = 2 FeIVO (ferryl) intermediates proceed through the four-electron reduction of O2 (2e− from FeII and 2e− from the cofactor).9 Note these NHFe oxygen intermediates, in spite of their elusiveness, have attracted much attention for their reactivities and selectivities as exemplified by studies on the high-spin (S = 2) FeIVO intermediate in syringomycin halogenase (SyrB2).10–13
|
Efforts to understand the general physico-chemical factors that control reaction mechanisms of NHFe enzymes have also catalyzed interest in the syntheses and crystallographic characterizations of model NHFe complexes that include low-spin (S = 1) and high-spin (S = 2) FeIVO complexes.14–19 These enable an important step toward the elucidation of geometric and electronic properties contributing to NHFe function: the spectroscopic and quantum-chemical elucidation of the frontier molecular orbitals (FMOs) and their contributions to reactivity in model S = 1 and S = 2 FeIVO systems.20–28 For the S = 1 FeIVO species, the pair of singly-occupied dπ* FMOs, resulting from the strong antibonding interaction between oxo px,y and Fe dxz/yz orbitals, were shown to define the π channel for H-atom abstraction (HAA) which requires for reactivity the perpendicular orientation of the substrate C–H bond with respect to the Fe–oxo bond.21 For the S = 2 FeIVO species, two types of FMOs were defined, i.e., dσ* and dπ*. The dπ* defines a π channel similar to the S = 1 FeIVO species, while dσ* arises from the strong σ antibonding interaction of the oxo pz with the Fe dz2 orbital and defines the σ channel for HAA that requires collinear orientation of the substrate C–H bond relative to FeIVO bond.22 This additional σ channel in S = 2 complexes was elucidated on the basis of spin unrestricted MO theory as given in Fig. 1. In going from an S = 1 to an S = 2 FeIVO system, the excitation of a β e− from the non-bonding dxy orbital into the α-dx2−y2 orbital leads to a considerable electron–electron exchange stabilization (referred in the literature to as spin polarization20 or exchange enhancement23) that shifts the α-MO manifold down in energy; thus the unoccupied α-dσ* becomes energetically comparable to the dπ* FMOs and accessible for reactivity.21 The flexibility of S = 2 species in using dσ* and/or dπ* FMOs were shown to be key to the reaction selectivity in SyrB212 where dπ* vs. dσ* control halogenation vs. hydroxylation of different substrates, and in HmaS vs. HPPD,29 where dπ* vs. dσ* participate in HAA vs. electrophilic aromatic substitution (EAS) on the same substrate.
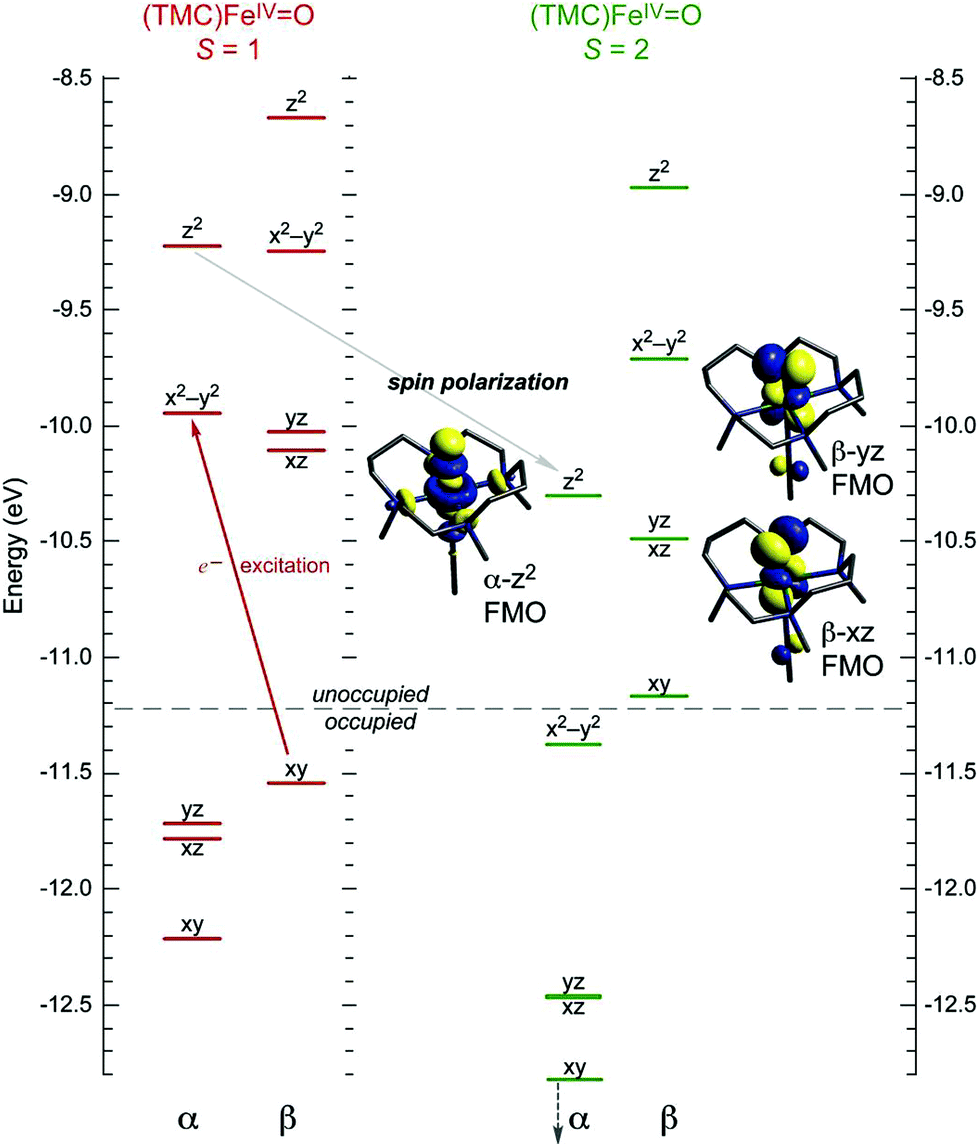 | ||
| Fig. 1 MO diagrams of (CH3CN)(TMC)FeIVO in S = 1 (ground) and S = 2 spin states, showing that excitation of β-dxy e− into α-dx2−y2 orbital leads to spin polarization of the α-manifold and an additional low-energy α-dz2 FMO available for reactivity. | ||
From the experimental perspective, these FMOs can be studied through electronic spectroscopy particularly of the ligand-field (LF) transitions. These correspond to excitations into low-lying unoccupied d orbitals that get significant oxo character (hence their electrophilicity) through covalent bonding. However, these absorption (Abs) spectra are generally quite featureless due to band overlaps and thus not very informative. By contrast, the variable-temperature magnetic circular dichroism (VT MCD) spectra are much more resolved and thus give unique insight into these excited states and thus the FMOs that are key to electrophilic reactivity.
In this perspective, we focus on our spectroscopic results on the first structurally defined ∼C4v symmetric S = 1 FeIVO complex [chelated by the tetradentate 1,4,8,11-tetramethyl-1,4,8,11-tetraazacyclotetradecane (TMC) ligand with an axially bound acetonitrile and denoted as (CH3CN)(TMC)FeIVO; see Fig. 2]30 and the first structurally defined C3v-like symmetric S = 2 FeIVO complex [chelated by the tetradentate 1,1,1-tris{2-[N2-(1,1,3,3-tetramethylguanidino)]ethyl}amine (TMG3tren) ligand; (TMG3tren)FeIVO; see Fig. 2].31 Both complexes were synthesized and structurally defined by Prof. L. Que and colleagues. In this perspective, we will show how VT MCD spectroscopy (combined with Abs spectroscopy and quantum-chemical calculations) allowed the description of low-lying excited states, their interactions that shape excited-state potential-energy surfaces and how these allow the experimental definition of FMOs that ultimately provide insight into reactivity of S = 1 and S = 2 FeIVO species of biological and catalytic significance.
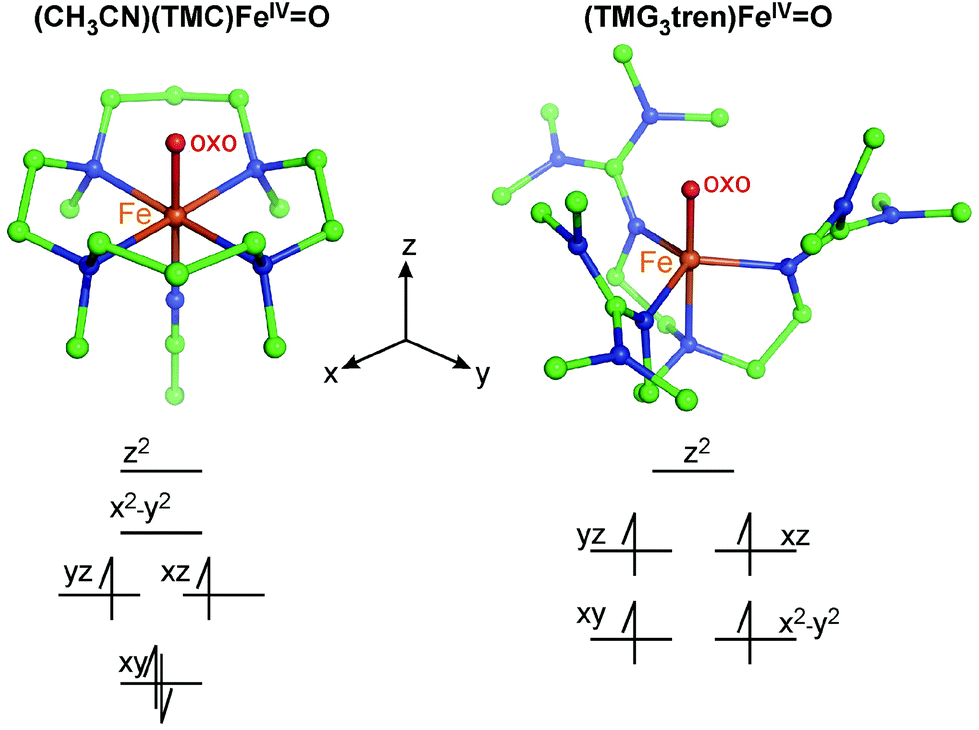 | ||
| Fig. 2 Two crystallographically characterized NHFeIVO complexes (crystal structures from ref. 30 and 31). Atoms are color-coded as follows: C (green), N (blue), O (red) and Fe (orange). The d-manifold splittings in both C4v- and C3v-like symmetric structures, along with electron occupations, are qualitatively depicted. | ||
S = 1 NHFeIV![[double bond, length as m-dash]](https://www.rsc.org/images/entities/h3_char_e001.gif) O species
O species
The Abs and MCD spectra of the S = 1 (CH3CN)(TMC)FeIVO model complex are shown in Fig. 3A and B, respectively. While the Abs spectrum clearly shows three spectral features (at ∼12![[thin space (1/6-em)]](https://www.rsc.org/images/entities/char_2009.gif) 250, ∼17500 (weak) and 24900 cm−1 (strong)), the VT MCD spectra are much more resolved such that the near-infrared (NIR) feature centered at 12250 cm−1 is composed of three overlapping bands (one having vibronic structure), two of which have positive MCD intensity (bands labelled I and III at ∼10400 and ∼12900 cm−1 in Fig. 3B) while one is negative (band II at ∼10600 cm−1 with sharp features). Additionally, the temperature dependence of these bands gives valuable information on the polarizations of the electronic transitions in frozen solution, where all orientation of the molecules are present. These polarizations allow the ground state to be coupled to the excited states leading to (along with the analysis of C0/D0 ratios)32 the assignment of the MCD/Abs bands. This is given by the selection rules for MCD transitions from a zero-field-split (ZFS) S = 1 ground spin state that is further split due to interaction with the external magnetic field (Fig. 4C and ref.20, 21).
250, ∼17500 (weak) and 24900 cm−1 (strong)), the VT MCD spectra are much more resolved such that the near-infrared (NIR) feature centered at 12250 cm−1 is composed of three overlapping bands (one having vibronic structure), two of which have positive MCD intensity (bands labelled I and III at ∼10400 and ∼12900 cm−1 in Fig. 3B) while one is negative (band II at ∼10600 cm−1 with sharp features). Additionally, the temperature dependence of these bands gives valuable information on the polarizations of the electronic transitions in frozen solution, where all orientation of the molecules are present. These polarizations allow the ground state to be coupled to the excited states leading to (along with the analysis of C0/D0 ratios)32 the assignment of the MCD/Abs bands. This is given by the selection rules for MCD transitions from a zero-field-split (ZFS) S = 1 ground spin state that is further split due to interaction with the external magnetic field (Fig. 4C and ref.20, 21).
 | ||
| Fig. 3 A. The 233 K absorption spectrum and B. VT MCD spectra of the S = 1 (CH3CN)(TMC)FeIVO model complex (adapted from ref. 20). Temperature-dependent behaviors of bands I, II and III interpreted based on zero-field and magnetic-field splitting diagram (C), giving definitive band assignments. D. Vibronic progression of band II (40 K; plotted positive). E. MO diagram producing two degenerate dπ* FMOs and dσ* LUMO. F. Parabolic representations of ground- and excited-state potential surfaces of (CH3CN)(TMC)FeIVO showing origin of reduced-frequency excited-state vibronic progression in MCD data in panel D. | ||
 | ||
| Fig. 4 A. The 233 K absorption spectrum of the S = 2 (TMG3tren)FeIVO complex (adapted from ref. 22). The Abs spectrum (bold dark blue) in the 16000–30000 cm−1 region fit by five Gaussians (dotted black lines). B. Variable-temperature (VT) MCD spectra. For the three lowest-energy spectral features (I, II and III), their polarizations along with C0/D0 parameters are shown. C. VT MCD features I and II for 5 mM and 10 mM samples, respectively (left and right boxes) along with temperature-dependence behaviors of MCD intensities I and II (taken at the energies as indicated by *), overlaid with red and green lines simulating pure (x,y)-pol. and z-pol. behaviors for D of +7.0 and +7.5 cm−1, respectively (left and right graphs). D. Splitting of MS sublevels of an S = 2 species with an applied field H. E. TD-DFT-calculated electronic transitions (for technical details see SI of ref. 22). Dominant character and polarization are indicated. Note the (x,y)-polarized Neq-based CT transition calculated to be between the two lowest-energy z-polarized oxo CT transitions is ruled out as the assignment of the 23000 cm−1 band in MCD by both its polarization from VT MCD and by resonance Raman data (ref. 31). | ||
Using the phenomenological spin Hamiltonian that includes the ZFS term D(S2z − S(S + 1)/3) + E(S2x − S2y) with axial D and rhombic E ZFS parameters, the analysis of magnetic Mössbauer spectra of the (CH3CN)(TMC)FeIVO complex showed E to be negligible and D = +29 cm−1.30 As depicted in Fig. 3C, for this positive D value, the ground triplet state splits into two sublevels with two-fold degenerate MS = ±1 lying above the MS = 0 sublevel. From the selection rules for MCD intensity, the magnetic field (H) must be perpendicular to the polarization direction of the transition. Thus a z-polarized transition requires H to be perpendicular to the molecular z axis (coinciding with the Fe–oxo bond). In this case, the Zeeman-induced mixing between MS = −1 and MS = 0 results in significant MS = −1 character in the ground sublevel at H = 7 T. From this MCD-active sublevel, the z-polarized transition exhibits the highest MCD intensity at lowest temperature, T (∼2 K) that decreases with increasing T because of increased Boltzmann populations of higher-energy sublevels: the MCD-inactive MS = 0 and opposite-signed MS = +1. For an (x,y)-polarized transition, H is required to be parallel to the molecular z axis. This leaves the MCD-inactive MS = 0 as the ground sublevel at H = 7 T. As a consequence, the intensity of a (x,y)-polarized MCD band is low at low temperature and increases with increasing T because of an increased Boltzmann population of the first excited MCD-active MS = −1 sublevel. Further increasing the T decreases the MCD intensity because the third sublevel, MS = +1, becomes populated, producing MCD intensity of opposite sign.
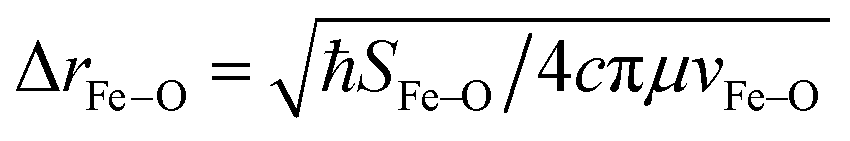
From these selection rules, band I in Fig. 3B was shown to be z-polarized (decreasing in intensity with increasing T), while bands II and III are (x,y)-polarized (both first increase and then decrease with increasing T). In particular, the different polarizations (and thus temperature behavior) of the two overlapping bands I and II allowed these to be decoupled and band II to be unambiguously associated with the MCD vibronic structure (plotted as a positive band in Fig. 3D). From group theory and DFT calculations, band II was assigned as the lowest-energy (x,y)-polarized dxy→dπ*xz/yz ligand-field (LF) transition (MOs shown in Fig. 3E; band I and III, IV and V are assigned as indicated in Fig. 3B). Importantly, this transition, due to its vibronic progression in the Fe–oxo stretch, is a direct experimental probe of how the dπ* FMO changes when occupied by a nonbonding e− (the dxy is nonbonding in C4v). A Frank-Condon (FC) analysis of this vibronic progression provides important parameters that characterize the PES of this excited state in the vicinity of ground-state equilibrium geometry: (i) the frequency of the Fe–oxo stretching mode in this excited state, which corresponds to the spacing between two adjacent peaks in the vibronic progression (νFe–O = 620 cm−1); and (ii) the excited-state distortion relative to the ground-state equilibrium structure. The vibronic progression in Fig. 3D gives ΔrFe–O (= 0.14 Å), which was determined from eqn (1):
 | (1) |
 | (2) |
900 cm−1 in Fig. 3B and displayed in Fig. 3E). These results have important implications for the H-atom abstraction (HAA) reaction coordinate for S = 1 FeIVO systems. HAA must involve this low-energy Fe dπ* orbital that accepts the e− from the substrate requiring good overlap with the C–H σ orbital. Since the dπ* is oriented perpendicular to the Fe–oxo bond (thus having significant oxo px,y π character), a perpendicular orientation of the C–H relative to the Fe–oxo bond is required for an accessible HAA trajectory (Scheme 1). Note, in the model complexes, there are likely steric effects of the equatorial chelate that hinder this π-channel in S = 1 FeIVO sites (see ref. 34).
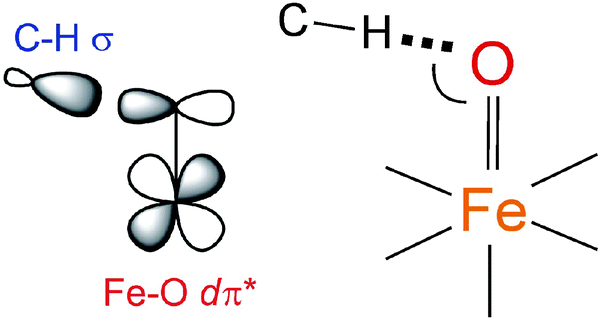 | ||
| Scheme 1 The dπ* FMO interacting with the electron-donating C–H σ orbital (left) and thus defining H-atom abstraction reaction coordinate for the S = 1 NHFeIVO species (right). | ||
Alternatively to the S = 1 π channel, several computational works suggested a possible spin crossover from S = 1 to S = 2 in the HAA process.35,36 The feasibility of such a two-state mechanism depends on the accessibility of a S = 2 state that is obtained by the excitation of a β-dxy e− into the α-dx2−y2 orbital. This would lead to a large stabilization of the α-dz2 σ* orbital (Fig. 1). This stabilization would provide the σ* FMO for HAA, which requires the collinear orientation of the substrate C–H relative to Fe–oxo bond and thus could overcome the chelate steric hindrance in some S = 1 systems.
S = 2 NHFeIVO species
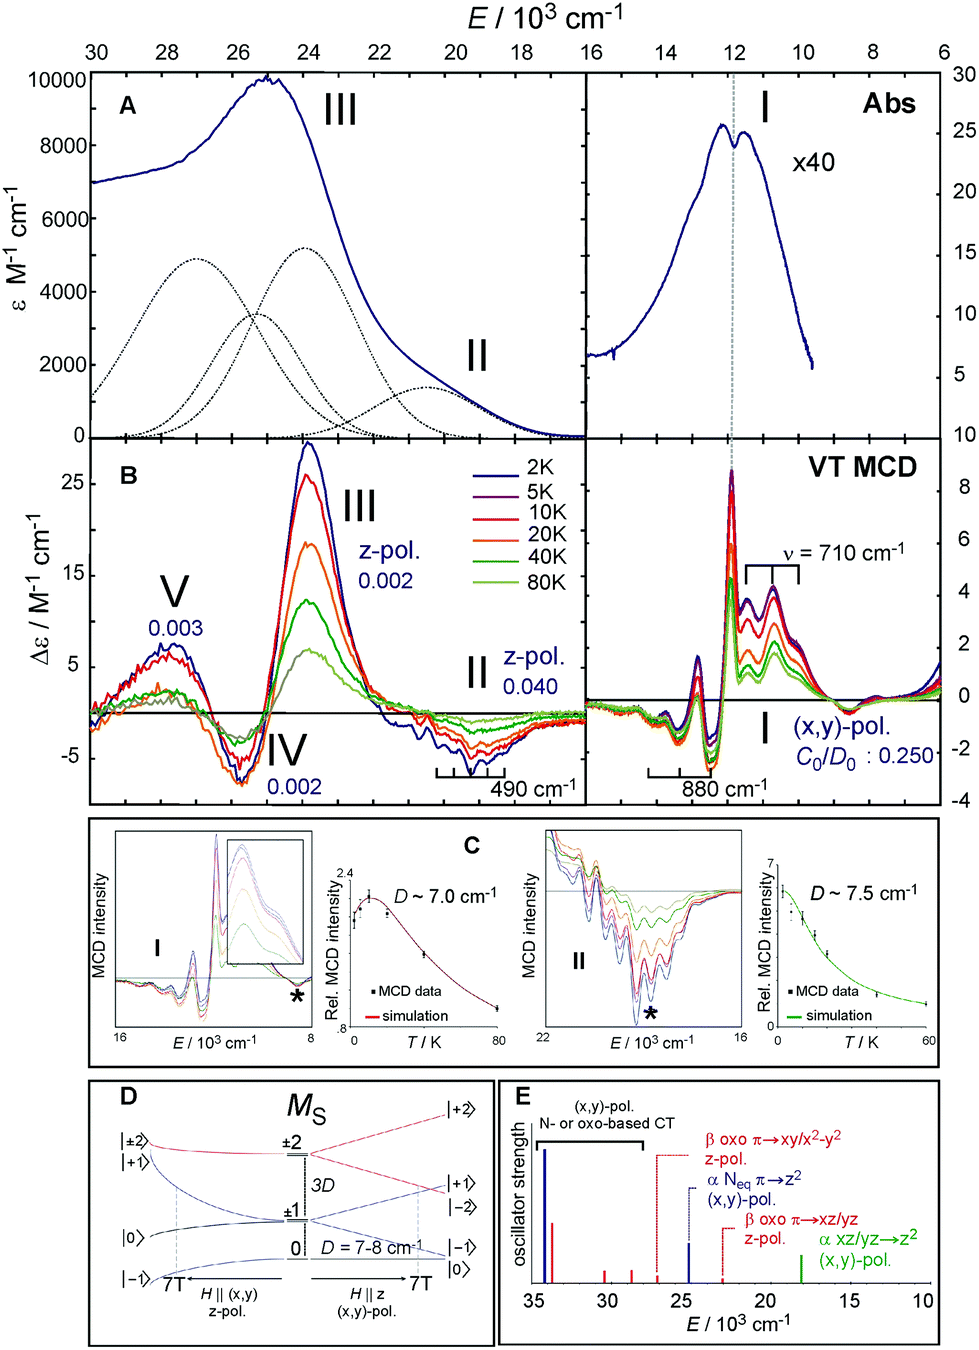
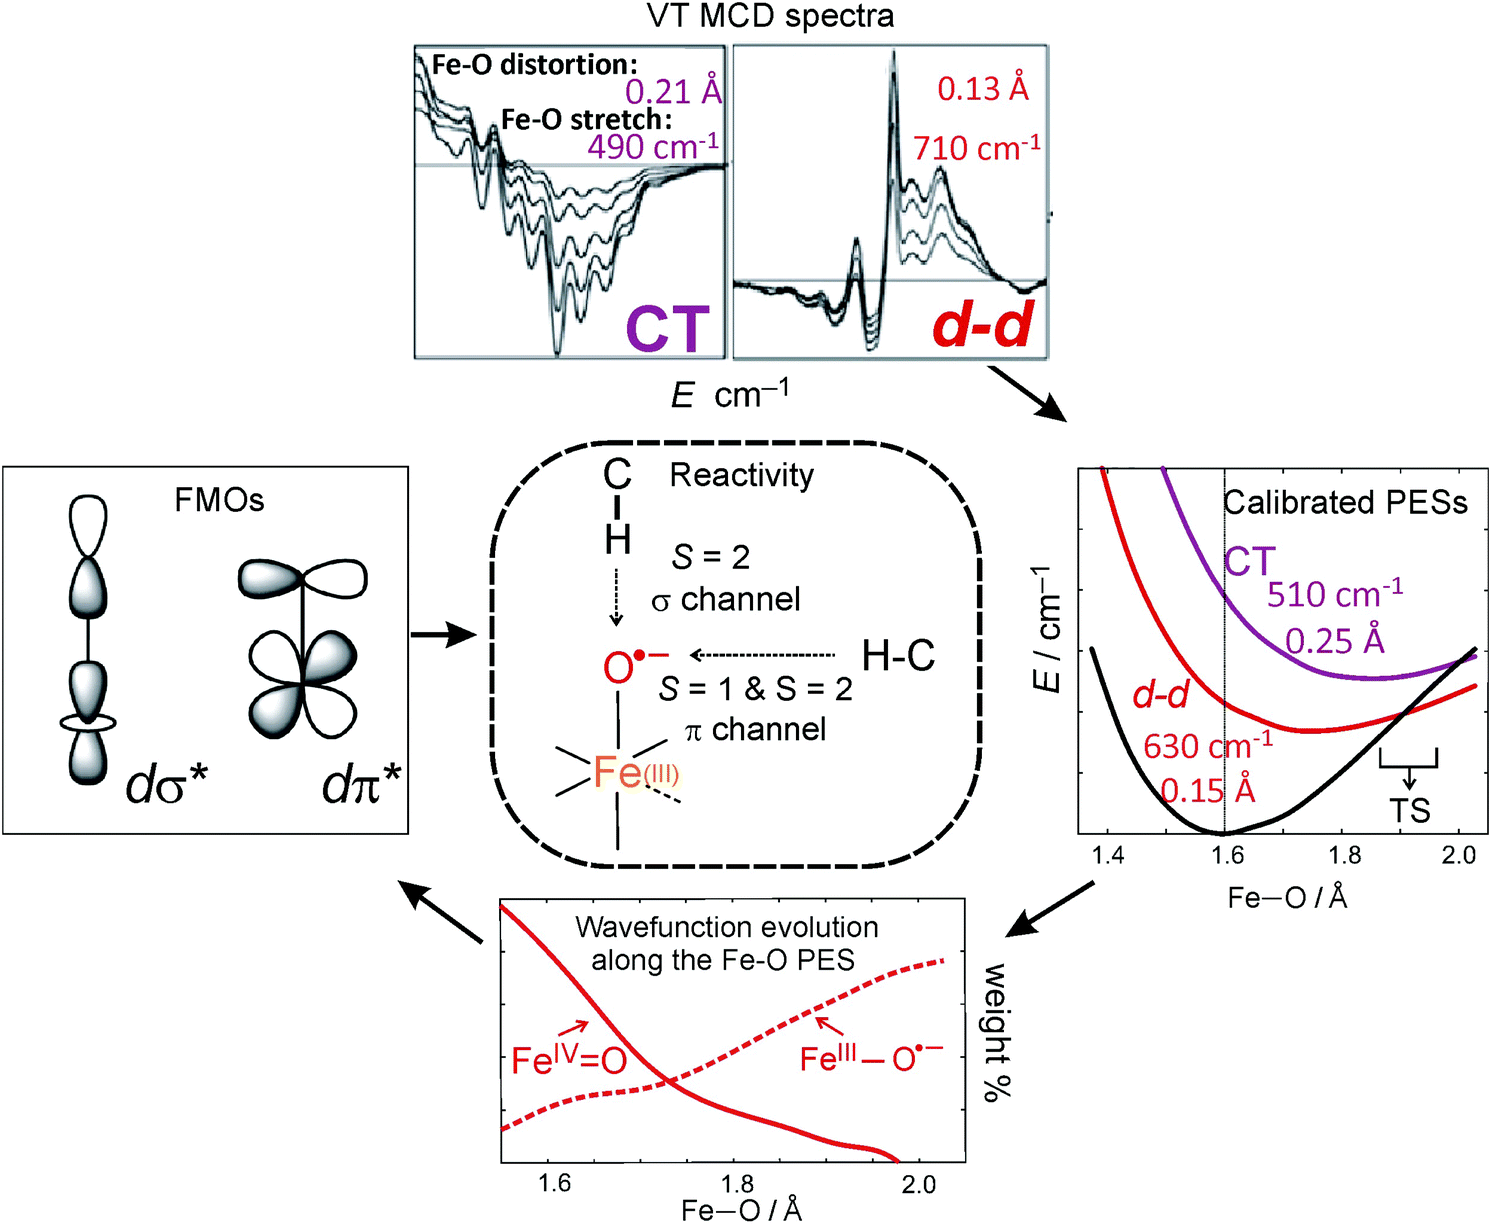
The Abs spectrum of the prototypical S = 2 ferryl complex, (TMG3tren)FeIVO,31,37 exhibits three noticeable spectral features (Fig. 4A). Within the 6000–16000 cm−1 region, there is a weak Abs band centered at 12500 cm−1 (labelled as band I) having a dip in its intensity at ∼12000 cm−1, while the 16000–30000 cm−1 (UV-vis) region is characterized by an intense broad band at 25000 cm−1 (band III) with a weak shoulder at 19000 cm−1 (band II). These bands become much more revealing in the LT MCD spectrum. Thus, as shown in Fig. 4B, the NIR feature I in fact consists of three overlapping bands: a lower-energy positive and higher-energy negative vibronic progression with a spacing of 710 and 880 cm−1, respectively, and one positive sharp peak that is at the same energy as the dip in Abs (dashed vertical line in Fig. 4A and B). Additionally, the MCD reveals that four bands contribute to the Abs envelope in the UV-vis region (bands II, III, IV and V in Fig. 4A and B), where the negatively signed band II has well-resolved vibronic structure with a spacing of 490 cm−1.
These MCD features (I–III) clearly exhibit two different VT behaviors that reflect different band polarizations. Feature I first increases and then decreases in intensity with increasing temperature, while bands II and III decrease in intensity with increasing T (Fig. 4C). These behaviors are well fit for the axial D ZFS parameter of +7–8 cm−1. For a given ZFS of the S = 2 ground state that is further split in the presence of the magnetic field (Fig. 4D) and following the theory described in section 2, the temperature dependences show that feature I is (x,y)-polarized, and bands II and III are z-polarized.
Features I–V were also characterized in terms of their C0/D0 ratios32 (included in Fig. 4B), with a large value for I (0.250) and significantly smaller values for II–V (<0.040). These indicate that feature I corresponds to a LF transition, while bands II–V are charge-transfer (CT) transitions. These experimental data, further correlated to TD-DFT calculations (Fig. 4E), led to the unambiguous assignment of the three lowest-energy features: Band I is the two-fold degenerate (x,y)-polarized α dπ*xz/yz→dσ*z2 LF transition (i.e., 5A1→LF 5E), and bands II–III are the z-polarized β oxo πx/y→dπ*xz/yz CT transitions. The molecular orbitals involved along with the transitions to the lowest-energy excited state LF 5E are schematically depicted in Fig. 5A and B, respectively.
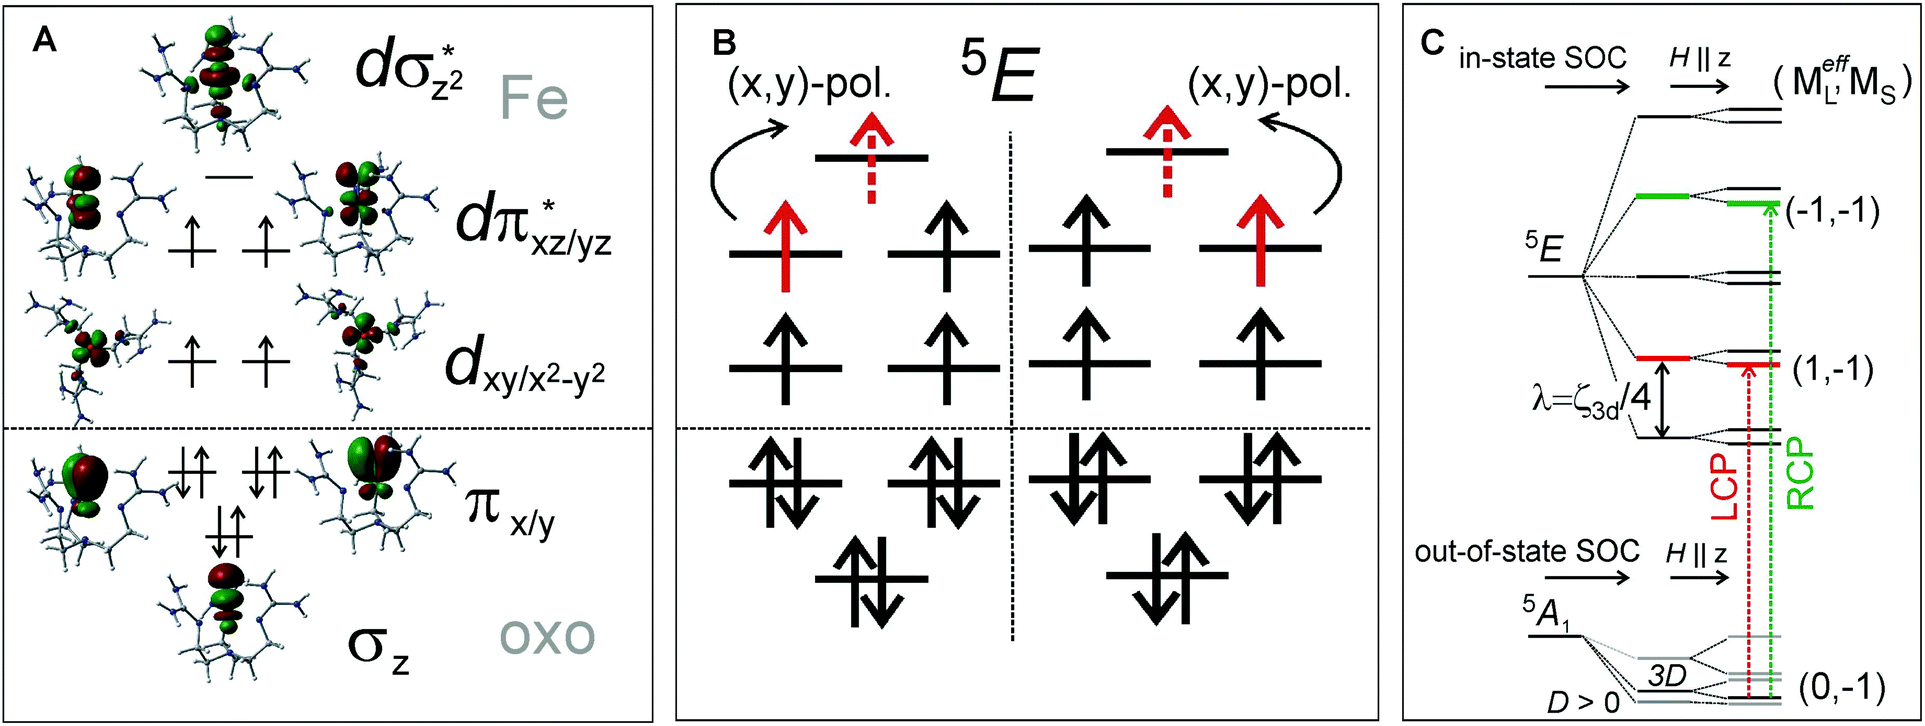 | ||
| Fig. 5 A. C3v ligand field with a strong oxo axial ligand produces MO orbitals, where d-manifold splits into two degenerate non-bonding d orbitals, two degenerate antibonding dπ* FMOs and the dσ* LUMO. B. The LF 5E excited state results from the e− excitation from the dπ* to dσ* orbital; the transition is (x,y)-polarized in C3v. C. In-state SOC splitting of the LF 5E along with zero-field splitting of the ground state 5A1, further split by external magnetic field along z. MCD-active sublevels labeled in terms of (MeffL, MS); Left and right circularly polarized (LCP and RCP) transitions are indicated by vertical arrows. | ||
MCD feature I associated with the lowest excited state LF 5E has a derivative band shape (Fig. 4B) that is primarily due to spin–orbit coupling (SOC) within the LF 5E state. This gives rise to two oppositely signed C-term MCD features forming a pseudo-A term with the right circularly polarized (RCP; i.e., negative) component at higher energies (Fig. 5C). The in-state SOC between the spatially two-fold degenerate components of the LF 5E state (depicted in Fig. 5B) is effectively controlled by the z-component of the SOC operator λSzLz (where λ is a many-electron state-specific SOC constant) by acting on wavefunctions |MeffL = ±1, MS = 0, ±1, ±2〉, where the effective magnetic quantum number MeffL reflects the one-electron configuration subspace d0xzd1yz, d1xzd0yz of the LF 5E. This SOC produces five two-fold degenerate sublevels of the LF 5E state with an energy separation between the lower-energy LCP and higher-energy RCP state of 2λ = 2(ζ3d/4) = 260 cm−1 (ζ3d is the one-electron SOC constant for FeIV: 520 cm−1),38 as shown in Fig. 5C. The relation λ = ζ/4 for this case is given by eqn (3):
 | (3) |
Note these in-state SOC-perturbed MCD-active (LCP and RCP) states would have potential energy surfaces that do not differ in their shape. However, this is different from what is observed from the NIR MCD pseudo-A term spectra that exhibit two very distinct vibronic progressions (Fig. 4B, right). These reflect a large difference in the frequency of the Fe–oxo stretching mode in the LCP vs. RCP component of the LF 5E excited state (νFe–O = 710 vs. 880 cm−1); hence there must be a difference in the shapes of the PESs associated with these states. Since the latter value of νFe–O is even higher than the Fe–oxo frequency in the ground state (820–840 cm−1),31,34 the LF 5E-based RCP state must undergo a strong SOC interaction with a nearby and spectroscopically spin-forbidden state. This would produce two RCP-active PESs, where the higher-energy PES is associated with the higher νFe–O relative to its lower-energy cognate.
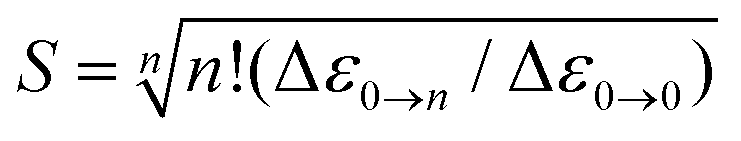
Indeed, the NIR MCD pseudo-A term is best fit by three (one positive and two negative) FC progressions and a sharp peak (Fig. 6), where the higher-energy RCP FC progression (green) has a larger νFe–O than its lower-energy RCP FC cognate (dark blue) that is largely masked by the more intense LCP FC progression (dotted red). As was the case for band II of the S = 1 FeIVO species in MCD (section 2), all of the FC fits contributing to this pseudo-A term (as well as the FC fit of the negative MCD band II associated with the oxo-to-Fe CT state in Fig. 4C, 3rdpanel) are characterized in terms of the zero-vibronic 0–0 transition (E00), the νFe–O and the Huang-Rhys factor (S), which is defined by eqn (2). These are given in Fig. 6.
 | ||
| Fig. 6 A. NIR MCD spectrum at 2 K (solid black line) fit with three FC progressions and one sharp peak, where E00 corresponds to the zero-vibronic transition (the energy of the first peak in each progression); S is the Huang-Rhys factor and ν is the vibronic spacing. | ||
There is an energy equivalence between the sharp positive peak in the 5E MCD spectrum (solid red line in Fig. 6) and the dip in the Abs spectrum (Fig. 7A and B). This peak, due to its sharpness (the full width at half maximum is <400 cm−1) and its positive MCD intensity, indicates a weak SOC interaction of the spin-allowed (broad) LCP component of the LF 5E with a close-lying, spectroscopically spin-forbidden triplet state. This very unusual spectral feature (Abs dip [antiresonance] vs. MCD peak [resonance]) is a Fano interference effect. According to the Fano theory (ref. 39, 40 and 41), the spectral band shape can be fit to the four-parameter equation:
 | (4) |
 | (5, 6 and 7) |
 is the electric dipole transition moment.
 | ||
| Fig. 7 A. NIR Abs spectrum showing a dip in background profile; B. Fano fit (orange line) of dip in NIR Abs to give black line R(ν)). Instrument detector changeover in region indicated by * results in a spurious derivative feature in the difference spectrum. C. Fano analysis of sharp transition in MCD (red line obtained by eliminating the LF 5E-based MCD background intensity). Both the dip in Abs and peak in MCD were fit with eqn (4). | ||
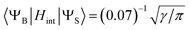
The Fano feature, R(ν), is experimentally defined for Abs by the ratio εobserved/εbackground and for MCD by εobserved/εbackground (Fig. 7). Theoretically, this is determined by the parameters ν0, p, λ and q (eqn (4)) that control its energy, height, width and shape (e.g., q = ∞, 1 and 0 correspond to a Lorentzian peak, dispersion-like curve and Lorentzian dip, respectively). The parameter p reflects a fraction of the broad state (LF 5E) that weakly interacts via SOC with the sharp state. The parameter q is related to the ratio of the transition-dipole matrix elements that contribute excitations into the SOC-modified sharp state and the fraction of the broad state, while the parameter γ is a measure of the SOC between the sharp and the broad state (scaled down by the overlap of the sharp peak with the broad LF 5E-based continuum).
Fig. 7A and B give the analyses of the Abs and MCD Fano features. The γ and p parameters remain essentially unchanged in going from Abs to MCD. This is in line with the expectation that both the SOC strength (related to γ) and the parameter p (in eqn (5)) are independent of the Abs/MCD selection rules. Note the inter-state SOC off-diagonal matrix element is estimated from γ to be ∼100 cm−1,42 indicating a weak SOC interaction. However, there is a significant difference between Fano qAbs and qMCD parameters (0.15 and 5.0) that reflects the different selection rules in Abs vs. MCD. For Abs, all of the populated sublevels of the S = 2 ground state, MS = 0, ±1 and ±2, contribute to the spin-allowed transition to the LF 5E excited state. Among these only the MS = −1 sublevel contributes to the spin-forbidden Fano transition. For MCD, from all the ground-state MS = 0, ±1 and ±2 sublevels, only the MS = −1 sublevel contributes to both the Fano spin-forbidden and spin-allowed positive MCD intensity. Therefore, the fraction of the ground-state sublevels contributing to the Fano transition is larger in MCD than in Abs, which results in qMCD > qAbs (eqn (6)).
The above FC (and Fano) analyses enable the experimental characterization of the low-lying, spectroscopically spin-allowed and spin-forbidden, excited states in the S = 2 FeIVO complex along with their in-state and inter-state SOC interactions. As a result, the experimental PESs of these excited states can be plotted along the Fe–oxo coordinate (Fig. 8A). Correlating ab initio multireference (CASPT2) calculations with these experimental data, the lowest-energy S = 2 (LF 5E) excited state along with two close-lying S = 1 excited states (LF 3E and 3A1) were identified. In fact, the LF 3E is quasi-degenerate with LF 5E at the CASPT2 equilibrium geometry (left column in Fig. 8B). In going from non-relativistic to relativistic (CASPT2-based) calculations (from left to right column in Fig. 8B), a strong inter-state SOC interaction of the 3E state with the RCP component of the in-state SOC-perturbed LF 5E is revealed, while there is a weak inter-state SOC of the 3A1 with the LF 5E-based LCP component (i.e., the origin of the Fano interference). These produce four MCD-active states (labelled as 1–4 in Fig. 8B according to their relative energies). States 1 and 3 contribute positive MCD intensity (LCP transitions), while states 2 and 4 contribute negative MCD intensity (RCP transitions). These calculations nicely correlate with the experimental relative energies of states 1–4 (PES energies taken at the vertical line in Fig. 8A). Furthermore, the calculated PESs associated with these states (Fig. 8C) reproduce the characteristics of the experimental PESs from Fig. 8A: (i) The strong SOC interaction between 3E and LF 5E in the vicinity of the ground-state equilibrium geometry produces PESs 1 and 3 (green and blue lines in Fig. 8C), the latter of which is much less shifted and distorted as compared to the first; (ii) PES 2 (red line), whose shape is unaffected by weak SOC with state 4 (red bar), is less distorted than PES 1 and more than PES 3; PES 5 (magenta line), which corresponds to the oxo-to-Fe CT state, is the most distorted and shifted among all of the PESs investigated. More quantitative evaluations of the calculated PESs and their comparisons with experiment are provided in Table 2.
 | ||
| Fig. 8 A. Parabolic PESs of the ground and low-lying excited states derived from FC analyses of MCD features I and II from Fig. 4B and 6. B. The lowest CASPT2 S = 2 excited state interacting with two S = 1 states. State levels without and with SOC (left and right column, respectively) calculated at the ground-state geometric equilibrium. Computational details given in ref. 22. The vertical arrows indicate the RCP and LCP transitions that contribute to the NIR MCD pseudo-A term from Fig. 6. MCD-active sublevels labeled in terms of (MeffL, MS). C. The (SOC-perturbed) CASPT2 PESs. Owing to strong SOC between the (−1, −1) component of LF 5E and 3E, two RCP-active PESs are produced (inset). D. Evolution of the two dominant electronic configurations contributing to the multiconfigurational wavefunction characters of each electronic state (5A1 ground state and LF 5E). Configurations depicted correlate with the MOs diagram given in Fig. 5A. Note, throughout the entire figure, labels for states and their PESs (1 through 4) are the same as those used for the corresponding FC progressions and the sharp peak in Fig. 6 (the oxo-to-Fe CT state is state 5 and corresponds to MCD feature II in Fig. 4B). | ||
| Experimental MCD data | CASPT2-based calculations | |||||
|---|---|---|---|---|---|---|
| Statea | ΔEverticb/cm−1 |
νc/cm−1 |
ΔrFe–Od/Å |
ΔEvertice/cm−1 |
ν /cm−1 | ΔrFe–Og/Å |
a States are labeled as in Fig. 8.
b Electronic vertical transition from 5A1 ground state to highest-intensity component of Frank-Condon progression.
c Frequency of excited-state Fe–oxo stretching mode.
d Distortion of excited-state geometry along Fe–oxo stretching mode calculated from eqn (1) in the text.
e Electronic vertical transition from 5A1 ground state at CASPT2 equilibrium geometry (with Fe–oxo bond length of 1.6 Å).
f Estimated from  where k obtained from fit of CASPT2 potential energy surfaces with third-order Taylor expansion surfaces (fitted SOC-perturbed PESs from Fig. 8).
g The ΔrFe–O taken as difference between equilibrium geometries of 5A1 state and excited state.
h Taken from ref. 34.
i Taken from Table S2 in ref. 22. where k obtained from fit of CASPT2 potential energy surfaces with third-order Taylor expansion surfaces (fitted SOC-perturbed PESs from Fig. 8).
g The ΔrFe–O taken as difference between equilibrium geometries of 5A1 state and excited state.
h Taken from ref. 34.
i Taken from Table S2 in ref. 22.
|
||||||
| Ground state | 0.0 | 820h | 0.0 | 0.0 | 940 | 0.0 |
| 1 | 10460 |
620 | 0.16 | 13775 |
560 | 0.15 |
| 2 | 10700 |
710 | 0.13 | 13860 |
630 | 0.15 |
| 3 | 12355 |
880 | 0.08 | 14100 |
1000 | 0.02 |
| 5 | 19500 |
490 | 0.21 | 28714i |
506 | 0.25 |
These spectroscopically-calibrated calculations can be further extended to analyses of the characters in the ground- and excited-state wavefunctions, and their evolutions along the Fe–O bond coordinate. This inspection reveals important electronic configuration interactions that contribute to the characters of the ground 5A1 and the lowest excited 5E state. For the equilibrium Fe–O bond length, the 5A1 is characterized by the dominant FeIV(S=2)O2−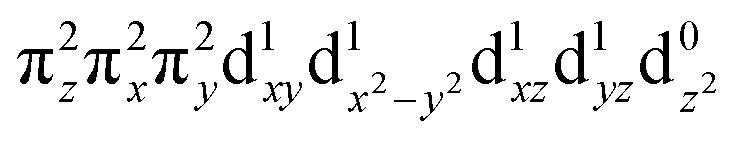 configuration (depicted in Fig. 5A) with a minor contribution from the FeIII(S=5/2)O˙− configuration that results from spin polarization of the α e− from the oxo σz into the dz2 orbital (Fig. 8D, top panel left). In elongating the Fe–O bond, the weight of the first and latter configuration decreases and increases, respectively, such that the latter becomes dominant at Fe–O distances longer than 1.88 Å (Fig. 8D, top panel right). Thus for this elongation (relevant for TS in HAA), the 5A1 state gains strong oxyl character with the unpaired α e− in the oxo σz orbital (directed along the z axis of the Fe–O bond). For the 5E state at the Fe–O bond length of the ground state, the character is mostly the FeIV(S=2)O2−
 configuration (Fig. 5B), blended with a minor component of the FeIII(S=5/2)O˙−
 configuration (Fig. 8D, lower panel left shown only for the LCP component). The weights of these two configurations evolve such that the latter becomes dominant for distances larger than 1.72 Å (Fig. 8D, lower panel right). Thus, this 5E state becomes strongly oxyl in character at the TS for HAA with the unpaired α e− in the oxo πx/y orbital (perpendicular to the axis of the Fe–O bond) with five α e− on the FeIII center. Finally, the second excited state, the oxo-to-Fe CT state, retains its character over entire Fe–O PES, i.e., this CT state has oxyl character with the unpaired α e− in the oxo πx/y orbital with three α e− on the FeIII center. This corresponds to an oxyl FeIII of intermediate spin (SFe = 3/2) at the TS. Thus these PESs define FMOs that have directionality (π vs. σ; see Scheme 2) and reactivity in being holes on the oxo at the TS as required for efficient overlap for HAA.
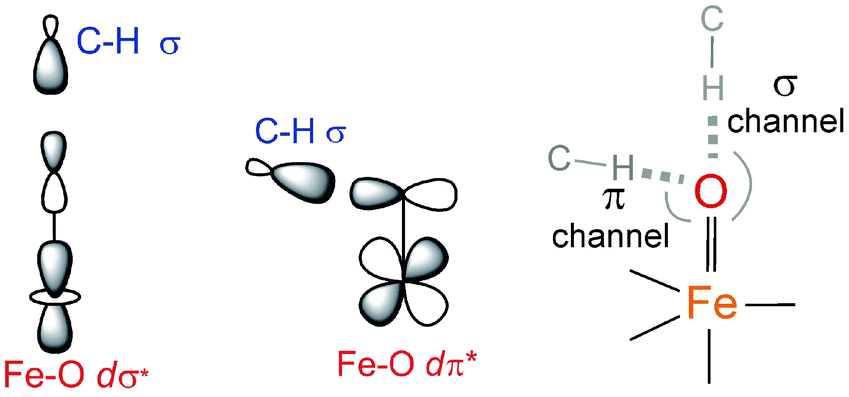 | ||
| Scheme 2 The dσ* and dπ* FMOs interacting with the electron-donating C–H σ orbital defining possible H-atom abstraction reaction coordinates for an S = 2 NHFeIVO species (right). | ||
Concluding comments
LT MCD spectroscopy is a powerful method for investigation of transitions into low-lying excited states of both the S = 1 and S = 2 NHFeIVO active sites, particularly of LF (d–d) transitions. The great advantage of MCD lies in decoupling of the overlapping bands due to their different selection rules that gives different signs of bands as well as their temperature behaviors that further provide information on the polarization of transitions and thus their unambiguous assignments. In addition, the MCD spectra exhibit vibronic structures that provide information on the excited-state PESs along the Fe–O coordinate and their (SOC) interactions. These spectroscopic results, in combination with ab initio multireference calculations, reveal the nature of the FMOs of S = 1 and S = 2 NHFeIVO species that provide fundamental mechanistic insight into their reactivities (Scheme 3). In particular, the spectroscopically calibrated analyses show that the lowest-energy electronic states (and associated FMOs) evolve along the Fe–O PESs giving rise to oxyl FeIII character at Fe–O distances relevant to the TS for H-atom abstraction. For these TS-like Fe–O distances in the ∼C4v symmetric S = 1 NHFeIVO system, a hole is generated only in the oxo-based px,y orbitals and thus, due to spin polarization, the dπ* orbitals become reactive towards HAA. This defines the π channel for HAA in these S = 1 systems (that can be hindered by equatorial chelate sterics in models). In contrast, the biologically relevant ∼C3vS = 2 NHFeIVO species can generate a hole in the oxo-based px,y or pz orbitals and thus dπ* and dσ* FMOs, respectively, can be active in HAA, providing flexibility to an NHFeIVO active site in controlling reaction selectivity as in the halogenase SyrB211 and in the HPPD/HmaS enzyme systems.29
 | ||
| Scheme 3 Vibronically resolved VT MCD spectra calibrate the theoretical PESs allowing the evaluation of their wavefunction evolution and FMOs along the Fe–O bond stretch that govern mechanism for H-atom abstraction in S = 1 vs. S = 2 NHFeIVO species. | ||
Acknowledgements
Research reported in this publication was supported by the National Institute of General Medical Sciences of the National Institutes of Health under award number R01GM040392. MS is also grateful to the Academy of Sciences of the Czech Republic for providing the Purkyně fellowship.References
- E. I. Solomon, T. C. Brunold, M. I. Davis, J. N. Kemsley, S.-K. Lee, N. Lehnert, F. Neese, A. J. Skulan, Y.-S. Yang and J. Zhou, Chem. Rev., 2000, 100, 235 CrossRef CAS PubMed.
- L. Que Jr. and R. Y. N. Ho, Chem. Rev., 1996, 96, 2607 CrossRef.
- E. I. Solomon, K. M. Light, L. V. Liu, M. Srnec and S. D. Wong, Acc. Chem. Res., 2013, 46, 2725 CrossRef CAS PubMed.
- M. Y. Pau, J. D. Lipscomb and E. I. Solomon, Proc. Natl. Acad. Sci. U. S. A., 2007, 104, 18355 CrossRef CAS PubMed.
- E. G. Kovaleva, M. B. Niebergall, S. Chakrabarty and J. D. Lipscomb, Acc. Chem. Res., 2007, 40, 475 CrossRef CAS PubMed.
- S. K. Carter, Bleomycin Chemotherapy, Academic Press, New York, 1995 Search PubMed.
- L. V. Liu, C. B. Bell, S. D. Wong, S. A. Wilson, Y. Kwak, M. S. Chow, J. Zhao, K. O. Hodgson, B. Hedman and E. I. Solomon, Proc. Natl. Acad. Sci. U. S. A., 2010, 107, 22419 CrossRef CAS PubMed.
- C. D. Brown, M. L. Neidig, J. D. Lipscomb and E. I. Solomon, J. Am. Chem. Soc., 2007, 129, 7427 CrossRef CAS PubMed.
- C. Krebs, D. Galonić Fujimori, C. T. Walsh and J. M. Bollinger Jr., Acc. Chem. Res., 2007, 40, 484 CrossRef CAS PubMed.
- M. L. Matthews, C. M. Krest, E. W. Barr, F. H. Vaillancourt, C. T. Walsh, M. T. Green, C. Krebs and J. M. Bollinger Jr., Biochemistry, 2009, 48, 4331 CrossRef CAS PubMed.
- M. L. Matthews, C. S. Neumann, L. A. Miles, T. L. Grove, S. J. Booker, C. Krebs, C. T. Walsh and J. M. Bollinger Jr., Proc. Natl. Acad. Sci. U. S. A., 2009, 106, 17723 CrossRef CAS PubMed.
- S. D. Wong, M. Srnec, M. L. Matthews, L. V. Liu, Y. Kwak, K. Park, C. B. Bell, E. E. Alp, J. Zhao, Y. Yoda, S. Kitao, M. Seto, C. Krebs, J. M. Bollinger Jr. and E. I. Solomon, Nature, 2013, 499, 320 CrossRef CAS PubMed.
- M. L. Matthews, W. Chang, A. P. Layne, L. A. Miles, C. Krebs and J. M. Bollinger Jr., Nat. Chem. Biol., 2014, 10, 209 CrossRef CAS PubMed.
- A. R. McDonald and L. Que Jr., Coord. Chem. Rev., 2013, 257, 414 CrossRef CAS.
- W. Nam, Y.-M. Lee and S. Fukuzumi, Acc. Chem. Res., 2014, 47, 1146 CrossRef CAS PubMed.
- C. V. Sastri, J. Lee, K. Oh, Y. J. Lee, J. Lee, T. A. Jackson, K. Ray, H. Hirao, W. Shin, J. A. Halfen, J. Kim, L. Que Jr., S. Shaik and W. Nam, Proc. Natl. Acad. Sci. U. S. A., 2007, 104, 19181 CrossRef CAS PubMed.
- S. Hong, H. So, H. Yoon, K.-B. Cho, Y.-M. Lee, S. Fukuzumi and W. Nam, Dalton Trans., 2013, 42, 7842 RSC.
- J. England, J. O. Bigelow, K. M. Van Heuvelen, E. R. Farquhar, M. Martinho, K. K. Meier, J. R. Frisch, E. Münck and L. Que Jr., Chem. Sci., 2014, 5, 1204 RSC.
- L. R. Widger, C. G. Davies, T. Yang, M. A. Siegler, O. Troeppner, G. N. L. Jameson, I. Ivanović-Burmazović and D. P. Goldberg, J. Am. Chem. Soc., 2014, 136, 2699 CrossRef CAS PubMed.
- A. Decker, J.-U. Rohde, L. Que Jr. and E. I. Solomon, J. Am. Chem. Soc., 2004, 126, 5378 CrossRef CAS PubMed.
- A. Decker, J.-U. Rohde, E. J. Klinker, S. D. Wong, L. Que Jr. and E. I. Solomon, J. Am. Chem. Soc., 2007, 129, 15983 CrossRef CAS PubMed.
- M. Srnec, S. D. Wong, J. England, L. Que Jr. and E. I. Solomon, Proc. Natl. Acad. Sci. U. S. A., 2012, 109, 14326 CrossRef CAS PubMed.
- D. Usharani, D. Janardanan, C. Li and S. Shaik, Acc. Chem. Res., 2013, 46, 471 CrossRef CAS PubMed.
- S. Ye, C.-Y. Geng, S. Shaik and F. Neese, Phys. Chem. Chem. Phys., 2013, 15, 8017 RSC.
- S. Ye and F. Neese, Proc. Natl. Acad. Sci. U. S. A., 2011, 108, 1228 CrossRef CAS PubMed.
- R. Latifi, M. Bagherzadeh and S. P. de Visser, Chem. – Eur. J., 2009, 15, 6651 CrossRef CAS PubMed.
- D. Usharani, D. C. Lacy, A. S. Borovik and S. Shaik, J. Am. Chem. Soc., 2013, 135, 17090 CrossRef CAS PubMed.
- S. A. Wilson, J. Chen, S. Hong, Y.-M. Lee, M. Clémancey, R. Garcia-Serres, T. Nomura, T. Ogura, J.-M. Latour, B. Hedman, K. O. Hodgson, W. Nam and E. I. Solomon, J. Am. Chem. Soc., 2012, 134, 11791 CrossRef CAS PubMed.
- M. L. Neidig, A. Decker, O. W. Choroba, F. Huang, M. Kavana, G. R. Moran, J. B. Spencer and E. I. Solomon, Proc. Natl. Acad. Sci. U. S. A., 2006, 103, 12966 CrossRef CAS PubMed.
- J.-U. Rohde, J.-H. In, M. H. Lim, W. W. Brennessel, M. R. Bukowski, A. Stubna, E. Münck, W. Nam and L. Que Jr., Science, 2003, 299, 1037 CrossRef CAS PubMed.
- J. England, M. Martinho, E. R. Farquhar, J. R. Frish, E. L. Bominaar, E. Münck and L. Que Jr., Angew. Chem., Int. Ed., 2009, 48, 3622 CrossRef CAS PubMed.
- Ratio of the MCD transition dipole moment (C0) and dipole strength (D0). Experimentally, this ratio is estimated using C0/D0 = kBT/μBH(Δε/ε)max, where kB and μB are Boltzmann constant and Bohr magneton, T is the temperature, H is the applied magnetic field, ε is molar extinction coefficient obtained from absorption and Δε is the difference between the molar extinction coefficients for left- and right-circularly polarized light. In general, C0/D0 is >0.1 for ligand-field transitions, while charge-transfer transitions are characterized by C0/D0 < 0.1.
- C. B. Bell III, S. D. Wong, Y. Xiao, E. J. Klinker, A. L. Tenderholt, M. C. Smith, J.-U. Rohde, L. Que Jr., S. P. Cramer and E. I. Solomon, Angew. Chem., Int. Ed., 2008, 47, 9071 CrossRef PubMed.
- S. D. Wong, C. B. Bell III, L. V. Liu, Y. Kwak, J. England, E. E. Alp, J. Zhao, L. Que Jr. and E. I. Solomon, Angew. Chem., Int. Ed., 2011, 50, 3215 CrossRef CAS PubMed.
- S. Shaik, H. Hirao and D. Kumar, Acc. Chem. Res., 2007, 40, 532 CrossRef CAS PubMed.
- E. J. Klinker, S. Shaik, H. Hirao and L. Que Jr., Angew. Chem., Int. Ed., 2009, 48, 1291 CrossRef CAS PubMed.
- J. England, Y. Guo, E. R. Farquhar, V. G. Young Jr., E. Münck and L. Que Jr., J. Am. Chem. Soc., 2010, 132, 8635 CrossRef CAS PubMed.
- G. M. Cole Jr. and B. B. Garrett, Inorg. Chem., 1970, 9, 1898 CrossRef.
- U. Fano, Phys. Rev., 1961, 124, 1866 CrossRef CAS.
- M. Sturge, H. Guggenheim and M. Pryce, Phys. Rev. B: Solid State, 1970, 2, 2459 CrossRef.
- A. Lempicki, L. Andrews, S. J. Nettel, B. C. McCollum and E. I. Solomon, Phys. Rev. Lett., 1980, 44, 1234 CrossRef CAS.
- To estimate of the inter-state SOC matrix element between the broad and sharp state, we used eqn (7) considering that only 7% of the broad positive band overlaps with the sharp peak (Fig. 6):
 .
.
| This journal is © The Royal Society of Chemistry 2014 |