DOI:
10.1039/C4DT01187B
(Paper)
Dalton Trans., 2014,
43, 11959-11972
Luminescent monocyclometalated cationic gold(III) complexes: synthesis, photophysical characterization and catalytic investigations†
Received
23rd April 2014
, Accepted 12th June 2014
First published on 12th June 2014
Abstract
Stable, luminescent, and cationic monocyclometalated gold(III) monoaryl complexes of the type [(ppy)Au(FMes)(L)]+[OTf]− [L = 4-phenylpyridine (3), quinoline (4), 4-fluoroaniline (5), P(OMe)3 (6), PPh3 (7)], bearing different ancillary ligands, synthesized starting from the precursor complex [(ppy)Au(FMes)(OH2)]+[OTf]− (2) are reported. The preliminary assignment of the structure of the complexes by various nuclear magnetic resonance spectroscopy techniques and elemental analysis has been further corroborated by single-crystal X-ray diffraction studies. The complexes exhibit room temperature phosphorescence in solution, in neat solids and in doped PMMA films. Detailed photophysical investigations of the complexes in solution, in neat solids and in PMMA films revealed the successful tuning of the emission quantum yield (ϕp) based on the electronic properties of the ancillary ligands. The catalytic photo-oxidation of benzylic amines to their corresponding imines using molecular oxygen as the oxidant was successfully achieved in the presence of the luminescent Au(III) complexes. It is also established that the photocatalytic performance was strongly governed by the electronic properties of the ancillary ligands on the photosensitizer as well as by the steric bulk of the substrates.
Introduction
In recent years, intensive investigations on phosphorescent transition metal complexes have grown rapidly due to their interesting properties and their possible use in optoelectronic devices such as phosphorescent organic light emitting diodes (PhOLEDs) and light emitting electrochemical cells (LECs) as well as catalysts in photochemical reactions.1–10 A significant advantage of triplet emitters over fluorescent emitters stems from their theoretical internal quantum efficiency of 100% compared to 25% for fluorescent emitters that can be achieved due to the triplet harvesting enabled by the presence of a heavy metal.1,11 Ir(III) and Pt(II) complexes have been the focus of most investigations among the transition metal phosphorescent emitters.12,13 In contrast to the Pt(II) complexes, research on the isoelectronic Au(III) complexes as emitters remained limited. One of the reasons for the rather small number of phosphorescent Au(III) complexes lies in the nature of the d–d states that are energetically low-lying and therefore very close to the potentially emissive charge-transfer states, which promotes non-radiative deactivation of the excited state.14 A strategy to overcome this problem was reported by the group of Yam utilizing strong field ligands, especially strongly σ-donating ligands such as N-heterocyclic carbenes (NHCs) or alkynes.9,14–26 These ligands decrease the probability for the thermal population of the non-emissive d–d states and thereby lead to luminescence in these complexes.
Most of the reported luminescent Au(III) complexes have a biscyclometalated tridentate ligand scaffold which helps to avoid molecular distortions and leads to a decrease in non-radiative excited state decay, therefore resulting in efficient luminescence. Another reason for the use of the tridentate ligand scaffold is the increased stability of the complexes towards thermal and light induced degradation of the Au(III) complexes. Recently, our group reported the first stable and luminescent bidentate monocyclometalated Au(III) complexes by utilizing two pentafluorophenyl ligands.27 These complexes were found to be more stable than the dialkyne substituted monocyclometalated Au(III) complexes reported independently by Yam and co-workers and our group.19,28 In order to obtain stable and neutral monocyclometalated Au(III) complexes with high luminescence efficiency, 1,3,5-tris(trifluoromethyl)benzene (FMes) was employed as a primary ancillary ligand in combination with various anionic secondary ancillary ligands, which resulted in complexes with good stability and photophysical properties as reported recently by our group.29a To gain further insight into the influence of the electronic properties of the secondary ancillary ligand and the charge of the complex on the emission efficiency of the compounds, we sought a strategy that involves the replacement of the chloride ligand with a weakly coordinating triflate substituent, which was anticipated to subsequently allow for further substitution with various secondary ancillary ligands in a facile fashion. While the introduction of ancillary ligands such as 4-phenylpyridine (4-ppy) and quinoline was used to assess the effect of highly efficient interligand charge transfer on the quantum yield, ligands such as 4-fluoroaniline, PPh3 and P(OMe)3 were used to estimate the extent of influence of both the σ-donation and π-accepting behavior on the emission efficiency of the resulting complexes. Although some examples of the related cationic monocyclometalated Au(III) complexes have been reported previously,29b–g their luminescent and photocatalytic properties have not been investigated. Since the luminescence properties of cationic monocyclometalated Au(III) complexes have not been previously explored, these studies were expected to provide the first detailed insight of the choice of ancillary ligand on the phosphorescence efficiency of this class of complexes. Moreover, recent investigations on the isoelectronic cationic Pt(II) cyclometalated complexes have shown very interesting mechanochromic properties.29h In addition to the exploration of the luminescence properties of monocyclometalated cationic Au(III) monoaryl complexes, we also successfully probed the influence of the ancillary ligands with different electronic properties on the catalytic efficiency of the corresponding Au(III) complexes.
Herein, we report on the synthesis, structural and photophysical investigations as well as on the catalytic behavior of a series of stable monocyclometalated cationic Au(III) monoaryl complexes bearing neutral ancillary ligands that exhibit room temperature (RT) phosphorescence in solution, neat solid and in PMMA. These complexes were found to catalyze the photo-oxidation of benzylic amines to their corresponding imines. The different electronic properties of the ancillary ligand resulted in complexes with different emission quantum yields and also displayed different behavior in the catalytic investigations.
Results and discussions
Syntheses and characterization of the complexes
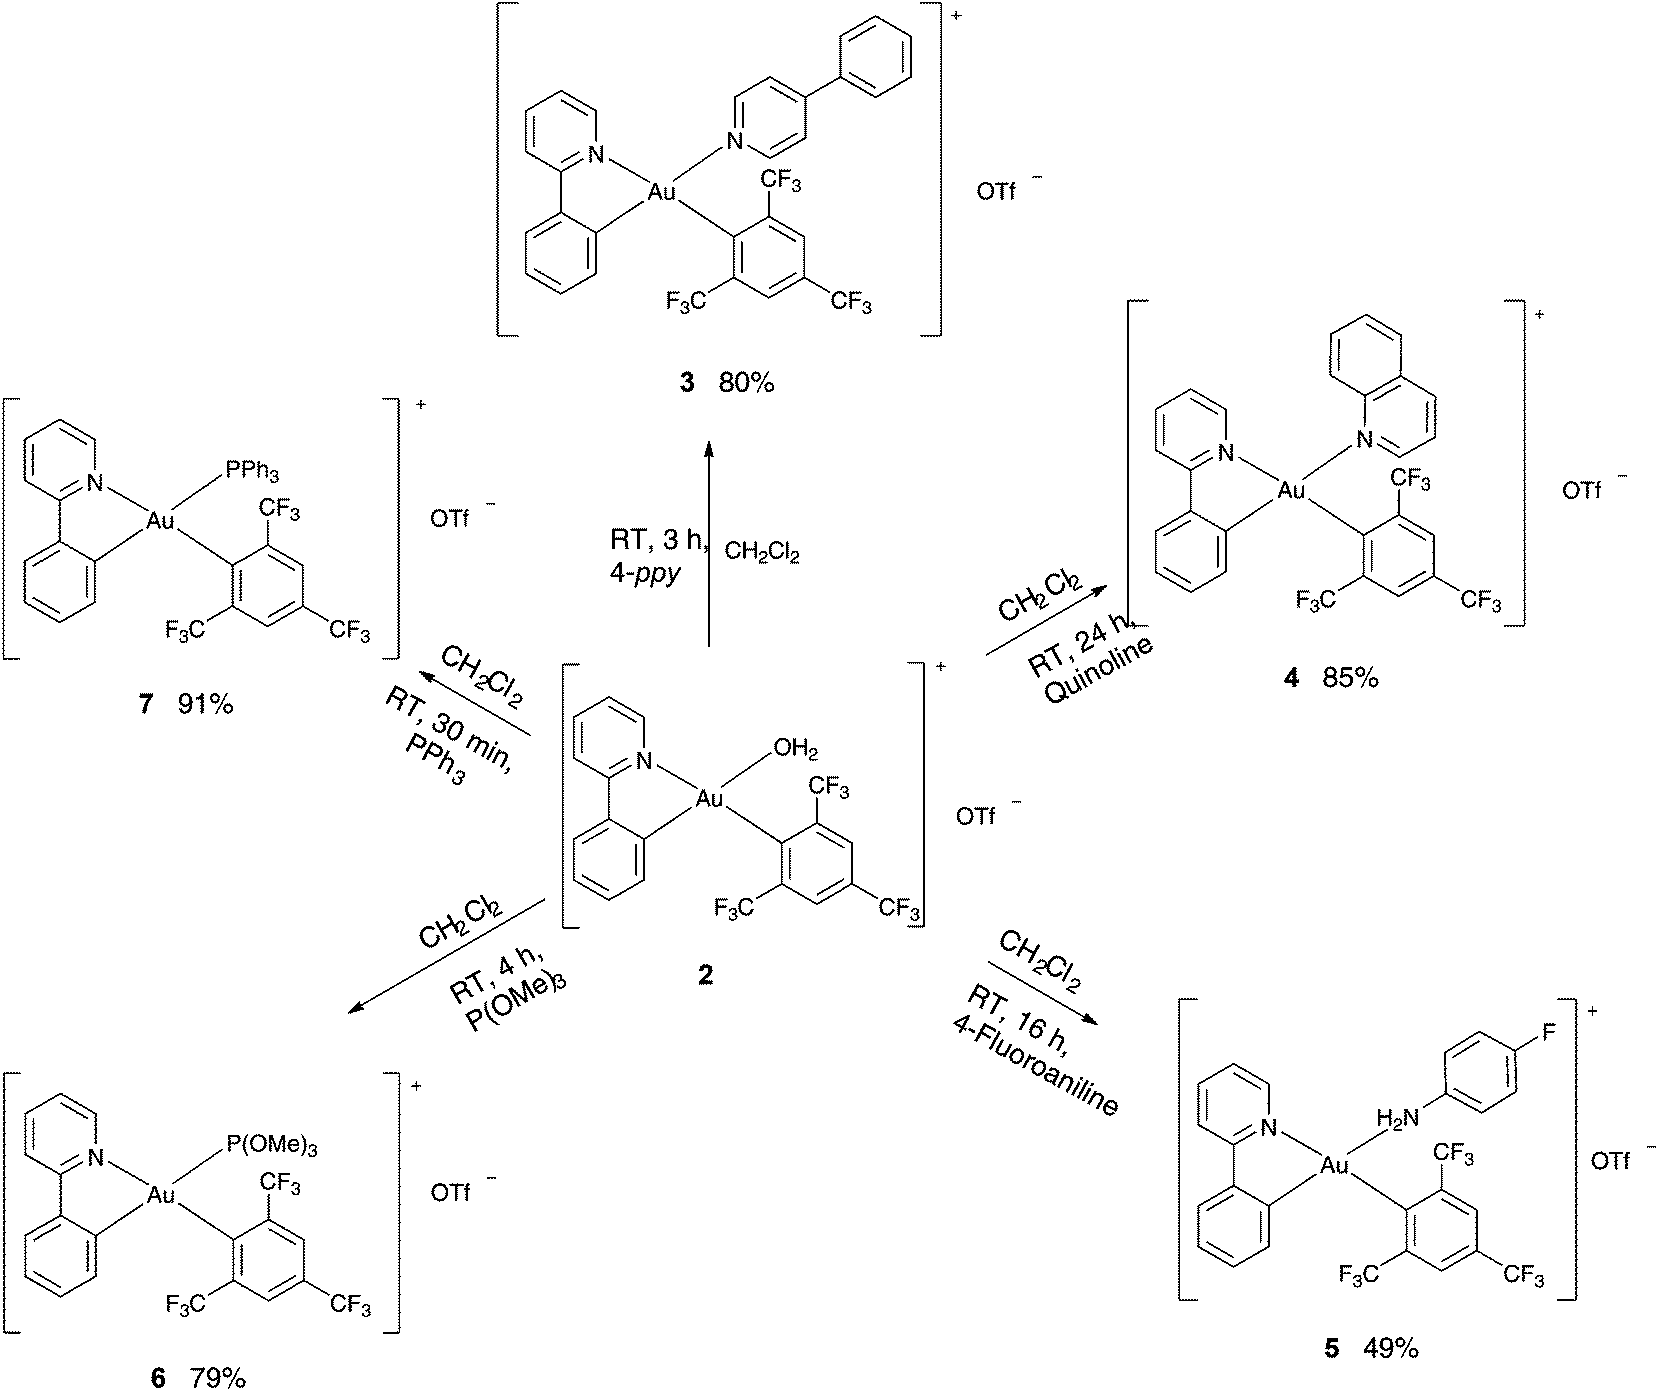
In the first step, the complex [(ppy)Au(FMes)(OH2)]+[OTf]− (ppy = 2-phenylpyridine, FMes = 1,3,5-tris(trifluoromethyl)benzene, OTf = trifluoromethanesulfonate) (2) was synthesized analogous to a method reported by Tilset and coworkers.30 Treatment of [(ppy)Au(FMes)Cl] (1) with a stoichiometric amount of AgOTf in CHCl3 at RT for 3 days gave the desired product in a good yield of 93% (Scheme 1). 19F NMR studies revealed a new resonance signal at −79.8 ppm confirming the presence of the triflate group in 2. Furthermore, 1H NMR studies showed that the resonances for the proton attached to the Cα to N of the pyridyl ring significantly shifted upfield to 8.84 ppm in comparison with 9.52 ppm for the starting material 1.29a Single crystals that were suitable were subjected to X-ray diffraction studies, which confirmed the expected chemical identity of 2 but with a coordinated water molecule. The coordination of H2O is further confirmed by a singlet resonance at 5.33 ppm in the 1H NMR studies. Au(III) aqua complexes are very rare and there is only one known example of the Au(III) aqua complex reported in the literature.29i
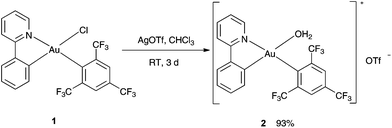 |
| | Scheme 1 Synthesis of complex 2. | |
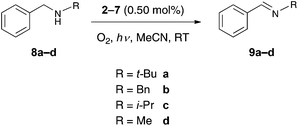
Since the H2O ligand bound to the Au(III) in the complex 2 is considered to be weakly coordinating, this complex was expected to undergo facile substitution reactions and hence was used as a precursor for the preparation of various cationic complexes of the type [(ppy)Au(FMes)L]+ [OTf]− [L = 4-phenylpyridine (3), quinoline (4), 4-fluoroaniline (5), P(OMe)3 (6), PPh3 (7)] (Scheme 2). The syntheses of the complexes 3–7 were achieved by subjecting the complex 2 to the respective ligands in dichloromethane (DCM) at room temperature. Analytically pure products were isolated in moderate to good yields (49–93%).
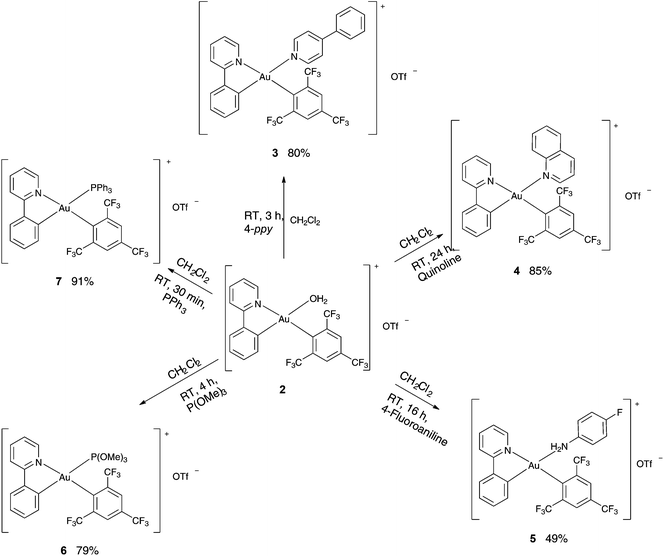 |
| | Scheme 2 Synthesis of complexes 3–7. | |
Reaction progress was monitored by 1H NMR studies for complexes 3–7 and by 31P NMR in the case of 6 and 7. Extensive characterization of the complexes was carried out by 1H, 13C, 19F, 31P NMR and elemental microanalyses. The formation of the desired product was further confirmed by the observation of the relative shift of the resonance of the proton in the Cα position relative to N of the pyridyl ring upon coordination of the new ligand. The shift of this proton was found to vary in the range of 9.10 ppm (6) to 8.31 ppm (7) reflecting the different electronic properties of the ancillary ligands.
The 19F NMR studies revealed a resonance for the OTf− counterion of the cationic complexes 3–7 at −78.9 ppm. Furthermore, 19F NMR studies revealed the peak for the para trifluoromethyl group of the FMes ligand as a singlet in the range between −63.4 and −64.9 ppm for all complexes. Moreover, the two ortho bound trifluoromethyl groups also appeared as a single resonance signal in the range between −58.8 and −61.2 ppm for complexes 2, 3 and 5–7, while the spectrum of 4 exhibited two separate signals for the two groups at −57.2 and −59.8 ppm, respectively. In the phosphine bearing complexes 6 and 7, the appearance of a new singlet resonance at 115.5 and 37.9 ppm, respectively, in the 31P{1H} NMR studies further confirmed the product.
All the synthesized complexes were found to be air and moisture stable under ambient conditions in the solid state. Furthermore, complexes 2–4 and 6–7 appeared to be stable in common organic solvents against decomposition for several days at room temperature. In comparison with this behavior, the complex 5 revealed an equilibrium between the desired complex and its parent compound 2 along with some decomposition of the complex in solution. This was evidenced by 1H NMR studies, where besides the expected signals for the intact complex 5, also signals of the free ancillary ligand 4-fluoroaniline as well as signals of the water coordinated precursor complex 2 were found. This behavior can be attributed to the electron withdrawing fluorine group on the phenyl ring that results in a weak coordination of the 4-fluoroaniline ligand. Although previous studies have shown to form C–C coupling products as a result of decomposition,29j–k we were not able to observe such byproducts during the photocatalytic studies.
Structural characterization
Single-crystal X-ray diffraction studies were performed for all the reported complexes 2–7. Suitable single crystals were obtained by layering hexane over a concentrated solution of the respective complex in DCM and subsequent slow evaporation at 0–5 °C. The perspective views of the complexes 2–7 are shown in Fig. 1 and some relevant bond distances and angles are given in Table 1. Crystallographic details are provided in Tables 2 and 3. The crystallographic structure of 2 revealed the lability of the triflate ligand confirming our initial hypothesis, since it was only possible to obtain a single crystal of the complex with the H2O molecule bound to the Au(III) center, resulting in the corresponding complex [(ppy)Au(FMes)(H2O)]+[OTf]−. As expected for four-coordinate d8 complexes with four diverse ligands, the X-ray crystal structural analysis revealed a distorted square-planar coordination of the ligands at the gold center. The Au–Cppy distances were found to lie in the narrow range of 2.007(3) to 2.063(5) Å reasonably reflecting the donor strength of the respective ligand that is bound trans to the Au–Cppy. Furthermore, the Au–CFMes distances lie in the narrow range between 2.018(3) and 2.041(5) Å. These values are in good accordance with the distances reported for the monochloro precursor complex 1, being 2.019(2) Å for Au–Cppy and 2.013(2) Å for Au–CFMes.29a As expected, owing to the different electronic nature of the ligands, the bond lengths of the different ancillary ligands trans to Cppy were found to be significantly different from each other lying in between 2.124(3) Å for the Au–O distance in the complex 2 and 2.4345(7) Å for the Au–P distance in the complex 7. The bite angles of the cyclometalating ligand (N–Au–Cppy) were found to lie in the range of 80.94(10)–82.5(2)° and as a consequence the angles of the trans disposed ligands CFMes–Au–L showed large variations in the range of 88.14(19) to 92.14(12)°. Although the cyclometalated part of the complex was found to be essentially flat, deviations from the ideal square planar geometry are found commonly as in similar Au(III) complexes and reflect the steric demands of the cyclometalating ligand.19,27–29a,31 The intermolecular Au⋯Au distances were found to lie in the range of 7.0628(2) Å to 8.6544(2) Å. Due to the large distance between the gold centers, the presence of aurophilic interactions could be ruled out.32
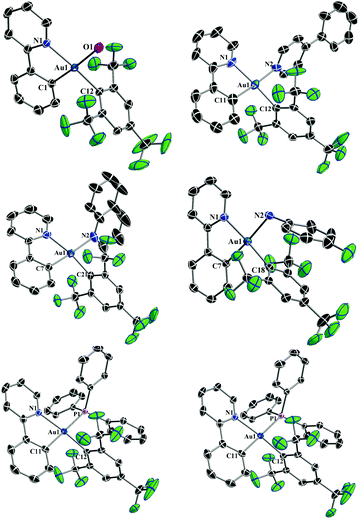 |
| | Fig. 1 X-ray crystal structures of 2–7 with the selective atomic numbering scheme. Thermal ellipsoids are drawn at the 30% probability level. Hydrogen atoms, solvent molecules and counterions are omitted for clarity. | |
Table 1 Selected bond distances (Å) and angles (°) of complexes 2–7
| Bond distance |
Bond angle |
| Complex 2 |
| C(12)–Au(1) |
2.018(3) |
C(1)–Au(1)–N(1) |
82.15(13) |
| O(1)–Au(1) |
2.124(3) |
N(1)–Au(1)–O(1) |
94.37(11) |
| C(1)–Au(1) |
2.007(3) |
C(12)–Au(1)–O(1) |
92.14(12) |
| N(1)–Au(1) |
2.076(3) |
C(1)–Au(1)–C(12) |
91.26(14) |
| |
| Complex 3 |
| C(12)–Au(1) |
2.036(5) |
C(11)–Au(1)–N(1) |
82.5(2) |
| N(2)–Au(1) |
2.130(5) |
N(1)–Au(1)–N(2) |
94.3(2) |
| C(11)–Au(1) |
2.025(6) |
C(12)–Au(1)–N(2) |
88.14(19) |
| N(1)–Au(1) |
2.075(5) |
C(11)–Au(1)–C(12) |
95.3(2) |
| |
| Complex 4 |
| C(21)–Au(1) |
2.021(3) |
C(7)–Au(1)–N(1) |
81.62(13) |
| N(2)–Au(1) |
2.171(3) |
N(1)–Au(1)–N(2) |
96.47(14) |
| C(7)–Au(1) |
2.017(3) |
C(21)–Au(1)–N(2) |
89.81(14) |
| N(1)–Au(1) |
2.075(3) |
C(7)–Au(1)–C(21) |
92.46(13) |
| |
| Complex 5 |
| C(18)–Au(1) |
2.020(2) |
C(7)–Au(1)–N(1) |
81.59(8) |
| N(2)–Au(1) |
2.174(2) |
N(1)–Au(1)–N(2) |
95.97(8) |
| C(7)–Au(1) |
2.017(2) |
C(18)–Au(1)–N(2) |
90.56(8) |
| N(1)–Au(1) |
2.0965(19) |
C(7)–Au(1)–C(18) |
92.09(9) |
| |
| Complex 6 |
| C(15)–Au(1) |
2.041(5) |
C(11)–Au(1)–N(1) |
80.95(18) |
| P(1)–Au(1) |
2.3679(12) |
N(1)–Au(1)–P(1) |
96.92(12) |
| C(11)–Au(1) |
2.063(5) |
C(15)–Au(1)–P(1) |
91.54(13) |
| N(1)–Au(1) |
2.085(4) |
C(15)–Au(1)–C(11) |
90.59(18) |
| |
| Complex 7 |
| C(12)–Au(1) |
2.032(3) |
C(11)–Au(1)–N(1) |
80.94(10) |
| P(1)–Au(1) |
2.4345(7) |
N(1)–Au(1)–P(1) |
98.45(7) |
| C(11)–Au(1) |
2.051(3) |
C(12)–Au(1)–P(1) |
89.22(7) |
| N(1)–Au(1) |
2.102(2) |
C(12)–Au(1)–C(11) |
91.39(11) |
Table 2 Crystallographic data for compounds 2, 3 and 4a
| |
2
|
3
|
4
|
|
The unweighted R-factor is R1 = ∑(Fo − Fc)/∑Fo; I > 2σ(I) and the weighted R-factor is wR2 = {∑w(Fo2 − Fc2)2/∑w(Fo2)2}1/2.
|
| CCDC |
985205
|
985206
|
985207
|
| Empirical formula |
C20H12AuF9NO+·CF3O3S− |
C31H19AuF9N2+·CF3O3S− |
C29H17AuF9N2+·CF3O3S− |
| Formula weight (g mol−1) |
799.34 |
936.52 |
910.50 |
| Temperature (K) |
183(2) |
183(2) |
183(2) |
| Wavelength (Å) |
0.71073 |
0.71073 |
0.71073 |
| Crystal system, space group |
Triclinic, P![[1 with combining macron]](https://www.rsc.org/images/entities/char_0031_0304.gif) |
Triclinic, P |
Triclinic, P |
|
a (Å) |
8.3536(2) |
8.6544(2) |
8.4101(2) |
|
b (Å) |
12.4389(3) |
11.2053(3) |
11.9807(2) |
|
c (Å) |
12.5317(3) |
16.6644(5) |
15.0592(5) |
|
α (°) |
76.432(2) |
96.532(2) |
96.293(2) |
|
β (°) |
88.908(2) |
93.825(2) |
97.533(2) |
|
γ (°) |
81.078(2) |
95.541(2) |
100.257(2) |
| Volume (Å3) |
1250.30(5) |
1593.10(7) |
1466.40(6) |
|
Z, density (calcd) (Mg m−3) |
2, 2.123 |
2, 1.952 |
2, 2.062 |
| Abs coefficient (mm−1) |
6.086 |
4.791 |
5.202 |
|
F(000) |
760 |
904 |
876 |
| Crystal size (mm3) |
0.26 × 0.12 × 0.10 |
0.07 × 0.06 × 0.04 |
0.25 × 0.10 × 0.02 |
|
θ range (°) |
2.77 to 30.51 |
2.76 to 28.45 |
2.36 to 32.65 |
| Reflections collected |
25![[thin space (1/6-em)]](https://www.rsc.org/images/entities/char_2009.gif) 802 802 |
18265 |
36143 |
| Reflections unique |
7588/Rint = 0.0514 |
6741/Rint = 0.0716 |
9841/Rint = 0.0224 |
| Completeness to θ (%) |
99.6 |
99.7 |
100.0 |
| Absorption correction |
Analytical |
Analytical |
Analytical |
| Max/min transmission |
0.626 and 0.399 |
0.859 and 0.780 |
0.881 and 0.498 |
| Data/restraints/parameters |
6904/0/367 |
5277/0/460 |
9001/25/495 |
| Goodness-of-fit on F2 |
1.057 |
1.038 |
1.061 |
| Final R1 and wR2 indices [I > 2σ(I)] |
0.0312, 0.0724 |
0.0473, 0.0757 |
0.0327, 0.0782 |
|
R
1 and wR2 indices (all data) |
0.0361, 0.0758 |
0.0725, 0.0880 |
0.0375, 0.0815 |
| Largest diff. peak and hole (e Å−3) |
1.449 and −1.178 |
0.998 and −1.243 |
3.285 and −1.546 |
Table 3 Crystallographic data for compounds 5, 6 and 7a
| |
5
|
6
|
7
|
|
The unweighted R-factor is R1 = ∑(Fo − Fc)/∑Fo; I > 2σ(I) and the weighted R-factor is wR2 = {∑w(Fo2 − Fc2)2/∑w(Fo2)2}1/2.
|
| CCDC |
985208
|
985209
|
985210
|
| Empirical formula |
C26H16AuF10N2+·CF3O3S−·(CH2Cl2)0.1 |
2(C23H19AuF9NO3P+), 2(CF3 O3S−)·H2O |
C38H25AuF9NP+·CF3O3S−·CH2Cl2 |
| Formula weight (g mol−1) |
900.95 |
1828.81 |
1128.52 |
| Temperature (K) |
183(2) |
183(2) |
183(2) |
| Wavelength (Å) |
0.71073 |
0.71073 |
0.71073 |
| Crystal system, space group |
Triclinic, P |
Triclinic, P |
Monoclinic, P21/c |
|
a (Å) |
10.0798(2) |
8.5077(3) |
15.2693(4) |
|
b (Å) |
12.6213(3) |
13.2966(4) |
17.8363(3) |
|
c (Å) |
12.7654(3) |
14.1736(5) |
16.5578(4) |
|
α (°) |
94.426(2) |
75.678(3) |
90 |
|
β (°) |
110.350(2) |
76.534(3) |
114.620(3) |
|
γ (°) |
93.672(2) |
72.228(3) |
90 |
| Volume (Å3) |
1510.92(6) |
1457.72(8) |
4099.5(2) |
|
Z, density (calcd) (Mg m−3) |
2, 1.980 |
1, 2.083 |
4, 1.828 |
| Abs coefficient (mm−1) |
5.069 |
5.293 |
3.904 |
|
F(000) |
864 |
882 |
2200 |
| Crystal size (mm3) |
0.30 × 0.11 × 0.10 |
0.49 × 0.41 × 0.31 |
0.36 × 0.25 × 0.06 |
|
θ range (deg) |
2.78 to 32.52 |
3.01 to 26.37 |
2.71 to 30.46 |
| Reflections collected |
47080 |
17086 |
60066 |
| Reflections unique |
10154/Rint = 0.0450 |
5971/Rint = 0.0349 |
11334/Rint = 0.0413 |
| Completeness to θ (%) |
99.9 |
99.9 |
99.9 |
| Absorption correction |
Analytical |
Analytical |
Analytical |
| Max/min transmission |
0.686 and 0.333 |
0.311 and 0.210 |
0.811 and 0.342 |
| Data/restraints/parameters |
9274/55/470 |
5550/3/433 |
9976/24/550 |
| Goodness-of-fit on F2 |
1.051 |
1.081 |
1.030 |
| Final R1 and wR2 indices [I > 2σ(I)] |
0.0245, 0.0541 |
0.0356, 0.0906 |
0.0268, 0.0613 |
|
R
1 and wR2 indices (all data) |
0.0292, 0.0565 |
0.0390, 0.0933 |
0.0333, 0.0647 |
| Largest diff. peak and hole (e Å−3) |
1.271 and −0.690 |
3.914 and −0.895 |
1.045 and −1.127 |
UV-Vis absorption studies
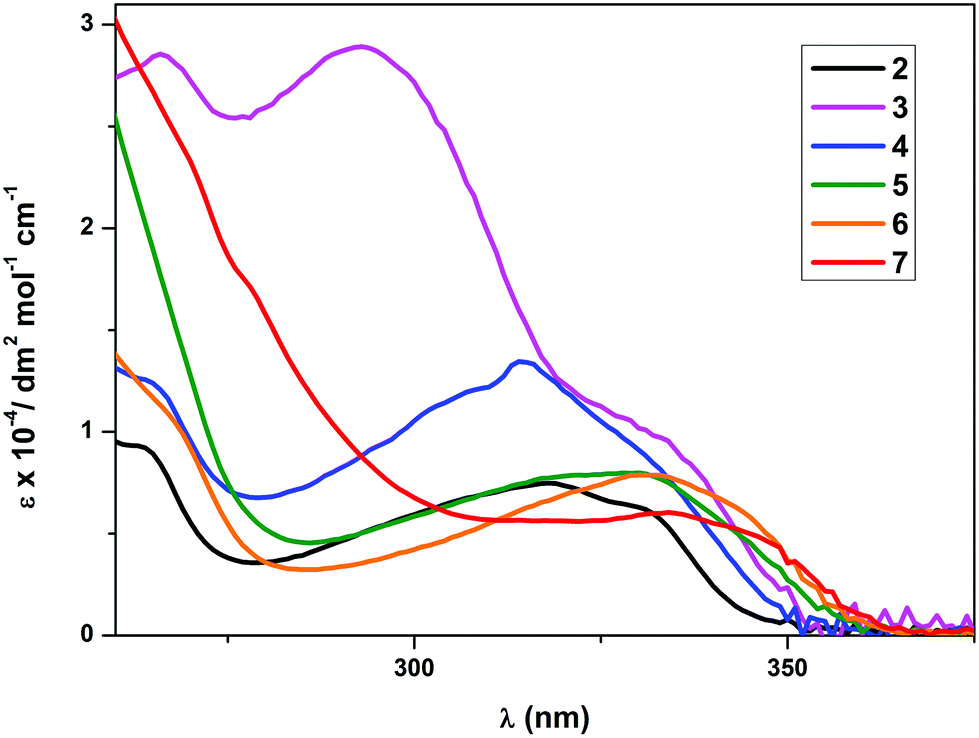
The photophysical data for the complexes are given in Table 4. The UV-Vis absorption spectra of the complexes 2 and 4–7 (Fig. 2) exhibited a low-energy absorption band ranging between 293 nm and 334 nm. The shape of the bands closely resembled the bands of the free 2-phenylpyridine (ppy) ligand. The low-energy absorption of 3 was found at 293 nm and therefore at a significantly lower wavelength than the absorption maxima of the other complexes. An additional shoulder at 336 nm was found in the UV-Vis spectrum of 3, which lies more closely to the absorption wavelengths of the other compounds. Since there are no significant changes observed in the band shape or the number of bands, the lowest significant singlet transition S0 → S1 is tentatively assigned to predominantly involve the frontier orbitals of the cyclometalating ppy ligand. The changes in the low-energy absorption band wavelengths are attributed to the different electronic properties of the secondary ancillary ligands. A bathochromic shift of the low energy bands was observed for complexes with stronger electron donating ancillary ligands, which is particularly striking in the case of complexes 6 and 7. The molar absorption coefficients (ε) were found to lie in the region from 103 to 104 dm3 mol−1 cm−1 with the lowest being 6047 for the complex 7 and the highest being 28920 for compound 3. The molar absorption coefficients were found to decrease with increasing wavelength of the low-energy absorption band.
 |
| | Fig. 2 Electronic absorption spectra of complexes 2–7 in CH2Cl2 at RT. | |
Table 4 Photophysical properties of complexes 2–7
| |
Absorption |
Emission |
| Complex |
λ
max/nm (ε/(dm3 mol−1 cm−1)) |
Medium (T/K) |
λ
max/nm ( τ0/μs) |
ϕ
P (%) |
k
r × 103 s−1 |
k
nr × 105 s−1 |
|
2
|
318 (7483) |
CH2Cl2 (298) |
457, 488, 523 (5.0) |
0.5 |
0.91 |
1.98 |
| Solid (298) |
455, 489, 523 |
7.2 |
|
|
| PMMA (298) |
457, 487, 525 (98.3) |
10.4 |
1.06 |
0.09 |
| |
|
3
|
293 (28920), 336 sh (8682) |
CH2Cl2 (298) |
460, 492, 526 (9.4) |
0.5 |
0.52 |
1.06 |
| Solid (298) |
457, 490, 526 |
0.6 |
|
|
| PMMA (298) |
459, 490, 526 (142.8) |
11.1 |
0.78 |
0.06 |
| |
|
4
|
314 (13455) |
CH2Cl2 (298) |
455, 487, 522 (1.0) |
0.6 |
6.60 |
10.24 |
| Solid (298) |
— |
— |
|
|
| PMMA (298) |
457, 488, 522 (93.9) |
17.8 |
1.89 |
0.08 |
| |
|
5
|
330 (7991) |
CH2Cl2 (298) |
464, 494, 528 (5.4) |
0.2 |
0.43 |
1.86 |
| Solid (298) |
464, 498, 533 |
1.6 |
|
|
| PMMA (298) |
464, 493, 523 (98.1) |
6.7 |
0.68 |
0.09 |
| |
|
6
|
331 (7881) |
CH2Cl2 (298) |
456, 489, 522 (0.77) |
0.9 |
11.56 |
12.87 |
| Solid (298) |
460, 494, 535 |
2.1 |
|
|
| PMMA (298) |
457, 489, 524 (94.7) |
5.3 |
0.56 |
0.10 |
| |
|
7
|
334 (6047) |
CH2Cl2 (298) |
458, 487, 523 (0.92) |
0.3 |
3.48 |
10.83 |
| Solid (298) |
459, 492, 531 |
1.5 |
|
|
| PMMA (298) |
458, 490, 525 (86.7) |
5.4 |
0.62 |
0.11 |
Emission studies
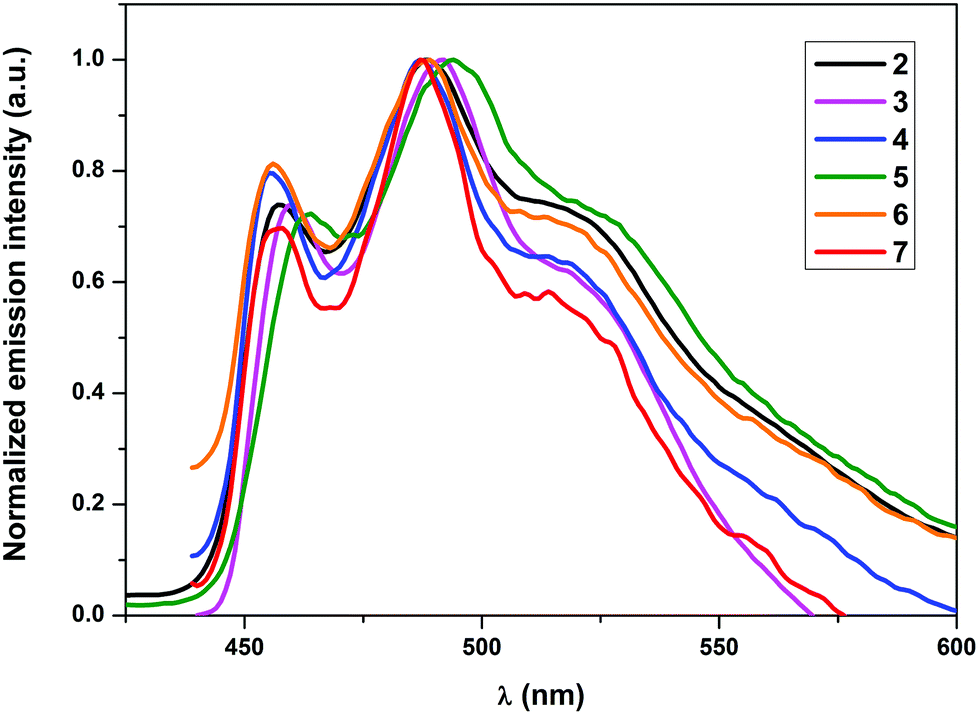
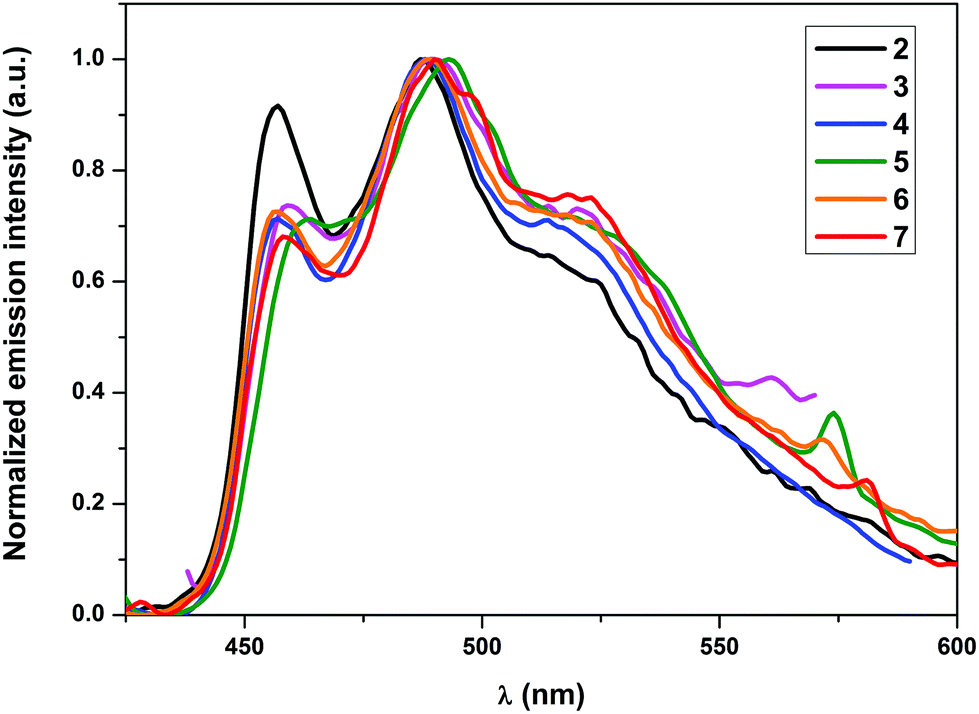
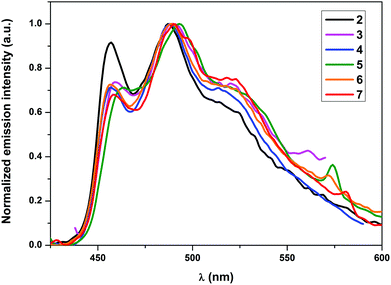
All complexes, except for 4, showed emission in the solid state at RT. Nonetheless, all the complexes showed phosphorescence emission in solution as well as when doped into a PMMA matrix. The non-emissive nature of 4 in the solid state could be attributed to self-quenching effects due to intermolecular π–π stacking interactions of the quinoline moieties owing to the relative close packing in the solid. These interactions can be minimized using low concentrated samples of the complex, which also explains the emissive nature of 4 in solution and in the PMMA matrix. As elucidated in earlier studies, the wavelength of the emission maxima can be mainly tuned using cyclometalating ligands with different π–π* energies, since the origin of the emission is π–π* 3ILCT (intraligand charge transfer) mainly localized on the cyclometalating ligand.27–29a In conjunction with this, no significant shifts in the emission wavelengths of the herein presented complexes 2–7 were expected. However, the varying donor–acceptor nature of the ancillary ligands was expected to affect the quantum yields significantly as pointed out earlier since the electronic properties of the ligands would influence the relative positions of the non-emissive d–d excited states and the emissive excited states as well as different charge transfer states. The observed emission maxima in solution, which lay in the narrow range of 487–494 nm, were consistent with the expectations (Fig. 3). Similarly, the emission maxima in a 5 wt% PMMA matrix were also found approximately in the same range as in solution (Fig. 4). Although the emission maximum of 6 in PMMA was found at the same wavelength as in solution, the maxima of the other compounds were found to possess either a small hypsochromic shift in the order of 1–2 nm (2, 3 and 5) or a bathochromic shift in the order of 1–3 nm (4 and 7). These small shifts can be attributed to the varying extent of rigidification of the complexes in the PMMA matrix and also to the nature of the excited state being affected by the environment, which has been previously observed.33 Vibrationally structured emission profiles were observed for the complexes, which is indicative of the emission to originate predominantly from an intraligand charge transfer (3ILCT) excited state based on the cyclometalating ligand, perturbed by the metal center, as is seen in most cases of luminescent gold(III) complexes.27–29a The vibrational progressions of complexes 2–7 in the emission spectra in solution as well as in PMMA were found to lie in the range between 1300 and 1500 cm−1. These values reasonably resemble the C![[double bond, length as m-dash]](https://www.rsc.org/images/entities/char_e001.gif) N and CC stretching frequencies in pyridyl systems and therefore confirm the 3ILCT emission based on the cyclometalating ppy ligand. The observed quantum yields (ϕp) were found to lie in the range 7.2–0.6% in the solid state and between 17.8 and 5.3% when doped into a PMMA matrix. The striking increase of the quantum yields in the PMMA matrix could again be attributed to the decrease in the π–π stacking interactions in comparison with the pure crystalline form. Additionally, the complexes bearing a conjugated aromatic secondary ancillary ligand (3 and 4) displayed higher emission quantum yields than the complexes with considerable π-accepting character (2, 5–7). This is indeed consistent with our hypothesis, the quantum yields in PMMA were found to be strongly governed by the electronic nature of the ancillary ligand in such a way that conjugated aromatic ligands directly bound to the gold(III) centre as in the case of complexes 3 and 4 give rise to the highest ϕP values due to the presence of efficient interligand charge transfer from the ancillary ligand to the cyclometalating part of the complex, which is also supported by DFT and TD-DFT calculations. In contrast, complexes bearing ancillary ligands with increased π-back bonding ability exhibit low emission quantum yields. This behavior can be ascribed to the proximity of the d–d states to the potentially emissive 3ILCT states leading to the increased non-radiative relaxation of the excited state due to thermal population of the non-emissive d–d states. In contrast to the high quantum yields observed in PMMA, the solution quantum yields were found to lie in the region of 10−3. Quantum yields in solution were observed to be in a similar order to that obtained for the complexes in the PMMA matrix, except for the complex 6 which exhibited on the one hand the lowest ϕP in PMMA but revealed the highest quantum yield in solution on the other hand. The exact reason for this behavior is unclear and requires further investigations. The values for the radiative rate constants (kr) were found to lie in the region of 102–103 s−1, while the non-radiative rate constants (knr) were estimated between 105 and 106 s−1. The low values of kr were another diagnostic hint for the emission to originate from 3ILCT perturbed by the metal center. The Stokes shift of the compounds is in the region between 9564 cm−1 (2) and 8106 cm−1 (7), while the solution lifetimes of the complexes were found in the range between 0.77 and 9.40 μs, therefore indicating the origin of the emission to come from a triplet excited state.
N and CC stretching frequencies in pyridyl systems and therefore confirm the 3ILCT emission based on the cyclometalating ppy ligand. The observed quantum yields (ϕp) were found to lie in the range 7.2–0.6% in the solid state and between 17.8 and 5.3% when doped into a PMMA matrix. The striking increase of the quantum yields in the PMMA matrix could again be attributed to the decrease in the π–π stacking interactions in comparison with the pure crystalline form. Additionally, the complexes bearing a conjugated aromatic secondary ancillary ligand (3 and 4) displayed higher emission quantum yields than the complexes with considerable π-accepting character (2, 5–7). This is indeed consistent with our hypothesis, the quantum yields in PMMA were found to be strongly governed by the electronic nature of the ancillary ligand in such a way that conjugated aromatic ligands directly bound to the gold(III) centre as in the case of complexes 3 and 4 give rise to the highest ϕP values due to the presence of efficient interligand charge transfer from the ancillary ligand to the cyclometalating part of the complex, which is also supported by DFT and TD-DFT calculations. In contrast, complexes bearing ancillary ligands with increased π-back bonding ability exhibit low emission quantum yields. This behavior can be ascribed to the proximity of the d–d states to the potentially emissive 3ILCT states leading to the increased non-radiative relaxation of the excited state due to thermal population of the non-emissive d–d states. In contrast to the high quantum yields observed in PMMA, the solution quantum yields were found to lie in the region of 10−3. Quantum yields in solution were observed to be in a similar order to that obtained for the complexes in the PMMA matrix, except for the complex 6 which exhibited on the one hand the lowest ϕP in PMMA but revealed the highest quantum yield in solution on the other hand. The exact reason for this behavior is unclear and requires further investigations. The values for the radiative rate constants (kr) were found to lie in the region of 102–103 s−1, while the non-radiative rate constants (knr) were estimated between 105 and 106 s−1. The low values of kr were another diagnostic hint for the emission to originate from 3ILCT perturbed by the metal center. The Stokes shift of the compounds is in the region between 9564 cm−1 (2) and 8106 cm−1 (7), while the solution lifetimes of the complexes were found in the range between 0.77 and 9.40 μs, therefore indicating the origin of the emission to come from a triplet excited state.
 |
| | Fig. 3 Normalized emission spectra of complexes 2–7 in degassed CH2Cl2 at RT. | |
 |
| | Fig. 4 Normalized emission spectra of 5 wt% complexes 2–7 in PMMA. | |
Cyclic voltammetry studies
The cyclic voltammograms for complexes 2–7 revealed irreversible anodic peak potentials in the range of +0.10 to +0.22 V (vs. Fc0/+ couple) and two reduction peaks for all the complexes (Table 5). The first reduction peak was found to range from −1.25 to −1.41 V (vs. Fc0/+ couple) in DMF at RT. This reduction was found to be irreversible for complexes 2–5 and quasi-reversible for complexes 6 and 7. The second reduction was observed in the range of −1.66 to −1.92 V (vs. Fc0/+ couple) in DMF at RT. In contrast to the first reduction, this process was found to be quasi-reversible for all the complexes except for 7. The redox processes are thought to stem from the cyclometalating ppy ligand, since no significant changes in the redox potentials were observed. The quasi-reversibility of the first reduction for 6 and 7 is thought to originate from the electron accepting nature of the auxiliary phosphine ligands that eases the back-oxidation of the reduced ligand. For the complex 5 the study revealed a second irreversible oxidation peak at +0.46 V that is assigned to an oxidation process centered on the auxiliary 4-fluoroaniline ligand. Due to the oxidizing nature of gold(III) complexes and the large electrochemical band gap found for these complexes, the metal center is most probably not involved in the redox processes.16,17,28
Table 5 Cyclic voltammetry data of complexes 2–7 in 0.1 M [nBu4N][PF6] (Au electrode; E vs. Fc0/+; scan rate = 100 mV/s; 20 °C, DMF)
| Complex |
Oxidation Epa/V vs. Fc0/+ |
Reduction Epc/V vs. Fc0/+ |
|
2
|
0.13 |
−1.41, −1.68 (ΔE1/2) |
|
3
|
0.11 |
−1.40, −1.66 (ΔE1/2) |
|
4
|
0.11 |
−1.25, −1.77 (ΔE1/2) |
|
5
|
0.22, 0.46 |
−1.39, −1.68 (ΔE1/2) |
|
6
|
0.11 |
−1.33 (ΔE1/2), −1.92 (ΔE1/2) |
|
7
|
0.10 |
−1.36 (ΔE1/2), −1.77 |
Catalytic studies
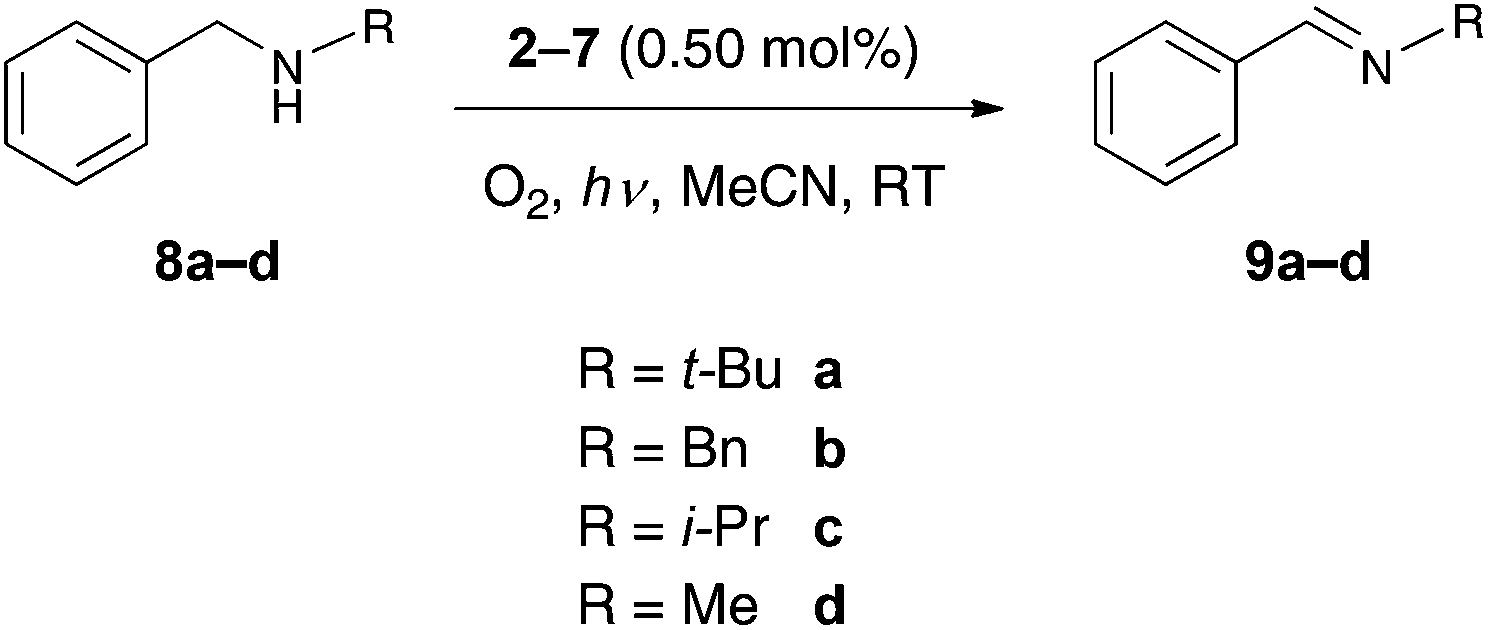
Although there have been recent reports on the employment of luminescent Au(III) complexes in photocatalytic reactions, they are still scarce in comparison with the Ru(II) and Ir(III) analogues.6,7,9 In this work, we have evaluated the photocatalytic performance of the cationic Au(III) monocyclometalated monoaryl complexes. Complexes 2–7 were tested as catalysts for the photo-oxidation of benzylic amines to the corresponding imines (Scheme 3). In the presence of molecular oxygen and under irradiation using a 125 W Hg-lamp as the light source, it was indeed found that the complexes 2–7 are able to catalyze the photo-oxidation of benzylic amines.
 |
| | Scheme 3 Photo-oxidation of benzylic amines. | |
In these studies, the complex 6 showed the best performance of the tested catalysts, since full conversion of the substrate N-benzyl-tert-butylamine (8a) to its corresponding product N-benzylidene-tert-butylamine (9a) was achieved after a reaction time of 4 h and with a catalyst loading of 0.50 mol% (Table 6). The other complexes that were tested did not lead to full conversion of the substrate 8a. The second most active catalyst was found to be 4, where a conversion of 72% for the substrate 8a was accomplished. The investigations pertaining to the photo-oxidation of N,N-dibenzylamine (8b), N-benzyl-isopropylamine (8c) and N-benzyl-methylamine (8d) to their respective products N-benzylidene-benzylamine (9b), N-benzylidene-isopropylamine (9c) and N-benzylidene-methylamine (9d) were pursued using only complexes 4 and 6. For the substrate 8c no full conversion was achieved. Even after a prolonged reaction time of 7 h, only a conversion of 12% was achieved using 6 as the catalyst and 8% was achieved when 4 was employed. The conversion rates for the substrate 8d were even poor with only 2% with 6 and no conversion at all with 4, respectively. The oxidation of the amines to the imines is thought to be driven by singlet oxygen, which is produced by harvesting the triplet state of the catalyst in the presence of light.9,34 It is quite evident from the varying conversion rates of the different substrates that an increase of the steric bulk of the substituents is favorable for the product formation. This behavior can be attributed to increased stabilization of the radical intermediate through hyperconjugation and/or inductive effects by the substituent on the benzylic nitrogen group. In conjunction with this, it is thought that the oxidation of the substrates proceeds over the formation of a radical intermediate at the benzylic nitrogen. In order to prove that the reactions were actually catalyzed by the complexes 2–7 and not by nanoparticles that eventually formed through decomposition of the catalyst during the reaction, the reaction mixture was investigated for nanoparticles by differential light scattering (DLS). The analysis indeed revealed the absence of nanoparticles in the reaction mixture and is highly indicative of the involvement of discrete molecular complexes in the aforementioned catalytic processes.
Table 6 Conversion rates for the photo-oxidation of benzylic amines to imines
| Substrate |
Catalyst |
Time (h) |
Conversion |
|
8a
|
6
|
4 |
100% |
|
8a
|
4
|
4 |
72% |
|
8a
|
3
|
4 |
54% |
|
8a
|
2
|
4 |
37% |
|
8a
|
7
|
4 |
25% |
|
8a
|
5
|
4 |
13% |
| |
|
8b
|
6
|
4 |
100% |
|
8b
|
4
|
6 |
53% |
| |
|
8c
|
6
|
7 |
12% |
|
8c
|
4
|
7 |
8% |
| |
|
8d
|
6
|
7 |
2% |
|
8d
|
4
|
7 |
— |
Theoretical calculations
Density functional theory (DFT) and time-dependent DFT (TD-DFT) calculations were carried out for selected molecules with the Gaussian 03 program package35 to investigate the absorption and emission properties of our series of compounds [(ppy)Au(FMes)L]. The hybrid functional PBE1PBE36 (also called PBE0) was applied in conjunction with the Stuttgart/Dresden effective core potentials (SDD) basis set37 for the Au center augmented with one f-polarization function (α = 1.050) and the standard 6-31+G(d) basis set38 for the remaining atoms. Full geometry optimizations without symmetry constraints were carried out in the gas phase for the singlet ground states (S0) and the lowest triplet states (T1). The optimized geometries S0 and T1 were confirmed to be potential energy minima by vibrational frequency calculations at the same level of theory, as no imaginary frequency was found. On the basis of the ground-state optimized geometries of the selected compounds 3 (L = 4-phenylpyridine), 4 (L = quinoline) and 7 (L = PPh3), time-dependent DFT (TD-DFT) calculations39–41 combined with the conductive polarizable continuum model42,43 (CPCM, dichloromethane solvent) were used to produce the ten lowest singlet–singlet and singlet–triplet vertical excitations with the corresponding energies, transition coefficients and oscillator strengths (Table 7, Tables S1–S3†). The energy levels and compositions of selected frontier orbitals are reported in Tables S4–S6 (ESI†).
Table 7 Selected singlet–singlet (S0–Sn) and singlet–triplet (S0–Tm) excited states with vertical excitation energies (nm), transition coefficients, orbitals involved in the transitions, and oscillator strengths f for compounds 3, 4 and 7 (with f > 0.07)a
| |
3
|
4
|
7
|
|
TDDFT/CPCM (CH2Cl2) calculations at the optimized ground-state geometry of each compound.
|
| S0–Sn |
n = 1 |
n = 1 |
n = 1 |
|
|
307.7 (0.224) |
309.1 (0.179) |
318.4 (0.142) |
|
|
HOMO → LUMO (0.67) |
HOMO → L+1 (0.59) |
HOMO → LUMO (0.63) |
|
|
|
HOMO → LUMO (0.33) |
|
| |
|
|
n = 3 |
n = 2 |
n = 4 |
|
|
286.9 (0.885) |
303.9 (0.078) |
289.9 (0.152) |
|
|
H−1 → L+1 (0.54) |
HOMO → LUMO (0.43) |
H−2 → LUMO (0.47) |
|
|
H−1 → LUMO (0.36) |
H−1 → LUMO (0.35) |
|
| |
|
|
n = 9 |
n = 3 |
n = 6 |
|
|
255.1 (0.177) |
299.1 (0.126) |
284.3 (0.258) |
|
|
HOMO → L+3 (0.55) |
H−1 → LUMO (0.52) |
H−1 → L+1 (0.63) |
|
|
|
HOMO → L+2 (0.40) |
|
| |
|
|
|
n = 8 |
|
|
|
|
274.5 (0.070) |
|
|
|
|
H−3 → LUMO (0.57) |
|
|
|
|
H−1 → L+6 (0.31) |
|
| |
| Tn–S0 |
n = 1 |
n = 1 |
n = 1 |
| 439.5 |
462.8 |
443.6 |
| HOMO ← LUMO (0.59) |
H−1 ← LUMO (0.60) |
HOMO ← LUMO (0.68) |
|
n = 2 |
n = 2 |
n = 2 |
| 403.6 |
438.5 |
361.3 |
| H−1 ← L+1 (0.55) |
HOMO ← L+1 (0.56) |
H−1 ← L+6 (0.21) |
The UV-Vis absorption spectra of complexes 2 and 4–7 exhibited a low-energy absorption band in the range 314–334 nm while the low-energy absorption of 3 was found at a significantly lower wavelength (293 nm). An additional shoulder at 336 nm was clearly found in the UV-Vis spectrum of 3. The lowest-lying singlet–singlet transition S0→S1 calculated at 307.7 nm (with an oscillator strength f = 0.224) for 3, 309.1 (f = 0.179) for 4, and 318.4 nm (f = 0.142) for 7 derives mainly from the one-electron excitation HOMO → LUMO for 3 and 7 and HOMO → LUMO+1 for 4 (Table 7). The HOMO of each compound corresponds to the π orbital of the cyclometalating 2-phenylpyridine (ppy) ligand with a π-antibonding character between the six-membered rings while the LUMO (for 3 and 7) and LUMO+1 (for 4) are mainly the π* orbitals of ppy showing an opposite π-bonding character between the rings with a small contribution from the metal center (Fig. 5). The S0→S1 transition can thus be assigned as an intra-ligand charge transfer 1ILCT[π→π*ppy] transition. In the case of compound 4, the singlet excited state S1 arises to a smaller extent from the HOMO → LUMO excitation corresponding to ligand-to-ligand charge transfer 1LLCT[π→π*], from the quinoline to the 2-phenylpyridine ligand. The S0→S3 transition of 3 (f = 0.885) computed at 286.9 nm is more intense than the lowest-lying transition S0→S1 and is composed of the two excitations HOMO−1 → LUMO+1 and HOMO−1 → LUMO. Since the HOMO−1 and LUMO+1 frontier orbitals are mainly the π and π* orbitals of the 4-phenylpyridine ligand (4-ppy), the S0→S3 transition can be viewed as an admixture of intra-ligand 1ILCT[π→π*4-ppy] and ligand-to-ligand 1LLCT[π4-ppy→π*ppy] characters. The next significant singlet–singlet transition (f > 0.03) is the S0→S9 transition at 255.1 nm (f = 0.177), which corresponds to the HOMO → LUMO+3 excitation, and like S0→S1 can be assigned to a 1ILCT[π→π*ppy] transition. For 4, the higher-lying S0→S2 transition at 303.9 nm (f = 0.078) and the S0→S3 transition at 299.1 nm (f = 0.126) are composed of two excitations, HOMO → LUMO/HOMO−1 → LUMO and HOMO−1 → LUMO/HOMO → LUMO+2, respectively. The former transition is assigned as a 1LLCT[πppy→π*quin]/1ILCT[π→π*quin] transition while the latter shows a manifold of charge transfer characters, 1ILCT[π→π*quin], 1ILCT[π→π*ppy], 1LLCT[πppy→π*FMes] and 1LMCT[πppy→Au] (ligand-to-metal charge transfer), since the electron density in LUMO+2 is delocalized all over the molecule. The corresponding singlet excited states S2 and S3 in 4 are energetically closer to the lowest-energy excited state S1 (energy gap ΔE = 0.07 and 0.14 eV, respectively) than in 3 (ΔE = 0.29 eV between S3 and S1) which is in good agreement with the experimental data where a shoulder at 336 nm, red-shifted in comparison with the main absorption band at 293 nm, is clearly observed in the UV-Vis absorption spectrum of 3 and only guessed, approximately at the same wavelength as the shoulder of 3, within the broad absorption band of 4 centered at 314 nm. For compound 7, the higher-lying singlet–singlet transitions to be considered are S0→S4 calculated at 289.9 nm (f = 0.152) and S0→S6 at 284.3 nm (f = 0.258). The orbitals involved in the excitations are HOMO−2/LUMO for S0→S4 and HOMO−1/LUMO+1 for S0→S6 which are involved in 1ILCT[π→π*ppy]/1LLCT[πPPh3→π*ppy] and 1ILCT[π→π*PPh3]/1ILCT[πPPh3→π*ppy]/1LMCT[πPPh3→Au] transitions. It seems that the absorption band experimentally observed for compound 7 located at 334 nm corresponds only to the intra-ligand charge transfer 1ILCT[π→π*ppy] transition S0→S1. Consequently, we can assume that the most red-shifted absorption band or shoulder for all the studied compounds 3, 4 and 7 is assigned as an intra-ligand charge transfer 1ILCT[π→π*] transition involving the chelating 2-phenylpyridine ligand. The corresponding band wavelength lies in the narrow range 330–336 nm showing a very small effect upon the change of the electron donating ancillary ligand. The most intense bands which appear at higher energies (290–320 nm) are originating mainly from excited states with metal-perturbed ligand-to-ligand 1LLCT and intra-ligand 1ILCT characters involving the ancillary ligands (4-phenylpyridine, quinoline and PPh3) and the chelating 2-phenylpyridine ligand.
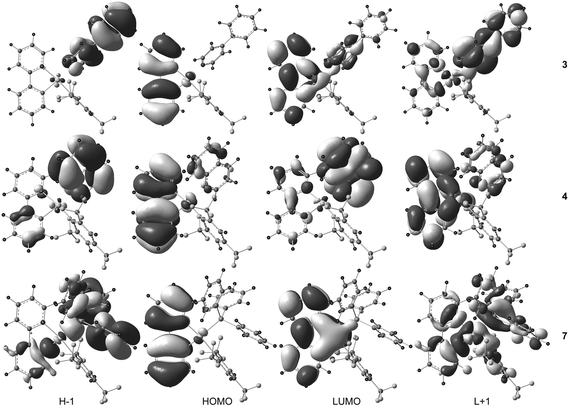 |
| | Fig. 5 Spatial plots of selected frontier orbitals of the optimized ground states of 3, 4, and 7. | |
The two lowest singlet–triplet vertical excitation T1–S0 and T2–S0 energies obtained by TD-DFT on the ground state structures are reported in Table 7. The T1–S0 transition for 3 (439.9 nm) and 7 (443.6 nm) corresponds to the HOMO–LUMO excitation indicating that the triplet excited state of each compound derives from the 3ILCT[π→π*ppy] origin. The optimized triplet state of 3 and 7 (unrestricted DFT calculations) confirms the 3ILCT[π→π*ppy] nature of the emissive state, showing the main distortions within the chelating 2-phenylpyridine ligand in comparison with the corresponding ground state structure (ESI†). The spin density surfaces of the lowest triplet state of 3 and 7 provide a visual display of the origin of the emission (Fig. 6). The experimental emission spectra are very similar in shape for all compounds which support the idea that the luminescence properties originate from the same chromophore, i.e. the chelating 2-phenylpyridine ligand through the 3ILCT[π→π*ppy] triplet excited states, as already observed in former studies.27,28 Interestingly, the T1–S0 transition for 4 computed at 462.8 nm is significantly different in energy from 3 and 7 and corresponds to the H−1–LUMO excitation, two frontier orbitals for which the electron density is predominantly located on the quinoline ligand. Consequently, the emission of 4 seems to originate from a transition with a 3ILCT[π→π*quin] character instead of the expected 3ILCT[π→π*ppy] nature. In fact, the 3ILCT[π→π*ppy] excited state, viewed as T1 for 3 and 7, becomes the T2 state for compound 4, arising from the HOMO–L+1 excitation, and is energetically close to the T1 excited states of 3 and 7 (the energy of the T2–S0 transition being computed at 438.5 nm). The DFT optimized geometry of the triplet state of 4 is in agreement with the promotion of one electron from HOMO to L+1 since the main structural variations in the triplet state in comparison with the corresponding ground state are observed within the quinoline ligand (ESI†). Again, the spin density surface of the lowest triplet state of 4 supports the 3ILCT[π→π*4-ppy] origin of the emission (Fig. 6). According to Kasha's rule, the photon emission is expected only from the lowest excited state which forbids us to consider the second-lowest excited triplet state T2 (with a 3ILCT[π→π*ppy] character) as the emissive state instead of the lower lying T1 state (with a 3ILCT[π→π*4-ppy] character) to match with the similarity of the emission spectra. Nonetheless, this ambiguity between the theoretical results and the experimental luminescence properties is a point of interest for our further studies.
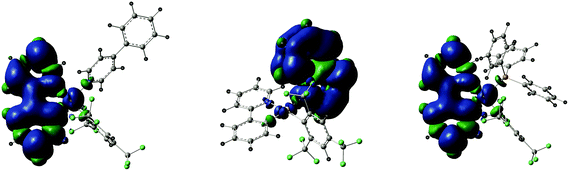 |
| | Fig. 6 Spin density surfaces for the optimized triplet states of 3, 4 and 7, showing the 3ILCT character of the emission processes. | |
Conclusions
In conclusion, a facile synthetic route towards the preparation of stable, luminescent, and cationic monocyclometalated gold(III) monoaryl complexes has been demonstrated. The complex 2 can be further utilized as a precursor molecule for the ready preparation of other cationic gold(III) complexes with other auxiliary ligands. It is shown that the choice of appropriate ancillary ligands with different electronic properties allows the emission quantum yield to be tuned, without affecting the emission wavelength maxima significantly. DFT and TDDFT calculations carried out on selected complexes further validate the involvement of different charge transfer states responsible for the origin of the emission, which is significantly influenced by the electronic nature of the ancillary ligands. Furthermore, the luminescent cationic complexes were successfully employed as catalysts for the photo-oxidation of benzylic amines to their corresponding imines through a C–H activation process. The scope of the catalytic applications is being further explored in our group by tailoring the complex solubility in water by an appropriate choice of the counter anions and ancillary ligands in order to exploit the developed cationic monocyclometalated gold(III) monoaryl complexes as photosensitizers in water oxidation catalysis.
Experimental section
General procedures and instrumentation
Unless otherwise stated, all manipulations were carried out without special precautions for excluding air and moisture. 1H, 13C{1H} and 31P{1H} NMR spectra were recorded on either a Bruker AV-500 or a Bruker AV2-400 spectrometer. 19F NMR spectra were recorded on either a Bruker AV2-400 spectrometer or a Varian Mercury spectrometer. Chemical shifts (δ) are reported in parts per million (ppm) referenced to tetramethylsilane (δ 0.00 ppm) using the residual protio solvent peaks as internal standards (1H NMR experiments) or the characteristic resonances of the solvent nuclei (13C NMR experiments). 19F NMR was referenced to CFCl3 (δ 0.00 ppm) and 31P relative to phosphoric acid. Coupling constants (J) are quoted in hertz (Hz), and the following abbreviations are used to describe the signal multiplicities: s (singlet); br s (broad singlet); d (doublet); t (triplet); q (quartet); m (multiplet); dd (doublet of doublet); ddd (doublet of doublet of doublet); td (triplet of doublet); tt (triplet of triplet). Proton and carbon assignments have been made using routine one- and two-dimensional NMR spectroscopies where appropriate. Elemental microanalysis was carried out with a Leco CHNS-932 analyzer. UV-Vis measurements were carried out on a Perkin-Elmer Lambda 19 UV-Vis spectrophotometer. Emission spectra were acquired on an Edinburgh FLS920 spectrophotometer using 450W Xenon lamp excitation by exciting at the longest-wavelength absorption maxima. All samples for emission spectra were degassed by at least three freeze–pump–thaw cycles in an anaerobic cuvette and were pressurized with N2 following each cycle. Phosphorescence lifetimes were measured by a time-correlated single photon counting method (TCSPC) performed on an Edinburgh FLS920 spectrophotometer, using an nF900 lamp source at 30000 Hz frequency with 15 nm excitation and 15 nm emission slit widths. Absolute quantum yields were measured using an integrating sphere from Edinburgh Instruments. YAG:Ce (powder) was used as a calibration reference with ϕem = 97%. Cyclic voltammograms were obtained with a Metrohm 797 VA Computrace Voltammetric Analyzer. The cell was equipped with a gold working electrode and a Pt counter electrode, and a non-aqueous reference electrode. All sample solutions (DMF) were approximately 5 × 10⁻³ M in the substrate and 0.1 M in Bu4NPF6, and were prepared under nitrogen. Ferrocene was subsequently added and the calibration of voltammograms was done. The 797 VA Computrace program was employed for data analysis. Thin films were spin coated on a quartz slide (12 × 12 mm) from a dichloromethane solution consisting of a mixture of poly(methyl methacrylate) (PMMA) and the corresponding Au(III) complex. Commercially available reagents were purchased from Aldrich, Chemie-Brunschwig and Fluorochem and were used as such without further purification.
Synthesis of [(ppy)Au(FMes)(OH2)]+[OTf]− (2).
To a solution of 1 (0.500 g, 0.749 mmol) in dry CHCl3 (35 mL) under a N2 atmosphere, AgOTf (0.231 mg, 0.899 mmol) was added and the resulting suspension was shielded from light and stirred for 72 h at RT. After evaporation of the solvent in vacuo and subsequent dissolution in dichloromethane (DCM), the suspension was filtered, washed with Et2O and dried in vacuo to obtain the product as a pale yellow solid. Single crystals suitable for X-ray diffraction analysis were obtained from slow evaporation of a concentrated solution of the complex in DCM with a layer of hexane at 0–5 °C. Yield = 0.547 g, 93%. 1H NMR (500 MHz, CD2Cl2, 300 K): δ 8.84 (d, J = 5.5 Hz, 1H), 8.24–8.21 (m, 1H), 8.19 (s, 2H), 8.06 (d, J = 8.5 Hz, 1H), 7.73–7.69 (m, 2H), 7.40 (td, J1 = 7.5 Hz, J2 = 1.0 Hz, 1H), 7.07–7.04 (m, 1H), 6.26 (d, J = 8.0 Hz, 1H), 5.33 (s, 2H). 13C{1H} NMR (125.7 MHz, CD2Cl2, 300 K): δ 161.3, 147.7, 143.8, 143.5, 142.1, 136.4, 135.8 (q, JC–F = 31 Hz), 134.4, 132.6, 131.1 (q, JC–F = 33 Hz), 130.0, 127.9, 126.7, 125.8, 124.1 (q, JC–F = 273 Hz), 123.5 (q, JC–F = 272 Hz), 121.5, 120.4 (q, JC–F = 317 Hz). 19F NMR (282 MHz, CD2Cl2, 298 K): δ −61.1 (s, 6F), −64.9 (s, 3F), −79.8 (s, 3F). Anal. Calc. for C21H10AuF12NO3S·H2O (%): C, 31.56; H, 1.51; N, 1.75. Found: C, 31.87; H, 1.39; N, 1.76.
Synthesis of [(ppy)Au(FMes)(4-ppy)]+[OTf]− (3).
To a solution of 2 (0.050 g, 0.064 mmol) in DCM (30 mL), 4-ppy (0.012 g, 0.077 mmol) was added and the resulting solution was stirred at RT for 3 h after which the solvent was evaporated under reduced pressure. The obtained off-white solid was washed three times with Et2O and then dried in vacuo to give the title compound as an off-white product. Single crystals suitable for X-ray diffraction analysis were obtained from slow evaporation of a concentrated solution of the complex in DCM with a layer of hexane at 0–5 °C. Yield = 0.048 g, 81%. 1H NMR (400 MHz, CD2Cl2, 300 K): δ 8.64–8.62 (m, 2H), 8.30 (td, J1 = 8.0 Hz, J2 = 1.6 Hz, 1H), 8.24 (s, 2H), 8.18 (d, J = 8.0 Hz, 1H), 8.09–8.06 (m, 2H), 7.94–7.92 (m, 1H), 7.85–7.80 (m, 3H), 7.72 (ddd, J1 = 7.4 Hz, J2 = 5.8 Hz, J3 = 1.4 Hz, 1H), 7.60–7.65 (m, 3H), 7.45 (td, J1 = 7.6 Hz, J2 = 1.2 Hz, 1H), 7.12 (td, J1 = 7.8 Hz, J2 = 1.2 Hz, 1H), 6.23 (dd, J = 8.0 Hz, 1.0 Hz, 1H). 13C{1H} NMR (100.6 MHz, CD2Cl2, 300 K): δ 163.2, 154.9, 149.7, 148.2, 144.5, 143.6, 143.4, 141.2, 135.3, 135.1 (q, JC–F = 31 Hz), 135.0, 132.7, 132.1, 131.7 (q, JC–F = 35 Hz), 130.3, 130.2, 129.2, 128.2, 127.1, 127.0, 126.7, 124.2 (q, JC–F = 274 Hz), 123.2 (q, JC–F = 273 Hz), 122.3, 121.6 (q, JC–F = 321 Hz). 19F NMR (376.5 MHz, CD2Cl2, 300 K): δ −58.8 (s, 6F), −63.5 (s, 3F), −78.9 (s, 3F). Anal. Calc. for C32H19AuF12N2O3S (%): C, 41.04; H, 2.04; N, 2.99. Found: C, 41.16; H, 2.06; N, 2.91.
Synthesis of [(ppy)Au(FMes)(C9H7N)]+[OTf]− (4).
To a solution of 2 (0.065 g, 0.083 mmol) in DCM (30 mL), quinoline (0.012 mL, 0.100 mmol) was added and the resulting solution was stirred at RT for 24 h. The obtained brownish solid was washed four times with Et2O and then dried in vacuo to give the title compound as an off-white product. Single crystals suitable for X-ray diffraction analysis were obtained from slow evaporation of a concentrated solution of the complex in DCM with a layer of hexane at 0–5 °C. Yield = 0.064 g, 86%. 1H NMR (500 MHz, CD2Cl2, 300 K): δ 8.83 (d, J = 5.0 Hz, 1H), 8.80 (d, J = 8.50 Hz, 1H), 8.50 (d, J = 8.50 Hz, 1H), 8.33 (s, 1H), 8.27–8.22 (m, 3H), 8.10 (s, 1H), 7.97 (t, J = 8.0 Hz, 1H), 7.90–7.87 (m, 2H), 7.83–7.80 (m, 1H), 7.51–7.46 (m, 2H), 7.34 (t, J = 6.5 Hz, 1H), 7.16 (t, J = 8.0 Hz, 1H), 6.25 (d, J = 6.25 Hz, 1H). 13C NMR (125.7 MHz, CD2Cl2, 300 K): δ 163.5, 152.9, 148.5, 144.5, 144.3, 143.6, 142.4, 135.1 (q, JC–F = 31 Hz), 135.1, 134.8, 133.7, 133.0, 132.0, 131.8 (q, JC–F = 35 Hz), 130.9, 130.4, 130.0, 129.7, 129.2, 127.2, 126.5, 125.5, 124.4 (q, JC–F = 274 Hz), 123.9, 123.1 (q, JC–F = 273 Hz), 122.5, 121.5 (q, JC–F = 321 Hz). 19F NMR (376.5 MHz, CD2Cl2, 300 K): δ −57.2 (s, 3F), −59.8 (s, 3F), −63.6 (s, 3F), −78.9 (s, 3F). Anal. Calc. for C30H17AuF12N2O3S (%): C, 39.57; H, 1.88; N, 3.08. Found: C, 39.38; H, 1.83; N, 3.00.
Synthesis of [(ppy)Au(FMes)(C6H4FN)]+[OTf]− (5).
To a solution of 2 (0.050 g, 0.064 mmol) in DCM (30 mL) 4-fluoroaniline (0.007 mL, 0.077 mmol) was added and the resulting solution was stirred at RT for 16 h. The obtained solid was washed three times with Et2O and then dried in vacuo to give the title compound as an off-white solid. Single crystals suitable for X-ray diffraction analysis were obtained from slow evaporation of a concentrated solution of the complex in DCM with a layer of hexane at 0–5 °C. Yield = 0.028 g, 50%. 1H NMR (500 MHz, CD2Cl2, 300 K): δ 9.02 (d, J = 5.5 Hz, 1H), 8.24–8.20 (m, 1H), 8.08–8.05 (m, 1H), 7.97 (s, 2H), 7.76–7.69 (m, 2H), 7.41–7.37 (m, 1H), 7.07–7.02 (m, 1 H), 6.88–6.82 (m, 2H), 6.79–6.76 (m, 2H), 6.27–6.22 (m, 1H). 13C NMR (125.7 MHz, CD2Cl2, 300 K): δ 165.4 (d, JC–F = 258 Hz), 163.4, 154.2, 148.8, 145.5, 144.3, 143.9, 140.5, 135.1 (q, JC–F = 30 Hz), 133.7, 132.8, 131.7 (q, JC–F = 35 Hz), 131.5, 130.4, 128.9, 128.2, 126.7, 123.9 (q, JC–F = 273 Hz), 123.3 (q, JC–F = 274 Hz), 121.9, 121.5 (q, JC–F = 319 Hz), 118.2 (d, JC–F = 24 Hz). 19F NMR (376.5 MHz, CD2Cl2, 300 K): δ −59.6 (s, 6F), −63.6 (s, 3F), −79.0 (s, 3F), −116.2 (s, 1F). Anal. Calc. for C27H16AuF13N2O3S (%): C, 36.34; H, 1.81; N, 3.14. Found: C, 36.50; H, 1.67; N, 2.84.
Synthesis of [(ppy)Au(FMes)(P(OMe)3)]+[OTf]− (6).
To a solution of 2 (0.050 g, 0.064 mmol) in DCM (30 mL) P(OMe)3 (0.008 mL, 0.070 mmol) was added and the resulting solution was stirred at RT for 4 h. The obtained yellowish solid was washed three times with Et2O and then dried in vacuo to give the title compound as an off-white product. Single crystals suitable for X-ray diffraction analysis were obtained from slow evaporation of a concentrated solution of the complex in DCM with a layer of hexane at 0–5 °C. Yield = 0.046 g, 80%. 1H NMR (400 MHz, CD2Cl2, 300 K): δ 9.11–9.08 (m, 1H), 8.35–8.30 (m, 1H), 8.28 (s, 2H), 8.15 (d, J = 8.0 Hz, 1H), 7.96–7.93 (m, 1H), 7.83–7.79 (m, 1H), 7.40 (tt, J1 = 7.6 Hz, J2 = 1.2 Hz, 1H), 7.17–7.12 (m, 1H), 6.03 (dd, J1 = 13.8 Hz, J2 = 6.0 Hz, 1H), 3.90 (d, J = 11.6 Hz, 9H). 13C{1H} (125.7 MHz, CD2Cl2, 300 K): δ 165.9 (d, JC–P = 10 Hz), 157.5, 155.9, 152.5 (d, JC–P = 4 Hz), 145.2, 144.2, 141.6 (d, JC–P = 22 Hz), 134.2 (q, JC–F = 31 Hz), 134.0, 132.8 (d, JC–P = 14 Hz), 131.3 (q, JC–F = 34 Hz), 130.0, 128.8, 127.8, 126.6 (d, JC–P = 11 Hz), 123.8 (q, JC–F = 274 Hz), 123.3 (q, JC–F = 273 Hz), 122.6, 121.6 (q, JC–F = 321 Hz), 56.8 (d, JC–P = 9 Hz). 19F NMR (376.5 MHz, CD2Cl2, 300 K): δ –61.2 (d, J = 3.5 Hz, 6F), −63.4 (s, 3F), −78.9 (s, 3F). 31P{1H} NMR (202.5 MHz, CD2Cl2, 300 K): δ 115.5. Anal. Calc. for C24H19AuF12NO6PS (%): C, 31.84; H, 2.12; N, 1.55. Found: C, 31.51; H, 2.09; N, 1.46.
Synthesis of [(ppy)Au(FMes)(PPh3)]+[OTf]− (7).
To a solution of 2 (0.050 g, 0.064 mmol) in DCM (30 mL), PPh3 (0.021 g, 0.080 mmol) was added and the resulting solution was stirred at RT for 30 min. Thereafter, the solvent was removed in vacuo and the obtained pale yellow solid was washed with Et2O to give the title compound as an off-white solid. Single crystals suitable for X-ray diffraction analysis were obtained from slow evaporation of a concentrated solution of the complex in DCM with a layer of hexane at 0–5 °C. Yield = 0.061 g, 92%. 1H NMR (500 MHz, CD2Cl2, 300 K): δ 8.34 –8.28 (m, 2H), 8.11 (d, J = 6.0 Hz, 1H), 7.99–7.96 (m, 1H), 7.84–7.78 (m, 8H), 7.65 (br s, 4H), 7.47 (t, J = 8.0 Hz, 1H), 7.33 (br s, 1H), 7.18–7.15 (m, 1H), 7.13–7.08 (m, 3H), 6.65 (br s, 2H), 6.20 (t, J = 8.0 Hz, 1H). 13C{1H} NMR (125.7 MHz, CD2Cl2, 300 K): δ 166.9 (d, JC–P = 6 Hz), 159.5, 158.5, 151.6 (d, JC–P = 4 Hz), 146.2 (d, JC–P = 12.7 Hz), 144.7, 144.4, 136.0 (d, JC–P = 11 Hz), 134.8, 133.3 (d, JC–P = 9 Hz), 133.1 (q, JC–F = 33 Hz), 131.2 (q, JC–F = 35 Hz), 131.0, 130.2, 129.3, 128.8, 127.3 (d, JC–P = 7 Hz), 125.9, 123.6 (q, JC–F = 274 Hz), 123.2, 123.1 (q, JC–F = 273 Hz), 121.6 (q, JC–F = 321 Hz). 19F NMR (376.5 MHz, CD2Cl2, 300 K): δ −59.5 (d, J = 3.0 Hz, 6F),−63.5 (s, 3F), −78.9 (s, 3F). 31P{1H} NMR (202.5 MHz, CD2Cl2, 300 K): δ 37.9. Anal. Calc. for C39H25AuF12NO3PS (%): C, 44.88; H, 2.41; N, 1.34. Found: C, 45.19; H, 2.46; N, 1.90.
General procedure for the photo-oxidation of the benzylic amines 8a–8d
To a solution of benzylic amine (0.5000 mmol) in MeCN (9.0 mL) in a 30 cm glass cell, the respective catalyst (0.0025 mmol, 0.50 mol%) was added. Thereafter, O2 was bubbled through the reaction mixture while irradiating with a 125 W Hg-lamp. After leaving the reaction run for the respective time at RT, the solvent was removed in vacuo and the product yield was calculated by means of 1H NMR based on the substrate consumption.
X-ray crystallography
The data collection and structure-refinement data for compounds 2–7 are presented in Tables 2 and 3. Single-crystal X-ray diffraction data were collected at 183(2) K on a Xcalibur diffractometer (Ruby CCD detector) for compounds 2, 3, 5–7 and on a SuperNova area-detector diffractometer for compound 4 using a single wavelength Enhance X-ray source with MoKα radiation (λ = 0.71073 Å).44 The selected suitable single crystals were mounted using polybutene oil on the top of a glass fiber fixed on a goniometer head and immediately transferred to the diffractometer. Pre-experiment, data collection, data reduction and analytical absorption corrections45 were performed with the program suite CrysAlisPro.44 The crystal structures were solved with SHELXS9746 using direct methods. The structure refinements were performed by full-matrix least-squares on F2 with SHELXL97.46 All programs used during the crystal structure determination process are included in the WINGX software.47 PLATON48 was used to check the result of the X-ray analyses. For more details about the refinements, see the refine_special_details and iucr_refine_instructions_details sections in the Crystallographic Information files (ESI†). CCDC-985205 (for 2), CCDC-985206 (for 3), CCDC-985207 (for 4), CCDC-985208 (for 5), CCDC-985209 (for 6) and CCDC-985210 (for 7) contain the supplementary crystallographic data for this paper.
Acknowledgements
This work was supported by the Swiss National Science Foundation (grant no. 200021_135488) and the University of Zurich. We are thankful to Michael Bachmann for the excited-state lifetime measurements of the complexes in PMMA films. K.V. is grateful to Prof. R. Alberto for his generous support.
References
-
H. Yersin, in Highly Efficient OLEDs with Phosphorescent Materials, ed. H. Yersin, Wiley-VCH Verlag GmbH & Co. KgaA, Weinheim, Germany, 2008 Search PubMed
 .
.
- H. Yersin, A. F. Rausch, R. Czerwieniec, T. Hofbeck and T. Fischer, Coord. Chem. Rev., 2011, 255, 2622–2652 CrossRef CAS PubMed .
- R. D. Costa, E. Ortí, H. J. Bolink, F. Monti, G. Accorsi and N. Armaroli, Angew. Chem., Int. Ed., 2012, 51, 8178–8211 CrossRef CAS PubMed .
- H. Hennig, Coord. Chem. Rev., 1999, 182, 101–123 CrossRef .
- D. A. Nicewicz and D. W. C. MacMillan, Science, 2008, 322, 77–80 CrossRef CAS PubMed .
- C. K. Prier, D. A. Rankic and D. W. C. MacMillan, Chem. Rev., 2013, 113, 5322–5363 CrossRef CAS PubMed .
- J. M. R. Narayanam, J. W. Tucker and C. R. Stephenson, J. Am. Chem. Soc., 2009, 131, 8756–8757 CrossRef CAS PubMed .
- D. Li, C.-M. Che, H.-L. Kwong and V. W.-W. Yam, J. Chem. Soc., Dalton Trans., 1992, 3325 RSC .
- W.-P. To, G. S.-M. Tong, W. Lu, C. Ma, J. Liu, A. L.-F. Chow and C.-M. Che, Angew. Chem., Int. Ed., 2012, 51, 2654–2657 CrossRef CAS PubMed .
- A. J. Esswein and D. G. Nocera, Chem. Rev., 2007, 107, 4022–4047 CrossRef CAS PubMed .
- M. A. Baldo, D. F. O'Brien, Y. You, A. Shoustikov, S. Sibley, M. E. Thompson and S. R. Forrest, Nature, 1998, 395, 151–154 CrossRef CAS PubMed .
- J. Brooks, Y. Babayan, S. Lamansky, P. I. Djurovich, I. Tsyba, R. Bau and M. E. Thompson, Inorg. Chem., 2002, 41, 3055–3066 CrossRef CAS PubMed .
- J. Li, P. I. Djurovich, B. D. Alleyne, M. Yousufuddin, N. N. Ho, J. C. Thomas, J. C. Peters, R. Bau and M. E. Thompson, Inorg. Chem., 2005, 44, 1713–1727 CrossRef CAS PubMed .
- V. W.-W. Yam, K. M.-C. Wong, L.-L. Hung and N. Zhu, Angew. Chem., Int. Ed., 2005, 44, 3107–3110 CrossRef CAS PubMed .
- K. M.-C. Wong, X. Zhu, L.-L. Hung, N. Zhu, V. W.-W. Yam and H.-S. Kwok, Chem. Commun., 2005, 2906–2908 RSC .
- K. M.-C. Wong, L.-L. Hung, W. H. Lam, N. Zhu and V. W.-W. Yam, J. Am. Chem. Soc., 2007, 129, 4350–4365 CrossRef CAS PubMed .
- V. K.-M. Au, K. M.-C. Wong, N. Zhu and V. W.-W. Yam, J. Am. Chem. Soc., 2009, 131, 9076–9085 CrossRef CAS PubMed .
- V. K.-M. Au, K. M.-C. Wong, D. P.-K. Tsang, M.-Y. Chan, N. Zhu and V. W.-W. Yam, J. Am. Chem. Soc., 2010, 132, 14273–14278 CrossRef CAS PubMed .
- V. K.-M. Au, K. M.-C. Wong, N. Zhu and V. W.-W. Yam, Chem. – Eur. J., 2011, 17, 130–142 CrossRef CAS PubMed .
- V. K.-M. Au, W. H. Lam, W.-T. Wong and V. W.-W. Yam, Inorg. Chem., 2012, 51, 7537–7545 CrossRef CAS PubMed .
- V. K.-M. Au, D. P.-K. Tsang, K. M.-C. Wong, M.-Y. Chan, N. Zhu and V. W.-W. Yam, Inorg. Chem., 2013, 52, 558–567 CrossRef CAS PubMed .
- M.-C. Tang, D. P.-K. Tsang, M. M.-Y. Chan, K. M.-C. Wong and V. W.-W. Yam, Angew. Chem., Int. Ed., 2013, 52, 446–449 CrossRef CAS PubMed .
- C.-W. Chan, W.-T. Wong and C.-M. Che, Inorg. Chem., 1994, 33, 1266–1272 CrossRef CAS .
- K.-H. Wong, K.-K. Cheung, M. C.-W. Chan and C.-M. Che, Organometallics, 1998, 17, 3505–3511 CrossRef CAS .
- W.-P. To, K. T. Chan, G. S. M. Tong, C. Ma, W.-M. Kwok, X. Guan, K.-H. Low and C.-M. Che, Angew. Chem., Int. Ed., 2013, 52, 6648–6652 CrossRef CAS PubMed .
- X.-S. Xiao, W.-L. Kwong, X. Guan, C. Yang, W. Lu and C.-M. Che, Chem. – Eur. J., 2013, 19, 9457–9462 CrossRef CAS PubMed .
- J. A. Garg, O. Blacque, T. Fox and K. Venkatesan, Inorg. Chem., 2010, 49, 11463–11472 CrossRef CAS PubMed .
- J. A. Garg, O. Blacque and K. Venkatesan, Inorg. Chem., 2011, 50, 5430–5441 CrossRef CAS PubMed .
-
(a) A. Szentkuti, M. Bachmann, J. A. Garg, O. Blacque and K. Venkatesan, Chem. – Eur. J., 2014, 20, 2585–2596 CrossRef CAS PubMed ;
(b) J. Vicente, M. D. Bermúdez, M. T. Chicote and M. Sánchez-Santano, J. Organomet. Chem., 1990, 381, 285–292 CrossRef CAS ;
(c) D. A. Smith, D.-A. Roşca and M. Bochmann, Organometallics, 2012, 31, 5998–6000 CrossRef CAS ;
(d) J. Vicente, M. D. Bermúdez, M. T. Chicote and M. Sánchez-Santano, J. Organomet. Chem., 1989, 371, 129 CrossRef CAS ;
(e) J. Vicente, M. T. Chicote, M. D. Bermúdez, M. J. Sánchez-Santano and P. G. Jones, J. Organomet. Chem., 1988, 354, 381–390 CrossRef CAS ;
(f) J. Vicente, M. T. Chicote, M. D. Bermúdez, M. J. Sánchez-Sanatno, P. G. Jones, C. Fittschen and G. M. Sheldrick, J. Organomet. Chem., 1986, 310, 401–409 CrossRef CAS ;
(g) J. Vicente, M. Chicote, M. Bermúdez, M. J. Sánchez-Sanatno and P. G. Jones, J. Chem. Soc., Dalton Trans., 1984, 557–562 RSC ;
(h) M. Krikorian, S. Liu and T. M. Swager, J. Am. Chem. Soc., 2014, 136, 2952 CrossRef CAS PubMed ;
(i) S. Komiya, J. C. Huffman and J. K. Kochi, Inorg. Chem., 1977, 16, 2138–2140 CrossRef CAS ;
(j) J. Vicente, M. D. Bermúdez and J. Escribano, Organometallics, 1991, 10, 3380–3384 CrossRef CAS ;
(k) J. Vicente, M. D. Bermúdez and F. J. Carrión, Inorg. Chim. Acta, 1994, 220, 1–3 CrossRef CAS .
- A. Venugopal, A. P. Shaw, K. W. Törnroos, R. H. Heyn and M. Tilset, Organometallics, 2011, 30, 3250–3253 CrossRef CAS .
- V. W.-W. Yam, S. W.-K. Choi, T.-F. Lai and W.-K. Lee, J. Chem. Soc., Dalton Trans., 1993, 1001–1002 RSC .
- H. Schmidbaur, Gold Bull., 2000, 33, 3–10 CrossRef CAS .
- A. J. Lees, Comments Inorg. Chem., 1995, 17, 319–346 CrossRef CAS .
- M. C. DeRosa and R. J. Crutchley, Coord. Chem. Rev., 2002, 233–234, 351–371 CrossRef CAS .
-
M. J. Frisch, G. W. Trucks, H. B. Schlegel, G. E. Scuseria, M. A. Rob, J. R. Cheeseman, J. A. Montgomery Jr., T. Vreven, K. N. Kudin, J. C. Burant, J. M. Millam, S. S. Iyengar, J. Tomasi, V. Barone, B. Mennucci, M. Cossi, G. Scalmani, N. Rega, G. A. Petersson, H. Nakatsuji, M. Hada, M. Ehara, K. Toyota, R. Fukuda, J. Hasegawa, M. Ishida, T. Nakajima, Y. Honda, O. Kitao, H. Nakai, M. Klene, X. Li, J. E. Knox, H. P. Hratchian, J. B. Cross, V. Bakken, C. Adamo, J. Jaramillo, R. Gomperts, R. E. Stratmann, O. Yazyev, A. J. Austin, R. Cammi, C. Pomelli, J. W. Ochterski, P. Y. Ayala, K. Morokuma, G. A. Voth, P. Salvador, J. J. Dannenberg, V. G. Zakrzewski, S. Dapprich, A. D. Daniels, M. C. Strain, O. Farkas, D. K. Malick, A. D. Rabuck, K. Raghavachari, J. B. Foresman, J. V. Ortiz, Q. Cui, A. G. Baboul, S. Clifford, J. Cioslowski, B. B. Stefanov, G. Liu, A. Liashenko, P. Piskorz, I. Komaromi, R. L. Martin, D. J. Fox, T. Keith, M. A. Al-Laham, C. Y. Peng, A. Nanayakkara, M. Challacombe, P. M. W. Gill, B. Johnson, W. Chen, M. W. Wong, C. Gonzalez and J. A. Pople, Gaussian 03 (Revision D.01), Gaussian, Inc., Wallingford, CT, 2003 Search PubMed .
- C. Adamo and V. Barone, J. Chem. Phys., 1999, 110, 6158–6170 CrossRef CAS PubMed .
-
T. H. Dunning Jr. and P. J. Hay, Modern Theoretical Chemistry, Plenum, New York, 1976, vol. 3 Search PubMed .
- R. Ditchfield, W. J. Hehre and J. A. Pople, J. Chem. Phys., 1971, 54, 724 CrossRef CAS PubMed .
- R. Bauernschmitt and R. Ahlrichs, Chem. Phys. Lett., 1996, 256, 454–464 CrossRef CAS .
- M. E. Casida, C. Jamorski, K. C. Casida and D. R. Salahub, J. Chem. Phys., 1998, 108, 4439–4449 CrossRef CAS PubMed .
- R. E. Stratmann, G. E. Scuseria and M. J. Frisch, J. Chem. Phys., 1998, 109, 8218–8224 CrossRef CAS PubMed .
- V. Barone and M. Cossi, J. Phys. Chem. A, 1998, 102, 1995–2001 CrossRef CAS .
- M. Cossi, N. Rega, G. Scalmani and V. Barone, J. Comput. Chem., 2003, 24, 669–681 CrossRef CAS PubMed .
-
Agilent Technologies (formerly Oxford Diffraction), Yarnton, England, 2011 Search PubMed .
- R. C. Clark and J. S. Reid, Acta Crystallogr., 1995, 51, 887–897 CrossRef .
- G. M. Sheldrick, Acta Crystallogr., 2008, 64, 112–122 CrossRef CAS PubMed .
- L. Farrugia, J. Appl. Crystallogr., 1999, 32, 837–838 CrossRef CAS .
- A. L. Spek, J. Appl. Crystallogr., 2003, 36, 7–13 CrossRef CAS .
Footnote |
| † Electronic supplementary information (ESI) available. CCDC 985205–985210. For ESI and crystallographic data in CIF or other electronic format see DOI: 10.1039/c4dt01187b |
|
| This journal is © The Royal Society of Chemistry 2014 |
Click here to see how this site uses Cookies. View our privacy policy here.  Open Access Article
 This Open Access Article is licensed under a Creative Commons Attribution-Non Commercial 3.0 Unported Licence