 Open Access Article
Creative Commons Attribution 3.0 Unported Licence
Revised crystal structure and luminescent properties of gadolinium oxyfluoride Gd4O3F6 doped with Eu3+ ions†
Tomasz
Grzyb
*a,
Rafal J.
Wiglusz
*b,
Vitali
Nagirnyi
c,
Aleksei
Kotlov
d and
Stefan
Lis
a
aDepartment of Rare Earth, Faculty of Chemistry, Adam Mickiewicz University, Umultowska 89b, 61-614 Poznan, Poland. E-mail: tgrzyb@amu.edu.pl
bInstitute of Low Temperature and Structure Research, Polish Academy of Sciences, P.O. Box 1410, 50-950 Wroclaw, Poland. E-mail: R.Wiglusz@int.pan.wroc.pl
cInstitute of Physics, University of Tartu, Riia 142, 51014 Tartu, Estonia
dPhoton Science Division at DESY, Gebaude 25b/309 Notkestr. 85, D-22607 Hamburg, Germany
First published on 4th March 2014
Abstract
The structure of gadolinium oxyfluoride nanoparticles was revised. Extensive studies including X-ray diffraction and Rietveld refinement as well as Fourier transform infrared spectroscopy and Raman spectroscopy confirmed the monoclinic P12/c1 crystal structure of Gd4O3F6. Morphological analysis using transmission electron microscopy showed the nanocrystallinity of the materials prepared via the sol–gel Pechini's method. The luminescent properties of the prepared materials with different concentrations of Eu3+ ions were characterized by emission spectroscopy. The phosphors obtained were investigated in the vacuum ultraviolet range using synchrotron radiation. The Judd–Ofelt parameters (Ω2, Ω4) and emission efficiencies η were calculated and are discussed in detail.
Introduction
The research in the area of rare earth oxyfluorides (REOF) is thriving not only through the rich structural varieties observed in the materials but also through their widely varying luminescence properties that promise potential applications.1–15 The structural properties of REOF were mostly investigated by Zachariasen in the 1950s.16 It has been determined that as a result of solid state reaction between rare earth fluorides and their oxides at high temperatures, oxyfluorides are formed. They crystallize in two different phases, tetragonal and rhombohedral. Unlike rhombohedral oxyfluorides, the ones with the tetragonal crystal structure suffer from instability and form usually nonstoichiometric compounds. Their general formula is REOnF3−2n, 0.7 < n < 1.16 A high similarity between F− and O2− ionic radii is mainly responsible for the variations in the tetragonal phase. These ions can substitute for each other in the crystal structure. The crystallographic structure of YOF and LaOF can be obtained as a result of a tetragonal or rhombohedral deformation of the regular cubic elementary crystal cell of CaF2. Further research has brought about a better understanding of other lanthanide oxyfluoride systems, giving detailed information about their crystallography.17–19Besides tetragonal and rhombohedral forms also a cubic form has been obtained as a result of the phase transition from their rhombohedral form at high temperatures.20,21 The main crystallographic space groups assigned to REOF are: tetragonal P4/nmm and rhombohedral R![[3 with combining macron]](https://www.rsc.org/images/entities/char_0033_0304.gif) m. In the tetragonal structure, RE3+ ions occupy sites with C4v symmetry, whereas in the rhombohedral structure, the local symmetry of RE3+ is C3v.2
m. In the tetragonal structure, RE3+ ions occupy sites with C4v symmetry, whereas in the rhombohedral structure, the local symmetry of RE3+ is C3v.2
The more accurate analysis of nonstoichiometric oxyfluorides has shown higher than expected complexity of these materials.22–24 The oxyfluorides of the composition RE(O,F)2+δ, where 0.4 ≥ δ ≥ 0, crystallize in a tetragonal form; however, for REnOn−1Fn+2, where 5 ≤ n ≤ 9, RE = Y, Sm–Lu, the orthorhombic crystal structure is more stable and probable.
The crystallographic data for gadolinium oxyfluoride are incomplete and this compound requires additional studies. Up to now, the tetragonal structure has been assigned to Gd4O3F6 only in one scientific article; however, there no data have been given about its crystallographic space group.25 As this compound, similar to other rare earth oxyfluorides, could be used as a host for luminescent Ln3+ ions (where Ln3+ = Eu3+, Yb3+/Er3+, etc.),9,11,13,15 there is a need to know its structure and determine the crystallographic properties.
Tetragonal oxyfluorides of the formula REOnF3−2n, 0.7 < n < 1, contain fluorine F− ions in the interstitial sites in a crystal structure derived from that of fluorite CaF2.16 Takashima et al. proposed a different crystal structure for the binary rare earth oxyfluorides, RE2IRE2IIO3F6, where REI = La, Nd, REII = Y, Eu, Gd. In the presented studies, concerning mainly the ionic conductivity of oxyfluorides, a monoclinic crystal system of the P2/c space group is reported.26–31 The assignment of a tetragonal structure to binary rare earth oxyfluorides results in a discrepancy in the positions of XRD reflections with the reference pattern. Also the shape of XRD peaks recorded, their intensity and the ratio between them are in disagreement with the theoretical pattern. Additionally, the presence of a weak peak at 33.84° 2θ could not be attributed to any of crystallographic planes. A monoclinic structure could be considered as a slightly distorted tetragonal lattice derived from the fluorite structure. The refinement with the structural parameters of a monoclinic crystal system allowed us to solve the structure of the Gd4O3F6 material. The P2/c monoclinic crystal system was assigned as the most probable for this compound. The presented results show that the positions of ions in the Gd4O3F6 crystallographic lattice are very similar to those in the tetragonal structure. Hence, the Gd4O3F6 structure can be treated as pseudo-tetragonal.
Luminescence properties of lanthanide ions (Ln3+) are well known and widely studied because of their narrow line-width emission bands, large Stokes shifts, high quantum yields, long lifetimes and photostability.32–37 The presence of (Gd,Eu)–F and (Gd,Eu)–O bonds in the Eu3+-doped oxyfluorides can increase absorption in the vacuum ultraviolet (VUV) range. This property is useful for new, Hg-free sources of fluorescent light.38,39 Quantum cutting phenomena which are prone to occur in VUV absorbing phosphors is another advantage of these materials, enabling the emission quantum yield higher than 100%.40,41 Also white LEDs (light emitting diodes) may be an area where luminescence of Ln3+ ions is important.42–44
The sol–gel method used for the synthesis of Gd4O3F6 and relatively low temperature of calcination of the precursors prepared in this way could be used for the production of phosphors.
Experimental
Synthesis
Gadolinium oxyfluorides, Gd4O3F6 and Gd4O3F6:Eu3+, were synthesized by the modified Pechini's method.45 The starting materials were gadolinium and europium oxides, Gd2O3 and Eu2O3 (Stanford Materials 99.99%, United States), nitric acid HNO3 (POCh S.A., ultra-pure, Poland), ammonium fluoride NH4F (POCh S.A., ACS grade 98+%, Poland), citric acid monohydrate (CHEMPUR, p.a. grade, Poland), and ethylene glycol (CHEMPUR, p.a. grade, Poland).To synthesize pure matrix without dopant ions, Gd4O3F6, the gadolinium oxide (0.9166 g) was dissolved in HNO3 and evaporated several times in order to remove excess amount of HNO3. The beaker containing the obtained Gd(NO3)3 was filled up to 100 ml with distilled water and 24 g of citric acid and then 4 ml of ethylene glycol were added. A large excess of citric acid was used to prevent the precipitation of lanthanide fluorides (24 g of citric acid and 4 ml of ethylene glycol per 1 g of product). Upon intensive stirring, an aqueous solution of 0.35 g ammonium fluoride in 10 ml of water was slowly dropped into the solution (with 25% excess because of the stoichiometric amounts of Gd3+ ions). The solution was heated at 80 °C for 24 hours in order to evaporate the water and to obtain a gel. The prepared precursor was annealed at 500–900 °C under the air atmosphere for 2 h. A similar procedure was used for the synthesis of Eu3+-doped samples, based on the stoichiometric calculations which assumed replacement of Gd3+ by Eu3+ ions in the structure of Gd4O3F6.
Characterization
Thermogravimetric analysis (TG) and differential thermal gravimetry (DTG) were performed using a Haas DSC XP-10i calorimeter. The X-ray diffraction (XRD) patterns were collected in the 2θ range 10–80° with an X'Pert PRO X-ray diffractometer (Cu, Kα1: 1.54060 Å) (PANalytical). The IR absorption spectrum was recorded between 400 and 4000 cm−1 on a Fourier transform infrared (FT-IR) spectrophotometer Bruker FT-IR IFS 66/s. The material was mixed with KBr and then pressed to discs. Raman spectra were taken using a LabRam HR 800 Horiba Yvon Jobin system equipped with a 9 mW HeNe laser emitting a 632.8 nm line. The Gd4O3F6 powders were investigated by transmission electron microscopy (TEM) using a Philips CM-20 SuperTwin microscope operating at 200 kV. Specimens for TEM were prepared by dispersing a small amount of the sample in methanol and putting a droplet of the suspension on a copper microscope grid covered with perforated carbon. Diffractograms were used in crystallographic data refinement with the help of the Rietveld method.46 The Maud 2.33 software was used to perform the Rietveld refinement of cell parameters and the phase composition.47 The quality of structural refinement was generally checked by R-values (Rw, Rwnb, Rall, Rnb), and these numbers are easy to detect as they are consistent with a monoclinic structure. However, other parameters with additional functions were applied to find a structural refinement with better quality and reliability.The luminescence characteristics of the synthesized samples were studied with a Hitachi F-7000 fluorescence spectrophotometer at room and liquid nitrogen temperatures (300 and 77 K) with a 150 W xenon lamp as an excitation source. Excitation and emission spectra were corrected for the instrumental response. The luminescence decay curves of the prepared samples were measured on a Photon Technology Int. QuantaMasterTM 40 spectrophotometer equipped with an Opotek Inc. Opolette 355LD UVDM tunable laser with a repetition rate of 20 Hz as an excitation source and a Hamamatsu R928 photomultiplier as a detector. The curve fit for the decay data was performed with the Origin 9.0 software. The fit with the time traces was at least R2 = 0.998 and the errors were not larger than τerr < 0.01 ms.
The synchrotron radiation study of powder samples was performed at the SUPERLUMI station of HASYLAB, Hamburg, Germany. The setup has been described in detail elsewhere.48 Luminescence spectra with resolution 1 nm were recorded with a SpectraPro308i (Acton) spectrograph equipped with a CCD camera. The second arm of the spectrograph equipped with a Hamamatsu photomultiplier R6358P was used for measuring the excitation spectra of different emission lines. In the latter case, the slits of the spectrograph were set to a spectral interval of 10 nm. The excitation spectra were corrected for the spectral distribution of the incident light.
Results and discussion
Structure and morphology
Gadolinium oxyfluoride, Gd4O3F6, is a relatively less studied material as can be concluded, for example, from the lack of accurate crystallographic data for this compound. It has attracted undeservedly little attention of researchers and only one example of its use as a matrix for up-converting Yb3+, Tm3+ and Er3+ ions could be found.11 This material could be a good potential host for luminescent lanthanide ions like Eu3+ and Tb3+. Relatively low phonon energies of Gd4O3F6 cause lower efficiency of the phonon relaxation from the 5D1 excited state of Eu3+ ions to the 5D0 state. A large energy gap (∼12![[thin space (1/6-em)]](https://www.rsc.org/images/entities/char_2009.gif) 000 cm−1) between the first excited state, 5D0, and the highest ground state of Eu3+ ions, 7FJ, makes phonon relaxation between them very improbable.49
000 cm−1) between the first excited state, 5D0, and the highest ground state of Eu3+ ions, 7FJ, makes phonon relaxation between them very improbable.49
The synthesized Gd4O3F6 sample was analysed precisely by the Rietveld refinement in the isotropic approach in order to obtain the structural information about this compound.
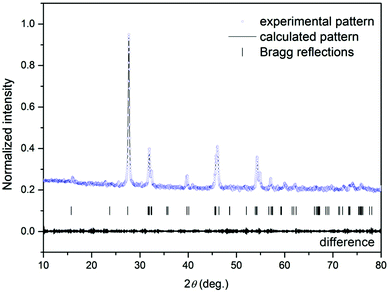
Table 1 shows the experimental and calculated results of the Rietveld analysis of gadolinium oxyfluoride. These results confirmed that the synthesized compound was monophasic. The crystal structure of Gd4O3F6 was determined to be monoclinic with the space group P12/c1.
| Sample | Gd4O3F6 |
| Space group | Monoclinic P12/c1 (13) |
| Formula units per cell | Z = 1 |
| Calculated cell parameters | a = 3.9498(8) Å |
| b = 11.2280(6) Å | |
| c = 5.5420(9) Å | |
| β = 134.56(3)° | |
| V = 175.12(517) Å3 | |
| R w | 3.29% |
| R wnb | 2.06% |
| R all | 2.26% |
| R nb | 2.72% |
| Selected contacts | |
|---|---|
| Gd–Gd | 3.9498(8) Å |
| Gd–O | 2.1445(1) Å |
| Gd–O/F | 2.1469(4) Å |
| Gd–F | 2.2718(3) Å |
| Gd–O–Gd | 133.813(10)° |
| Gd–F–Gd | 120.760(9)° |
| Atom | Wyckoff positions | x | y | z | B iso [Å2] |
|---|---|---|---|---|---|
| Gd1 | 2e | 0 | 0.115(x) | 0.25 | 0.135(5) |
| Gd2 | 2e | 0 | 0.615(x) | 0.25 | 0.141(6) |
| O1 | 2f | 0.5 | 0.960(x) | 0.75 | 1.021(4) |
| O2 | 2e | 0 | 0.836(x) | 0.25 | 1.023(2) |
| O3 | 2e | 0 | 0.306(x) | 0.25 | 1.024(1) |
| F1 | 2f | 0.5 | 0.960(x) | 0.75 | 1.025(5) |
| F2 | 2f | 0.5 | 0.285(x) | 0.75 | 1.021(4) |
| F3 | 2f | 0.5 | 0.462(x) | 0.75 | 1.022(3) |
| F4 | 2f | 0.5 | 0.789(x) | 0.75 | 1.021(1) |
The Rietveld analysis could be applied to any of the compounds prepared within the compositional domain and occurring in a stable, single phase. However, our aim was to find a structural model suitable for all the chemical compositions within the stable structural domain with pure phases.
The structure of the new Gd4O3F6 compound was refined from powder XRD data in a tetralanthanide trioxyfluoride structure model.29 The instrumental parameters used to describe the Rietveld profile were as follows: zero-point in 2θ, background parameters, three peak-shape parameters, U, V and W, in the formula H2 = U![[thin space (1/6-em)]](https://www.rsc.org/images/entities/char_2009.gif) tan2
tan2![[thin space (1/6-em)]](https://www.rsc.org/images/entities/char_2009.gif) θ + V
θ + V![[thin space (1/6-em)]](https://www.rsc.org/images/entities/char_2009.gif) tan
tan![[thin space (1/6-em)]](https://www.rsc.org/images/entities/char_2009.gif) θ + W to describe a pseudo-Voigt peak with full width at half maximum, H, which increases with θi. The structure parameters used were: a scale factor, the lattice constant, the positional coordinate and the occupancy factors (Table 1) of all atoms and the isotropic temperature factors.
θ + W to describe a pseudo-Voigt peak with full width at half maximum, H, which increases with θi. The structure parameters used were: a scale factor, the lattice constant, the positional coordinate and the occupancy factors (Table 1) of all atoms and the isotropic temperature factors.
Fig. 1 shows typical observed, calculated, and difference profiles for the synthesized Gd4O3F6. In all cases, the agreement between the observed and calculated Rietveld profiles is excellent and the final R factors are satisfactory. This model fits the observed intensity provided that the structural parameters from Table 1 are taken.
In this structure, the cation sites, Gd1 and Gd2, are coordinated by oxygen and fluorine ions with CN = 9, while the occupancy of the 2f site by F− and O2− is 0.4 and 0.5, respectively (Fig. 2). In the Gd4O3F6 structure, the ionic arrangement was supposed to be highly ordered with two kinds of ion clusters, GdO0.5F·O0.5 and GdF2·O0.5.29 The linkage of these clusters was estimated to be somewhat disordered. The disorder in the anion arrangement was caused by the disorder in the cation arrangement. Consequently, the occupancy of 2e sites by oxygen ions remained at 0.5, whereas 2f sites layered at the y = 0 plane were occupied partially by fluoride ions. Because the occupancy of 2f sites by fluorine ions and oxygen ions is less than 1.0, then oxygen and fluorine ion conductivity could be considered in this material.28,50
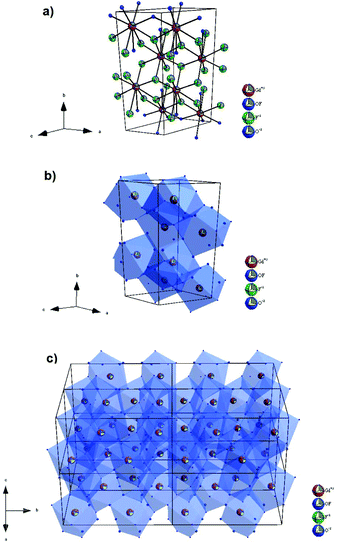 | ||
| Fig. 2 The structure of the monoclinic Gd4O3F6 phase with (a) unit cell and (b and c) the coordination environment of Gd3+ ions. | ||
The stoichiometric composition of rare earth oxyfluorides is strongly affected by the amount of fluorine ions in the sample. It is greatly important to maintain the required composition of the initial precursor for the synthesis of an appropriate material phase. The Pechini's method enables a full control of the F− amount because the initial concentration can be easily changed with the quantity of NH4F in the gel. In this way it is possible to obtain a rhombohedral as well as a pseudo-tetragonal form of gadolinium oxyfluoride.
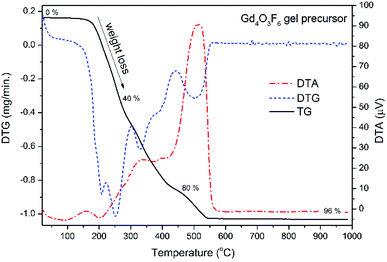
Thermo-gravimetric analysis of powders purified from the reaction mixture was performed in air in order to identify the processes occurring during the thermal treatment (see Fig. 3). The mass loss up to 550 °C was attributed to the decomposition of organic components. The Gd4O3F6 product is formed above 550 °C. The intense peak around 500 °C visible in the DTA curve is an effect of the exoenergetic decomposition of the organic resin and simultaneous crystallization of the Gd4O3F6 product. Temperature increase has a very small effect on the sample above 600 °C, considering the lack of any larger peaks at these temperatures. Finally, only about 4% of the gel precursor is transferred into the powder product.
The phase composition of the samples prepared at temperatures from the range 500–900 °C was calculated with the help of Rietveld refinement. Above 500 °C, a phase transition to the rhombohedral GdOF form was observed. At temperatures higher than 600 °C oxyfluorides decomposed into Gd2O3 oxide. From Fig. 3, the optimal temperature for annealing the precursor gel can be found. Heating the gel at 500 °C allows the formation of the product, and at the same time it is temperature sufficient for the decomposition of organic contaminants. The product obtained at 500 °C was used in further structural analysis including IR and Raman spectroscopy.
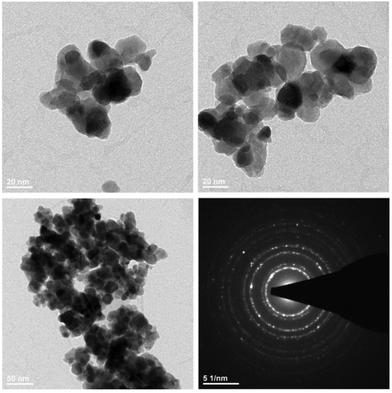
In order to investigate the morphology and structure of the final products, TEM and SAED characterization was carried out for the Gd4O3F6 sample heat treated at 500 °C (Fig. 4). TEM images showed the nanocrystalline structure of powders, whereas the average nanocrystal size taken from TEM was 26 ± 8 nm. The synthesis conditions and character of the used sol–gel method result in formation of agglomerates. However, the agglomeration of individual crystallites is relatively weak and there are no sintered and melted forms visible in the TEM image. Selected area diffraction (SEAD) shows the polycrystalline properties of the powders prepared.
The number of expected IR and Raman peaks can be found from the described crystal structure of Gd4O3F6. According to the factor group analysis, for the monoclinic Gd4O3F6, 6 IR and 6 Raman peaks should be observed in the measured spectra. There are 16 atoms in the unit cell and therefore 3N = 48 degrees of freedom which are divided into 12 modes (IR active modes are labelled as IR and Raman modes as R):
| Γopt = 2Ag(R) + 2Au(IR) + 4Bg(R) + 4Bu(IR) | (1) |
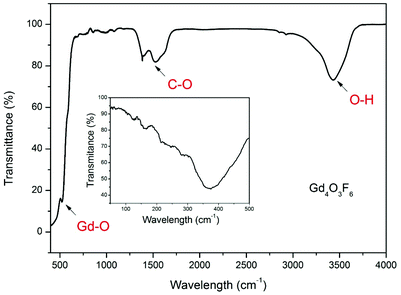
The FT-IR spectrum of the Gd4O3F6 sample is shown in Fig. 5. It demonstrates characteristic intense bands in the range of 3000–3750 cm−1 connected with the O–H stretching vibrations. The peaks near 1530 cm−1 and 1380 cm−1 can be assigned to the C–O absorption. These two bands could be connected with traces of organic impurities present in the sample or with absorption by CO2 and H2O adsorbed at the powder surface. The C–O and O–H groups with high energy vibrations may be present in the samples because the character of a sol–gel process involves the decomposition processes of organic compounds forming a gel. The absorption peak at 527 cm−1 is ascribed to the vibration of the Gd–O bond. The Gd4O3F6 compound shows also absorption in the range below 400 cm−1 (shown as inset in Fig. 5). The absorption in this range is observed as a broad peak with the minimum of transmittance at 367 cm−1. The broad shape of this absorption band can be attributed to the disordered arrangement of the ions in the crystal lattice of the Gd4O3F6 compound. There is also similarity in absorption bands in this range between the monoclinic and tetragonal or cubic REOF.51
The FT-IR spectra of the rhombohedral REOF are much more complex, demonstrating at least two absorption bands in this region.52 In the IR spectrum shown in the inset, the structure of absorption bands is complex due to the nanocrystalline character of the sample and a large number of IR peaks.
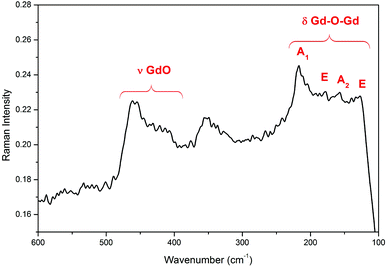
The Raman spectra of the Gd4O3F6 oxyfluoride are shown in Fig. 6. Six peaks at about 127, 218, 340, 360, 415 and 460 cm−1 can be observed. The lower energy peaks are connected with the movement of heavy Gd–Gd pairs (127 and 218 cm−1).53 The vibrations of the Gd–O group are visible as a peak at 460 cm−1.52
Fig. 7 shows the XRD patterns of the nanosized Gd4O3F6:Eu3+ crystals. The positions of all peaks are in good agreement with those in the pattern calculated for monoclinic Gd4O3F6 with the P2/c space group. The single-phase product with the absence of any additional peaks from extraneous admixtures was obtained in the whole range of Eu3+ doping concentrations.
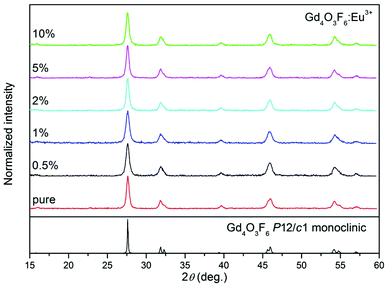 | ||
| Fig. 7 XRD patterns of Gd4O3F6:Eu3+ nanophosphors prepared by the sol–gel method and annealed at 500 °C for 2 h. | ||
The structure of gadolinium offers two equivalent cationic sites Gd(I) and Gd(II) for possible substitution with RE3+ ions. No preferential site substitution depending on the concentration of the dopant and annealing temperature has been observed. Besides, in comparison with the cell parameters for 0.5% mol Eu3+ ions doped Gd4O3F6 (a = 3.9421(7) Å, b = 11.2169(6) Å, c = 5.5564(9) Å and β = 134.97(4), V = 173.81(731)) the cell volume decreases insignificantly with the substitution of Gd3+ ions (ionic radius 1.107 Å in ninefold coordination) with the dopants (the ionic radius of Eu3+ is 1.12 Å).54
Luminescent properties
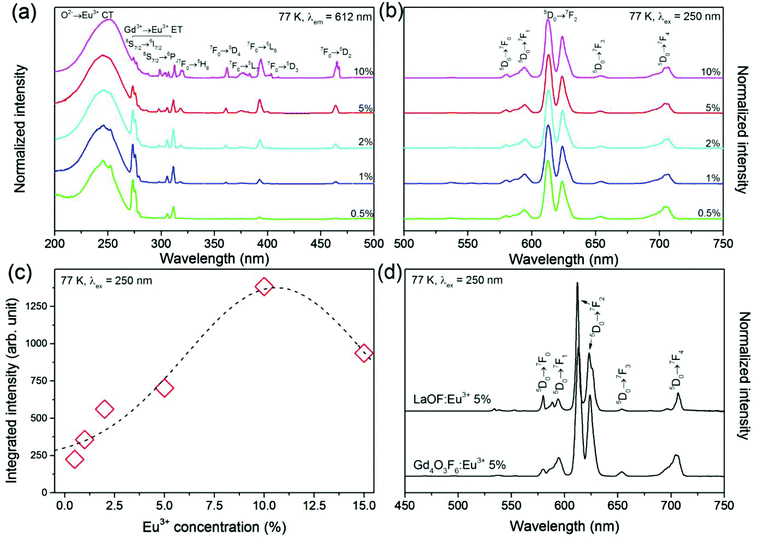
Fig. 8–10 illustrate the luminescent properties of Gd4O3F6:Eu3+ materials. Excitation spectra (Fig. 8a) in the range of 200–500 nm indicate the possibility of efficient excitation dopant emission in the O2−→Eu3+ charge transfer band (CT) with maximum at 250 nm. The presence of this band is a result of O2− ions in the structure.55 The energy of O2−→Eu3+ CT could be estimated using the following equation given by Jørgensen:56| ECT = [χ(L) − χ(M)](3 × 104) | (2) |
![[thin space (1/6-em)]](https://www.rsc.org/images/entities/char_2009.gif) 500 cm−1 (around 230 nm). The measured positions of CT bands in the excitation spectra of obtained samples were at around 250 nm. The red shift of the CT band resulted from the difference between bulk materials, for which eqn (2) was derived, and nano-sized phosphors.58–61
500 cm−1 (around 230 nm). The measured positions of CT bands in the excitation spectra of obtained samples were at around 250 nm. The red shift of the CT band resulted from the difference between bulk materials, for which eqn (2) was derived, and nano-sized phosphors.58–61
The remaining narrow excitation bands with maxima above 270 nm are related to the f–f transitions of Gd3+ and Eu3+ ions. Their narrow character is a consequence of the shielding properties of the higher energetic 5d and 6s electron sublevels present in Ln3+ ions. These properties influence the impact of the surrounding local environment and therefore f–f electronic transitions are relatively insensitive to the changes in ligands. These transitions are Laporte forbidden and due to that their intensities are low unlike that of the CT band, allowed by selection rules. The transition bands in the spectral range of 270–315 nm are connected with excitation of Gd3+ ions and confirm the energy transfer (ET) between Gd3+ and Eu3+ ions.40 The other peaks proved the direct excitation of Eu3+ ions. From the excitation spectra, Eu3+ ions at lower concentrations can be effectively excited not only in CT but also in ET bands. However, with increasing Eu3+ concentration, the ratio between CT and ET changes in favour of the former.
The emission spectra obtained under excitation by 250 nm UV light are presented in Fig. 8b. All emission bands are due to the transitions from the 5D0 excited level to the 7FJ components of the ground state. The most intense emission line observed at 612 nm is connected with one of the components of 5D0→7F2 transition. The sensitivity of transitions within the f-electron shell of RE3+ ions to crystal field is relatively low. However, some of the f–f transitions are prone to changes depending on the symmetry of the local environment. In the Eu3+ ion, the 5D0→7F2 transition is sensitive to the Eu3+ local symmetry and becomes partially allowed when Eu3+ ions occupy sites of low symmetry (without an inversion symmetry). Its hypersensitivity is often used to track the structural changes in the Eu3+ host and surrounding coordination.62 In the Gd4O3F6 host material, the Eu3+ ions are located in low symmetry sites, replacing Gd1 or Gd2 ions (both C2v) that causes a relatively high intensity of the 5D0→7F2 transition band.
The highest integral luminescence intensity was measured for the 10%-doped sample. The value between 5 and 10% is typical of Eu3+ doped materials, whereas for higher doping the concentration quenching of the 5D0 excited state occurs.49 This process can be attributed to the resonance energy transfer between neighbouring Eu3+ ions or by the transfer to the crystal defects and impurities. The energy resulting from the difference between 5D0 and 7FJ manifolds can be cooperatively transferred between three or four nearest Eu3+ ions.63 The mechanism of interaction between Eu3+ ions depends on the critical distance between them.64 The energy transfer between Eu3+ ions may occur via one of the following mechanisms: exchange interaction, radiation reabsorption and multipole–multipole interactions. The critical distance between the donor and the acceptor can be calculated using the equation proposed by Blasse.65 In the Gd4O3F6 host material, critical distance between Eu3+ ions was calculated to be 9.42 Å. For the distances greater than 5 Å, multipole–multipole interactions are dominant and are the major cause of concentration quenching.
The interactions between Eu3+ ions, observed in the oxyfluoride host previously,13 also affect the observed decays, which is discussed below. Phonon relaxation from the 5D0 excited state to the 7F6 level is impossible in most cases due to a large energy gap between these states. This is particularly true for Gd4O3F6 due the low phonon energy in this matrix, which is confirmed by Raman spectroscopy (see Fig. 6).
A comparison of the luminescence properties of tetragonal LaOF:Eu3+ and monoclinic Gd4O3F6:Eu3+, prepared in the same way, shows their similarity but also important differences (see Fig. 8d). In the first instance, the shapes and widths of emission bands show that the number of different Eu3+ sites is higher in Gd4O3F6:Eu3+. The 5D0→7F0 transition band is forbidden by the selection rules of f–f transitions, but it could be observed when Eu3+ ions occupy sites with Cs, Cn, or Cnv symmetry through the J–J0 mixing effect which is really achieved in both structures.66 In the LaOF:Eu3+ material, the intensity of the 5D0→7F0 line is higher which emphasizes the difference between these two materials. Also the shape of the 5D0→7F0 line in the luminescence spectra of Gd4O3F6:Eu3+ suggests that it is composed of at least two single peaks connected with two different sites of Eu3+ in the proposed crystal structure. The remaining emission lines in the luminescence spectrum of the Gd4O3F6:Eu3+ material are broadened and more complex due to the stronger splitting of degenerate 7FJ states in C2v symmetry than in C4v in LaOF:Eu3+,67 as the splitting is generally thinner in a site with lower symmetry.
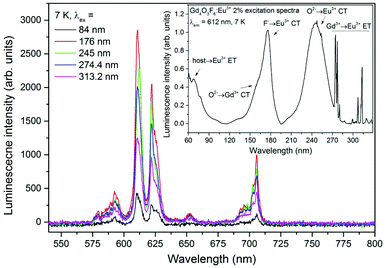
Emission spectra of the Gd4O3F6:Eu3+ 2% sample under excitation with different wavelengths selected from the UV-VUV range are presented in Fig. 9. The excitation spectrum measured for the 612 nm line in the UV-VUV range is presented in the inset as well. It clearly indicates that the emission of Eu3+ centres in the obtained material can be efficiently excited in the VUV range. The intensity of the Eu3+ emission is high under excitation in the fundamental absorption region below 100 nm (host–Eu3+ energy transfer), while wide and intense bands observed in the excitation spectra between 150 and 200 nm can be associated with F−→Eu3+ and O2−→Gd3+ CT. The spectral range in which the F−→Eu3+ CT band can be observed can be determined from eqn (2). For χ(F) = 3.9 and χ(Eu) = 1.75, the calculated CT position should be at 64![[thin space (1/6-em)]](https://www.rsc.org/images/entities/char_2009.gif) 500 cm−1 (around 155 nm).68 A similar position of the CT band (around 150 nm) was experimentally obtained by Ptacek et al. in the spectra of NaGdF4 nanocrystals doped with Eu3+ ions.69 The calculated, in the same way, position of O2−→Gd3+ CT should be around 145 nm (with the χ(Gd) = 0.91) and the F−→Gd3+ CT peak should be observed at around 89
500 cm−1 (around 155 nm).68 A similar position of the CT band (around 150 nm) was experimentally obtained by Ptacek et al. in the spectra of NaGdF4 nanocrystals doped with Eu3+ ions.69 The calculated, in the same way, position of O2−→Gd3+ CT should be around 145 nm (with the χ(Gd) = 0.91) and the F−→Gd3+ CT peak should be observed at around 89![[thin space (1/6-em)]](https://www.rsc.org/images/entities/char_2009.gif) 700 cm−1 (111 nm).70 The energy of CT between O2− and Gd3+ ions can be different depending on the host material. It was observed that O2−→Gd3+ CT has higher energy when occurred in fluorides and the maximum of the CT band can be found at 123 nm and 131 nm in YF3 and LaF3 matrices, respectively.71 In materials containing O2− ions, such as borates, aluminates and silicates, the maximum of the CT band can be found at lower energies than that predicted theoretically (155–184 nm).71,72 The energies of CT are generally dependent on the surrounding environment and can be different in various host materials. In our system, the F− →Eu3+ CT band is red-shifted with respect to the theoretical position. However, only the band with a maximum at 176 nm can be assigned to F− →Eu3+ CT because the expected intensity is higher than that of O2−→Gd3+ CT. In the emission of Eu3+ ions excited by the O2−→Gd3+ CT, the radiative relaxation of Eu3+ ions is preceded by the Gd3+→Eu3+ energy transfer that decreases the efficiency of the whole process. The remaining excitation bands in the range from 200 to 330 nm are connected with O2−→Eu3+ CT and Gd3+→Eu3+ energy transfer similarly to those shown in Fig. 8a and discussed above.
700 cm−1 (111 nm).70 The energy of CT between O2− and Gd3+ ions can be different depending on the host material. It was observed that O2−→Gd3+ CT has higher energy when occurred in fluorides and the maximum of the CT band can be found at 123 nm and 131 nm in YF3 and LaF3 matrices, respectively.71 In materials containing O2− ions, such as borates, aluminates and silicates, the maximum of the CT band can be found at lower energies than that predicted theoretically (155–184 nm).71,72 The energies of CT are generally dependent on the surrounding environment and can be different in various host materials. In our system, the F− →Eu3+ CT band is red-shifted with respect to the theoretical position. However, only the band with a maximum at 176 nm can be assigned to F− →Eu3+ CT because the expected intensity is higher than that of O2−→Gd3+ CT. In the emission of Eu3+ ions excited by the O2−→Gd3+ CT, the radiative relaxation of Eu3+ ions is preceded by the Gd3+→Eu3+ energy transfer that decreases the efficiency of the whole process. The remaining excitation bands in the range from 200 to 330 nm are connected with O2−→Eu3+ CT and Gd3+→Eu3+ energy transfer similarly to those shown in Fig. 8a and discussed above.
The highest intensity of the Eu3+ emission recorded upon excitation below 200 nm was recorded at 176 nm. The properties of efficient excitation below 200 nm make this compound a suitable phosphor for vacuum ultraviolet applications, such as plasma display panels and Hg-free fluorescent lamps.33,73
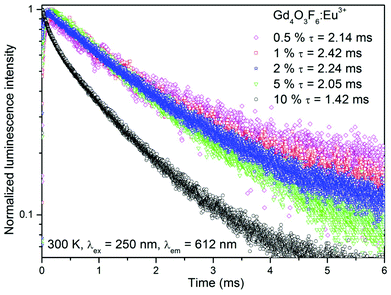
Luminescence decay curves recorded for Gd4O3F6:Eu3+ materials at room temperature are presented in Fig. 10. The decays are relatively fast for the Eu3+-doped materials; however, this is an advantage concerning their potential applications as red emitting phosphors. Average luminescence lifetimes were calculated by applying the following equation:74
 | (3) |
The longest luminescence lifetime was calculated for the 1%-doped sample. Higher concentrations of Eu3+ ions caused a decrease in lifetime, which resulted from the above-mentioned concentration quenching. All depicted curves show a short rise in their intensities after the laser pulse, especially visible for the samples with low Eu3+ concentration. This phenomenon is caused by interactions between Eu3+ ions, fully described elsewhere.13 In short, Eu3+ ions can exchange their energies after excitation in several ways. Energy transfer from the 5DJ (J > 0) manifold to another Eu3+ ion in the 7FJ ground state can occur, which affects the relaxation dynamics, or one of the excited Eu3+ ions transfers its entire energy to another excited Eu3+ ion in its 5D0 state, doubling its energy and therefore pumping the emitting, 5D0 state after nonradiative relaxation from higher excited states.
The emission spectra and luminescence decay curves measured at 300 K were used for the calculation of the Judd–Ofelt spectroscopic parameters by the method described earlier.75–77 According to the Judd–Ofelt theory, intensity parameters contain contributions from the forced electric dipole and dynamic coupling mechanisms and provide information about the surrounding environment of Eu3+ ions.76–79 The calculated Ω2 and Ω4 parameters are sensitive to the character of Eu3+ local environment. The changes in the Ω2 parameter bring information on the covalency of the Eu3+ ion environment. Its value is high for all samples studied, which confirms highly polarized surrounding of Eu3+ ions. This parameter is also connected with the average site symmetry and is high for the sites with low symmetry. The value of Ω2 slightly increases with the growing amount of Eu3+ ions in the matrix. This could be a result of distortions appearing at the Eu3+ site. The value of Ω4 parameter could be gained by lowering the covalence of the chemical bond between the Eu3+ ion and O2− ligand ions.80 The electron density decreasing on ligands results in an increase in Ω4.
The calculated luminescence quantum efficiencies were high for the samples with Eu3+ concentration up to 5%, which confirms the effectiveness of the prepared materials as phosphors and good properties of Gd4O3F6 as a host material. The decreased efficiency in the 10%-doped sample was a result of the earlier mentioned cross-relaxation between Eu3+ ions. According to Fig. 8c, the highest quantum efficiency should be expected for the 10%-doped sample, for which the most intense luminescence was observed. However, the method used for the calculations, includes also nonradiative processes, being inversely proportional to the luminescence lifetimes. Hence, from the calculated total decay rates (see Table 2) we can estimate that the absorption of light is the highest for the 10%-doped sample; however, there are some quenching processes (like concentration quenching) which are reflected in high nonradiative rates and therefore low quantum efficiency.
| Eu (%) | A rad (s−1) | A nrad (s−1) | A tot (s−1) | Ω 2 (10−20 cm2) | Ω 4 (10−20 cm2) | η (%) |
|---|---|---|---|---|---|---|
| 0.5 | 553 | 56 | 609 | 43.7 | 17.8 | 91 |
| 1 | 496 | 84 | 580 | 41.0 | 11.1 | 85 |
| 2 | 524 | 77 | 600 | 42.8 | 13.5 | 87 |
| 5 | 573 | 5 | 577 | 45.2 | 19.2 | 99 |
| 10 | 582 | 222 | 804 | 48.2 | 14.8 | 72 |
Conclusions
Gadolinium oxyfluoride Gd4O3F6 with a new monoclinic crystal structure was successfully prepared by a modified Pechini's method. The prepared materials crystallized as the monoclinic phase in the P12/c1 (13) space group. In this crystal structure two types of clusters GdO0.5F·O0.5 and GdF2·O0.5 are located. Thermo-gravimetric analysis (TGA) was used to observe the transformation from an amorphous polymeric precursor to a crystalline powder, which provided information about optimal annealing conditions. X-ray diffraction (XRD) analysis, IR spectroscopy and Raman spectrum confirmed the monoclinic structure of the nanopowders obtained at 500 °C. Crystal structure parameters were determined with the help of the Rietveld analysis and compared with the reference data. The transmission electron microscopy and EDX spectrum proved the formation of gadolinium oxyfluoride with the average grain size of 30 nm.The nanophosphors were effectively excited by the radiation from the vacuum ultraviolet range with the wavelength of λex = 176 nm and by the UV light, with the wavelength of λex = 250 nm. For the efficient excitation by VUV light, the F−→Eu3+ and O2−→Gd3+ CT processes are suggested to be responsible. The excitation band related to the O2−→Eu3+ CT allows the excitation in the UV range. The materials doped with Eu3+ ions showed intense red luminescence. The recorded emission spectra were used for calculation of the Judd–Ofelt intensity parameters indicating highly polarized local environment and low symmetry of sites occupied by Eu3+ ions. The most effective dopant concentration was estimated to be 10%. Although the decay times of the emission of Eu3+ ions were relatively short, ranging from 1.42 to 2.42 ms, the calculated luminescence quantum yields were high which makes the prepared materials interesting phosphors sensitive to the VUV and UV excitation.
Acknowledgements
Funding for this research was provided by the National Science Centre (grant no. DEC-2011/03/D/ST5/05701). T.G. holds a scholarship from the Foundation for Polish Science for Young Scientists (FNP).This work was supported in part by the European Community Research Infrastructure Action under the FP6 Structuring the European Research Area Programme (through the Integrated Infrastructure Initiative Integrating Activity on Synchrotron and Free Electron Laser Science) and by the Estonian Research Council—Institutional Research Funding IUT02-26.
Notes and references
- P. Berdowski, M. J. J. Lammers and G. Blasse, Chem. Phys. Lett., 1985, 113, 387–390 CrossRef CAS.
- J. Holsa, Acta Chem. Scand., 1991, 45, 583–587 CrossRef CAS.
- J. Hölsä and E. Kestilä, J. Alloys Compd., 1995, 225, 89–94 CrossRef.
- J. Hölsä, E. Kestilä, P. Ylha, E. Antic-Fidancev, M. Lemaitre-Blaise, P. Porcher, P. Deren and W. Strek, J. Appl. Spectrosc., 1995, 62, 697–705 CrossRef.
- S. Fujihara, T. Kato and T. Kimura, J. Mater. Sci. Lett., 2001, 20, 687–689 CrossRef CAS.
- J. Kyu Park, C.-H. Han, C. Hae Kim, H. D. Park and S. Y. Choi, J. Mater. Sci. Lett., 2003, 22, 477–478 CrossRef.
- E. Antic-Fidancev, J. Hölsä, J.-C. Krupa and M. Lastusaari, J. Alloys Compd., 2004, 380, 303–309 CrossRef CAS.
- D. Gao, H. Zheng, X. Zhang, Z. Fu, Z. Zhang, Y. Tian and M. Cui, Appl. Phys. Lett., 2011, 98, 011907 CrossRef.
- X. Zhang, D. Gao and L. Li, J. Appl. Phys., 2010, 107, 123528 CrossRef.
- E. He, H. Zheng, Z. Zhang, X. Zhang, L. Xu, Z. Fu and Y. Lei, J. Nanosci. Nanotechnol., 2010, 10, 1908–1912 CrossRef CAS PubMed.
- T. Passuello, F. Piccinelli, M. Pedroni, M. Bettinelli, F. Mangiarini, R. Naccache, F. Vetrone, J. A. Capobianco and A. Speghini, Opt. Mater., 2011, 33, 643–646 CrossRef CAS.
- T. Passuello, F. Piccinelli, M. Pedroni, S. Polizzi, F. Mangiarini, F. Vetrone, M. Bettinelli and A. Speghini, Opt. Mater., 2011, 33, 1500–1505 CrossRef CAS.
- T. Grzyb and S. Lis, Inorg. Chem., 2011, 50, 8112–8120 CrossRef CAS PubMed.
- M. Shang, G. Li, X. Kang, D. Yang, D. Geng, C. Peng, Z. Cheng, H. Lian and J. Lin, Dalton Trans., 2012, 41, 5571–5580 RSC.
- T. Grzyb, M. Węcławiak and S. Lis, J. Alloys Compd., 2012, 539, 82–89 CrossRef CAS.
- W. H. Zachariasen, Acta Crystallogr., 1951, 4, 231–236 CrossRef CAS.
- D. B. Shinn and H. A. Eick, Inorg. Chem., 1969, 8, 232–235 CrossRef CAS.
- A. Popov and G. Knudson, J. Am. Chem. Soc., 1954, 76, 3921–3922 CrossRef CAS.
- N. Baenziger, J. Holden, G. Knudson and A. Popov, J. Am. Chem. Soc., 1954, 76, 4734–4735 CrossRef CAS.
- J. Müller and T. Petzel, J. Alloys Compd., 1995, 224, 18–21 CrossRef.
- J. W. Fergus, J. Mater. Sci. Lett., 1997, 16, 267–269 CrossRef CAS.
- A. W. Mann and D. J. M. Bevan, J. Solid State Chem., 1972, 5, 410–418 CrossRef CAS.
- J. Müller, Thermochim. Acta, 1997, 298, 109–114 CrossRef.
- S. Schmid, Acta Crystallogr., Sect. B: Struct. Sci., 1998, 54, 391–398 CrossRef.
- A. de Kozak, M. Samouël and A. Chretien, Rev. Chim. Miner., 1975, 10, 259 Search PubMed.
- M. Takashima, S. Yonezawa, K. Horita, K. Ohwaki and H. Takahashi, J. Mater. Chem., 1996, 6, 795 RSC.
- M. Takashima, S. Yonezawa, J. H. Kim and S. Nishibu, J. Ind. Eng. Chem., 2004, 10, 1230–1241 CAS.
- M. Takashima, S. Yonezawaa and M. Leblanc, Solid State Ionics, 2002, 154–155, 547–553 CrossRef CAS.
- M. Takashima, S. Yonezawa, T. Tanioka, Y. Nakajima and M. Leblanc, Solid State Sci., 2000, 2, 71–76 CrossRef CAS.
- M. Takashima, S. Yonezawa and Y. Ukuma, J. Fluorine Chem., 1998, 87, 229–234 CrossRef CAS.
- M. Takashima and G. Kano, Solid State Ionics, 1987, 23, 99–106 CrossRef CAS.
- J.-C. G. Bünzli and C. Piguet, Chem. Soc. Rev., 2005, 34, 1048–1077 RSC.
- Q. Y. Zhang and X. Y. Huang, Prog. Mater. Sci., 2010, 55, 353–427 CrossRef CAS.
- K. Binnemans, Chem. Rev., 2009, 109, 4283–4374 CrossRef CAS PubMed.
- J.-C. G. Bünzli, Acc. Chem. Res., 2006, 39, 53–61 CrossRef PubMed.
- T. Grzyb, M. Runowski, A. Szczeszak and S. Lis, J. Solid State Chem., 2013, 200, 76–83 CrossRef CAS.
- A. Szczeszak, T. Grzyb, B. Barszcz, V. Nagirnyi, A. Kotlov and S. Lis, Inorg. Chem., 2013, 52, 4934–4940 CrossRef CAS PubMed.
- S. Okamoto, R. Uchino, K. Kobayashi and H. Yamamoto, J. Appl. Phys., 2009, 106, 013522 CrossRef.
- J. Krupa and M. Queffelec, J. Alloys Compd., 1997, 250, 287–292 CrossRef CAS.
- R. T. Wegh, H. Donker, K. D. Oskam and A. Meijerink, Science, 1999, 283, 663–666 CrossRef CAS PubMed.
- J. Dexpert-Ghys, R. Mauricot, B. Caillier, P. Guillot, T. Beaudette, G. Jia, P. A. Tanner and B.-M. Cheng, J. Phys. Chem. C, 2010, 114, 6681–6689 CAS.
- S. Dutta, S. Som and S. K. Sharma, Dalton Trans., 2013, 42, 9654 RSC.
- A. K. Ambast, J. Goutam, S. Som and S. K. Sharma, Spectrochim. Acta, Part A, 2014, 122, 93–99 CrossRef CAS PubMed.
- C. C. Lin and R.-S. Liu, J. Phys. Chem. Lett., 2011, 2, 1268–1277 CrossRef CAS PubMed.
- M. Pechini, US Pat., US3330697A, 1967 Search PubMed.
- H. M. Rietveld, J. Appl. Crystallogr., 1969, 2, 65–71 CrossRef CAS.
- L. Lutterotti and M. Bortolotti, Compcomm. Newslett., 2003, 1, 43–50 Search PubMed.
- G. Zimmerer, Radiat. Meas., 2007, 42, 859–864 CrossRef CAS.
- M. Weber, Phys. Rev., 1968, 171, 283–291 CrossRef CAS.
- K. T. Jacob, V. S. Saji and Y. Waseda, Int. J. Appl. Ceram. Technol., 2006, 3, 312–321 CrossRef CAS.
- G. N. Kustova, K. F. Obzherina and L. R. Batsanova, J. Appl. Spectrosc., 1968, 9, 947–950 CrossRef.
- J. Hölsä, E. Säilynoja, H. Rahiala and J. Valkonen, Polyhedron, 1997, 16, 3421–3427 CrossRef.
- J. Hölsä, Spectrochim. Acta, Part A, 1993, 49, 465–470 CrossRef.
- R. D. Shannon, Acta Crystallogr., Sect. A: Cryst. Phys., Diffr., Theor. Gen. Cryst., 1976, 32, 751–767 CrossRef.
- P. Dorenbos, J. Phys.: Condens. Matter, 2003, 15, 8417–8434 CrossRef CAS.
- C. K. Jørgensen, Electron Transfer Spectra, John Wiley & Sons, Inc., 1970 Search PubMed.
- C. Liu, J. Liu and K. Dou, J. Phys. Chem. B, 2006, 110, 20277–20281 CrossRef CAS PubMed.
- J. C. Boyer, F. Vetrone, J. A. Capobianco, A. Speghini and M. Bettinelli, J. Phys. Chem. B, 2004, 108, 20137–20143 CrossRef CAS.
- Z. Fu, S. Zhou, T. Pan and S. Zhang, J. Lumin., 2007, 124, 213–216 CrossRef CAS.
- G. Hodes, Adv. Mater., 2007, 19, 639–655 CrossRef CAS.
- L. Liu, E. Ma, R. Li, G. Liu and X. Chen, Nanotechnology, 2007, 18, 015403 CrossRef.
- K. Binnemans and C. Görller-Walrand, J. Rare Earths, 1996, 14, 173–180 Search PubMed.
- D. B. Pi, F. Wang, X. P. Fan, M. Q. Wang and Y. Zhang, Spectrochim. Acta, Part A, 2005, 61, 2455–2459 CrossRef PubMed.
- S. Som and S. K. Sharma, J. Phys. D: Appl. Phys., 2012, 45, 415102 CrossRef.
- G. Blasse, Phys. Lett. A, 1968, 28, 444–445 CrossRef CAS.
- F. Fong, L. Vredevoe and R. De Wames, Phys. Rev., 1968, 170, 412–417 CrossRef CAS.
- S. Cotton, Lanthanide and Actinide Chemistry, 2nd edn, 2006 Search PubMed.
- G. Blasse, J. Phys. Chem. Solids, 1989, 50, 99 CrossRef CAS.
- P. Ptacek, H. Schäfer, O. Zerzouf, K. Kömpe and M. Haase, Cryst. Growth Des., 2010, 10, 2434–2438 CAS.
- F. Zhang, Y. Wang and Y. Tao, Phys. Procedia, 2012, 29, 55–61 CrossRef CAS.
- Y. H. Wang, T. Endo, X. Guo, Y. Murakami and M. Ushirozawa, J. Soc. Inf. Disp., 2004, 12, 495 CrossRef CAS.
- Y. Wang, X. Guo, T. Endo, Y. Murakami and M. Ushirozawa, J. Solid State Chem., 2004, 177, 2242–2248 CrossRef CAS.
- C. H. Kim, I. E. Kwon, C. H. Park, Y. J. Hwang, H. S. Bae, B. Y. Yu and C. H. Pyun, J. Alloys Compd., 2000, 311, 33–39 CrossRef CAS.
- J. R. Lakowicz, Principles of Fluorescence Spectroscopy, Springer, Baltimore, 3rd edn, 2006 Search PubMed.
- C. Kodaira, J. Lumin., 2003, 101, 11–21 CrossRef CAS.
- G. S. Ofelt, J. Chem. Phys., 1962, 37, 511 CrossRef CAS.
- B. Judd, Phys. Rev., 1962, 127, 750–761 CrossRef CAS.
- C. K. Jørgensen and R. Reisfeld, J. Less-Common Met., 1983, 93, 107–112 CrossRef.
- B. M. Walsh, Adv. Spectrosc. Lasers Sens., 2006, 403–433 CAS.
- S. Tanabe, T. Hanada, T. Ohyagi and N. Soga, Phys. Rev. B: Condens. Matter, 1993, 48, 10591–10594 CrossRef CAS.
Footnote |
| † Electronic supplementary information (ESI) available. See DOI: 10.1039/c4dt00338a |
| This journal is © The Royal Society of Chemistry 2014 |

