 Open Access Article
Application of quasi-equilibrated thermodesorption of linear and di-branched paraffin molecules for detailed porosity characterization of the mono-layered zeolite MCM-56, in comparison with MCM-22 and ZSM-5†
Wacław
Makowski
*a,
Kinga
Mlekodaj
a,
Barbara
Gil
a,
Wiesław J.
Roth
ab,
Bartosz
Marszałek
a,
Martin
Kubu
b,
Pavol
Hudec
c,
Agáta
Smiešková
c and
Michal
Horňáček
c
aFaculty of Chemistry, Jagiellonian University, Ingardena 3, 30-060 Kraków, Poland. E-mail: makowski@chemia.uj.edu.pl; Fax: +4812 634 0515; Tel: +4812 663 2245
bJ. Heyrovský Institute of Physical Chemistry, Academy of Sciences of the Czech Republic, v.v.i., Dolejškova 3, 182 23 Prague, Czech Republic
cFaculty of Chemical and Food Technology, Slovak University of Technology, Radlinského 9, 812 37 Bratislava, Slovak Republic
First published on 19th March 2014
Abstract
The pore characteristics of zeolite samples including two kinds of ZSM-5 crystals as a base case and the unique mono-layered MCM-56 in different structural forms have been studied by the new method QE-TPDA (quasi-equilibrated temperature-programmed desorption and adsorption) in comparison with the standard nitrogen adsorption. Both approaches produce consistent results in terms of micro- and meso-porous features as well as quantitative pore volume values. The benefits of QE-TPDA include fast data acquisition (hours) and small sample size (milligrams). It is very flexible in using various hydrocarbons as probe molecules, which may reveal additional details associated with pores, their internal environment and dimensions/shape of the sorbate molecules. Hence, QE-TPDA is a valuable complementary tool for porosity characterization of the ever increasing diversity of porous materials and their pore structures. This was demonstrated by the results for the desorption of nonane and 2,2-dimethyloctane (DMO). The latter showed an additional maximum in the intermediate temperature range (between ‘micro-’ and ‘mesopore’ regions) which could be attributed to adsorption in the subsurface micropores (i.e. the pore mouths) where DMO could be partially adsorbed with t-butyl groups remaining on the outside. This was also reflected in the discrepancy between apparent volumes of micro- and mesopores calculated from the nonane and DMO experiments. Pillared MCM-56 revealed visibly enhanced subsurface micropore adsorption compared to the parent (mono-layer MWW) and MCM-22 (multi-layered MWW) consistent with the expected increase in the content of external 12 ring surface cups.
1. Introduction
The usefulness and value of zeolites in catalysis and adsorption1 is governed by their pore structure and related properties, collectively called porosity, as one of the primary characteristics.2 The need and necessity of the qualitative and quantitative evaluation of the zeolite porosity is addressed by application of adsorption methods,3 especially for gases such as nitrogen and argon at near boiling temperature. The discovery of ordered mesoporous materials4–6 and expansion of metal organic frameworks7–9 demonstrated that a continuous progress in the development and better fundamental understanding of adsorption phenomena as the basis for evaluation of porosity are constantly desired. Zeolites themselves have expanded beyond their classical concept of rigid, well defined 3D frameworks10 by the emergence of hierarchical zeolite materials11,12 and discovery of various layered forms.13–15 This presents not only new challenges but also opportunities that cannot be addressed by the standard methods of pore characterization alone and requires both complementary and new approaches. One of the earliest examples is provided by the first synthesis of the pillared zeolite, MCM-36,16,17 where the issue was to differentiate it from the base zeolite, MCM-22, and the possible admixture with MCM-41.18 This was resolved by the combination of several characterization methods and notably included two types of pore characterization: the standard N2 adsorption and dynamic sorption of hydrocarbons. The latter provided the key evidence that ruled out mesophase (e.g. MCM-41) contamination and proved the genuinely pillared zeolite MCM-36.12This contribution demonstrates unique capabilities of the quasi equilibrated temperature programmed desorption and adsorption (QE-TPDA) of volatile hydrocarbons as the novel experimental method19 developed for studying the porosity of micro- and mesoporous materials. It is shown to complement the standard gas adsorption methods by providing basically equivalent results based on alternative physical variables, while offering the possibility for new insights, where applicable. It has been successfully applied and proved of value in studies on zeolites,20–22 mesoporous silicas,22–25 their carbon replicas25 and metal–organic frameworks (MOFs) with examples of unique insights and indications of special opportunities.
QE-TPDA measures the amount of sorbate desorbed or adsorbed by a sample as a function of temperature which is changing cyclically. A QE-TPDA profile represents the average of several cycles and consists of desorption maxima observed during heating, and adsorption minima observed while cooling the sample. For zeolites, desorption of C6–C9n-alkanes from the micropores is observed at temperatures 25–400 °C, depending on their molecular mass. Zeolite QE-TPDA profiles depend on both the framework type20 and the extra-framework cations,26 reflecting the internal pore environment. QE-TPDA of n-alkanes allows determination of the micropore volume as well as the enthalpy and entropy of adsorption, showing good agreement with the literature data obtained using other techniques.20 From the latter parameters the average micropore size may be estimated with good accuracy.27 The measurements are carried out in a flow system equipped with a chromatographic thermal conductivity detector (TCD), using He with a small admixture of the adsorptive as a carrier gas. Compared to standard sorption determination like N2 isotherms QE-TPDA has the benefit of speed and small sample size while providing comparable estimate values and additional features capable of revealing new structural details when they are present. As an example the QE-TPDA profiles of n-nonane (used at the saturation partial pressure) show additional low temperature maxima below 100 °C, resulting from desorption of the molecules filling the mesopores.21–23 Mesopore size distributions calculated from such profiles according to a modified BJH method show very good agreement with those obtained from N2 desorption isotherms.23 The mesopore surface area and zero-coverage adsorption heat, characterizing the strongest surface adsorption sites, may be obtained by analysis of the high temperature parts of the QE-TPDA profiles.28
The main benefit of the QE-TPDA method is the potentially wide choice of probe molecules differing in size and/or shape. The aim of this work was extending the range of probe molecules used in the QE-TPDA measurements and their application to study layered zeolite materials exemplified by MCM-56. 2,2-Dimethyloctane (DMO) was selected judiciously due to its unique molecular shape, possessing both linear n-hexyl and bulky t-butyl groups. We suspected that such molecules may interact specifically with the micropores exposed to the surface forming a distinct adsorbed species. The possibility of employing QE-TPDA of DMO for characterization of zeolites was tested herein using two kinds of ZSM-5 with considerably different crystal size as the standard base case. Then this approach was applied for detailed porosity characterization of unilamellar zeolite MCM-56 (one unit cell thick monolayers of MWW) in different structural forms, i.e. the parent sample from hydrothermal synthesis and pillared by post-synthesis treatments.29
2. Experimental
ZSM-5 zeolites (Si/Al = 22) were provided by the Research Institute of Petroleum and Hydrocarbon Gases, Bratislava. The syntheses were carried out at 150 °C for 48 h, using either ethanol (EtOH) or tetrapropylammonium bromide (TPAB) as organic additives, hydrogel of silicic acid and sodium aluminate in the presence of NaOH. The as-synthesized Na-ZSM-5 samples were calcined and ion exchanged by repeated treatments with a NH4NO3 or HNO3 solution. The content of sodium in all ion-exchanged zeolites decreased to below 0.02 wt%.The MWW zeolites MCM-56 and MCM-22 were synthesized as described previously with hexamethyleneimine as the structure directing agent and with Si/Al of the gel as 12/1 and 15/1, respectively. Other pertinent parameters and details are provided in the accompanying publication (B. Gil et al.),30 which also describes the pillaring and delamination procedures together with characterization approaches. In short, as synthesized MCM-56 was contacted to swell with the surfactant CTAOH/CTACl (cetyltrimethylammonium) mixtures of the same overall concentration, varying in the proportion of the hydroxide form (denoted as PIL 1/4, 2/4 and 4/4, respectively). The isolated swollen samples were pillared by treatment with an excess of TEOS (tetraethylorthosilicate) and subsequent hydrolysis followed by calcination to generate permanent props (pillars) between the layers.
The morphology of the ZSM-5 preparations was studied by means of scanning electron microscopy using a Jeol JXA-840A instrument. Their powder X-ray diffraction patterns were recorded with a Stoe Stadi P instrument, using Cu Kα radiation.
The standard porosity and sorption properties of the studied zeolites were characterized by physical adsorption of nitrogen at 77 K using a Micromeritics ASAP 2400 (ZSM-5) or ASAP 2020 (MCM-56).
QE-TPDA measurements of hexane, nonane and 2,2-dimethyloctane were performed with the use of the thermodesorption apparatus equipped with a thermal conductivity detector (Micro Volume TCD, Valco). The description with more details was published earlier.19–22 Prior to the QE-TPDA experiment a sample (ca. 6–10 mg) was activated by heating in He flow (10 °C min−1 to 500 °C). The initial adsorption was carried out at room temperature by replacing pure helium used as the carrier gas with helium containing a small admixture of a hydrocarbon (ca. 0.4 vol%). After adsorption was completed, the QE-TPDA experiment was performed by cyclic heating and cooling the sample (10 or 2 °C min−1 to 400 °C) in He/hydrocarbon flow (6.5 cm3 min−1). The desorption–adsorption cycles were separated by 1 h isothermal segments at room temperature. The micro- and mesopore volume calculations were carried out by integration of the experimental desorption maxima and adjustment based on the calibration data. The density of the adsorptives was assumed to be equal to that of the liquids (0.659, 0.718 and 0.734 g cm−3 for hexane, nonane and DMO, respectively). High purity hydrocarbons delivered by Sigma-Aldrich (hexane and nonane) and Apollo Scientific (2,2-dimethyloctane) were used without additional purification.
Unless otherwise indicated, all of the observed QE-TPDA profiles were completely reversible, i.e. they were identical in several consecutive desorption–adsorption cycles. The profiles shown below were calculated by averaging of at least three consecutive profiles. Only the first QE-TPDA profiles of DMO were different, apparently due to the limited diffusion rate during the initial room temperature adsorption.
3. Results and discussion
3.1. Basic characterization of ZSM-5 samples
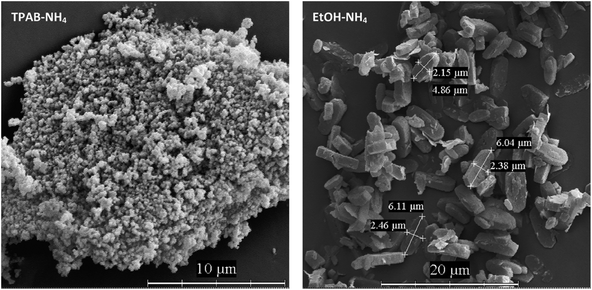
SEM images of the studied ZSM-5 zeolites (Fig. 1) show large differences in their morphology. The TPAB-templated zeolite consists of very small particles of ca. 300 nm in diameter, while the other zeolite, synthesized using ethanol, comprises relatively large crystals (ca. 2 × 6 μm). However, in addition to these large crystals there are also some smaller ones visible.Low temperature N2 adsorption isotherms (Fig. 2) reflect the observed different morphologies of the studied ZSM-5 zeolites. The isotherm for ZSM-5-EtOH with a sharp step in the low pressure range followed by an almost horizontal plateau is an example of type I isotherm, characteristic of microporous solids with a negligible external surface. The narrow hysteresis loop noticeable in this isotherm (with closing at p/po = 0.5) confirms limited interparticle mesoporosity related to the presence of the smaller crystals. On the other hand, the considerable slope of the middle part of the isotherm observed for ZSM-5-TPAB indicates much higher external surface, which is expected for sub-micron zeolite crystals.
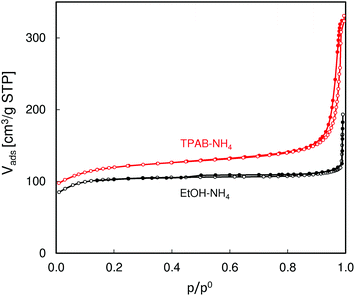 | ||
| Fig. 2 N2 adsorption and desorption isotherms (empty and filled symbols, respectively) of the studied ZSM-5 zeolites. | ||
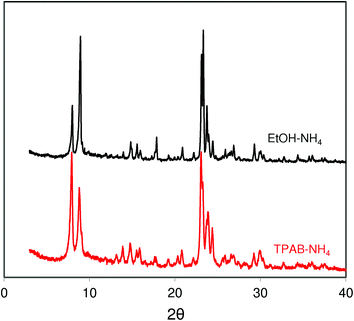
XRD patterns of the studied ZSM-5 (Fig. 3) zeolites are consistent with the SEM images and N2 adsorption data. They are in very good agreement with the patterns expected for a perfect MFI structure. The wider peaks observed for ZSM-5-EtOH corroborate with its smaller crystal size.
3.2. ZSM-5 characterization by QE-TPDA
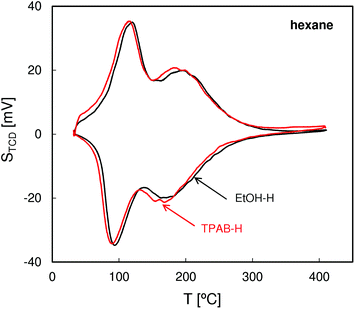
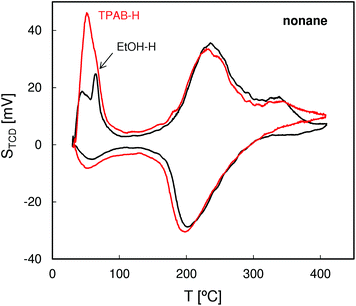
The QE-TPDA profiles of hexane (Fig. 4), with two desorption maxima and two adsorption minima, are typical of MFI structures. The two step adsorption pattern reflects the fact that the conventional high-temperature adsorption in the micropores is followed by another low-temperature step attributed to the “commensurate freezing” effect,31i.e. an order–disorder transition in the adsorbed phase. The profiles observed for both zeolites are practically identical, confirming the presence of undistorted MFI pore structures and frameworks.The QE-TPDA profiles of nonane (Fig. 5), obtained using He saturated with the hydrocarbon vapor as a carrier gas, consist of two groups of peaks. The low temperature asymmetric adsorption–desorption pair results from nonane molecules present on the external surface of the crystallites and/or in the interparticle mesopores. The high temperature peaks correspond to desorption from micropores and are qualitatively and quantitatively similar for both ZSM-5 types. In contrast, major differences are evident in the low temperature (‘mesoporous’) range. Higher intensity of the low temperature maximum found for ZSM-5-TPAB is clearly related to its higher external surface.
The first low temperature desorption peak observed for the low surface area ZSM-5-EtOH results most probably from the commensurate freezing effect. It has been found earlier that the low temperature desorption step, corresponding to ordering of n-alkane molecules adsorbed in the micropores, is shifted to lower temperatures with the increasing length of the molecules.20 The additional feature observed for ZSM-5-EtOH, a sharp low temperature peak observed at 65 °C, is typical of well crystallized zeolites and could be attributed to interconnected, partially constricted interparticle mesopores. Such pores may be formed between the external faces of well defined crystals being in close contact. This feature corresponds to closing of the narrow hysteresis loop present at p/po = 0.5 in the N2 sorption isotherm for ZSM-5-EtOH.
QE-TPDA profiles of DMO (Fig. 6) that were also recorded using a He stream saturated with the hydrocarbon vapor have the same feature as those observed for nonane but with additional intermediate temperature (IT) desorption peaks appearing at ca. 110 °C. We postulate that these peaks result from desorption of DMO molecules at the pore-mouth of the 10 ring channels with the n-hexyl chains located inside the pores and t-butyl groups protruding outside. For the molecules adsorbed in such a way the interactions with the micropore walls should be much weaker than for the molecules wholly encapsulated in the micropores, with their tertiary carbon atom occupying intersections of the straight and zigzag channels. Consequently, the molecules that are only partially adsorbed in the subsurface micropores are released at much lower desorption temperatures than those adsorbed inside the micropores. The fact that the high temperature peaks for DMO are shifted to higher temperatures in comparison with the corresponding peaks of nonane most probably results from the higher volume of the former molecules, producing a greater overall interaction with the internal surface of the micropores.
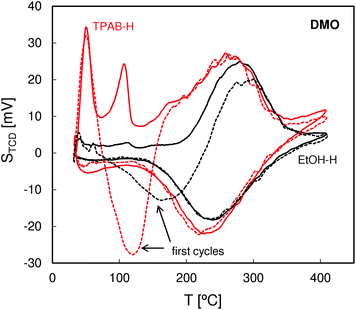 | ||
| Fig. 6 QE-TPDA profiles of 2,2-dimethyloctane measured for the studied ZSM-5 zeolites at 10 °C min−1. | ||
The DMO QE-TPDA results are consistent with the differences in the morphology of the studied zeolites indicated by the SEM and N2 adsorption data. For the ZSM-5-EtOH zeolite consisting of large crystals the intermediate temperature peak (IT) is hardly visible, indicating very low proportion of the subsurface micropores (pore-mouth openings) in the bulk ones. On the other hand, the intensive intermediate temperature desorption peak observed for the nanocrystalline ZSM-5-TPAB confirms a greater share of the subsurface micropores expected for the high external surface area zeolite. The fact that for ZSM-5-EtOH the high temperature peaks have a slightly smaller height may indicate that not all the micropores within the large crystals are accessible to bulky DMO molecules.
It should be noted that the QE-TPDA profiles of DMO observed in the first desorption and adsorption cycle (represented by dashed lines) differ considerably from the following ones. The minimum observed between 100 and 200 °C indicates that despite stabilization of the detector signal, the adsorption at room temperature was incomplete and the initial heating of the sample results in adsorption, not desorption. After the first temperature-programmed adsorption during cooling all the accessible pores are completely filled, hence the following desorption–adsorption cycles are reversible and the corresponding QE-TPDA profiles are identical. Similar effects were observed in IR studies on the accessibility of acid centers in zeolites employing pivalonitrile as a probe molecule.32–34
All QE-TPDA profiles recorded in the consecutive desorption–adsorption cycles were practically the same (with the exception of the first cycles in thermodesorption of DMO). This reproducibility is demonstrated in additional figures (ESI, Fig. 1 and 2†) showing the QE-TPDA profiles of nonane and DMO observed for ZSM-5-TPAB in two consecutive cycles. They indicate that in the QE-TPDA experiments the rate of the catalytic cracking of hydrocarbons (indicated by the increased detector signal above 300 °C) is quite low, mainly due to quite a low partial pressure of the adsorptive. The resulting coking and blocking of the pores is in fact negligible.
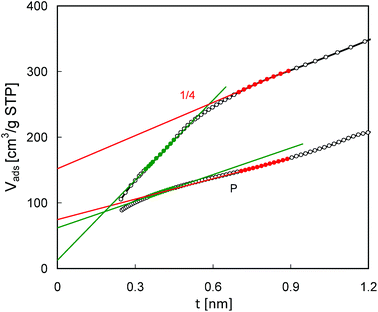
Values of the surface area and pore volume determined from N2 adsorption isotherms and the pore volume from QE-TPDA profiles for ZSM-5 zeolites are compared in Table 1. BET calculations were performed in the pressure range (0.02–0.08), limited in order to keep the C constant positive.35t-Plot analysis performed in the t range of 0.7–0.9 nm yielded the external surface area and the micropore volume. The total pore volumes were calculated from the last points in the isotherms.
| Sample | N2 adsorption | QE-TPDA Vpore [cm3 g−1] | |||||||||
|---|---|---|---|---|---|---|---|---|---|---|---|
| S [m2 g−1] | V pore [cm3 g−1] | Total | Meso | Micro | Subsurf. | ||||||
| BET | t-Plot | t-Plot | Total | Non. | DMO | Non.LT | DMOLT | Hex. | Non.HT | DMOIT | |
| ZSM-5-EtOH | 394 | 4 | 0.16 | 0.30 | 0.20 | 0.12 | 0.039 | 0.004 | 0.17 | 0.16 | 0.005 |
| ZSM-5-TPAB | 445 | 43 | 0.17 | 0.51 | 0.23 | 0.21 | 0.069 | 0.030 | 0.18 | 0.16 | 0.032 |
All of the thermodesorption profiles and the related porosity parameters obtained for ZSM-5 zeolites are consistent with the results of their standard characterization reported. They confirm that ZSM-5-EtOH is a typical microporous material with very low external surface. It is evident that the small size of zeolite crystals in ZSM-5-TPAB results in enhanced surface-related adsorption properties, without affecting adsorption in the micropores of the MFI framework. QE-TPDA profiles of DMO reveal that in this zeolite subsurface micropores represent about 20% of the total micropore volume, while for ZSM-5-EtOH this share is much smaller (ca. 3%).
3.3. Characteristics of MCM-22 and MCM-56 samples by conventional methods
ZSM-5 was studied as the benchmark example representing conventional zeolites. The characterization of MCM-22 and MCM-56 was aimed at finding whether the lamellar nature of MCM-56 can reveal any difference with regard to the parent framework represented by MCM-22.N2 adsorption isotherms (Fig. 7) reveal enhanced porosity of MCM-56 and its pillared derivatives in comparison with MCM-22. The isotherm obtained for the latter is characteristic of a microporous material possessing lower external surface area and some larger, presumably interparticle, mesopores. MCM-56 samples are represented by (1) the parent zeolite (P) prepared by hydrothermal synthesis and consisting of disordered MWW monolayers and (2) its three pillared forms obtained after pre-swelling with different amounts of surfactant in the hydroxide form, namely one-quarter, one-half and all (designated as 1/4, 2/4 and 4/4). The isotherms of the pillared zeolites, exhibiting a considerably greater slope in the intermediate pressure range and a larger step, are typical of the high surface layered materials, with interparticle mesopores formed between plate-like crystals. The isotherms are similar but with a major distinct difference related to closing of the hysteresis loop at p/po equal to 0.5 usually attributed to the presence of ink-bottle mesopores or interconnected, partially constricted mesopore systems.36 This feature is most pronounced for MCM-56 PIL1/4, is much smaller for PIL 2/4 and practically absent for PIL 4/4. In other words, the separation between the adsorption and desorption branches (the height of the step around p/po = 0.5) and overall area of hysteresis for the eventual pillared product decreases with increasing basicity of the swelling surfactant solution. It is clearly the effect of underlying chemistry during synthesis but it is too early to speculate on specific reasons.
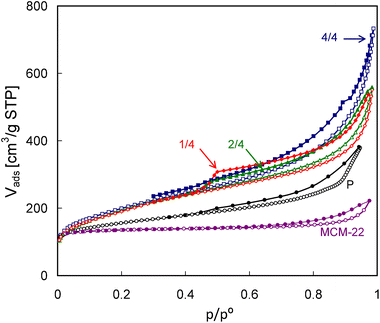 | ||
| Fig. 7 N2 adsorption and desorption isotherms (empty and filled symbols, respectively) of the studied MCM-56 and MCM-22 zeolites. | ||
The pore size distributions calculated according to the BJH scheme from both the N2 adsorption and desorption isotherm branches (Fig. 8) show more differences between the studied MCM-56 zeolites. While practically no mesopores were found for the parent MCM-56 material, a bimodal distribution of the mesopores may be noted for the pillared ones. The sharp peaks in PSDs obtained from the desorption branches appearing at ca. 4 nm do not represent any real pore size, since they result from abrupt emptying of partially blocked mesopores via the cavitation mechanism, i.e. they are related to the aforementioned closing of the hysteresis loops at p/po = 0.5. However, in these PSDs there are other features indicating the presence of both smaller and larger mesopores. The values of 2–2.2 nm corresponding to the maxima found in the PSDs calculated from the adsorption isotherms are beyond the applicability range of the Kelvin equation, so they may not be completely accurate. However, they are in good agreement with the interlayer separation (ca. 2 nm) found for the pillared MCM-56 from XRD data,30 specifically the (001) d-spacing of ∼4.5 nm which includes 2.5 nm of the MWW single-layer thickness. These small pores are most uniform for MCM-56 PIL1/4, as indicated by the narrowest maximum. On the other hand, all the modified zeolites show a considerable contribution of mesopores larger than 4 nm, indicated by the increased level of PSDs obtained from both adsorption and desorption isotherms. This feature is most visible for MCM-56 PIL4/4.
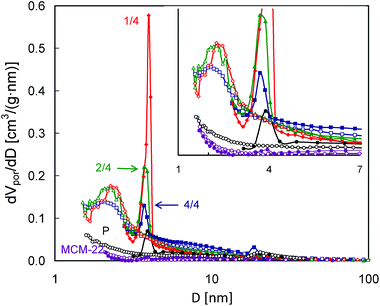 | ||
| Fig. 8 Pore size distributions calculated from N2 adsorption and desorption isotherms (empty and filled symbols, respectively) for the studied MCM-56 and MCM-22 zeolites. | ||
Some of the conclusions drawn from the pore size distributions are supported by the t-plot analysis of the N2 adsorption isotherms (Fig. 9). For the parent MCM-56 zeolite the t-plot line shows good linearity in a quite wide range of t values (0.35–0.9 nm), while for pillared MCM-56 PIL1/4 it may be divided into two separate linear segments. Very low intercept values corresponding to the left hand side segment suggest the lack of micropores in the modified zeolite. However, extrapolation of the right hand side segment yields a considerable pore volume of 0.22 cm3 g−1. On the other hand, the equivalent values from the 2 segments obtained for the parent MCM-22 are quite similar (0.09 and 0.12 cm3 g−1, respectively). Such differences in t-plots found for the parent and modified MCM-56 zeolite confirm changes in their micropores resulting from swelling and pillaring.
3.4. MCM-22 and MCM-56 characterization by QE-TPDA
All of the QE-TPDA profiles of hexane (Fig. 10) exhibit one broad maximum or shoulder at ca. 150 °C, corresponding to desorption from the micropores. This broadness may be the result of micropores comprising of 10-MR, the supercages and 12-MR surface pockets, all of which are particularly well represented in MCM-22. All MCM-56 based samples show smaller maxima at 150 °C while exhibiting an additional low temperature maximum, recorded immediately after commencement of heating the sample in the desorption phase of the QE-TPDA measurement. These maxima may represent larger micropores (e.g. distorted ones) or the strongest adsorption sites on the external or mesopore surface. They are not directly related to the presence of the mesopores, since the initial relative pressure of the adsorptive in the carrier gas (p/pe = 0.025) is far below the value expected for the capillary condensation. Similar low temperature peaks were observed in the QE-TPDA profiles of hexane for the mesoporous zeolites Y, recrystallized in the presence of the CTAB surfactant.37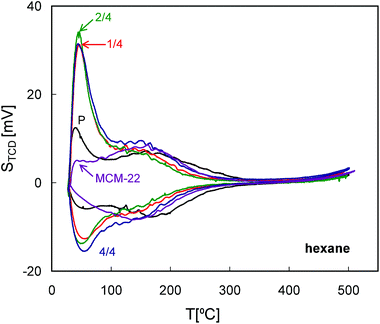 | ||
| Fig. 10 QE-TPDA profiles of hexane measured for the studied zeolites MCM-56 and MCM-22 at 10 °C min−1. | ||
The QE-TPDA profiles of nonane measured with a heating/cooling rate of 10 °C min−1 in a wide temperature range (Fig. 11, top) are dominated by low temperature maxima resulting from desorption from the mesopores. In these profiles there are also relatively small desorption peaks appearing above 150 °C which should be attributed to the micropores. Positions of these peaks observed for the modified MCM-56 zeolites are shifted to lower temperatures, indicating apparent increase in the micropore size.
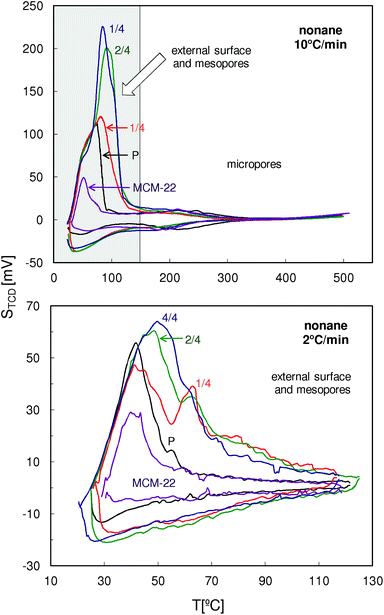 | ||
| Fig. 11 QE-TPDA profiles of nonane measured for the studied zeolites MCM-56 and MCM-22 at 10 and 2 °C min−1. | ||
Differences in intensity and positions of the low temperature peaks in these QE-TPDA profiles suggest substantial differences in mesoporosity of the studied zeolites, therefore additional high resolution thermodesorption measurements with a heating/cooling rate of 2 °C min−1 were performed (Fig. 11, bottom). Based on these profiles, the pore size distributions (Fig. 12) were calculated according to the modified BJH scheme.23 These PSDs show very good agreement with those calculated from the N2 sorption isotherms. They confirm the presence of such features from the constricted mesopore network in MCM-56 PIL1/4 (evidenced from the hysteresis loop in N2 isotherms), the large contribution of wide mesopores in MCM-56 PIL1/4, the presence of small mesopores (ca. 2 nm) in all of the modified MCM-56 zeolites as well as the absence of mesopores in the parent MCM-56 or in MCM-22.
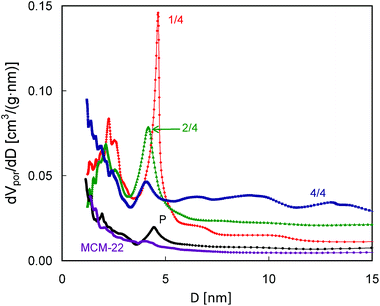 | ||
| Fig. 12 Pore size distributions calculated from the desorption parts of the QE-TPDA profiles of nonane measured at 2 °C min−1. | ||
The QE-TPDA profiles of 2,2-dimethyloctane (Fig. 13) are similar to those of nonane, especially in the low temperature range. Additional maxima present in the intermediate temperatures (90–150 °C) attributed to the subsurface micropores, in this case recognized as the 12-ring surface cups, were observed for all MCM-56 zeolites. Intensities of these peaks indicate the increased content of subsurface micropores in the pillared MCM-56 zeolites. High temperature parts of the QE-TPDA profiles of DMO contain small peaks at 190 °C and at 320 °C. The former ones are most distinct for MCM-22 and for the parent MCM-56. The latter ones observed only for MCM-56 samples are broader and shifted to higher temperatures in the case of the pillared zeolites.
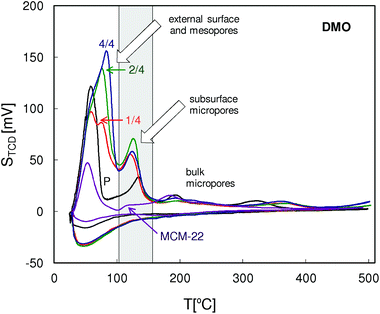 | ||
| Fig. 13 QE-TPDA profiles of 2,2-dimethyloctane measured for the studied MCM-56 and MCM-22 zeolites at 10 °C min−1. | ||
The surface area and pore volume values determined from N2 adsorption isotherms and the pore volumes obtained from QE-TPDA profiles for all MWW zeolites are compared in Table 2. The calculations were performed in the same way as for the ZSM-5 zeolites. All the values confirm the increasing mesopore volume and external surface area in the order MCM-22 < MCM-56 P < MCM-56 PIL, while the micropore volume does not change considerably.
| Sample | N2 adsorption | QE-TPDA Vpore [cm3 g−1] | |||||||||
|---|---|---|---|---|---|---|---|---|---|---|---|
| S [m2 g−1] | V pore [cm3 g−1] | Total | Meso | Micro | Subsurf. | ||||||
| BET | t-Plot | t-Plot | Total | Non. | DMO | Non.LT | DMOLT | Hex. | Non.HT | DMOIT | |
| MCM-22 | 520 | 29 | 0.19 | 0.34 | 0.27 | 0.36 | 0.15 | 0.12 | 0.14 | 0.12 | 0.03 |
| MCM-56 parent | 445 | 160 | 0.12 | 0.53 | 0.45 | 0.62 | 0.34 | 0.32 | 0.12 | 0.10 | 0.12 |
| MCM-56 PIL1/4 | 664 | 274 | 0.22 | 0.85 | 0.58 | 0.80 | 0.51 | 0.45 | 0.17 | 0.066 | 0.17 |
| MCM-56 PIL2/4 | 671 | 310 | 0.21 | 0.86 | 0.83 | 0.96 | 0.75 | 0.57 | 0.16 | 0.081 | 0.20 |
| MCM-56 PIL4/4 | 698 | 397 | 0.16 | 1.13 | 0.87 | 1.04 | 0.77 | 0.64 | 0.19 | 0.10 | 0.18 |
It is worth noting that the total pore volumes calculated from QE-TPDA profiles of DMO are larger than those obtained from the profiles of nonane, while with the mesopore volumes the reverse relation is observed. Moreover, except for MCM-22, volumes of the subsurface micropores calculated by integration of the IT thermodesorption peaks of DMO are usually as large as the micropore volumes. These facts support our hypothesis that the IT thermodesorption peaks of DMO correspond to desorption of molecules adsorbed in the openings of micropores on the zeolite surface. t-Butyl groups of such molecules would occupy some of the mesopore volume, leading to its underestimation. On the other hand, the subsurface micropore volume is overestimated, since only parts of DMO molecules (n-hexyl groups) are absorbed inside it.
The QE-TPDA results obtained for the studied MWW zeolites and the corresponding pore volumes (Table 2) corroborate some insights concerning their porosity inferred on the basis of N2 adsorption results. MCM-22 behaves as a typical microporous solid, with low external surface area and very small content of interparticle mesopores, as indicated by N2 adsorption isotherms and QE-TPDA profiles of hexane and nonane. The parent MCM-56 shows a considerably higher external surface area consistent with the mono-layer character vs. the multi-layer MCM-22. Higher values of the surface area or surface-related desorption peaks observed upon surfactant treatment and pillaring suggest additional exposure of the surface layer in pillared MCM-56 zeolites. This is confirmed by the increased intensity of the IT desorption peaks of DMO, assigned to subsurface micropores.
The pillared MCM-56 zeolites exhibit similar porosity, with some minor but distinct differences, with PIL1/4 and PIL4/4 representing the extreme cases. Pore size distributions obtained from both N2 desorption isotherms and thermodesorption of nonane confirm the presence of very small (2–2.2 nm) and larger (5–15 nm) mesopores in all pillared MCM-56. The content of the latter pores is the largest in PIL4/4. On the other hand, PIL1/4 shows the highest content of uniform small mesopores. Additional, very intensive and sharp maxima at ca. 4–5 nm, observed for this zeolite in both PSDs, reveal the presence of an interconnected system of partially constricted or ink-bottle mesopores with smaller effective size.38 Moreover, considerable high-temperature parts of the QE-TPDA profiles of hexane and nonane evidence considerable and uniform microporosity of all MWW zeolites.
4. Conclusions
A new probe molecule, 2,2-dimethyloctane, was for the first time applied in characterization of porous materials by means of quasi-equilibrated temperature-programmed desorption and adsorption. QE-TPDA of DMO was tested using two kinds of ZSM-5 with considerably different crystal size. Then this approach was applied for detailed porosity characterization of unilamellar zeolite MCM-56 in different structural forms.In QE-TPDA profiles of DMO obtained for a nanocrystalline ZSM-5 zeolite, an additional intermediate temperature maximum (105 °C) was observed, together with a high temperature (260 °C) maximum attributed to desorption from the micropores and the low temperature desorption peak (50 °C), corresponding to the external surface and the interparticle mesopores. The intermediate temperature QE-TPDA peak, which practically did not appear for larger ZSM-5 crystals, was attributed to desorption of DMO molecules adsorbed in the subsurface micropores with n-hexyl chains located inside the pore mouths and t-butyl groups protruding outside.
Porosity characterization of MCM-22 and MCM-56 zeolites by N2 adsorption and QE-TPDA of DMO, nonane and hexane confirmed higher external surface and lower micropore volume of MCM-56. It also revealed a substantial increase of surface area and formation of narrow (2–2.2 nm) and wider (5–15 nm) mesopores in the pillared MCM-56 zeolites. QE-TPDA of DMO showed that pillaring of MCM-56 resulted in an increased content of the external 12 ring surface cups.
Acknowledgements
This work was in part financed with the funds from the Narodowe Centrum Nauki provided on the basis of decision number DEC-65 2011/03/B/ST5/01551. P.H. acknowledges financial support from the Slovak Scientific Grant Agency VEGA under no. 1/0228/12.References
- S. Kulprathipanja, Zeolites in Industrial Separation and Catalysis, Wiley, 2010 Search PubMed.
- J. Cejka, H. van Bekkum, A. Corma and F. Schueth, Introduction to Zeolite Molecular Sieves, Elsevier, Amsterdam, 2007 Search PubMed.
- K. S. W. Sing, D. H. Everett, R. A. W. Haul, L. Moscou, R. A. Pierotti, J. Rouquerol and T. Siemieniewska, Pure Appl. Chem., 1985, 57, 603 CrossRef CAS.
- C. T. Kresge, M. E. Leonowicz, W. J. Roth, J. C. Vartuli and J. S. Beck, Nature, 1992, 359, 710 CrossRef CAS.
- D. Zhao, Y. Wan and W. Zhou, Ordered Mesoporous Materials, Wiley, 2012 Search PubMed.
- C. T. Kresge and W. J. Roth, Chem. Soc. Rev., 2013, 42, 3663 RSC.
- I. Fechete, Y. Wang and J. C. Védrine, Catal. Today, 2012, 189, 2 CrossRef CAS PubMed.
- A. Dhakshinamoorthy, M. Opanasenko, J. Čejka and H. Garcia, Adv. Synth. Catal., 2013, 355, 247 CAS.
- A. Dhakshinamoorthy, M. Opanasenko, J. Čejka and H. Garcia, Catal. Sci. Technol., 2013, 3, 5209 Search PubMed.
- C. Baerlocher, L. B. McCusker and D. H. Olson, Atlas of Zeolite Framework Types, Elsevier, Amsterdam, 2007 Search PubMed.
- D. Verboekend, S. Mitchell and J. Pérez-Ramírez, Chimia, 2013, 67, 327 CrossRef CAS PubMed.
- J. Pérez-Ramírez, C. H. Christensen, K. Egeblad, C. H. Christensen and J. C. Groen, Chem. Soc. Rev., 2008, 37, 2530 RSC.
- W. J. Roth and J. Cejka, Catal. Sci. Technol., 2011, 1, 43 CAS.
- W. J. Roth and D. L. Dorset, Micropor. Mesopor. Mater., 2011, 142, 32 CrossRef CAS PubMed.
- F. S. O. Ramos, M. K. De Pietre and H. O. Pastore, RSC Adv., 2013, 3, 2084 RSC.
- W. J. Roth, C. T. Kresge, J. C. Vartuli, M. E. Leonowicz, A. S. Fung and S. B. McCullen, Stud. Surf. Sci. Catal., 1995, 94, 301 CrossRef CAS.
- W. J. Roth, P. Nachtigall, R. E. Morris and J. Čejka, Chem. Rev., 2014 DOI:10.1021/cr400600f.
- W. J. Roth, J. C. Vartuli and C. T. Kresge, Stud. Surf. Sci. Catal., 2000, 129, 501 CrossRef CAS.
- W. Makowski, Thermochim. Acta, 2007, 454, 26 CrossRef CAS PubMed.
- W. Makowski and Ł. Ogorzałek, Thermochim. Acta, 2007, 465, 30 CrossRef CAS PubMed.
- W. Makowski and P. Kuśtrowski, Microporous Mesoporous Mater., 2007, 102, 283 CrossRef CAS PubMed.
- W. Makowski, B. Gil and D. Majda, Catal. Lett., 2008, 120, 154 CrossRef CAS.
- W. Makowski, L. Chmielarz and P. Kuśtrowski, Microporous Mesoporous Mater., 2009, 120, 257 CrossRef CAS PubMed.
- M. Mańko, B. Gil, R. Janus and P. Kuśtrowski, Thermochim. Acta, 2010, 511, 82 CrossRef PubMed.
- W. Makowski, M. Leżańska, M. Mańko and J. Włoch, J. Porous Mater., 2010, 17, 737 CrossRef CAS.
- D. Majda and W. Makowski, J. Therm. Anal. Calorim., 2010, 101, 519 CrossRef CAS.
- R. Roque-Malherbe and F. Diaz-Castro, J. Mol. Catal. A: Chem., 2008, 280, 194 CrossRef CAS PubMed.
- W. Makowski, M. Mańko, A. Dudek and K. Mlekodaj, Adsorption, 2013, 19, 537 CrossRef CAS.
- W. J. Roth, Stud. Surf. Sci. Catal., 2005, 158, 19 CrossRef.
- B. Gil, W. Makowski, B. Marszałek, W. J. Roth, M. Kubu, J. Čejka and Z. Olejniczak, Dalton Trans., 2014 10.1039/C4DT00130C.
- B. Smit and T. L. M. Maesen, Nature, 1995, 374, 42 CAS.
- K. Sadowska, K. Góra-Marek and J. Datka, J. Phys. Chem. C, 2013, 117, 9237 CAS.
- M. Bevilacqua, A. G. Alejandre, C. Resini, M. Casagrande, Jo. Ramirez and G. Busca, Phys. Chem. Chem. Phys., 2002, 4, 4575 RSC.
- B. Gil, B. Marszalek, A. Micek-Ilnicka and Z. Olejniczak, Top. Catal., 2010, 53, 1340 CrossRef CAS.
- J. Rouquerol, P. Llewellyn and F. Rouquerol, Stud. Surf. Sci. Catal., 2007, 160, 49 CrossRef CAS.
- S. Lowell, J. E. Shields, M. A. Thomas and M. Thommes, Characterization of Porous Solids and Powders: Surface Area, Pore Size and Density, Springer, 2006, pp. 45–46 Search PubMed.
- M. Mańko, R. Chal, P. Trens, D. Minoux, C. Gérardin and W. Makowski, Microporous Mesoporous Mater., 2013, 170, 243 CrossRef PubMed.
- J. C. Groen and J. Perez-Ramirez, Appl. Catal., A, 2004, 268, 121 CrossRef CAS PubMed.
Footnote |
| † Electronic supplementary information (ESI) available. See DOI: 10.1039/c4dt00232f |
| This journal is © The Royal Society of Chemistry 2014 |

