 Open Access Article
A-site size effect in a family of unfilled ferroelectric tetragonal tungsten bronzes: Ba4R0.67Nb10O30 (R = La, Nd, Sm, Gd, Dy and Y)†
Jonathan
Gardner
and
Finlay D.
Morrison
*
EaStCHEM Research School of Chemistry, University of St Andrews, North Haugh, St Andrews, KY16 9ST, UK. E-mail: finlay.morrison@st-andrews.ac.uk
First published on 13th June 2014
Abstract
The effect of A-cation size on the structural and electrical properties in a family of ferroelectric tetragonal tungsten bronzes (TTBs) Ba4R0.67□1.33Nb10O30 (R = La, Nd, Sm, Gd, Dy and Y; □ = vacancy) was investigated. In each case, the crystal structure, as determined from lab-based ambient powder X-ray diffraction (PXRD), is metrically tetragonal and can be refined in the P4bm space group. XRD data show an increased splitting of hk0 00l reflections with decreasing R cation size indicating an increasing tetragonal distortion (measured by tetragonality c/a). Dielectric data and ferroelectric measurements indicate that the ferroelectric Curie temperature, TC, increases with decreasing R size and so a direct correlation between TC and tetragonality/ionic radius of R is demonstrated. Rietveld refinements show that the large A2-site is fully occupied by Ba2+ and, in addition to the R cation size, the presence of vacancies at the A1-site (perovskite-like site) is also shown to strongly affect the stability of ferroelectricity in this structure type.
Introduction
Modern applications for ferroelectrics and dielectrics are still dominated by materials with the perovskite structure, largely due to the possibility of structure/property manipulation rationalised via geometrical tolerance factors and tilt systems.1–3 The development/growth of the electronics industry has driven the investigation of other structures in the search for new materials to e.g. replace existing lead-based compounds. Materials with the tetragonal tungsten bronze (TTB) structure were reported to display ferroelectric properties by Goodman in 19534,5 and offer great scope for materials development due to their similar compositional flexibility compared to the closely related perovskite structure.The TTB structure has general formula (A1)2(A2)4(B1)2(B2)8(C)4(X)30 (where X = fluorine or more commonly oxygen and A, B, C are metal cations) and consists of square A1-site, perovskite-like, units linked by B1-site BO6 units, which together demarcate a large pentagonal tunnel, the A2-site (Fig. 1).5 A1- and A2-sites are crystallographically distinct but both are occupied by larger cations: alkaline,6 alkaline earth,7 rare earth,8 or lead,5 however, substitutions of heavier cations such as bismuth9 or thorium10 have been reported. Where two (or more) A-cation types are present, the larger A2-site is generally preferentially occupied by the larger cations.4,11 The B1- and B2-sites are non-equivalent BO6 octahedral sites and usually occupied by small and highly charged cations: Nb, Ti, Ta or W,12 although minimal amount of doping of first row transition metals and others is possible.13–15 The C-site is of sufficient size to only accommodate the smallest cations, e.g. Li+, and consequently is vacant in most reported TTB compounds. When all cation sites are occupied the structure is described as being ‘stuffed’, while in ‘filled’ structures A- and B-sites are fully occupied but the C-site is vacant.16,17 When vacancies are present within the A-sites, the structure is described as ‘unfilled’.17 Alternative expressions of the general TTB formula are common in the literature. Filled oxide compounds are commonly expressed in the reduced form (A1)(A2)2(B1)(B2)4O15 (A3B5O15) e.g. Ba2NaNb5O15![[thin space (1/6-em)]](https://www.rsc.org/images/entities/char_2009.gif) 6 while unfilled compounds are described by the further reduced forms AB2O6e.g. (Ba, Sr)Nb2O6.12
6 while unfilled compounds are described by the further reduced forms AB2O6e.g. (Ba, Sr)Nb2O6.12
The cell dimensions of the TTB structural aristotype are typically a = b ≈ 12.5 Å and c ≈ 4 Å (and is assigned space group P4/mbm).4 An orthorhombic distortion, leading to an expansion in the ab plane (such that ao = √2a, bo = √2b) as well as further cell doubling in a, b and/or c is common.18 Incommensurate superstructures, primarily originating from modulations of the oxygen sub-lattice, have been reported for several TTB systems.18 These features are often subtle and therefore difficult to characterise with conventional powder X-ray diffraction methods; consequently most studies concerning these features employ electron, single crystal or neutron diffraction techniques. Polarisation in TTBs is, in most instances, constrained within the c axis, although in lead (and similar cations e.g. Bi3+)-based compounds the polar axis is rotated into the ab plane.4 This may also be observed in charge ordered systems.19
Previous investigation into the properties of this structure has been predominately focused on filled TTBs, specifically mixed titanate–niobates. Stennett and co-workers observed an increase in TC with decreasing M ionic radius at the A1-site in the filled TTB, Ba2MTi2Nb3O15 (M = Bi, La, Pr, Nd, Sm, Eu, Gd and Dy), with a transition between normal ferroelectric (M = Pr to Dy) to relaxor ferroelectric (M = Bi and La) behaviour.20,21 A superstructure in which the c-axis of the regular TTB structure is doubled was identified, with commensurate and incommensurate structures observed, correlating with normal ferroelectric and relaxor ferroelectric states, respectively. This has been attributed to the average rare earth size at the A1-site driving tilting of the BO6 octahedra, leading to an incommensurate modulation of the structure.22 The influence of A2-site size was shown to be important by Zhu et al. in (BaxSr1−x)4Nd2Ti4Nb6O30, who suggested that the difference in the mean size of A1-site cations and A2-site cations, rather than absolute A1-site cation size, was responsible for inducing octahedral tilting, with decreasing size difference destabilising ferroelectric ordering and leading to the onset of incommensurate periodicity.23
B-site substitution has also been shown to affect ferroelectric properties of TTBs in compounds in which A-site size is constant.24–26 Increasing M4+ size in Ba6M4+2Nb8O30 shows a decrease in TC (or Tm), while increasing M3+ in Ba6M3+Nb9O30 increases TC (or Tm). A relationship between the structural distortion, quantified by tetragonality (c/a), originating from these substitutions and TC has been shown to reconcile these apparently conflicting trends.27
The properties of unfilled TTBs have been comparatively less well examined, with the exception of SBN.12 Masuno reported a series of unfilled ferroelectric barium niobate TTBs, (Ba1−xRE2x/3)Nb2O6, (R = Y, Sm or La) with single phase compounds in the approximate range x = 0.2 to 0.4, depending on R.8 Higher dopant levels depressed the Curie temperature, TC, with a maxima in TC occurring for the composition corresponding to x = 0.2, Ba4R0.67Nb10O30. Higher values of TC were reported with decreasing R cation size for each value of x. A similar relationship between TC and ionic radius was shown to exist by Wakiya et al.28 in Ba3.75R0.833Nb10O30, R = Nd, Sm, Eu, Gd, Y, Ho and Er (corresponding to x = 0.25 in Masuno's compounds).
Wakiya and co-workers assigned A1- and A2-site distribution in Ba3.75R0.833Nb10O30 (R = Nd, Sm, Eu, Gd, Y, Ho and Er) based on analysis of powder X-ray diffraction, however, did not report lattice parameters.28 We have produced a series Ba4R0.67Nb10O30 TTB compounds of various R3+ size to examine if size difference and tetragonality concepts are applicable to unfilled systems. Previous reports on both unfilled and filled rare earth-doped TTBs, have indicated that when cations of different sizes occupy the A1- and A2-site, the larger cation preferentially occupies the larger A2-site.4,11 In filled rare earth-doped TTBs of A-site composition Ba4RE2, the size difference appears to be sufficiently large such that Ba2+ and RE3+ are restricted to A2- and A1-sites respectively.29 It is expected that Ba4R0.67Nb10O30 compounds display similar cation ordering with Ba2+ fully occupying the larger A2-site and with R3+ (and vacancies) on the A1-site. This allows the influence of A-site-size differences and tetragonality/structural distortion on the ferroelectric properties of this unfilled TTB system to be tested while excluding B-site effects and avoiding mixed A-site cation distribution. The R-cations reported here were specifically selected by two criteria: (i) they only adopt +III valence state and hence avoids the possibility of alternative charge compensation mechanism(s) on doping and (ii) they are of sufficiently large ionic radius to occupy the A-sites only.
It is important to re-emphasise that many TTB compounds adopt larger unit cells due to an orthorhombic distortion and/or incommensurate modulations in the ab-plane. These distortions are frequently subtle and require advanced characterisation techniques such as synchrotron X-ray, neutron or selected area electron diffraction methods. Such techniques, however, are not routinely available and either involve long lead times to access central facilities or are destructive (e.g., SAED of sintered ceramics). The majority of structural variations of the TTB structure, however, involve √2 or 2√2 extension of the a and b lattice parameters, and/or doubling in the c-axis and so can also be described in terms of reduced cell parameters as for perovskites. In many cases such reduced cell parameters result in a metrically tetragonal representation. Our approach in this study is to utilise this observation allowing widely accessible lab-based PXRD analysis to simply determine tetragonality (without the need for complex techniques or larger units cells) and which can then be empirically correlated with TC (Table 1).
| R | a (Å) | c (Å) | c/a | Volume (Å3) | χ 2 | R wp | R[F2] | T C (K) |
|---|---|---|---|---|---|---|---|---|
| a Refined in P4bm and P4/mbm with near identical values. b T m at 1 MHz. | ||||||||
| Y | 12.45172(14) | 3.95503(6) | 0.3176 | 613.209(14) | 5.76 | 0.193 | 0.23 | 537 |
| Dy | 12.45845(16) | 3.95434(6) | 0.3174 | 613.765(14) | 3.81 | 0.157 | 0.169 | 524 |
| Gd | 12.46285(18) | 3.95474(7) | 0.3173 | 614.260(17) | 4.06 | 0.159 | 0.121 | 491 |
| Sm | 12.46758(17) | 3.95548(7) | 0.3172 | 614.843(16) | 3.80 | 0.151 | 0.151 | 459 |
| Nd | 12.47453(7) | 3.95439(4) | 0.3170 | 615.358(7) | 3.96 | 0.148 | 0.147 | 406 |
| Laa | 12.48735(13) | 3.95577(5) | 0.3168 | 616.839(12) | 2.91 | 0.145 | 0.127 | 297b |
Experimental methods
Polycrystalline ceramic samples of Ba4R0.67□1.33Nb10O30 (R = La, Nd, Sm, Gd, Dy, Ho, Er, Yb and Y; □ = vacancy), were synthesised using a conventional solid state method. Precursor powders (all >99% purity) of: BaCO3, Nb2O5, La2O3, Nd2O3, Sm2O3, Gd2O3, Gd2O3, Dy2O3, Ho2O3, Er2O3, Yb2O3 and Y2O3 (Aldrich); Er2O3 (Apollo Scientific); and Yb2O3 (Alfa Aesar), were dried prior to use. BaCO3 and Nb2O5 were dried at 600 °C, the remainder at 1000 °C. The appropriate stoichiometric ratios of the precursor reagents were homogenised as an acetone slurry in an agate mortar and pestle. The resulting dry powder was formed into a cylindrical body by manual compression using a 12 mm diameter steel die press then heated in an alumina boat lined with platinum foil for 2 hours at 1000 °C, immediately followed by 15 hours at 1250 °C. Samples were air quenched, ground to a powder then milled in ethanol by planetary ball mill for 1 hour (600 r.p.m.). A 10 mm die press was used to form pellets of approximately 0.5–2 mm thickness by uniaxial pressing. Pellets were heated in a tube furnace for 6 hours at temperatures of 1350, 1375 or 1400 °C (heating/cooling rates of 20 °C min−1) resulting in ceramics of typically greater than 95% theoretical density as calculated from refined lattice parameters. R = Y required additional sintering to yield single phase ceramics, with optimum duration found to be 12 hours for the above temperatures. Despite repeated attempts and successive sintering stages single phase TTB analogues of R = Ho, Er and Yb were not obtained.Structural characterisation was carried out using powder X-ray diffraction. Data were collected over a range of 10–90° 2-theta with a PANalytical Empyrean diffractometer operating in reflection mode, Cu Kα1 radiation (1.540598 Å) and step size of 0.0167 degrees 2-theta. The General Structure Analysis System (GSAS)30 and associated graphical user interface, EPGUI31 were used for structural (Rietveld) refinements. For PXRD data the following parameters were refined: lattice parameters, background, scale, peak profile and sample displacement. Atomic positions and isotropic displacement parameters were refined for the cations, but fixed for oxygen. Sample microstructure was investigated using a Joel JSM 5600 scanning electron microscope (SEM). Micrographs were taken of the thermally etched (1215 °C, 10 h) fracture surfaces of sintered pellets. Platinum electrodes were sputtered onto the polished faces of sintered pellets for electrical characterisation. Dielectric and immittance measurements were taken over a frequency range of 0.025 and 2000 kHz with Agilent 4294A and Wayne Kerr 6500B impedance analysers between 50 and 873 K using a closed cycle cryocooler and Carbolite MTF 10/25/130 tube furnace. Polarisation–electric field (P–E) measurements were recorded using an AixACCT TF Analyzer 2000, TREK 609E-6 high voltage amplifier, variable temperature (ambient to 473 K) AixACCT piezo sample holder (model TFA 317-7 with sample immersed in Dow Corning 200/100 cs silicone fluid (BDH Ltd)) or closed cycle cryocooler.
Results and discussion
A. Crystal structure
Ceramic samples of Ba4R0.67□1.33Nb10O30 (R = La, Nd, Sm, Gd, Dy, Ho, Er, Yb and Y), were prepared as described above and powder X-ray diffraction (PXRD) used to establish the formation of the crystalline TTB structure and ensure the absence of impurity phases. Compositions with R = La to Dy and also Y, resulted in nominally single phase TTBs. Attempts at producing R = Ho, Er and Yb analogues yielded phase mixtures of a TTB main phase and significant quantities of BaNb2O6 (see ESI†) suggesting that these R cations are too small to be incorporated in these amounts. It is interesting to note that Wakiya et al. also reported that they could not obtain single phase Ba3.75Ho0.833Nb10O30, although they reported success for the Er analogue.28 The incorporation of Yb into the TTB structure has been reported but to our knowledge only in minimal concentrations.32,33 Based on these observations the smaller rare earth Lu was not investigated.As mentioned previously, TTB structures can adopt several different symmetries, predominantly in the tetragonal and orthorhombic crystal systems, although distortions are usually sufficiently subtle that it is difficult to distinguish between them. Rietveld refinements were carried out on PXRD data using structural models with the non-centrosymmetric P4bm and centrosymmetric P4/mbm tetragonal space groups. These space groups are commonly reported for the ferroelectric (P4bm) and paraelectric (P4/mbm) polymorphs of TTBs.34–37 including those of similar compositions.11,28,38 Refinements in both space groups yield near identical lattice parameters, but differing atomic positions. Refinements with other space groups reported for TTBs, notably orthorhombic Pba2,24 resulted in poor, divergent or unstable refinements and so, based on the laboratory XRD data obtained, there was no evidence to warrant further lower of symmetry from P4bm.
All observed reflections were indexed by the P4bm model, however, a number of calculated peak intensities deviate slightly for data collected on both powder and pellets. These differences may result from preferred orientation associated with the columnar grain morphology (described later), but this was not investigated in detail. Attempts at refining A-cation occupancies both with Ba2+ confined to the A2-site and also allowing cross substitution of Ba2+ and R3+ between the A1- and A2-sites, resulted in unstable, unrealistic, or inferior refinements. Refinements where A-site cation occupancies were consequently fixed such that the A2-site is fully occupied by Ba2+ and the two A1-sites partially occupied by 0.67R3+ and 1.33□ to achieve the nominal stoichiometry, Ba4R0.67□1.33Nb10O30 resulted in significantly improved (and stable) fits. (It is important to note that, especially for the early period rare earths, the X-ray scattering factors are not significantly different to Ba.)
The lattice parameters indicate increasing tetragonality, c/a, with decreasing size of R-cation which nominally occupies the A1-site, Fig. 2a. The increase in c/a is predominantly driven by decreasing a as the ionic radius of R decreases, whilst the c parameter is comparatively invariant. The resultant decrease in cell volume with decreasing R radius is thus also largely driven by contraction in the ab plane (see ESI†).
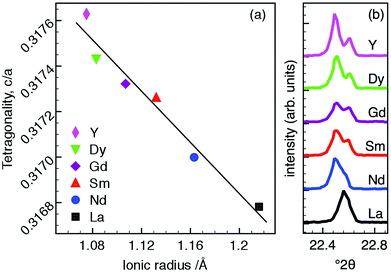 | ||
| Fig. 2 (a) Tetragonality (c/a), as a function of ionic radius for Ba4R0.67□1.33Nb10O30 (all ionic radii are for IX coordination39) and (b) splitting of ambient temperature PXRD 310 and 001 reflections (P4bm) showing increasing distortion. | ||
Peak splitting of differing magnitude was observed in 4 pairs of hk0 00l reflections in the PXRD data of each compound. This is most clearly evident for the 001 and 310 reflections as shown in Fig. 2b. The magnitude of the splitting increases with decreasing R radius and consequently increasing tetragonality, as expected. This response to changing A1-site cation size has previously been reported in both filled20 and unfilled40 TTBs. While these trends appear to be consistent, they are comparatively subtle; PXRD patterns for each composition are otherwise visually indistinguishable with the exception of the aforementioned peak splitting.
In addition to the previously described splitting, Ba4La0.67□1.33Nb10O30 displays several peaks which exhibit slightly different peak profiles. These peaks do not coincide with known impurity phases and possibly indicate splitting due to lowering of symmetry. However, it was not possible to determine this conclusively given the resolution of the laboratory PXRD data. Nevertheless, the pattern can still be indexed in a tetragonal setting.
SEM micrographs of the thermally etched fracture surfaces of the sintered pellets indicate elongated and relatively uniform sized crystallites in the range of 10–15 μm. Relatively few pores were observed which is consistent with calculated pellet densities (see ESI†).
B. Electrical properties
Polycrystalline ceramics consist of crystalline grains (grain bulk) connected by intergranular material (grain boundaries) and may include a level of porosity, depending on the compound and synthetic conditions. These various electroactive regions typically display differing electrical properties; standard capacitance measurements of polycrystalline samples measure the total, macroscopic sample response and are therefore a convolution of the contributions of these individual electroactive regions within the sample. The electrical properties of a ceramic are typically dominated by the grain bulk and grain boundary responses, however, other contributions such as those from electrodes and surface effects may be observed.41,42 The ‘brickwork’ model of discrete grains separated by thin grain boundaries (which therefore are characterised by high capacitances) is not universally observed in all cases as ceramic microstructure is heavily influenced by processing conditions.43 Dissimilar electrical responses can therefore be observed in nominally identical compositions due to microstructural differences such as grain size, thickness/definition of grain boundary regions, and density.High temperature immittance spectroscopy was carried out to determine the number of electroactive regions present and to ensure fixed frequency capacitance measurements carried out at lower temperatures represented the bulk response.
All samples display single semi-circular arcs in both impedance, Z*, and modulus, M*, complex plane plots, and single peaks in the Z′′ and M′′ spectroscopic plots, Fig. 3(a) and (b). The Z′′ and M′′ peaks are spectroscopically coincident, Fig. 3(b), and so belong to the same electroactive component. The magnitude of the capacitance values obtained from the complex plane plots allow this response to be attributed to the bulk region. Fixed frequency (1 MHz) capacitance measurements can therefore be used as an approximation of the bulk response at all temperatures presented in Fig. 4.
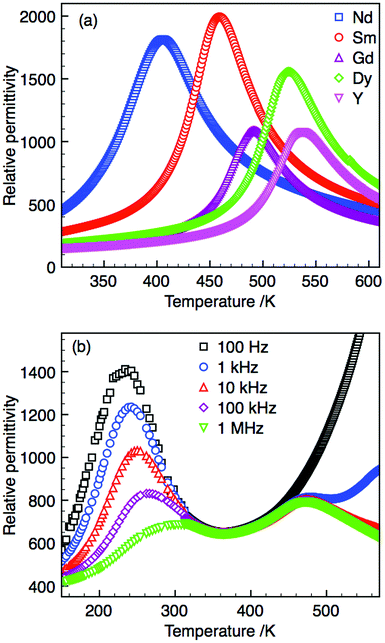 | ||
| Fig. 4 (a) Relative permittivity (at 1 MHz) of Ba4R0.67□1.33Nb10O30 (R = Nd, Sm, Gd, Dy and Y) and (b) Ba4La0.67□1.33Nb10O30 at selected frequencies. | ||
Fixed frequency capacitance sweeps were carried out for all compositions as detailed in the Experimental section. Compositions R = Nd, Sm, Gd, Dy and Y display single anomalies in the relative permittivity within the temperature range in which data were collected (50–890 K), Fig. 4. Composition R = La displays a low temperature frequency dependent relaxor-type peak with maximum, Tm (1 MHz), at 297 K and a frequency independent high temperature peak. This unusual behaviour will be discussed later. Peak maxima for all other compositions display little frequency dependence; TC differs by less than 5 K over measured frequency range (102–107 Hz). Relaxation in the dielectric loss was observed to occur coincident to the permittivity maxima; all losses (tan δ) were less than ∼10%. The diffuse nature of the permittivity peaks in comparison to many perovskite structured ferroelectrics is a common feature of ceramic TTB ferroelectrics and is likely due to the nature of the ferroelectric transition and the intrinsic anisotropy within the TTB structure.4 It should be noted that despite being multi-phase the Ho and Er samples were also ferroelectric with TC of ca. 269 and 264 °C, respectively. The lattice parameters of the TTB phase in these samples also have tetragonality ratios which correlate with the observed TC, however as the exact compositions of these phases are unknown and are not likely to contain the same stoichiometric ratios of Ba![[thin space (1/6-em)]](https://www.rsc.org/images/entities/char_2009.gif) :
:![[thin space (1/6-em)]](https://www.rsc.org/images/entities/char_2009.gif) R
R![[thin space (1/6-em)]](https://www.rsc.org/images/entities/char_2009.gif) :
:![[thin space (1/6-em)]](https://www.rsc.org/images/entities/char_2009.gif) vacancies we prefer not to include them in the discussion presented here (see ESI† for data regarding R = Ho and Er).
vacancies we prefer not to include them in the discussion presented here (see ESI† for data regarding R = Ho and Er).
All samples display saturated P–E hysteresis loops with clear associated switching current, Fig. 5, demonstrating that all compositions are ferroelectric up to TC (or up to the maximum temperature measured, 473 K). Linear lossy dielectric P–E loops above TC for compositions R = La, Nd and Sm demonstrate the high temperature paraelectric phase, Fig. 5(b) and confirm that the peak maxima in the dielectric data corresponds to a polymorphic phase transition between ferroelectric and paraelectric states and justifies the assignment of the non-centrosymmetric P4bm space group over the centrosymmetric P4/mbm for ambient PXRD data.
Ba4La0.67□1.33Nb10O30 displays two anomalies in the relative permittivity: a frequency dependent relaxor-type peak, Tm = 297 K (at 1 MHz) and a high temperature, frequency independent peak, Tm = 471 K, Fig. 4(b). Normal ferroelectric P–E hysteresis loops are observed at temperatures below the maxima in the relaxor peak and gradually transform into constricted or ‘pinched’ non-ferroelectric loops between the maxima of the dielectric anomalies with (slightly lossy) linear dielectric loops above 473 K, Fig. 5(c–f). Similar dielectric behaviour has been observed in other TTBs although varying rationalisations as to the origin of these observations have been proposed. These include: onset of incommensurate structures44 affected by octahedral rotation22 which has been suggested as being driven by decreasing smaller relative sizes of cations occupying A1- and A2-sites,23 variation of dipole correlation lengths due to charge imbalance from mixed valence cations,45 a frustrated ferroelectric/ferroelastic transition,46 polar ordering disruption due to 5 coordinate B-cation.34P–E loops were not reported for these TTBs, however, the coexistence of multiple dielectric anomalies and associated pinched P–E loops has been reported in perovskite systems.47,48
We are currently investigating the possible origins of these observations in our materials and these features will be discussed more fully in a future communication. Nevertheless, the observation that it is only possible to observe polarisation switching, i.e. ferroelectricity, below the lower temperature permittivity peak allows us to associate it with the ferroelectric TC.
The Curie temperature, TC, increases with decreasing ionic radius; the simultaneous increase in tetragonality (c/a) observed suggests a successively larger structural distortion in the TTB structure shifting TC to higher temperatures (Fig. 6). This relationship between Curie temperature and tetragonal distortion appears to be common within other series of rare earth-doped barium niobate and barium titanium niobate TTBs. It also occurs when cation size in the A1-site is controlled by means of solid solution between two rare earth cations (e.g. in the series (1 − x)Ba3.75Sm0.833Nb10O30–xBa3.75Y0.833Nb10O30![[thin space (1/6-em)]](https://www.rsc.org/images/entities/char_2009.gif) 38). As in the compositional series presented here, the increased structural distortion generally originates in contraction of the ab plane, while the c-axis remains comparatively invariant; this is seen for both filled e.g., Ba4M2Ti4Nb6O30 (M = La, Pr, Nd, Sm, Eu, Gd, Dy, and Bi)20 and Sr4(La1−xSmx)Ti4Nb6O30,49 and unfilled TTBs e.g., (1 − x)Ba3.75Sm0.833Nb10O30–xBa3.75Y0.833Nb10O30
38). As in the compositional series presented here, the increased structural distortion generally originates in contraction of the ab plane, while the c-axis remains comparatively invariant; this is seen for both filled e.g., Ba4M2Ti4Nb6O30 (M = La, Pr, Nd, Sm, Eu, Gd, Dy, and Bi)20 and Sr4(La1−xSmx)Ti4Nb6O30,49 and unfilled TTBs e.g., (1 − x)Ba3.75Sm0.833Nb10O30–xBa3.75Y0.833Nb10O30![[thin space (1/6-em)]](https://www.rsc.org/images/entities/char_2009.gif) 38 and Ba4RETiNb9O30 (R = La, Pr, Nd, Sm, Eu, Gd).40 Sun et al.50 also reported a number compositional series with barium and rare earth (La, Sm and Nd) on the A-sites as described by the general formulae: Ba5RTi3Nb7O30, Ba4R2Ti4Nb6O30 and Ba3R3Ti5Nb5O30. In the latter series, there was significantly more variation in the c-axis, presumably due to the rare earth now also occupying the A2-site.
38 and Ba4RETiNb9O30 (R = La, Pr, Nd, Sm, Eu, Gd).40 Sun et al.50 also reported a number compositional series with barium and rare earth (La, Sm and Nd) on the A-sites as described by the general formulae: Ba5RTi3Nb7O30, Ba4R2Ti4Nb6O30 and Ba3R3Ti5Nb5O30. In the latter series, there was significantly more variation in the c-axis, presumably due to the rare earth now also occupying the A2-site.
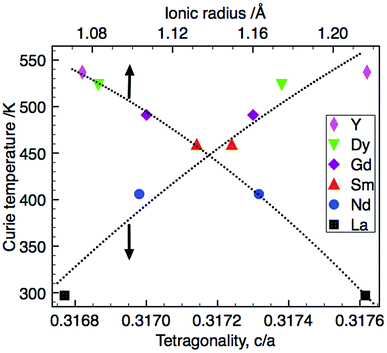 | ||
| Fig. 6 Correlation of Curie temperature with tetragonality and ionic radius (the data point for La is Tm at 1 MHz). | ||
It has been suggested that structural distortions lead to an increase in the c lattice parameter generating greater atomic shifts, Δz, of the cation in the ferroelectrically active barycentre, raising TC.51 The necessity to additionally consider distortion within the ab plane has been shown27,52 and the invariant nature of the c-axis within this series suggests that the tetragonal distortion, and thus increase in TC, originates from contraction in the ab plane with decreasing RE ionic radius. The magnitude of the difference in the mean size between the cations occupying the A1- and A2-sites influences the onset of relaxor behaviour in filled TTBs studied by Chen and co-workers23 with classical ferroelectric transitions occurring with larger size difference. Based on Rietveld refinements of PXRD data the barium solely occupies the larger A2-site,13 with R3+ confined to the A1-site in this series of compounds. The effect of the vacancy ‘size’ is difficult to quantify but is likely to decrease A1-site size relative to A2-site. Unfilled TTBs with A1-site vacancies are therefore likely to have a larger effective A1![[thin space (1/6-em)]](https://www.rsc.org/images/entities/char_2009.gif) :
:![[thin space (1/6-em)]](https://www.rsc.org/images/entities/char_2009.gif) A2 size difference compared to filled TTBs. This is consistent with the observation that filled compounds with Ba2+ occupying the A2-site display relaxor behaviour with smaller cations such as Nd and Sm in the A1-site23 compared to only the La analogue in the unfilled series reported here. The presence of vacancies at the A1 site therefore stabilises the ferroelectric distortion in this structure type.
A2 size difference compared to filled TTBs. This is consistent with the observation that filled compounds with Ba2+ occupying the A2-site display relaxor behaviour with smaller cations such as Nd and Sm in the A1-site23 compared to only the La analogue in the unfilled series reported here. The presence of vacancies at the A1 site therefore stabilises the ferroelectric distortion in this structure type.
Conclusions
TTB structured materials with varying A1-site cation size, Ba4R0.67□1.33Nb10O30 (R = La, Nd, Sm, Gd, Dy, Y) were produced obtaining nominally single phase ceramics. From lab-based XRD data, these compositions are metrically tetragonal and exhibit an increasing tetragonal distortion as R ionic radius decreases as indicated by refined lattice parameter values and increasing peak splitting of 00l hk0 reflections. Compounds R = Nd, Sm, Gd, Dy, and Y display single peaks in the relative permittivity with Curie temperatures increasing with decreasing ionic radius and therefore, concurrently with increasing tetragonal distortion. A contraction in the ab plane drives the structural distortion, with the c-axis largely invariant. This empirical observation of a correlation between tetragonality and TC appears to be universal within A-site (R) doped barium niobate-based TTB compositional series of comparable Ba![[thin space (1/6-em)]](https://www.rsc.org/images/entities/char_2009.gif) :
:![[thin space (1/6-em)]](https://www.rsc.org/images/entities/char_2009.gif) R stoichiometric ratio.
R stoichiometric ratio.
The ferroelectric nature of all compositions has been established with P–E hysteresis measurements. The presence of vacancies at the A1-site are important in inducing the ferroelectric instability in these materials, with ferroelectricity observed for Nd compositions compared to relaxor behaviour in corresponding filled analogues. The amount of vacancies incorporated could therefore provide an additional degree of freedom for tuning of properties.
A low temperature relaxor-type peak with strong frequency dispersion and a non-frequency dependent high temperature peak were detected in the relative permittivity of Ba4La0.67Nb10O30. Low temperature P–E hysteresis loops, indicating ferroelectric behaviour, transform into a ‘pinched’ or antiferroelectric-type loop in the temperature range between the dielectric peaks, and finally to a linear dielectric-type P–E response at higher temperature. The precise origins of this behaviour are not yet known.
Acknowledgements
JG would like to thank the EPSRC and EaStCHEM for provision of a studentship via the doctoral training grant.References
- A. S. Bhalla, R. Guo and R. Roy, Mater. Res. Innovations, 2000, 4, 3 CrossRef CAS.
- A. M. Glazer, Acta Crystallogr., Sect. B: Struct. Crystallogr. Cryst. Chem., 1972, 28, 3384 CrossRef CAS.
- V. M. Goldschmidt, Die Naturwissenschaften, 1926, 4, 477 CrossRef.
- M. E. Lines and A. M. Glass, Principles and Applications of Ferroelectrics and Related Materials, Oxford University Press, Oxford, 2001 Search PubMed.
- M. H. Francombe and B. Lewis, Acta Crystallogr., 1958, 11, 696 CrossRef CAS.
- P. B. Jamieson, S. C. Abrahams and J. L. Bernstein, J. Chem. Phys., 1969, 50, 4352 CrossRef CAS PubMed.
- M. H. Francombe, Acta Crystallogr., 1960, 13, 131 CrossRef CAS.
- K. Masuno, J. Phys. Soc. Jpn., 1964, 19, 323 CrossRef CAS.
- T. Ikeda, T. Haraguchi, Y. Onodera and T. Saito, Jpn. J. Appl. Phys., 1971, 10, 987 CrossRef CAS.
- J. Thoret, W. Freundlich, J. Ravez, A. Simon and P. Hagenmuller, Ferroelectrics, 1983, 56, 1061 Search PubMed.
- N. Wakiya, J. Wang, K. Shinozaki and N. Mizutani, Korean J. Ceram., 2000, 6, 380 CAS.
- P. B. Jamieson, S. C. Abrahams and J. L. Bernstein, J. Chem. Phys., 1968, 48, 5048 CrossRef CAS PubMed.
- M. Josse, O. Bidault, F. Roulland, E. Castel, A. Simon, D. Michau, R. Von der Muhill, O. Nguyen and M. Magilone, Solid State Sci., 2009, 9, 1118 CrossRef PubMed.
- Y.-Q. Tan, Y. Yu, Y.-M. Hao, S.-Y. Dong and Y.-W. Yang, Mater. Res. Bull., 2013, 48, 1934 CrossRef CAS PubMed.
- P. P. Liu, X. L. Zhu and X. M. Chen, J. Appl. Phys., 2009, 106, 074111 CrossRef PubMed.
- Y. Yuan, X. M. Chen and Y. J. Wu, J. Appl. Phys., 2005, 98, 084110 CrossRef PubMed.
- Y. B. Yao, C. L. Mak and B. Ploss, J. Eur. Ceram. Soc., 2012, 32, 4353 CrossRef CAS PubMed.
- M. Smirnov and P. Saint-Grégoire, Acta Crystallogr., Sect. A: Fundam. Crystallogr., 2014, 70, 283 CrossRef CAS PubMed.
- K. Yamauchi and S. Picozzi, Phys. Rev. Lett., 2010, 105, 107202 CrossRef.
- M. C. Stennett, I. M. Reaney, G. C. Miles, D. I. Woodward, A. R. West, C. A. Kirk and I. Levin, J. Appl. Phys., 2007, 101, 104114 CrossRef PubMed.
- M. C. Stennett, G. C. Miles, J. Sharman, I. M. Reaney and A. R. West, J. Eur. Ceram. Soc., 2005, 25, 2471 CrossRef CAS PubMed.
- I. Levin, M. C. Stennett, G. C. Miles, D. I. Woodward, A. R. West and I. M. Reaney, Appl. Phys. Lett., 2006, 89, 122908 CrossRef PubMed.
- X. L. Zhu, S. Y. Wu and X. M. Chen, Appl. Phys. Lett., 2007, 91, 162906 CrossRef PubMed.
- E. O. Chi, A. Gandini, K. M. Ok, L. Zhang and P. S. Halasyamani, Chem. Mater., 2004, 16, 3616 CrossRef CAS.
- A. Rotaru, D. C. Arnold, A. Daoud-Aladine and F. D. Morrison, Phys. Rev. B: Condens. Matter, 2011, 83, 184302 CrossRef.
- R. R. Neurgaonkar, J. G. Nelson and J. R. Oliver, Mater. Res. Bull., 1992, 27, 677 CrossRef CAS.
- D. C. Arnold and F. D. Morrison, J. Mater. Chem., 2009, 19, 6485 RSC.
- N. Wakiya, J. Wang, A. Saiki, K. Shinozaki and N. Mizutani, J. Eur. Ceram. Soc., 1999, 19, 1071 CrossRef CAS.
- G. C. Miles, M. C. Stennett, I. M. Reaney and A. R. West, J. Mater. Chem., 2005, 15, 798 RSC.
- A. C. Larson and R. B. V. Dreele, Los Alamos National Laboratory Report LAUR 86-748, 1994.
- B. H. Toby, J. Appl. Crystallogr., 2001, 34, 210 CrossRef CAS.
- K. Lebbou, H. Itagaki, A. Yoshikawa, T. Fukuda, F. Carillo-Romo, G. Boulon, A. Brenier and M. T. Cohen-Adad, J. Cryst. Growth, 2000, 210, 655 CrossRef CAS.
- B. Boudour, A. Karek, A. El Hassouni, C. Goutaudier and G. Boulon, Afr. Rev. Phys., 2011, 6, 181 Search PubMed.
- M. Prades, N. Maso, H. Beltran, E. Cordoncillo and A. R. West, Inorg. Chem., 2013, 52, 1729 CrossRef CAS PubMed.
- E. Castel, P. Verber, M. Albine, M. Velazquez, S. Pechev, D. Denux, J. P. Chaminade, M. Magilone and M. Josse, J. Cryst. Growth, 2012, 340, 156 CrossRef CAS PubMed.
- M. X. Cao, X. L. Zhu, X. Q. Liu and X. M. Chen, J. Am. Ceram. Soc., 2010, 93, 782 CrossRef CAS PubMed.
- Y. J. Wu, Z. J. Hong, Y. Q. Lin, S. P. Gu, X. Q. Liu and X. M. Chen, J. Appl. Phys., 2010, 108, 014111 CrossRef PubMed.
- J.-K. Wang, N. Wakiya, K. Shinozaki and N. Mizutani, J. Ceram. Soc. Jpn., 2000, 108, 36 CrossRef CAS.
- R. D. Shannon, Acta. Crystallogr., Sect. A: Cryst. Phys., Diffr., Theor. Gen. Cryst., 1976, 32, 751 CrossRef.
- C. Hu, L. Hou, L. Fang and L. Liu, J. Alloys Compd., 2013, 581, 547 CrossRef CAS PubMed.
- A. R. West, D. C. Sinclair and N. Hirose, J. Electroceram., 1997, 1, 65 CrossRef CAS.
- D. C. Sinclair, Bol. Soc. Esp. Ceram. Vidrio, 1995, 34, 55 CAS.
- J. T. S. Irvine, D. C. Sinclair and A. R. West, Adv. Mater., 1990, 2, 132 CrossRef CAS.
- M. Venet, J. M'Peko, F. L. Zabotto, F. Guerrero, D. Garcia and J. A. Eiras, Appl. Phys. Lett., 2009, 94, 172901 CrossRef PubMed.
- E. Castel, M. Josse, D. Michau and M. Magilone, J. Phys.: Condens. Matter, 2009, 21, 452201 CrossRef PubMed.
- A. Torres-Pardo, R. Jimenéz, J. M. González-Calbet and E. García-González, Inorg. Chem., 2011, 50, 12091 CrossRef CAS PubMed.
- Z. Xu, X. Dai, J. Li and D. Viehland, Appl. Phys. Lett., 1996, 68 Search PubMed.
- W. Jo, S. Schaab, E. Sapper, L. A. Schmitt, H.-J. Kleebe, A. J. Bell and J. Rödel, J. Appl. Phys., 2011, 110, 074106 CrossRef PubMed.
- X. L. Zhu, Y. Bai, X. Q. Liu and X. M. Chen, Appl. Phys., 2011, 110, 114101 Search PubMed.
- Y. H. Sun, X. M. Chen and X. H. Zheng, J. Appl. Phys., 2004, 96, 7435 CrossRef CAS PubMed.
- S. C. Abrahams, S. K. Kurtz and P. B. Jamieson, Phys. Rev., 1968, 172, 551 CrossRef CAS.
- K. Li, X. L. Zhu, X. Q. Liu and X. M. Chen, Appl. Phys. Lett., 2013, 102, 112912 CrossRef PubMed.
Footnote |
| † Electronic supplementary information (ESI) available. See DOI: 10.1039/c4dt00126e |
| This journal is © The Royal Society of Chemistry 2014 |

