 Open Access Article
 This Open Access Article is licensed under a
 Creative Commons Attribution 3.0 Unported Licence
Thienylpyridine-based cyclometallated iridium(III) complexes and their use in solid state light-emitting electrochemical cells†
Andreas M.
Bünzli
a,
Henk J.
Bolink
bc,
Edwin C.
Constable
a,
Catherine E.
Housecroft
*a,
José M.
Junquera-Hernández
b,
Markus
Neuburger
a,
Enrique
Ortí
*b,
Antonio
Pertegás
b,
Juan J.
Serrano-Pérez
b,
Daniel
Tordera
b and
Jennifer A.
Zampese
a
aDepartment of Chemistry, University of Basel, Spitalstrasse 51, CH-4056 Basel, Switzerland. E-mail: catherine.housecroft@unibas.ch
bInstituto de Ciencia Molecular, Universidad de Valencia, Catedrático José Beltrán 2, Paterna, E-46980, Spain. E-mail: enrique.orti@uv.es
cFundació General de la Universitat de Valencia (FGUV), PO Box 22085, Valencia, Spain
First published on 22nd October 2013
Abstract
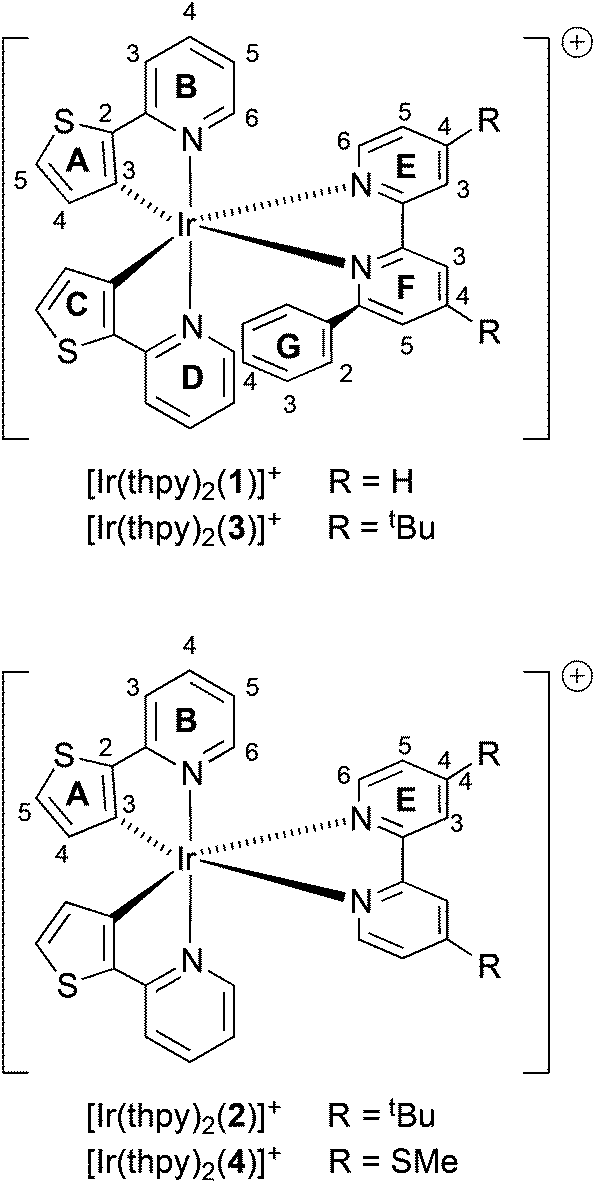
The synthesis and characterization of four iridium(III) complexes [Ir(thpy)2(N^N)][PF6] where Hthpy = 2-(2′-thienyl)pyridine and N^N are 6-phenyl-2,2′-bipyridine (1), 4,4′-di-tbutyl-2,2′-bipyridine (2), 4,4′-di-tbutyl-6-phenyl-2,2′-bipyridine (3) or 4,4′-dimethylthio-2,2′-bipyridine (4) are described. The single crystal structures of ligand 4 and the complexes containing the [Ir(thpy)2(1)]+ and [Ir(thpy)2(4)]+ cations have been determined. In [Ir(thpy)2(1)]+, the pendant phenyl ring engages in an intra-cation π-stacking interaction with one of the thienyl rings in the solid state, and undergoes hindered rotation on the NMR timescale in [Ir(thpy)2(1)]+ and [Ir(thpy)2(3)]+. The solution spectra of [Ir(thpy)2(1)][PF6] and [Ir(thpy)2(4)][PF6] show emission maxima around 640 nm and are significantly red-shifted compared with [Ir(thpy)2(2)][PF6] and [Ir(thpy)2(3)][PF6] which have structured emission bands with maxima around 550 and 590 nm. In thin films, the emission spectra of the four complexes are similar with emission peaks around 550 and 590 nm and a shoulder around 640 nm that are reminiscent of the features observed in solution. In solution, quantum yields are low, but in thin films, values range from 29% for [Ir(thpy)2(1)][PF6] to 51% for [Ir(thpy)2(4)][PF6]. Density functional theory calculations rationalize the structured emission observed for the four complexes in terms of the 3LC nature predicted for the lowest-energy triplet states that mainly involve the cyclometallated [thpy]− ligands. Support for this theoretical result comes from the observed features of the low temperature (in frozen MeCN) photoluminescence spectra of the complexes. Photoluminescence and electroluminescence spectra of the complexes in a light-emitting electrochemical cell (LEC) device configuration have been investigated. The electroluminescence spectra are similar for all [Ir(thpy)2(N^N)][PF6] complexes with emission maxima at ≈600 nm, but device performances are relatively poor probably due to the poor charge-transporting properties of the complexes.
Introduction
Cationic iridium complexes have been extensively used in electroluminescence applications including organic light-emitting diodes (OLEDs) and light-emitting electrochemical cells (LECs).1,2 LECs consist of a luminescent material that can be either a conjugated polymer with an added electrolyte in a blended structure (PLECs)3 or an ionic transition-metal complex (iTMC) that performs the roles of injection, transport and light emission (iTMC-LECs).2,4–7 The main advantages of this type of device are their simple structure, as they usually consist of a single layer processed from solution, and their insensitivity to the work function of the electrodes employed.8,9 This is a consequence of the presence of ions which migrate towards the electrodes when a bias is applied, lowering the injection barriers and allowing for efficient electron and hole injection.3,10–12 In the case of iTMC-LECs, many complexes have been evaluated mainly using iridium(III) as the metal core due to their high photoluminescence efficiencies and tunable colour emission.3,4We now describe the synthesis and characterization of a family of iridium(III) complexes of type [Ir(thpy)2(N^N)]+, in which Hthpy = 2-(2′-thienyl)pyridine and N^N are the 2,2′-bipyridine-based ligands 1–4 (Scheme 1). The cyclometallating ligand Hthpy was chosen because it produces stable, cyclometallated iridium(III) complexes,13–17 while at the same time perturbing their electronic properties with respect to those containing the more commonly employed 2-phenylpyridine (Hppy). Bernhard and coworkers18 have attempted to include [Ir(thpy)2(N^N)]+ complexes as part of a combinatorial approach to screening the photophysical behaviour of a range of complexes; however, these authors encountered synthetic problems. Across the series of N^N ligands 1–4, we are able to explore the effects of attaching: (i) electron-withdrawing SMe and electron-releasing tBu substituents, introduced to red- or blue-shift the emission of the complex, respectively, and (ii) a pendant phenyl substituent, designed to engage in face-to-face π-stacking19–24 with one of the coordinated [thpy]− ligands thereby stabilizing the excited state of the complex.
 | ||
| Scheme 1 Iridium(III) complex cations and atom labelling for NMR spectroscopic assignments. | ||
Experimental
General
1H and 13C spectra were recorded on a Bruker Avance III-500 spectrometer with chemical shifts referenced to residual solvent peaks with respect to δ(TMS) = 0 ppm. Solution absorption spectra were recorded using an Agilent 8453 spectrophotometer. FT-IR spectra were registered on a Shimadzu 8400S instrument with Golden Gate accessory for solid samples. Electrospray ionization (ESI) mass spectra were recorded on a Bruker Esquire 3000 Plus mass spectrometer. Electrochemical measurements were carried out using cyclic voltammetry and were recorded using a VersaSTAT 3 potentiostat from Princeton Applied Research with glassy carbon working and platinum auxiliary electrodes; a silver wire was used as a pseudo-reference electrode. The solvent was dry, purified MeCN and 0.1 M [nBu4N][PF6] was used as a supporting electrolyte. Cp2Fe was used as an external reference. A Biotage Initiator 8 reactor was used for the syntheses under microwave conditions. Solution quantum yields were measured with an absolute PL quantum yield spectrometer C11347 Quantaurus-QY from Hamamatsu, and lifetimes using a Compact Fluorescence lifetime Spectrometer C11367 Quantaurus-Tau from Hamamatsu; a LED light source with an excitation wavelength of 280 nm was used.Hthpy and ligand 2 were purchased from Alfa Aesar and Sigma-Aldrich, respectively, and were used as received. The dimer [Ir2(thpy)4(μ-Cl)2]13,16,18 was prepared by the general method detailed by Nonoyama.25 Compounds 1,26327 and 428 were prepared according to the literature.
![[thin space (1/6-em)]](https://www.rsc.org/images/entities/char_2009.gif) :1, followed by silica 60, 0.040–0.063 mm, CH2Cl2 changing to CH2Cl2–MeOH 100:1). [Ir(thpy)2(1)][PF6] was isolated as an orange solid (137 mg, 0.154 mmol, 84%). 1H NMR (500 MHz, CD2Cl2, 295 K) δ/ppm 8.53 (overlapping m, 2H, HE3+F3), 8.21 (t, J = 7.9 Hz, 1H, HF4), 8.14 (td, J = 8.0, 1.6 Hz, 1H, HE4), 7.84 (ddd, J = 5.4, 1.4, 0.6 Hz, 1H, HE6), 7.71 (ddd, J = 8.1, 7.4, 1.5 Hz, 1H, HD4), 7.64 (ddd, J = 8.1, 7.6, 1.5 Hz, 1H, HB4), 7.51–7.42 (overlapping m, 6H, HB3+B6+D3+D6+E5+F5), 7.30 (d, J = 4.8 Hz, 1H, HA5), 7.10 (tt, J = 7.6, 1.2 Hz, 1H, HG4), 6.93 (br t, J = 7.5 Hz, 2H, HG3), 6.89 (ddd, J = 7.4, 5.9, 1.4 Hz, 1H, HB5), 6.81 (overlapping m, 2H, HD5+C5), 6.68 (br, 2H, HG2), 5.93 (d, J = 4.8 Hz, 1H, HA4), 5.38 (d, J = 4.7 Hz, 1H, HC4). 13C NMR (126 MHz, CD2Cl2, 295 K) δ/ppm 166.5 (CF6), 165.4 (CD2), 163.9 (CB2), 157.6 (CE2), 157.4 (CF2), 154.2 (CC3), 151.5 (CE6), 150.1 (CB6), 149.5 (CD6), 147.5 (CA3), 140.2 (CF4), 140.0 (CE4), 139.3 (CB4), 139.0 (CD4), 138.8 (CG1), 136.3 (CA2), 135.5 (CC2), 131.7 (CC4), 130.7 (CF5), 130.5 (CA5), 129.8 (CG4), 129.6 (CC5), 129.5 (CA4), 128.45 (CG3), 128.4 (CE5), 127.7 (CG2), 125.5 (CE3), 124.1 (CF3), 121.0 (CB5), 119.8 (CD5), 118.9 (CB3), 118.7 (CD3). IR (solid, ν/cm−1) 3099 w, 3057 w, 2361 w, 2324 w, 1684 w, 1653 w, 1603 m, 1562 w, 1506 w, 1472 s, 1448 m, 1394 m, 1339 w, 1296 w, 1281 w, 1246 w, 1225 w, 1184 w, 1157 m, 1148 m, 1115 w, 1076 w, 1065 w, 1047 w, 1022 w, 1003 w, 989 w, 878 m, 833 s, 762 m, 716 m, 694 m, 652 w, 629 m, 555 s. UV-Vis λ/nm (ε/dm3 mol−1 cm−1) (MeCN, 1.00 × 10⁻⁵ mol dm−3) 279 (35000), 310 sh (28000), 410 (5000). Emission (MeCN, 2.50 × 10⁻⁵ mol dm−3, λexc = 410 nm) λem = 611 sh, 646 nm. ESI-MS m/z 745.2 [M − PF6]+ (base peak, calc. 745.1). Found C 45.90, H 2.77, N 6.15; C34H24F6IrN4PS2 requires C 45.89, H 2.72, N 6.30%.
000), 308 sh (28000), 330 sh (15000), 415 (6000). Emission (MeCN, 2.5 × 10⁻⁵ mol dm−3, λexc = 415 nm) λem = 543, 585, 634 sh nm. ESI MS m/z 781.3 [M − PF6]+ (base peak, calc. 781.2). Found C 46.74, H 4.02, N 5.83, C36H36F6IrN4PS2 requires C 46.70, H 3.92, N 6.05%.
000), 310 sh (30000), 410 (5000). Emission (MeCN, 2.50 × 10⁻⁵ mol dm−3, λexc = 410 nm): λem = 555 sh, 595, 638 sh nm. ESI-MS m/z 857.4 [M − PF6]+ (base peak, calc. 857.2). Found C 50.24, H 4.03, N 5.54; C42H40F6IrN4PS2 requires C 50.34, H 4.02, N 5.59%.
500), 325 sh (26000), 362 sh (14000), 415 (7000). Emission (MeCN, 2.50 × 10⁻⁵ mol dm−3, λexc = 415 nm): λem = 615 sh, 640 nm. ESI-MS m/z 761.1 [M − PF6]+ (base peak, calc. 761.1). Found C 40.41, H 3.01, N 6.86; C30H24F6IrN4PS4·0.5MeCN requires C 40.19, H 2.77, N 6.80%.
:1, followed by silica 60, 0.040–0.063 mm, CH2Cl2 changing to CH2Cl2–MeOH 100:1). [Ir(thpy)2(1)][PF6] was isolated as an orange solid (137 mg, 0.154 mmol, 84%). 1H NMR (500 MHz, CD2Cl2, 295 K) δ/ppm 8.53 (overlapping m, 2H, HE3+F3), 8.21 (t, J = 7.9 Hz, 1H, HF4), 8.14 (td, J = 8.0, 1.6 Hz, 1H, HE4), 7.84 (ddd, J = 5.4, 1.4, 0.6 Hz, 1H, HE6), 7.71 (ddd, J = 8.1, 7.4, 1.5 Hz, 1H, HD4), 7.64 (ddd, J = 8.1, 7.6, 1.5 Hz, 1H, HB4), 7.51–7.42 (overlapping m, 6H, HB3+B6+D3+D6+E5+F5), 7.30 (d, J = 4.8 Hz, 1H, HA5), 7.10 (tt, J = 7.6, 1.2 Hz, 1H, HG4), 6.93 (br t, J = 7.5 Hz, 2H, HG3), 6.89 (ddd, J = 7.4, 5.9, 1.4 Hz, 1H, HB5), 6.81 (overlapping m, 2H, HD5+C5), 6.68 (br, 2H, HG2), 5.93 (d, J = 4.8 Hz, 1H, HA4), 5.38 (d, J = 4.7 Hz, 1H, HC4). 13C NMR (126 MHz, CD2Cl2, 295 K) δ/ppm 166.5 (CF6), 165.4 (CD2), 163.9 (CB2), 157.6 (CE2), 157.4 (CF2), 154.2 (CC3), 151.5 (CE6), 150.1 (CB6), 149.5 (CD6), 147.5 (CA3), 140.2 (CF4), 140.0 (CE4), 139.3 (CB4), 139.0 (CD4), 138.8 (CG1), 136.3 (CA2), 135.5 (CC2), 131.7 (CC4), 130.7 (CF5), 130.5 (CA5), 129.8 (CG4), 129.6 (CC5), 129.5 (CA4), 128.45 (CG3), 128.4 (CE5), 127.7 (CG2), 125.5 (CE3), 124.1 (CF3), 121.0 (CB5), 119.8 (CD5), 118.9 (CB3), 118.7 (CD3). IR (solid, ν/cm−1) 3099 w, 3057 w, 2361 w, 2324 w, 1684 w, 1653 w, 1603 m, 1562 w, 1506 w, 1472 s, 1448 m, 1394 m, 1339 w, 1296 w, 1281 w, 1246 w, 1225 w, 1184 w, 1157 m, 1148 m, 1115 w, 1076 w, 1065 w, 1047 w, 1022 w, 1003 w, 989 w, 878 m, 833 s, 762 m, 716 m, 694 m, 652 w, 629 m, 555 s. UV-Vis λ/nm (ε/dm3 mol−1 cm−1) (MeCN, 1.00 × 10⁻⁵ mol dm−3) 279 (35000), 310 sh (28000), 410 (5000). Emission (MeCN, 2.50 × 10⁻⁵ mol dm−3, λexc = 410 nm) λem = 611 sh, 646 nm. ESI-MS m/z 745.2 [M − PF6]+ (base peak, calc. 745.1). Found C 45.90, H 2.77, N 6.15; C34H24F6IrN4PS2 requires C 45.89, H 2.72, N 6.30%.
000), 308 sh (28000), 330 sh (15000), 415 (6000). Emission (MeCN, 2.5 × 10⁻⁵ mol dm−3, λexc = 415 nm) λem = 543, 585, 634 sh nm. ESI MS m/z 781.3 [M − PF6]+ (base peak, calc. 781.2). Found C 46.74, H 4.02, N 5.83, C36H36F6IrN4PS2 requires C 46.70, H 3.92, N 6.05%.
000), 310 sh (30000), 410 (5000). Emission (MeCN, 2.50 × 10⁻⁵ mol dm−3, λexc = 410 nm): λem = 555 sh, 595, 638 sh nm. ESI-MS m/z 857.4 [M − PF6]+ (base peak, calc. 857.2). Found C 50.24, H 4.03, N 5.54; C42H40F6IrN4PS2 requires C 50.34, H 4.02, N 5.59%.
500), 325 sh (26000), 362 sh (14000), 415 (7000). Emission (MeCN, 2.50 × 10⁻⁵ mol dm−3, λexc = 415 nm): λem = 615 sh, 640 nm. ESI-MS m/z 761.1 [M − PF6]+ (base peak, calc. 761.1). Found C 40.41, H 3.01, N 6.86; C30H24F6IrN4PS4·0.5MeCN requires C 40.19, H 2.77, N 6.80%.
Crystallography
Data were collected on a Bruker-Nonius KappaAPEX diffractometer with data reduction, solution and refinement using the programs APEX229 and SHELXL97.30 ORTEP-type diagrams and structure analysis used Mercury v. 3.0.31,32585 reflections, 10602 unique, Rint = 0.0337. Refinement of 9581 reflections (578 parameters) with I > 2σ(I) converged at final R1 = 0.0262 (R1 all data = 0.0309), wR2 = 0.0519 (wR2 all data = 0.0541), gof = 1.072. CCDC 949192.
![[1 with combining macron]](https://www.rsc.org/images/entities/char_0031_0304.gif) , a = 9.6280(8), b = 12.2606(10), c = 13.9602(12) Å, α = 94.621(4), β = 103.208(4), γ = 95.953(4)°, U = 1586.4(2) Å3, Z = 2, Dc = 1.863 Mg m−3, μ(Mo-Kα) = 4.459 mm−1, T = 123 K. Total 43407 reflections, 8611 unique, Rint = 0.0307. Refinement of 8283 reflections (433 parameters) with I > 2σ(I) converged at final R1 = 0.0183 (R1 all data = 0.0196), wR2 = 0.0473 (wR2 all data = 0.0498), gof = 1.095. CCDC 949190.
, a = 9.6280(8), b = 12.2606(10), c = 13.9602(12) Å, α = 94.621(4), β = 103.208(4), γ = 95.953(4)°, U = 1586.4(2) Å3, Z = 2, Dc = 1.863 Mg m−3, μ(Mo-Kα) = 4.459 mm−1, T = 123 K. Total 43407 reflections, 8611 unique, Rint = 0.0307. Refinement of 8283 reflections (433 parameters) with I > 2σ(I) converged at final R1 = 0.0183 (R1 all data = 0.0196), wR2 = 0.0473 (wR2 all data = 0.0498), gof = 1.095. CCDC 949190.
Photophysics
Room and low temperature solutions and thin film photoluminescence spectra and quantum yields were measured with a Hamamatsu C9920-02 Absolute PL Quantum Yield Measurement System. The system is made up of an excitation light source, consisting of a xenon lamp linked to a monochromator, an integration sphere and a multi-channel spectrometer.Device preparation and characterization
Poly(3,4-ethylenedioxythiophene):polystyrenesulfonate (PEDOT:PSS) was purchased from Hereaus and solvents used were obtained from Aldrich. Indium tin oxide (ITO)-coated glass plates (15 Ω □−1) were patterned using conventional photolithography (obtained from Naranjosubstrates, http://www.naranjosubstrates.com). The substrates were extensively cleaned using sonification in subsequently water-soap, water and 2-propanol baths. After drying, the substrates were placed in a UV-ozone cleaner (Jelight 42-220) for 20 minutes.The electroluminescent devices were prepared as follows. Transparent thin films of the complexes with the ionic liquid (1-butyl-3-methylimidazolium hexafluorophosphate) in a molar ratio 4 to 1 were obtained by spinning from acetonitrile solutions using concentrations of 20 mg mL−1 at 1000 rpm for 20 seconds. The resulting films had a thickness of 80 nm. Prior to the deposition of the emitting layer, a 90 nm layer of PEDOT:PSS was deposited to increase the device preparation yield. The thickness of the films was determined using an Ambios XP1 profilometer. After spinning the organic layers, the samples were transferred to an inert atmosphere glovebox (<0.1 ppm O2 and H2O, MBraun) and dried on a hot plate at 100 °C for 1 hour. Aluminum metal electrodes (70 nm) were thermally evaporated using a shadow mask under a vacuum (<1 × 10⁻⁶ mbar) using an Edwards Auto500 evaporator integrated into an inert atmosphere glovebox. Lifetime data were obtained by applying pulsed currents and monitoring the voltage and simultaneously the luminance by a True Colour Sensor MAZeT (MTCSICT Sensor) using a Lifetime Test System designed by BoTEST (Botest OLT OLED Lifetime-Test System).
Computational details
Density functional calculations (DFT) were carried out with the C.01 revision of the Gaussian 09 program package33 using Becke's three-parameter B3LYP exchange-correlation functional34,35 together with the 6-31G** basis set for C, H, N, and S,36 and the “double-ζ” quality LANL2DZ basis set for the Ir element.37 The geometries of the singlet ground states and of the lowest-energy triplet states were fully optimized without imposing any symmetry restriction. The geometry of the triplet state was calculated at the spin-unrestricted UB3LYP level with a spin multiplicity of 3. All the calculations were performed in the presence of the solvent (acetonitrile). Solvent effects were considered within the self-consistent reaction field (SCRF) theory using the SMD keyword that performs a polarized continuum model (PCM)38–40 calculation using the solvation model of Truhlar et al.41 The SMD solvation model is based on the polarized continuous quantum chemical charge density of the solute (the “D” in the name stands for “density”). Time-dependent DFT (TD-DFT) calculations of the lowest-lying 20 triplets were performed in the presence of the solvent at the minimum-energy geometry optimized for the ground state.Results and discussion
Structure of ligand 4
Ligands 1–4 are known in the literature (see the Experimental section) but the single crystal structure of 4 has not been reported. Crystals were grown from a CDCl3 solution of 4; the molecular structure is depicted in Fig. 1a. The bpy domain adopts the expected trans-conformation. The S–CMe bonds lie in the plane of the centrosymmetric molecule, and the S–C bond distances (S1–C6 = 1.7944(14), S1–C3 = 1.7490(13) Å) along with the angle C6–S1–C3 = 104.30(6)° indicate sp3 hybridized S with negligible extension of the π-electron density from the pyridine ring into the S1–C3 bond. Molecules are stacked in domains which are related to one another in a herring-bone pattern (Fig. 1b). The packing interactions involve face-to-face π-stacking of pyridine rings42 containing N1 and N1ii (ii = −x, 1 − y, −z, distance between planes = 3.23 Å, distance between centroids = 3.92 Å), in addition to CMe⋯N, CHpy⋯S and CHpy⋯π close contacts.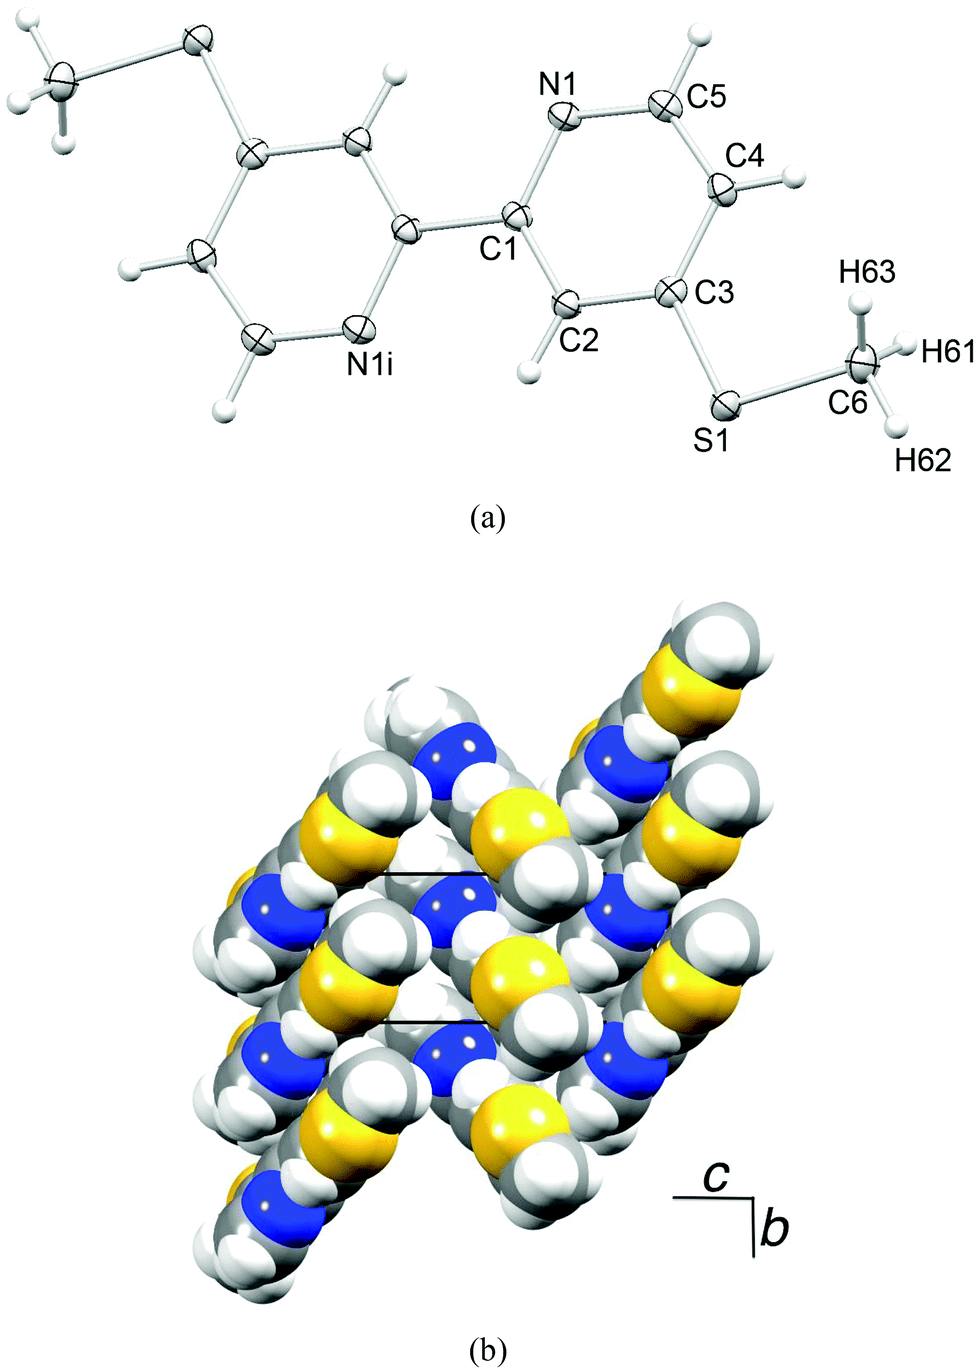 | ||
| Fig. 1 (a) Structure of compound 4 (ellipsoids plotted at the 50% probability level). Symmetry code i = −x, −y, −z. (b) Packing of molecules of 4. | ||
Synthesis and characterization of [Ir(thpy)2(N^N)][PF6] (N^N = 1–4)
The complexes [Ir(thpy)2(N^N)][PF6] were prepared by the established procedure43 of reacting a [Ir(C^N)2(μ-Cl)2] dimer (in this case [Ir2(thpy)4(μ-Cl)2]13,16,18) with two equivalents of ligands 1, 2, 3 or 4 followed by exchange of the counter-ion (Scheme 2). Yields ranged from 64 to 84%. The base (and only) peak envelope in the ESI mass spectrum of each complex corresponded to [Ir(thpy)2(N^N)]+, and the isotope pattern matched that simulated. The solid-state IR spectrum of each complex exhibited a strong absorption close to 830 cm−1 consistent with the presence of the hexafluoridophosphate ion.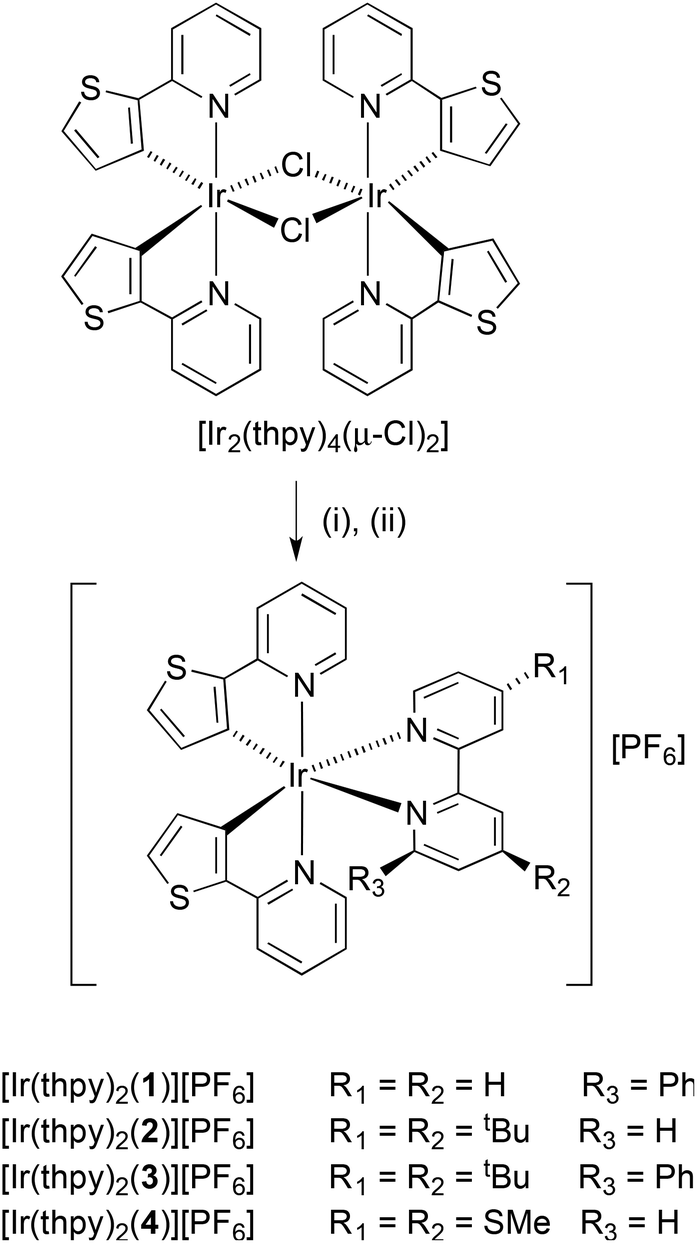 | ||
| Scheme 2 Synthetic method for the preparation of the complexes. Step (i) = 1, 2, 3 or 4 in MeOH, 2 h at 120 °C in microwave reactor; step (ii) excess NH4PF6. | ||
Solution 1H and 13C NMR spectra were assigned by a combination of DEPT, COSY, NOESY, HMQC and HMBC techniques. The cations [Ir(thpy)2(2)]+ and [Ir(thpy)2(4)]+ are C2-symmetric (Scheme 1). However, the introduction of the pendant phenyl ring in the N^N ligand in 1 and 3 lowers the symmetry of the complex, and, in [Ir(thpy)2(1)]+ and [Ir(thpy)2(3)]+, the [thpy]− ligands are non-equivalent. We have adopted a ring labelling system (Scheme 1) that permits comparison of chemical shift data in the four complexes. Fig. 2 compares the aromatic regions of the room temperature 1H NMR spectra of [Ir(thpy)2(2)][PF6] and [Ir(thpy)2(4)][PF6]. Doublets for the thienyl protons (HA4 and HA5) were distinguished by a NOESY cross peak between the resonances for HA4 and HE6. Structural data for [Ir(thpy)2(4)][PF6] (see below) show that the HE6⋯HA4 separation is significantly less than HE6⋯HA5 (av. 3.6 versus 4.6 Å), and the chelating modes of the ligands indicate that these distances are approximately valid in solution. As expected, on going from [Ir(thpy)2(2)]+ to [Ir(thpy)2(4)]+, only the signals for the bpy domain are noticeably affected by the change from the tBu to SMe substituent. The presence of the pendant phenyl ring in [Ir(thpy)2(1)][PF6] and [Ir(thpy)2(3)][PF6] desymmetrizes the spectra. Signals for protons in ring C (Scheme 1) were distinguished from those in ring A starting with the observation of a NOESY cross-peak between signals for HA4 and HE6, and HG4 and HC5. A preliminary crystallographic study of [Ir(thpy)2(3)][PF6] (see below) established that the phenyl ring (ring G in Scheme 1) lies over one of the cyclometallated thienyl rings (defined as ring C). This results in the protons of these rings exhibiting close, through-space separations. Ring D was distinguished from ring B by the observation of a NOESY cross-peak between resonances for HG2 and HD6. At room temperature in CD2Cl2, signals for phenyl protons HG2 (δ 6.67 and 6.69 ppm in [Ir(thpy)2(1)][PF6] and [Ir(thpy)2(3)][PF6], respectively) and HG3 (δ 6.92 and 6.93 ppm, respectively) are broad as a consequence of hindered rotation of ring G on the NMR timescale. Cooling a CD2Cl2 solution of [Ir(thpy)2(3)][PF6] to 240 K leads to a collapse of these signals and, at 210 K, a set of four signals for the ortho and meta-protons of ring G is observed (Fig. 3). These were assigned from the COSY spectrum at 210 K. The data are reminiscent of those obtained for related complexes.24,44 It is noteworthy that, despite the complexity of the NMR spectra for [Ir(thpy)2(1)][PF6] and [Ir(thpy)2(3)][PF6], consistent trends in the 13C NMR chemical shifts for specific 13C nuclei across the full set of [Ir(thpy)2(N^N)][PF6] compounds can be used to verify the accuracy of the spectroscopic assignments.
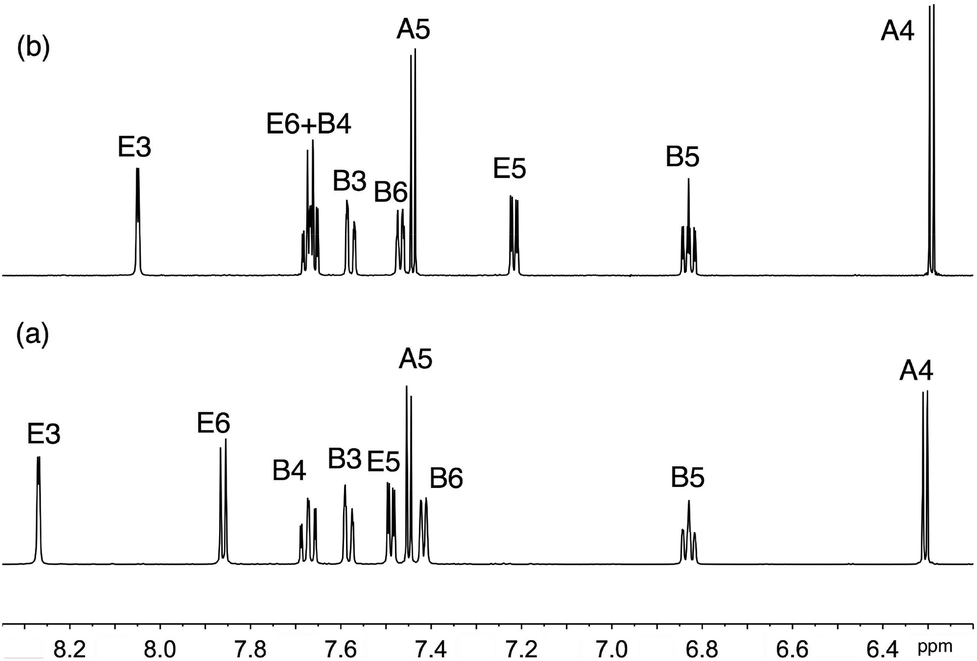 | ||
| Fig. 2 Aromatic region of the 500 MHz 1H NMR spectrum of CD2Cl2 solutions of (a) [Ir(thpy)2(2)][PF6] and (b) [Ir(thpy)2(4)][PF6]. | ||
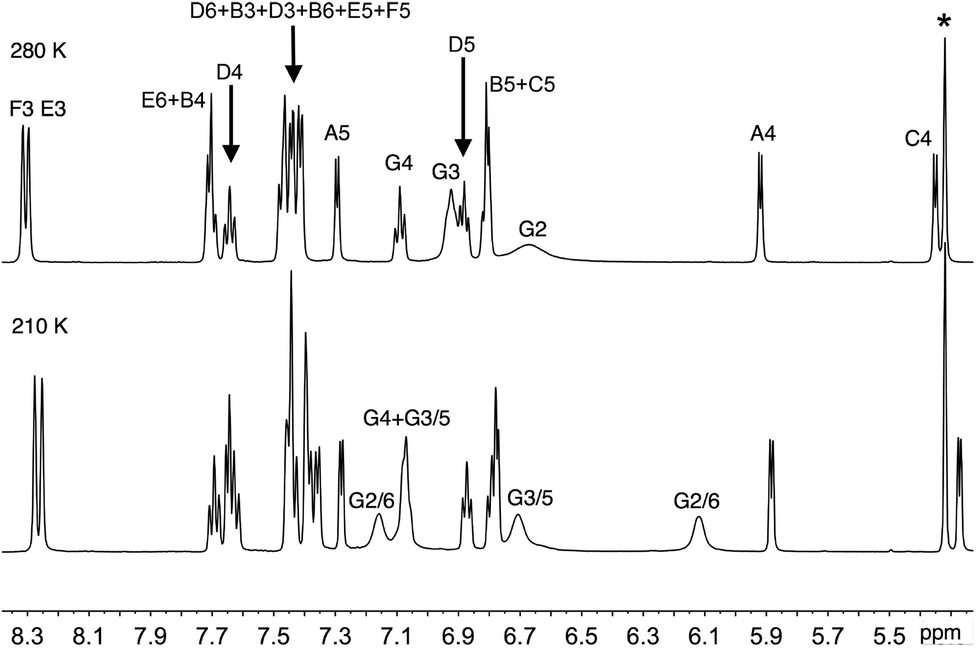 | ||
| Fig. 3 Aromatic region of the 500 MHz 1H NMR spectrum of a CD2Cl2 solution of [Ir(thpy)2(3)][PF6] at 280 and 210 K. (* = residual solvent). | ||
X-Ray quality crystals of [Ir(thpy)2(1)][PF6] were grown from a CH2Cl2 solution of the complex. Fig. 4a shows the structure of the [Ir(thpy)2(1)]+ cation and the important bond parameters are given in the caption; bond lengths and angles within the coordination sphere of Ir1 are unremarkable. The structural determination confirms that cyclometallation has occurred; previous structural studies have shown that neutral Hthpy can bind to iridium(I) as an N,S-donor,15 while [thpy]− coordinates to iridium(III) as a C,N-donor.13–15 Atom Ir1 is octahedrally sited and the N-donors of the cyclometallated [thpy]− ligands are mutually trans. Each bidentate [thpy]− ligand is planar, but in contrast, the bpy unit of ligand 1 is twisted (the angle between the planes of the pyridine rings = 14.1°). The latter is most likely a consequence of the face-to-face π-stacking of the 6-phenyl substituent in 1 over the thienyl ring containing atom S2 (Fig. 4b). The phenyl ring is twisted 70.1° with respect to the pyridine ring to which it is bonded, and sits over the thienyl ring so that the distance between the centroids of the two rings is 3.55 Å; the angle between the planes of the rings is 12.1°. This π-stacking interaction within the coordination sphere of the iridium(III) centre adds to the growing number of such examples.19–24 The centrosymmetric pair of cations in the unit cell pack with the pyridine rings containing N2 and N2i (symmetry code i = 1 − x, 1 − y, 1 − z) in a face-to-face arrangement. However, the distance between the ring-planes (4.03 Å) is too great for this to be a significant stacking interaction. Dominant packing forces involve C–H⋯S, C–H⋯F and C–H⋯πpyridine interactions.
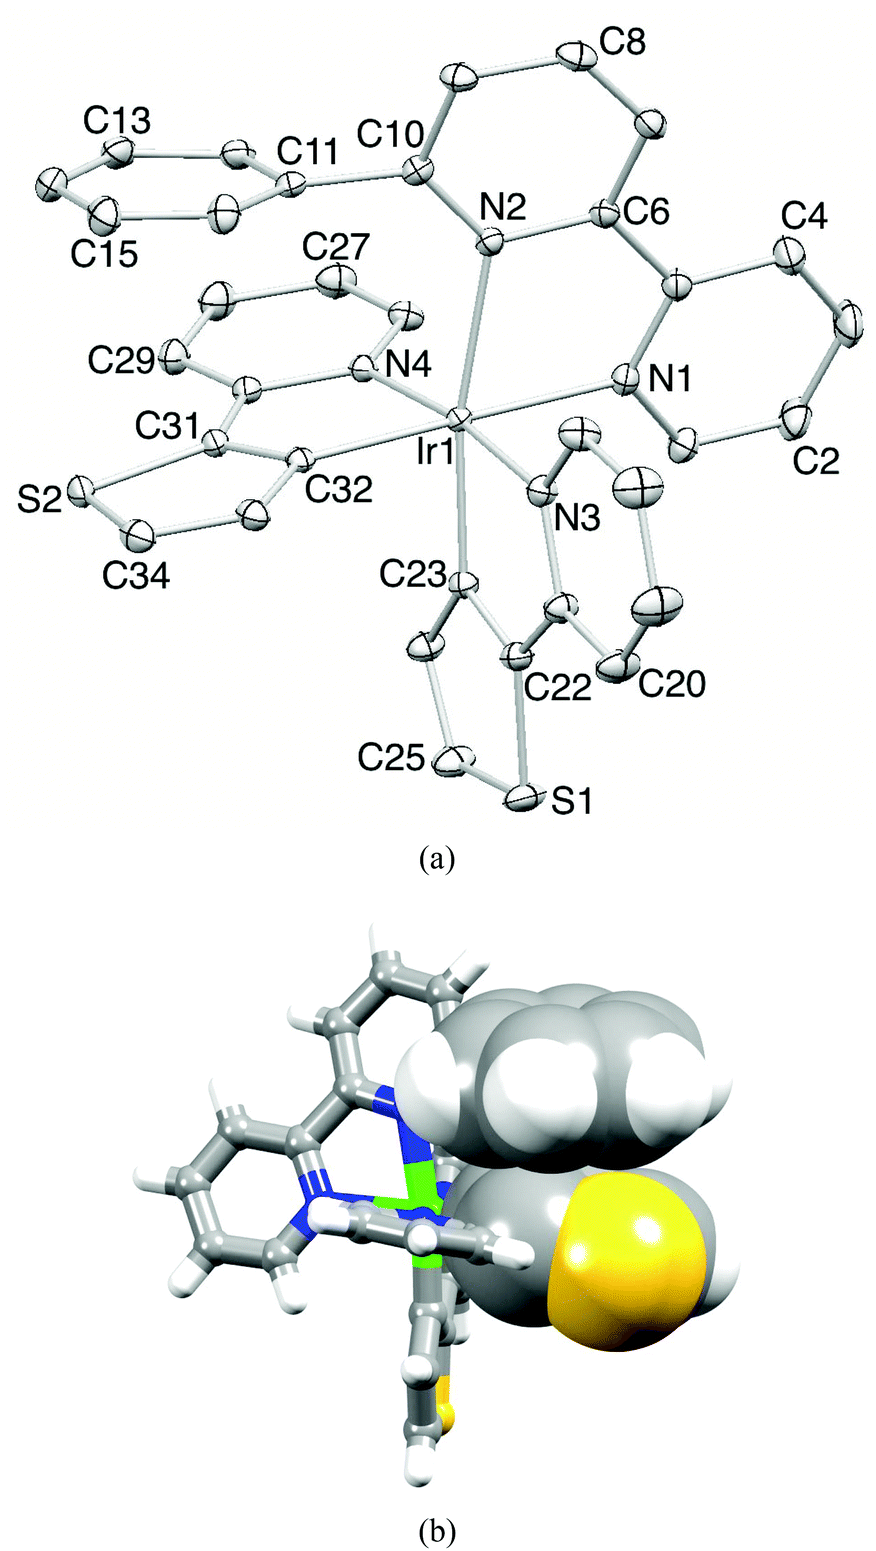 | ||
| Fig. 4 (a) Structure of the [Ir(thpy)2(1)]+ cation in [Ir(thpy)2(1)][PF6]; ellipsoids plotted at the 40% probability level and H atoms omitted. Selected bond distances and angles: Ir1–C23 = 1.991(2), Ir1–C32 = 2.010(2), Ir1–N4 = 2.0430(18), Ir1–N3 = 2.0703(18), Ir1–N1 = 2.1260(18), Ir1–N2 = 2.1875(18) Å; N1–Ir1–N2 = 76.15(7), C32–Ir1–N4 = 80.11(8), C23–Ir1–N3 = 79.98(8), N4–Ir1–N3 = 172.06(7), C25–S1–C22 = 90.75(11), C34–S2–C31 = 90.45(11)°. (b) Face-to-face π-stacking of the phenyl ring of ligand 1 and one thienyl unit. | ||
Single crystals of 2{[Ir(thpy)2(4)][PF6]}·CH2Cl2 were grown from a dichloromethane solution of the complex. The structure of the [Ir(thpy)2(4)]+ cation is depicted in Fig. 5. The [thpy]− ligand containing atoms N4 and S4 is disordered and has been modelled over two sites with occupancies of 81 and 19%; only the major occupancy sites are shown in Fig. 5. Atom Ir1 in the [Ir(thpy)2(4)]+ cation is in an octahedral environment with the anticipated trans-arrangement of the two N-donors of the cyclometallated [thpy]− ligands. Each bidentate ligand is essentially planar. As in the free ligand 4, the S–CMe bonds lie in the plane of the bpy unit (torsion angles C11–S1–C3–C2 and C12–S2–C8–C9 = –4.3(2) and 1.7(2)°, respectively). The [PF6]− ion is disordered and has been modelled over two sites of occupancies 69 and 31%. A half-occupancy CH2Cl2 solvate molecule is disordered across a special position. Packing interactions involve primarily CHpy⋯Sthienyl and CH⋯F contacts; weak CH⋯π and SMe⋯π contacts contribute, but are not optimally directed. Cations pack into 2-dimensional sheets separated by sheets of [PF6]− anions (Fig. 6). Disordering of the solvent molecules makes it difficult to comment meaningfully on their role in the lattice.
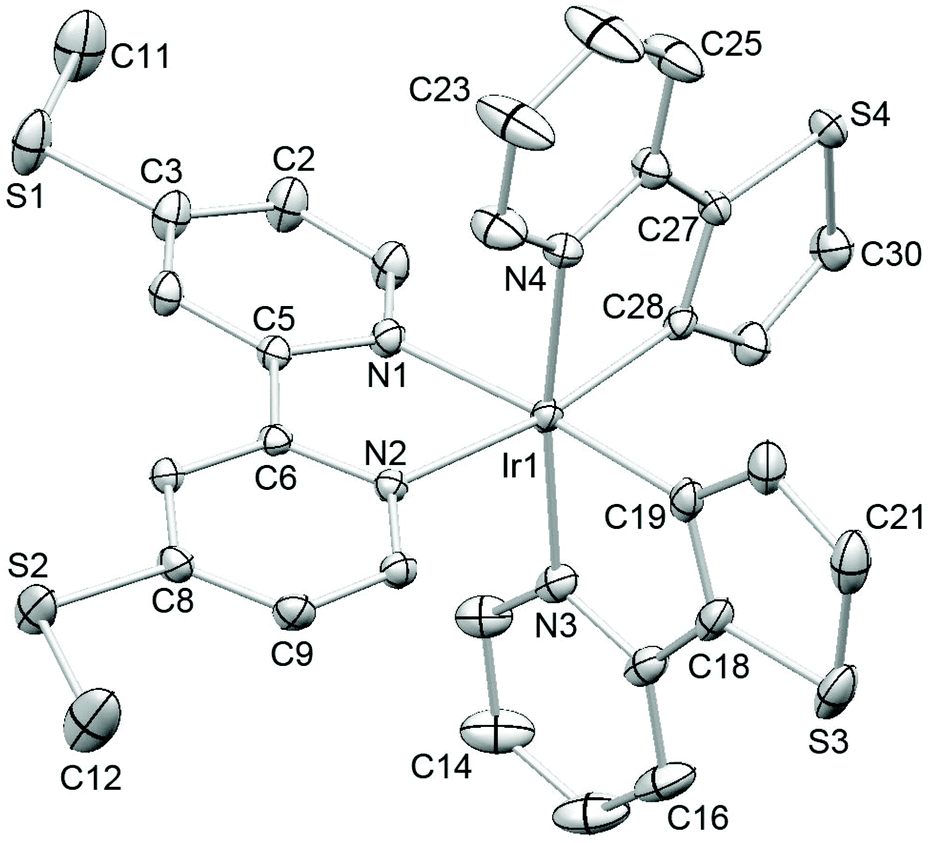 | ||
| Fig. 5 Structure of the [Ir(thpy)2(4)]+ cation in 2{[Ir(thpy)2(4)][PF6]}·CH2Cl2 (ellipsoids plotted at the 40% probability level); H atoms are omitted and only the major ligand occupancy (see text) is shown. Selected bond parameters: Ir1–N1 = 2.1294(15), Ir1–N2 = 2.1171(14), Ir1–N3 = 2.0601(16), Ir1–C19 = 2.0060(19), Ir1–N4 = 2.094(2), Ir1–C28 = 2.005(2), S1–C3 = 1.737(2), S1–C11 = 1.799(2), S2–C8 = 1.7421(18), S2–C12 = 1.801(3), S3–C21 = 1.709(3), S3–C18 = 1.725(2), S4–C30 = 1.719(3), S4–C27 = 1.723(2) Å; N2–Ir1–N1 = 76.47(5), C28–Ir1–N4 = 78.84(9), C19–Ir1–N3 = 80.18(7), N3–Ir1–N4 = 171.65(8), C3–S1–C11 = 102.99(11), C8–S2–C12 = 102.16(11), C21–S3–C18 = 90.16(11), C30–S4–C27 = 90.55(12)°. | ||
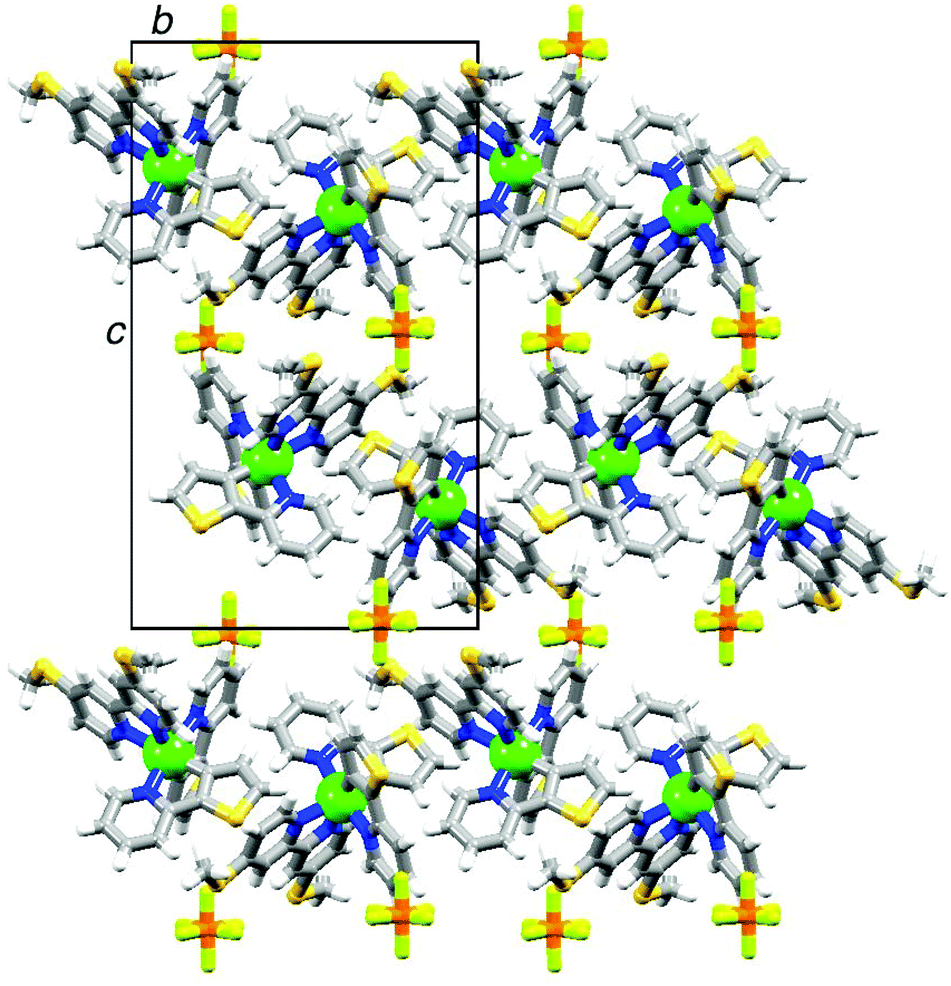 | ||
| Fig. 6 The packing in 2{[Ir(thpy)2(4)][PF6]}·CH2Cl2 consists of alternating sheets of cations and anions; each sheet lies in the ab-plane. | ||
Crystals of [Ir(thpy)2(3)][PF6] were obtained from a CH2Cl2 solution of the complex into which Et2O was allowed to diffuse. Unfortunately, the crystals grew as thin plates that were heavily twinned and a dataset of high quality could not be obtained. However, preliminary crystallographic data were sufficient to confirm the gross structural features of the [Ir(thpy)2(3)]+ cation, i.e. the octahedral coordination environment of the iridium(III) centre, which is bound by two cyclometallated [thpy]− ligands and chelating ligand 3. The structure also confirms the fact that the phenyl ring in ligand 3 engages in efficient face-to-face π-stacking with one of the cyclometallated thienyl rings.
Electrochemistry
Cyclic voltammetric data for [Ir(thpy)2(N^N)][PF6] (N^N = 1–4) are given in Table 1; electrochemical processes are reversible or near-reversible unless otherwise noted. The quasi-reversible oxidation observed in each case arises from an iridium-centred process, with a substantial contribution from the C^N ligands. The second oxidation process is assigned to oxidation of the [thpy]− ligands. The values for Eox1/2 compare with +0.82 V reported for [Ir(thpy)2(bpy)][PF6] (quoted as +1.20 V vs. SCE in CH2Cl2).16 In contrast to the oxidation processes which occur at similar potentials, the effect of the substituents is more pronounced on the first reduction process assigned to reduction of the bpy ligand. Ered1/2 shifts to more/less negative potentials upon the attachment of tBu/SMe groups and, as a consequence, [Ir(thpy)2(4)][PF6] presents an electrochemical gap similar to [Ir(thpy)2(1)][PF6] and slightly smaller than [Ir(thpy)2(2)][PF6] and [Ir(thpy)2(3)][PF6] (Table 1).| Complex | E ox1/2/V | E red1/2/V | ΔE1/2/V |
|---|---|---|---|
| [Ir(thpy)2(1)]+ | +0.72qr, +1.21irr | −1.77, −2.43irr | 2.49 |
| [Ir(thpy)2(2)]+ | +0.74qr, +1.26irr | −1.85, −2.51irr | 2.59 |
| [Ir(thpy)2(3)]+ | +0.73qr, +1.28irr | −1.82, −2.42irr | 2.55 |
| [Ir(thpy)2(4)]+ | +0.74qr, +1.28irr | −1.73, −2.30irr | 2.47 |
Solution photophysical behaviour of the complexes
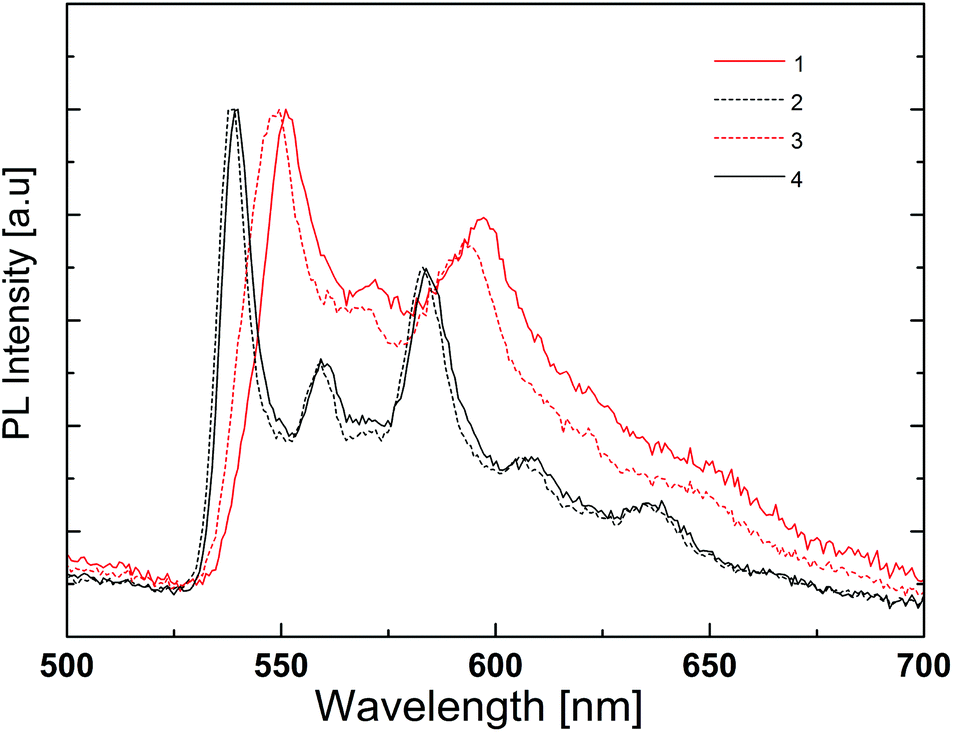
The electronic absorption spectra in acetonitrile solution of the four [Ir(thpy)2(N^N)][PF6] complexes are shown in Fig. 7. The spectra are dominated by intense, high-energy bands arising from π* ← π and, in [Ir(thpy)2(4)][PF6], π* ← n transitions that extend into the visible region. The low intensity absorption observed for each complex between 410 and 415 nm is assigned to an MLCT transition. Excitation into the latter band gives rise to the emission spectra shown in Fig. 8. The emission maxima are collected in Table 2 and can be compared with that measured at 612 nm for [Ir(thpy)2(bpy)]+.16 The introduction of the SMe substituents results in a red-shift to 640 nm in the emission of [Ir(thpy)2(4)][PF6]. In contrast, introducing the electron-releasing tBu substituents produces a blue-shift to 543/585 nm for [Ir(thpy)2(2)]+. On going from [Ir(thpy)2(2)]+ to [Ir(thpy)2(3)]+ we observe a less pronounced vibronic structure17 in the emission spectrum (Fig. 8); however, there is little difference in the emission maxima (Table 2). This is consistent with the trend observed on going from [Ir(ppy)2(bpy)]+ to [Ir(ppy)2(1)]+, for which λem slightly red-shifts from 590 to 595 nm on introducing the 6-phenyl substituent on the bpy ligand.20 In contrast, there is a significant shift in λem from 612 nm to 646 nm on going from [Ir(thpy)2(bpy)]+ to [Ir(thpy)2(1)]+ that in principle has no obvious justification. The emission spectrum of [Ir(thpy)2(1)]+ is indeed similar to that recorded for [Ir(thpy)2(4)]+ and shows a quite different aspect compared to [Ir(thpy)2(2)]+ and [Ir(thpy)2(3)]+ (Fig. 8). The different appearance of the spectra seems to originate from the different intensity of the spectral features recorded around 550, 590–610 and 640 nm that are present for the four complexes. The low quantum yields measured in solution for [Ir(thpy)2(N^N)][PF6] with N^N = 1–4 (Table 2) are consistent with data for [Ir(thpy)2(bpy)][PF6] and [Ir(thpyR)2(bpy)][PF6] (R = 5-Me or 5-CHO).16 | ||
| Fig. 7 Electronic absorption spectra of MeCN solutions of [Ir(thpy)2(N^N)][PF6] (N^N = 1–4), (1.00 × 10⁻⁵ or 2.50 × 10⁻⁵ mol dm−3). | ||
 | ||
| Fig. 8 Normalized emission spectra of MeCN solutions of [Ir(thpy)2(N^N)][PF6] (N^N = 1–4), (2.50 × 10⁻⁵ mol dm−3) (λexc, see Table 2). | ||
| Solutiona | Diluted filmb | |||||
|---|---|---|---|---|---|---|
| Complex | λ exc/nm | λ maxem/nm | τ/ns | Φ/% | λ maxem/nm | Φ/% |
| a Degassed MeCN solution (2.50 × 10⁻⁵ mol dm−3). b 5% by weight in a polymethylmethacrylate (PMMA) matrix. | ||||||
| [Ir(thpy)2(1)]+ | 410 | 646 | 19 | ≤1.0 | 553/592 | 29 |
| [Ir(thpy)2(2)]+ | 415 | 543, 585 | 81 | ≤1.0 | 542/585 | 42 |
| [Ir(thpy)2(3)]+ | 410 | 555, 595 | 64 | ≤1.0 | 553/592 | 35 |
| [Ir(thpy)2(4)]+ | 415 | 640 | 33 | ≤1.0 | 542/585 | 51 |
Theoretical calculations
To gain insight into the electronic and optical properties of the [Ir(thpy)2(N^N)][PF6] (N^N = 1–4) complexes, a combined DFT/TD-DFT theoretical investigation was undertaken at the B3LYP/(6-31G**+LANL2DZ) level on the [Ir(thpy)2(N^N)]+ cations in the presence of the solvent (acetonitrile) (see the Experimental section for full computational details). The [Ir(thpy)2(bpy)]+ cation was also calculated at the same computational level for comparison purposes.The geometry of the complexes in their ground electronic state (S0) was fully optimized without imposing any symmetry constraint. Calculations correctly reproduce the near-octahedral coordination of the Ir metal observed in the X-ray structures and predict geometric parameters in good accord with the experimental data. The [thpy]− ligands are essentially planar and the average value computed for the bite angle with the iridium centre (79.5°) agree well with the X-ray values determined for [Ir(thpy)2(1)]+ and [Ir(thpy)2(4)]+ (78.8–80.2°). The bpy domain is predicted to be close to planar in [Ir(thpy)2(2)]+ and [Ir(thpy)2(4)]+, but presents a twist angle around the central inter-annular bond of 18.4 and 20.9° for [Ir(thpy)2(1)]+ and [Ir(thpy)2(3)]+, respectively. The distortion arises from the presence of the pendant phenyl ring attached in 6-position. These twist angles are slightly larger than the single crystal X-ray value measured in [Ir(thpy)2(1)]+ (14.1°). Calculations also reproduce the intra-cation face-to-face π-stacking of the pendant phenyl substituent with the adjacent thienyl ring of the [thpy]− ligand. The inter-centroid distance calculated between the two rings for [Ir(thpy)2(1)]+ (3.77 Å) and [Ir(thpy)2(3)]+ (3.76 Å) slightly overestimate the X-ray value obtained for [Ir(thpy)2(1)]+ (3.55 Å) likely due to the packing forces acting in the crystal. The pendant phenyl ring in [Ir(thpy)2(1)]+ and [Ir(thpy)2(3)]+ is twisted by 61.9 and 60.4°, respectively, with respect to the pyridine ring to which it is bonded. The S–CMe bonds in [Ir(thpy)2(4)]+ are predicted to lie in the plane of the bpy unit (torsion angles C11–S1–C3–C2 and C12–S2–C8–C9 = −1.5 and 2.8°, respectively) in good accord with X-ray data.
Fig. 9 displays the atomic orbital compositions calculated for the highest-occupied (HOMO and HOMO−1) and lowest-unoccupied (LUMO to LUMO+2) molecular orbitals of the non-substituted [Ir(thpy)2(bpy)]+ cation. An identical distribution of the frontier molecular orbitals is obtained for [Ir(thpy)2(N^N)]+ (N^N = 1–4) complexes. Analogous to that predicted for ppy-based cyclometallated Ir-iTMCs,2,23,24,45,46 the HOMO is composed of a mixture of Ir(III) dπ orbitals (t2g) and thienyl π orbitals with some contribution from the pyridine rings of the cyclometallating ligands, whereas the LUMO corresponds to the π* LUMO of the ancillary bpy ligand. As a consequence, substitution of the N^N ligand leaves the HOMO mostly unaffected and produces a larger effect in the LUMO (Fig. 9). The energy of the LUMO increases from −2.16 eV in [Ir(thpy)2(bpy)]+ to −1.97 eV in [Ir(thpy)2(3)]+ due to the combined effect of the tbutyl and phenyl substituents attached to the bpy domain. These trends correlate well with those observed for the first oxidation and reduction potentials.
 | ||
| Fig. 9 Schematic diagram showing the electron density contours (0.03 e bohr−3) and energies calculated for the highest occupied and lowest unoccupied molecular orbitals of [Ir(thpy)2(bpy)]+; hydrogen atoms have been omitted. HOMO and LUMO energies for [Ir(thpy)2(N^N)]+ complexes are given in the table. | ||
The HOMO−1 and the LUMO+1/LUMO+2 of complexes [Ir(thpy)2(N^N)]+ (N^N = bpy and 1–4) are localized over the [thpy]− ligands and are calculated to lie ∼0.5 eV below and above the HOMO and LUMO, respectively (see Fig. 9 for [Ir(thpy)2(bpy)]+ as a representative example). This suggests that the lowest-energy triplet state should, in principle, originate from the HOMO → LUMO excitation, which gives rise to an electron transfer from the Ir-thpy environment to the diimino ligand. To investigate this hypothesis and the nature of the emitting excited state, the low-lying triplet states (Tn) were calculated at the optimized geometry of the ground state (S0) using the time-dependent DFT (TD-DFT) approach. Table 3 lists the vertical excitation energies and the electronic descriptions computed for the three first triplet excited states. TD-DFT calculations predict the T1, T2 and T3 states at similar energies, between 2.34 and 2.67 eV above the ground state for all the complexes, the T4 state lying at 3.00–3.10 eV. Unexpectedly, the T1 and T2 states are mainly defined by transitions from the HOMO−1 and HOMO to the LUMO+1 and LUMO+2, and have to be described as ligand-centred (3LC) triplets, since all these orbitals involve the C^N ligands, with some metal-to-ligand charge transfer (3MLCT) character due to the participation of the Ir core in the HOMO (Fig. 9). The T3 state lies slightly higher in energy (0.10–0.27 eV) and mainly results from the HOMO → LUMO excitation (∼90%). It corresponds to a mixture of metal-to-ligand and ligand-to-ligand charge transfer (3MLCT/3LLCT) character.
| N^N | State | E (eV) | Monoexcitationsa | Natureb | Descriptionb |
|---|---|---|---|---|---|
| a H and L denote HOMO and LUMO, respectively. b The nature and description of the monoexcitations are the same for all the complexes and have been only quoted for [Ir(thpy)2(bpy)]+. | |||||
| bpy | T1 | 2.37 | H → L+1 (62) | dπ(Ir) + πC^N → π*C^N | 3LC/3MLCT |
| H−1 → L+2 (23) | πC^N → π*C^N | 3LC | |||
| T2 | 2.41 | H → L+2 (55) | dπ(Ir) + πC^N → π*C^N | 3LC/3MLCT | |
| H−1 → L+1 (33) | πC^N → π*C^N | 3LC | |||
| T3 | 2.51 | H → L (94) | dπ(Ir) + πC^N → π*N^N | 3MLCT/3LLCT | |
| 1 | T1 | 2.34 | H → L+1 (50) | ||
| H−1 → L+2 (19) | |||||
| T2 | 2.40 | H → L+2 (42) | |||
| H−1 → L+1 (35) | |||||
| T3 | 2.57 | H → L (87) | |||
| 2 | T1 | 2.37 | H → L+1 (64) | ||
| H−1 → L+2 (24) | |||||
| T2 | 2.41 | H → L+2 (56) | |||
| H−1 → L+1 (33) | |||||
| T3 | 2.63 | H → L (96) | |||
| 3 | T1 | 2.34 | H → L+1 (49) | ||
| H−1 → L+2 (20) | |||||
| T2 | 2.39 | H → L+2 (43) | |||
| H−1 → L+1 (34) | |||||
| T3 | 2.67 | H → L (86) | |||
| 4 | T1 | 2.37 | H → L+1 (65) | ||
| H−1 → L+2 (23) | |||||
| T2 | 2.41 | H → L+2 (55) | |||
| H−1 → L+1 (33) | |||||
| T3 | 2.58 | H → L (96) | |||
The three lowest triplet states were further examined by optimizing their geometries using the spin-unrestricted UB3LYP approach. Table 4 collects the adiabatic energy differences (electronic energy difference between the ground and the excited state at their respective equilibrium geometries) calculated with respect to the ground state, and Fig. 10 displays the relative energy and electronic nature of the states for [Ir(thpy)2(2)]+ as a representative example. After full-geometry relaxation, the T1 and T2 states degenerate (2.2379 and 2.2382 eV above S0, respectively) and remain lower in energy than the T3 state (ΔE(T3 − S0) = 2.42 eV). The unpaired-electron spin-density distribution computed for the optimized geometry of T1 in [Ir(thpy)2(2)]+ (Ir: 0.15e, thpy1: 1.83e, thpy2: 0.01e, 2: 0.01e) confirms the dominant 3LC character of this state with a small contribution from the metal (Fig. 10). The T2 state shows the same electronic nature but the spin density is localized on the other thpy ligand. The spin density calculated for the T3 state (Ir: 0.41e, thpy1: 0.29e, thpy2: 0.29e, 2: 1.01e) perfectly matches the topology of the HOMO → LUMO excitation (compare Fig. 9 and 10) and corroborates the mixed 3MLCT/3LLCT character of this state. An identical scenario is found for the complexes with N^N = bpy, 1, 3 and 4. The relative ordering of the lowest-energy triplets was further investigated by performing geometry optimizations at the TD-DFT level. At this level of theory, the 3MLCT/3LLCT triplet (T3) of [Ir(thpy)2(2)]+ is confirmed to lie 0.18 eV above the 3LC T1 and T2 states.
 | ||
| Fig. 10 Schematic representation of the ground state (S0, blue curve) and the first triplet states (T1 and T3, red curves, T2 is mostly degenerate with T1) computed for [Ir(thpy)2(2)]+ with their respective spin-density distributions (0.003 e bohr−3). | ||
| Complex | ΔE (T1 − S0)/eV | ΔE (T3 – S0)/eV | E em (T1)/nm |
|---|---|---|---|
| [Ir(thpy)2(bpy)]+ | 2.24 | 2.27 | 641 |
| [Ir(thpy)2(1)]+ | 2.21 | 2.29 | 652 |
| [Ir(thpy)2(2)]+ | 2.24 | 2.42 | 641 |
| [Ir(thpy)2(3)]+ | 2.21 | 2.35 | 650 |
| [Ir(thpy)2(4)]+ | 2.24 | 2.33 | 642 |
Calculations therefore found that 3LC triplets are lower in energy than the HOMO → LUMO 3MLCT/3LLCT triplet. This energy ordering is due to solvent effects that stabilize in a higher degree the 3LC states due to their higher polarity. For instance, the dipole moment of complex [Ir(thpy)2(2)]+ in its ground state is 12.70 D and is mainly preserved in passing to the 3LC states (12.04 D) because these states imply no special charge transfer. In contrast, it strongly decreases in passing to the 3MLCT/3LLCT triplet (3.08 D) because the charge transfer largely compensates the charge separation in S0. As a consequence, in a polar solvent like acetonitrile, the 3LC triplets are stabilized in a larger degree compared to the 3MLCT/3LLCT triplet and they become the lowest-energy triplets. Emission is therefore expected to take place from the 3LC triplets.
The 3LC nature predicted for the lowest-energy triplets is in agreement with the structured emission band observed in solution at room temperature (Fig. 8) and justifies the low quantum yields measured experimentally (Table 2). To estimate the emission energy, the vertical energy difference between the emitting 3LC triplet T1 and S0 was determined by performing a single-point calculation of S0 at the optimized minimum-energy geometry of the triplet. Calculations lead to similar vertical emission energies of ∼1.90 eV (641–652 nm, Table 4) because emission mainly originates from the cyclometallated ligands, which are identical for all the complexes. The theoretical values are in good accord with the experimental emission maxima recorded for [Ir(thpy)2(1)]+ (646 nm) and [Ir(thpy)2(4)]+ (640 nm), but give no explanation for the blue shift experimentally observed for [Ir(thpy)2(2)]+ and [Ir(thpy)2(3)]+ that exhibit emission maxima around 550 and 590 nm (Table 2). Since these spectral components are also observed in the spectra of [Ir(thpy)2(1)]+ and [Ir(thpy)2(4)]+ (Fig. 8), the different shape of the emission spectra is, in principle, assigned to the different intensity of the vibronic features forming the emission band.
Thin-film photophysical behaviour and electroluminescence
The photophysical properties of cationic iridium complexes are known to differ significantly as a function of the environment. Hence, thin films of the [Ir(thpy)2(N^N)][PF6] complexes were prepared using two different approaches. In the first approach, the complexes were dispersed in a poly(methyl methacrylate) (PMMA) matrix at a concentration of 5% by weight. The second approach mimics the typical thin film configuration used as the light-emitting layer in LECs. It mainly consists of the complex diluted with a small fraction of the ionic liquid (IL) 1-butyl-3-methylimidazolium hexafluoridophosphate [BMIM][PF6] in a 4:1 molar ratio.
The photoluminescence spectra of the complexes in the PMMA films are depicted in Fig. 11 and the emission maxima are given in Table 2. They are significantly different from the photoluminescence spectra obtained in acetonitrile solution, at least in the case of the complexes with N^N = 1 and 4. In thin film, the emission spectra are very similar for all four complexes. All present two emission peaks around 545 and 590 nm and a shoulder around 640 nm that are reminiscent of the features observed in solution (Fig. 8 and Table 2). In view of this distinct difference, the low temperature photoluminescence spectra of the complexes in acetonitrile solution were also determined. The spectra were recorded in a special cell immersed in liquid nitrogen. At this temperature acetonitrile is frozen and the complexes are in a rigid solid-state environment.
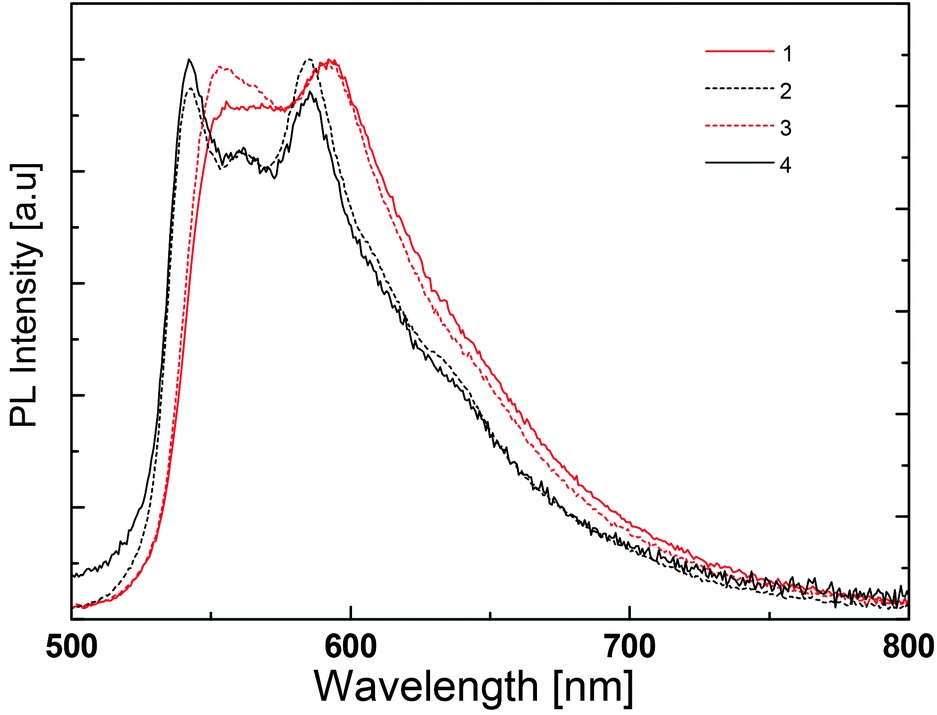 | ||
| Fig. 11 Normalized emission spectra of thin PMMA films containing 5 wt% of [Ir(thpy)2(N^N)][PF6] (N^N = 1–4). | ||
At low temperature, the photoluminescence spectra do not show much difference from one complex to another, except for the small red shift recorded for complexes with N^N = 1 and 3 (Fig. 12). Indeed, this shift is observed in the spectra in PMMA films (Fig. 11) and may be related to the intramolecular phenyl–phenyl stacking in these complexes.
 | ||
| Fig. 12 Normalized emission spectra of liquid nitrogen cooled MeCN solutions of [Ir(thpy)2(N^N)][PF6] (N^N = 1–4). | ||
The low temperature spectra show much more detail and there are emission features at wavelengths of 540–550 nm and 585–590 nm that correspond to those observed at room temperature. There is also a small emission peak around 640–650 nm, very close to the maximum wavelength of the photoluminescence of the complexes with N^N = 1 and 4 in solution at room temperature. These findings and the absence of a rigidochromic shift in the emission spectra upon cooling indicate (i) an emitting triplet state with mainly 3LC character, as predicted by theoretical calculations (see above), and (ii) very similar emission properties for all four complexes. The highly structured shape of the emission band reveals two well-defined vibronic progressions, both about 1400 cm−1, for the four complexes.
The red shift observed in the room-temperature solution spectra of complexes with N^N = 1 and 4 is therefore attributed to a different intensity distribution of the vibronic components that define the emission band. The main difference of these complexes is the absence of the tBu groups on the ancillary ligand. These side groups are slightly electron-donating, but also make the complexes more soluble and less likely to pack closely.
The photoluminescence and electroluminescence performance of the complexes in a thin film configuration typically used in LECs was finally examined. In this configuration, the photoluminescence quantum yield is very low and only noisy spectra could be obtained. They were, however, very similar to the electroluminescence spectra depicted in Fig. 13, which exhibit an identical shape for the four complexes with emission maxima around 600 nm. Hence, all complexes yielded electroluminescence when driven using a block-wave pulsed current (Javg = 100 A m−2, duty cycle 1000 Hz).
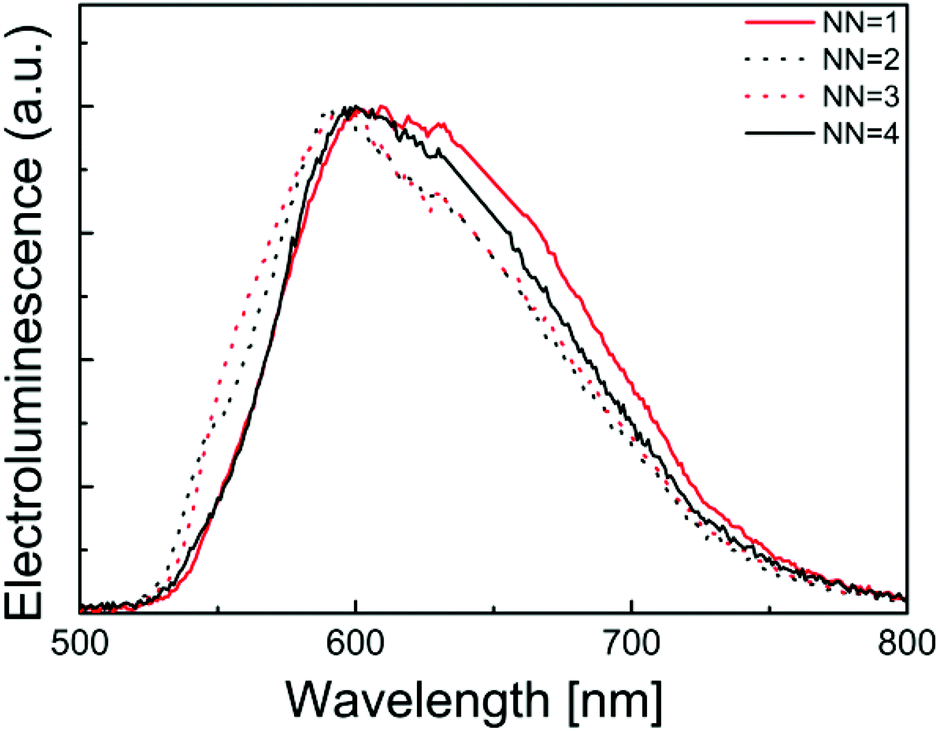 | ||
| Fig. 13 Normalized electroluminescence spectra of LECs containing [Ir(thpy)2(N^N)][PF6] (N^N = 1–4). | ||
Table 5 summarizes the performance data for LECs built up using the [Ir(thpy)2(N^N)][PF6] (N^N = 1–3) complexes. Compared to other recently reported LECs, these performances are not very high. In fact LECs using complex 4 had such low performances that only the electroluminescence spectra could be obtained. Hence, these complexes are very interesting emitters with good photoluminescent quantum yields in thin film but they do not lead to efficient LECs. This is primarily due to the poor charge transport of electrons and holes that limits the current density and the luminance and is most likely also responsible for the poor lifetimes.
:1/Al LEC devices driven using a pulsed current mode (average current density 100 A m−2, 1000 Hz, 50% duty cycle, block wave) for [Ir(thpy)2(N^N)][PF6] (N^N = 1, 2 and 3)
| Complex |
t
ona/h |
L
maxb/cd m−2 |
t
1/2c/h |
Efficiency/cd A−1 | EQEd/% |
|---|---|---|---|---|---|
| a Defined as the time to reach the maximum luminance. b Maximum luminance. c Time to reach half of the maximum luminance. d External quantum efficiency. | |||||
| [Ir(thpy)2(1)]+ | 4.2 | 19 | 101 | 0.2 | 0.2 |
| [Ir(thpy)2(2)]+ | Seconds | 33 | 0.04 | 0.2 | <0.1 |
| [Ir(thpy)2(3)]+ | 0.4 | 50 | 9.7 | 0.5 | 0.2 |
Conclusions
Four new iridium(III) complexes [Ir(thpy)2(N^N)][PF6] with N^N = 1–4 have been prepared and fully characterized. At room temperature, structured photoluminescence spectra are observed for [Ir(thpy)2(2)][PF6] and [Ir(thpy)2(3)][PF6], both in solution and in diluted thin film with values of λemmax in the range 542–592 nm. In contrast, the solution spectra of [Ir(thpy)2(1)][PF6] and [Ir(thpy)2(4)][PF6] are red-shifted and the band shape significantly changes on going from solution to thin film. The similar structured emission observed in thin film for the four complexes can be understood in terms of the 3LC nature, involving the cyclometallated [thpy]− ligands, predicted for the lowest-energy triplet states using DFT/TD-DFT calculations. This is supported by the appearance of the low temperature photoluminescence spectra of the complexes recorded in frozen MeCN, for which no rigidochromic shift is recorded compared to room temperature. The red shift observed for the solution spectra of [Ir(thpy)2(1)]+ and [Ir(thpy)2(4)]+ is assigned to a different intensity distribution of the vibronic components that define the emission band. The photoluminescence and electroluminescence characteristics of the complexes in LECs configuration have been investigated. The electroluminescence emission maxima are close to 600 nm for all the complexes, but the device performances are relatively poor, probably due to poor charge transporting properties of the complexes.Acknowledgements
We thank the Swiss National Science Foundation, the University of Basel, the Swiss Nanoscience Institute, the National Centre of Competence in Research “Nanoscale Science”, the Spanish Ministry of Economy and Competitiveness (MINECO) (MAT2011-24594, CTQ2012-31914 and Consolider-Ingenio CSD2007-00010), the Generalitat Valenciana (PROMETEO/2012/053), the European Union (CELLO, STRP 248043; https://www.cello-project.eu/) and the European Research Council (Advanced Grant 267816 LiLo) for financial support. D.T. and A.P. acknowledge the support of an FPU and an FPI grant of the Spanish Ministry of Education, Culture and Sport (MECD) and MINECO, respectively. Nik Hostettler is thanked for recording NMR spectra.Notes and references
- L. He, L. Duan, J. Qiao, D. Zhang, L. Wang and Y. Qiu, Appl. Phys. A, 2010, 100, 1035 CrossRef CAS.
- R. D. Costa, E. Ortí, H. J. Bolink, F. Monti, G. Accorsi and N. Armaroli, Angew. Chem., Int. Ed., 2012, 51, 8178 CrossRef CAS PubMed.
- Q. Pei, G. Yu, C. Zhang, Y. Yang and A. J. Heeger, Science, 1995, 269, 1086 CrossRef CAS PubMed.
- J. D. Slinker, J. Rivnay, J. S. Moskowitz, J. B. Parker, S. Bernhard, H. D. Abruña and G. G. Malliaras, J. Mater. Chem., 2007, 17, 2976 RSC.
- T. Hu, L. He, L. Duan and Y. Qiu, J. Mater. Chem., 2012, 22, 4206 RSC.
- J. D. Slinker, A. A. Gorodetsky, M. S. Lowry, J. Wang, S. Parker, R. Rohl, S. Bernhard and G. G. Malliaras, J. Am. Chem. Soc., 2004, 126, 2763 CrossRef CAS PubMed.
- F. Dumur, D. Bertin and D. Gigmes, Int. J. Nanotechnol., 2012, 9, 377 CrossRef CAS.
- J. D. Slinker, J. A. DeFranco, M. J. Jaquith, W. R. Silveira, Y. Zhong, J. M. Moran-Mirabal, H. G. Graighead, H. D. Abruña, J. A. Marohn and G. G. Malliaras, Nat. Mater., 2007, 6, 894 CrossRef CAS PubMed.
- P. Matyba, K. Maturova, M. Kemerink, N. D. Robinson and L. Edman, Nat. Mater., 2009, 8, 672 CrossRef CAS PubMed.
- S. Reenen van, P. Matyba, A. Dzwilewski, R. A. J. Janssen, L. Edman and M. Kemerink, J. Am. Chem. Soc., 2010, 132, 13776 CrossRef PubMed.
- M. Lenes, G. García-Belmonte, D. Tordera, A. Pertegás, J. Bisquert and H. J. Bolink, Adv. Funct. Mater., 2011, 21, 1581 CrossRef CAS.
- Q. Pei, Y. Yang, G. Yu, C. Zhang and A. J. Heeger, J. Am. Chem. Soc., 1996, 118, 3922 CrossRef CAS.
- K. A. McGee and K. R. Mann, Inorg. Chem., 2007, 46, 7800 CrossRef CAS PubMed.
- M. G. Colombo, T. C. Brunold, T. Riedener, H. U. Güdel, M. Förtsch and H.-B. Bürgi, Inorg. Chem., 1994, 33, 545 CrossRef CAS.
- F. Neve, M. Ghedini and A. Crispini, J. Organomet. Chem., 1994, 466, 259 CrossRef CAS.
- M. Bandini, M. Bianchi, G. Valenti, F. Piccinelli, F. Paolucci, M. Monari, A. Umani-Ronchi and M. Marcaccio, Inorg. Chem., 2010, 49, 1439 CrossRef CAS PubMed.
- A. Tsuboyama, H. Iwawaki, M. Furugori, T. Mukaide, J. Kamatani, S. Igawa, T. Moriyama, S. Miura, T. Takiguchi, S. Okada, M. Hoshino and K. Ueno, J. Am. Chem. Soc., 2003, 125, 12971 CrossRef CAS PubMed.
- M. S. Lowry, W. R. Hudson, R. A. Pascal Jr. and S. Bernhard, J. Am. Chem. Soc., 2004, 126, 14129 CrossRef CAS PubMed.
- S. Graber, K. Doyle, M. Neuburger, C. E. Housecroft, E. C. Constable, R. D. Costa, E. Ortí, D. Repetto and H. J. Bolink, J. Am. Chem. Soc., 2008, 130, 14944 CrossRef CAS PubMed.
- H. J. Bolink, E. Coronado, R. D. Costa, E. Ortí, M. Sessolo, S. Graber, K. Doyle, M. Neuburger, C. E. Housecroft and E. C. Constable, Adv. Mater., 2008, 20, 3910 CrossRef CAS.
- R. D. Costa, E. Ortí, H. J. Bolink, S. Graber, C. E. Housecroft, M. Neuburger, S. Schaffner and E. C. Constable, Chem. Commun., 2009, 2029 RSC.
- R. D. Costa, E. Ortí, H. J. Bolink, S. Graber, C. E. Housecroft and E. C. Constable, J. Am. Chem. Soc., 2010, 132, 5978 CrossRef CAS PubMed.
- R. D. Costa, E. Ortí, H. J. Bolink, S. Graber, C. E. Housecroft and E. C. Constable, Adv. Funct. Mater., 2010, 20, 1511 CrossRef CAS.
- E. Baranoff, H. J. Bolink, E. C. Constable, M. Delgado, D. Häussinger, C. E. Housecroft, M. K. Nazeeruddin, M. Neuburger, E. Ortí, G. E. Schneider, D. Tordera, R. M. Walliser and J. A. Zampese, Dalton Trans., 2013, 42, 1073 RSC.
- M. Nonoyama, Bull. Chem. Soc. Jpn., 1979, 52, 3749 CrossRef CAS.
- T. Kauffmann, J. König and A. Woltermann, Chem. Ber., 1976, 109, 3864 CrossRef CAS.
- W. Lu, B.-X. Mi, M. C. W. Chan, Z. Hui, C.-M. Che, N. Zu and S.-T. Lee, J. Am. Chem. Soc., 2004, 126, 4958 CrossRef CAS PubMed.
- G.-J. ten Brink, I. W. C. E. Arends, M. Hoogenraad, G. Verspui and R. A. Sheldon, Adv. Synth. Catal., 2003, 345, 497 CrossRef CAS.
- Bruker Analytical X-ray Systems, Inc., APEX2, version 2 User Manual, M86-E01078, Madison, WI, 2006 Search PubMed.
- G. M. Sheldrick, Acta Crystallogr., Sect. A: Fundam. Crystallogr., 2008, 64, 112 CrossRef CAS PubMed.
- I. J. Bruno, J. C. Cole, P. R. Edgington, M. K. Kessler, C. F. Macrae, P. McCabe, J. Pearson and R. Taylor, Acta Crystallogr., Sect. B: Struct. Sci., 2002, 58, 389 CrossRef PubMed.
- C. F. Macrae, I. J. Bruno, J. A. Chisholm, P. R. Edgington, P. McCabe, E. Pidcock, L. Rodriguez-Monge, R. Taylor, J. van de Streek and P. A. Wood, J. Appl. Crystallogr., 2008, 41, 466 CrossRef CAS.
- M. J. Frisch, G. W. Trucks, H. B. Schlegel, G. E. Scuseria, M. A. Robb, J. R. Cheeseman, G. Scalmani, V. Barone, B. Mennucci, G. A. Petersson, H. Nakatsuji, M. Caricato, X. Li, H. P. Hratchian, A. F. Izmaylov, J. Bloino, G. Zheng, J. L. Sonnenberg, M. Hada, M. Ehara, K. Toyota, R. Fukuda, J. Hasegawa, M. Ishida, T. Nakajima, Y. Honda, O. Kitao, H. Nakai, T. Vreven, J. A. Montgomery Jr., J. E. Peralta, F. Ogliaro, M. Bearpark, J. J. Heyd, E. Brothers, K. N. Kudin, V. N. Staroverov, T. Keith, R. Kobayashi, J. Normand, K. Raghavachari, A. Rendell, J. C. Burant, S. S. Iyengar, J. Tomasi, M. Cossi, N. Rega, J. M. Millam, M. Klene, J. E. Knox, J. B. Cross, V. Bakken, C. Adamo, J. Jaramillo, R. Gomperts, R. E. Stratmann, O. Yazyev, A. J. Austin, R. Cammi, C. Pomelli, J. W. Ochterski, R. L. Martin, K. Morokuma, V. G. Zakrzewski, G. A. Voth, P. Salvador, J. J. Dannenberg, S. Dapprich, A. D. Daniels, Ö. Farkas, J. B. Foresman, J. V. Ortiz, J. Cioslowski and D. J. Fox, Gaussian 09, Revision C.01, Gaussian, Inc., Wallingford CT, 2010 Search PubMed.
- A. D. Becke, J. Chem. Phys., 1993, 98, 5648 CrossRef CAS.
- C. Lee, W. Yang and R. G. Parr, Phys. Rev. B: Condens. Matter, 1988, 37, 785 CrossRef CAS.
- M. M. Francl, W. J. Pietro, W. J. Hehre, J. S. Binkley, M. S. Gordon, D. J. Defrees and J. A. Pople, J. Chem. Phys., 1982, 77, 3654 CrossRef CAS.
- P. J. Hay and W. R. Wadt, J. Chem. Phys., 1985, 82, 299 CrossRef CAS.
- J. Tomasi and M. Persico, Chem. Rev., 1994, 94, 2027 CrossRef CAS.
- C. S. Cramer and D. G. Truhlar, Solvent Effects and Chemical Reactivity, Kluwer, Dordrecht, 1996, pp. 1–80 Search PubMed.
- J. Tomasi, B. Mennucci and R. Cammi, Chem. Rev., 2005, 105, 2999 CrossRef CAS PubMed.
- A. V. Marenich, C. J. Cramer and D. G. Truhlar, J. Phys. Chem. B, 2009, 113, 6378 CrossRef CAS PubMed.
- C. Janiak, J. Chem. Soc., Dalton Trans., 2000, 3885 RSC.
- See for example: F. Neve, A. Crispini, S. Campagna and S. Serroni, Inorg. Chem., 1999, 38, 2250 CrossRef CAS.
- A. M. Bünzli, H. J. Bolink, E. C. Constable, C. E. Housecroft, M. Neuburger, A. Pertegás and J. A. Zampese, Eur. J. Inorg. Chem., 2012, 3780 CrossRef.
- A. B. Tamayo, S. Garon, T. Sajoto, P. I. Djurovich, I. M. Tsyba, R. Bau and M. E. Thompson, Inorg. Chem., 2005, 44, 8723 CrossRef CAS PubMed.
- D. Tordera, A. M. Bünzli, A. Pertegás, J. M. Junquera-Hernández, E. C. Constable, J. A. Zampese, C. E. Housecroft, E. Ortí and H. J. Bolink, Chem.–Eur. J., 2013, 19, 8597 CrossRef CAS PubMed.
Footnote |
| † CCDC 949190–949192. For crystallographic data in CIF or other electronic format see DOI: 10.1039/c3dt52622d |
| This journal is © The Royal Society of Chemistry 2014 |